Article

Spatial-Temporal Characteristics of Arctic Summer Climate Comfort Level in the Context of Regional Tourism Resources from 1979 to 2019

1
Heilongjiang Province Key Laboratory of Geographical Environment Monitoring and Spatial Information Service in Cold Regions, Harbin Normal University, Harbin 150025, China
2
Institute of Geographic Sciences and Natural Resources Research, Chinese Academy of Sciences, Beijing 100101, China
3
Heilongjiang Meteorological Sciences Research Institute, Harbin 150030, China
*
Author to whom correspondence should be addressed.
Sustainability 2021, 13(23), 13056; https://doi.org/10.3390/su132313056
Submission received: 17 October 2021 / Revised: 14 November 2021 / Accepted: 18 November 2021 / Published: 25 November 2021
(This article belongs to the Special Issue Sustainability with Changing Climate and Extremes)

Abstract

:
In the context of global warming, a key scientific question for the sustainable development of the Arctic tourism industry is whether the region’s climate is becoming more suitable for tourism. Based on the ERA5-HEAT (Human thErmAl comforT) dataset from the European Center for Medium-range Weather Forecasts (ECMWF), this study used statistical methods such as climatic tendency rate and RAPS to analyze the spatial-temporal changes in Arctic summer climate comfort zones from 1979 to 2019 and to explore the influence of changes in climate comfort on Arctic tourism. The results showed the following: (1) With the increase in the Arctic summer temperature, the universal thermal climate index (UTCI) rose significantly from 1979 to 2019 at a rate of 0.457 °C/10a. There was an abrupt change in 2001, when the climate comfort changed from “colder” to “cool”, and the climate comfort has remained cool over the past decade (2010–2019). (2) With the increase in Arctic summer temperatures, the area assessed as “comfortable” increased significantly from 1979 to 2019 at a rate of 2.114 × 10⁵ km2/10a. Compared with the comfortable area in the 1980s, the comfortable area increased by 6.353 × 10⁵ km2 over the past 10 years and expanded to high-latitude and high-altitude areas, mainly in Kola Peninsula, Putorana Plateau, and Verkhoyansk Mountains in Russia, as well as the Brooks Mountains in Alaska. (3) With the increase in Arctic summer temperatures, the number of days rated comfortable on 30% of the grid increased significantly from 1979 to 2019 (maximum increase: 31 days). The spatial range of the area with a low level of comfortable days narrowed and the spatial range of the area with a high level of such days expanded. The area with 60–70 comfortable days increased the most (4.57 × 10⁵ km2). The results of this study suggest that global warming exerts a significant influence on the Arctic summer climate comfort level and provides favorable conditions for further development of regional tourism resources.

1. Introduction

According to the sixth assessment report of the Intergovernmental Panel on Climate Change (IPCC), the average global surface temperature has increased by 1.09 °C over the past century [1]. The report in the Arctic Climate Impact Assessment also pointed out that, in the context of global warming, climate change in the Arctic is mainly manifested in the melting of ice sheets in the Arctic, the continuous decrease in the volume of snow and frozen soil in the Northern Hemisphere, the frequent occurrence of extreme weather events, and the significant changes in the ecosystem in the Arctic [2]. Accordingly, climate change turned into a severe environmental problem, and soon it will have significant impacts on our lives, our world, and also on tourism [3]. Climate change has affected the length and quality of the tourist season, the choice and consumption of tourist destinations, the decision making of tourist activities, and the operating costs of the tourism industry [4]. Climate change directly causes the redistribution of tourist flows, geographically and seasonally, and climatic conditions that are attractive to tourists may shift to high latitudes and high altitudes [5]. Climate change also indirectly affects tourism by causing water shortages, floods, deterioration of water quality, changes in natural landscapes, reduction in biodiversity, forest fires, and spread of diseases [6,7]. Global warming could lead to the spatial-temporal redistribution of climate comfort [8]. The Arctic is the highest latitude region of the Northern Hemisphere, as well as a region sensitive to global climate change [9]. The heating rate of the Arctic is twice that of the global average [10]; thus, analyzing the characteristics of climate change in the Arctic is of great significance for the development of Arctic tourism resources.
In recent years, tourism in high-latitude regions has become increasingly popular. For instance, the number of tourists in Greenland increased from 26,410 in 1999 to 57,223 in 2008, which was equivalent to the total population of Greenland [11]. The number of summer tourists to Alaska also increased significantly [12]. The average annual growth rate in the number of tourists in Iceland has doubled over the past few years [13]. The increase in the climate comfort level in Norway has led to a huge increase in summer tourism; the number of tourists in the Svalbard Islands, for example, has quadrupled [14]. This significant increase in the number of tourists indicates that the climate comfort level in the Arctic has improved due to global warming, and the need to carry out quantitative studies on these changes is urgent. Roshan et al. [15] used the physiologically equivalent temperature (PET) to identify and evaluate bioclimatic conditions of 40 meteorological stations in Iran. It showed that Iran’s comfortable days transferred to early spring and late autumn and an increase in the frequency of thermal comfort condition was observed in almost half of the stations. Roshana et al. [16] also used stations data to show that both SET, PET, and UTCI increased in Iran from 1995 to 2014. Eludoyin et al. [17] have examined the variations in the thermal condition of Nigeria in terms of the temperature, relative humidity, effective temperature (ET), temperature–humidity index (THI), and relative strain index (RSI) and concluded that thermal stress has increased in Nigeria from 2000 at most stations, especially in the south and north-western regions. Feng et al. [18] used the improved classic THI model to analyze the spatiotemporal evolution of annual and monthly average climate comfort in China from 2005 to 2018. The results showed that the annual average comfort level in China changed from cold to comfortable. Wu et al. [19] used 591 stations data to calculate the change of China’s climate comfort index values between 1966 and 2016 and came to the same conclusion. In China, the climate comfort levels in high-altitude regions, plateaus, and mountains have improved significantly [20,21,22,23,24]. Zeng et al. [25] investigated the spatial and temporal variations of the universal thermal climate index (UTCI) of the China–Pakistan Economic Corridor (CPEC) from 1979 to 2018 and concluded that the UTCI generally exhibited a positive trend of 0.33 °C/10a over the past 40 years, and the seasonal variation characteristics of the UTCI showed an upward trend in all four seasons. The tourist comfort zone in North America moved from low altitude to high altitude and from low latitude to high latitude [26]. For example, southern Florida, Arizona, and particularly Mexico have decreased the warm tourist season and Canada, Georgia, and South Carolina have extended the warm tourist season. Alaska’s tourist season also extended, which now starts 10 days earlier than in the 1940s [20]. Some scholars have analyzed the thermal comfort in different regions of Europe. Napoli et al. have assessed the thermal bioclimate of Europe for the summer season and concluded that an increase in heat stress up to 1 °C was observed from 1979 to 2016 [27]. Some scholars pointed out that southern Europe (Crete Island in Greece, Eastern Mediterranean, Athens, Madrid (Spain), Novi Sad (Vojvodina, Northern Serbia)) were under high temperature and pressure, and climate warming has led to a significant increase in the frequency and duration of high-temperature heat waves in southern Europe and a decline in climate comfort [28,29,30,31,32,33,34,35]. In central Europe, climate change has led to an increase in the number of strong and very strong heat stress days in Poland [36]. Tourists from Germany, Ireland, and the UK would spend more holidays in their home country, and the tourism of Ireland and Britain has moved north [37]. In northern Europe, warming has increased the length of nature and wilderness tourism and the “midnight sun” season in Finland and Sweden [5], and increased comfort in Norway has led to an increase in summer visitors [14]. Climate change could considerably enhance northwestern Europe’s comfort level [38,39]. It can be seen that climate changes have led to the redistribution of tourism climate resources in time and space. The existing studies are mostly based on station data analysis, with lower spatial resolution. The area of study is mostly concentrated on the low and middle latitudes of the Northern Hemisphere, but little attention has been paid to the changes in comfort level in the Arctic, where there have been the highest rates of temperature increase.
The climate comfort index, which is widely used in public health, urban planning, tourism, and leisure, is an important index for quantifying the climatic suitability of tourism destinations [40] and as a basis for studying the effect of climate change on tourism [41]. With the measurement of the environment variables, direct indices were initially drawn by the researchers. Including wet-bulb temperature [42], Kata temperature [43], wet-bulb globe temperature (WBGT) [44], temperature–humidity index (THI) [45], effective temperature (ET) [46], and wind chill index (WCI) [47], direct indices were widely used because they are simple and easy to use. As the study of climate comfort went further, the researchers realized that besides environmental factors such as temperature and humidity, behavioral variables such as metabolic rate and the thermal insulation and moisture permeability of clothing that affected the heat comfort should also be considered [48]. Thus, some researchers raised experiential indices, such as the predicted four-hour sweat rate (P4SR), that included the behavioral variables [49]. Because of the lack of the scientific simulation of human response in experiential indices, thermodynamic theorem was used to simulate the heat exchange between the human body and environment, by which climate comfort indices such as physiological equivalent temperature (PET) [50] and the universal thermal climate index (UTCI) were raised. Comparing with the PET index, the environmental and behavioral factors that affected the climate comfort indices were more fully considered in the UTCI. The human multi-joint reaction to the external environment was in the model of climate comfort index to simulate the dynamic physiological response of the pedestrian and construct the thermal stress index the human body accepted during exposure outdoors. According to the thermal stress index, the UTCI is divided into 10 comfort levels from hot to cold [51]. The UTCI is considered the most advanced, comprehensive, and universal human comfort index [52,53], and it is applicable to various climates, seasons, temporal, and spatial scales, as well as being widely used in urban zoning and tourism planning [54,55]. The ERA5-HEAT (Human thErmAl comforT) dataset from the European Center for Medium-range Weather Forecasts (ECMWF) was used in this study. The objectives of the present study were to (1) determine the spatial pattern of Arctic summer climate comfort, (2) reveal the spatial-temporal characteristics of Arctic summer climate comfort, and (3) discuss the influence of climate change on Arctic summer climate comfort. It provides a scientific basis for sustainable development of tourism in the region.

2. Materials and Methods

2.1. Study Area

In this study, 800 km2 of the northern land in the Arctic Circle (66°34′ N) was taken as the study area, including parts of Greenland (territory of Denmark), Canada, Alaska (the United States), Russia, Norway, Sweden, Finland, and Iceland. Located in the North Frigid Zone, the study area is covered by sea ice year-round and experiences polar weather (Figure 1). The average temperature in the coldest month reaches −40 °C–−20 °C, so the area is an important cold source for the world. The weather is characterized by a long, extreme cold winter, and a short, cool summer; the annual average precipitation is 100–250 mm, which reaches 500 mm in the Greenland sea area, and summer precipitation is usually in the form of rain. Due to its climate characteristics, the Arctic region has unique tourism resources, and current tourism in the region mainly focuses on glaciers, auroras, gorges, endemic species, skiing, underwater diving, and boating on the ice sea.

2.2. Datasets

1. Thermal comfort data: The climate comfort data were drawn from the ERA5-HEAT dataset of ECMWF from 1979 to the present, with a spatial resolution of 0.25° × 0.25° and a time interval of one hour. The UTCI from 1979 to 2019 was analyzed in this study, and the data were downloaded from the ERA5-HEAT website Available online: https://cds.climate.copernicus.eu/cdsapp#!/dataset/ (accessed on 28 May 2020). According to the thermal physiological response of the human body, the UTCI thermal stress was divided into 10 levels (Table 1).
2. Arctic climate data: To analyze the climate background of the changes in Arctic comfort and analyze the changing factors of the UTCI, we chose temperature, wind speed, relative humidity, and sunshine duration for the analysis. These climate elements were obtained from the ERA5 dataset. Again, the time range drawn from ERA5 was from 1979 to the present, the spatial resolution was 0.25° × 0.25°, and the time interval was one hour. The temperature and wind speed data were used directly, whereas the sunshine duration and relative humidity required further processing: sunshine duration was replaced by total cloud cover (TCC) [56] and relative humidity was calculated by the average temperature and dew-point temperature. The specific equation is as follows:
f = E E W × 100 %
E = 6.11 e x p 5417.753 { ( 1 / 273.16 ) [ 1 / ( 273.16 + T d ) ] }
E w = 6.11 e x p 5417.753 { ( 1 / 273.16 ) [ 1 / ( 273.16 + T ) ] }
where f is relative humidity, E is actual vapor pressure, Ew is saturated vapor pressure, Td is dew point, and T is temperature.

2.3. Methods

2.3.1. Trend Analysis Method

A univariate linear regression equation of the cold region area variable (y) and the corresponding time (x) was established:
  y = a x + b           i = 1 , 2 , , n
where a is the linear regression coefficient indicating the rate of change in the spatial extent of the cold region. The positive or negative value of a indicates that the spatial extent of the cold region is increasing or decreasing over time. The positive value of a indicates the spatial extent of cold region is increasing while the negative value of a indicates the spatial extent of cold region is decreasing.

2.3.2. Rescaled Adjusted Partial SUMS (RAPS) Method

The rescaled adjusted partial sums (RAPS) visualization approach can be used for preliminary visual inspection of a time series, to gain a feel for the data, and/or to guide and focus subsequent statistical tests and analyses [57]. The RAPS of the Xk are defined as follows:
X k = t = 1 k Y t - Y ¯ S Y ; k = 1 , , n
where Y = [Yt; t = 1, …, n] represent a time series of a climatic variable, Y ¯ is sample mean, SY2 is variance, n is number of values in the time series, and k is counter limit of the current summation.

2.3.3. Correlation Analysis

Correlation analysis is a statistical method used to discover if there is a relationship between two variables/datasets, and the relatedness and negative/positive correlation of this relationship. The Pearson correlation method is adopted in this paper to analyze the relationship between comfortable area, comfortable days, and climate indicators, quantitatively. In each pair, the Pearson’s correlation coefficient (r) is calculated as:
r = i = 1 n x i x ¯ y i y ¯ i = 1 n x i x ¯ 2 i = 1 n y i y ¯ 2
where x ¯ represents the average comfortable areas or days and y ¯ is the average of a given climate variable.
The study based on the UTCI data in the ERA5-HEAT dataset provided by ECMWF used MATLAB software for spatial data calculation and overlay analysis (Figure 2). We used the Pcolor function of MATLAB to achieve graphical visualization.

3. Results

3.1. Change of UTCI in the Arctic Summer (1979–2019)

The average UTCI value in the Arctic summer from 1979 to 2019 was 0.025 °C and the comfort level was “cool”. The UTCI value increased significantly at a rate of 0.457 °C/10a (p < 0.01), for a total increase of 1.874 °C, and the thermal stress level also increased (Figure 3a). The results of RAPS analysis showed (Figure 3b) that there was an obvious change in the UTCI value in the Arctic summer in 2000, which indicates that a transformation occurred in the comfort level in the early 21st century. The UTCI anomaly map (Figure 3c) also shows that the negative anomaly changed to a positive anomaly in the early 21st century (2001) and the UTCI changed from a relatively low value stage to a relatively high value stage. Further analysis reveals that the UTCI value was −0.501 °C and the comfort level was “colder” before the abrupt change (1979–2000). After the abrupt change (2001–2019), the UTCI value was 0.634 °C and the comfort level was “cool”, which indicates that there was an obvious change in the comfort level of the Arctic summer in the 21st century.

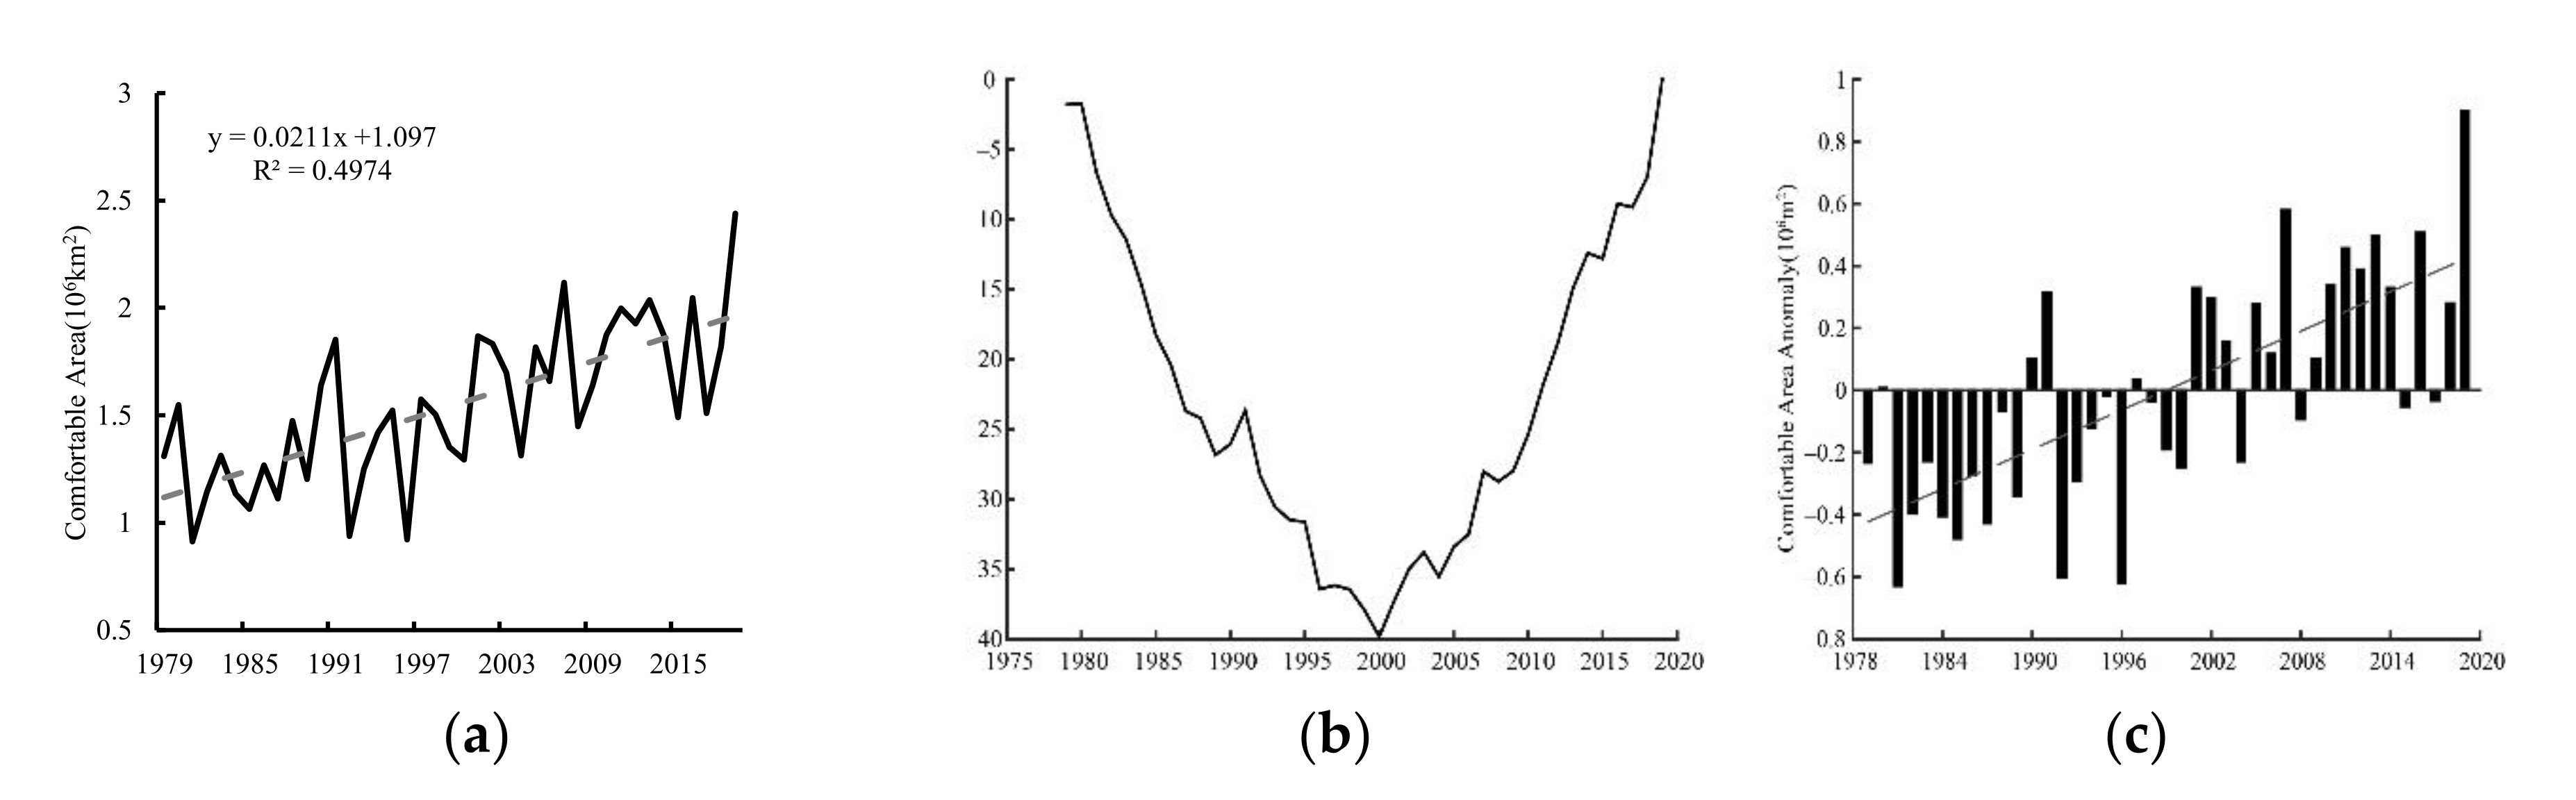
3.2. Change in the Area Rated “Comfortable” in the Arctic Summer

It can be seen from Section 3.1 that the spatial distribution of comfortable areas expanded with the increase in the UTCI value for the Arctic summer from 1979 to 2019 (Figure 4a). The area of summer comfortable zones in the Arctic from 1979 to 2019 was 1.541 × 10⁶ km2, covering 19.152% (i.e., nearly 1/5) of the total Arctic land area. The comfortable area in the decade before and after was 1.218 × 10⁶ and 1.864 × 10⁶ km2, respectively. The summer comfortable area was largest in 2019, at 2.44 × 10⁶ km2, and smallest in 1996, at only 0.921 × 10⁶ km2, with an annual variation coefficient of 23.304%. The increase rate for the summer comfortable area in the Arctic from 1979 to 2019 was 2.114 × 10⁵ km2/10a, which was significant (p < 0.01). The total increase area was 8.667 × 10⁵ km2, which indicates that the summer comfortable area in the Arctic has been expanding. The RAPS analysis results indicate (Figure 4b) that there was an obvious change in the size of the Arctic summer comfortable area in 2000, which was consistent with the change in the UTCI value. The comfortable area before and after the abrupt change was 1.307 × 10⁶ and 1.811 × 10⁶ km2, respectively. This finding was further verified by the area anomaly (Figure 4c), which indicates that there was a significant expansion in the Arctic summer comfortable area in the early 21st century.
The spatial distribution of the areas with different comfort levels in the Arctic over the past ten years was further analyzed (Figure 5). The Arctic summer comfortable area from 2010 to 2019 was 1.864 × 10⁶ km2, accounting for 23.2% of the Arctic land area. These comfortable areas were mainly distributed in Eurasia and North America (66.5°–70 °N), mid-eastern Russia, Norway, Sweden, and Finland in northern Europe, Alaska and the Yukon territory in Canada, as well as scattered areas along the coast of Greenland and islands of Canada, north of 70 °N (Figure 5a). Compared with the ten years from 1979 to 1988, the Arctic summer comfortable area increased by 6.353 × 10⁵ km2, accounting for 7.9% of the Arctic land area (Figure 5b). In terms of spatial distribution, the comfortable area mainly expanded to high-latitude and high-altitude regions (66.5°–70 °N) and, specifically, in the Kola Peninsula, Putorana Plateau, Verkhoyansk Mountains in Russia, and Brooks Mountains in Alaska (Figure 5c). It is, therefore, possible for tourism to be developed in the Arctic regions rated comfortable, especially those newly designated as comfortable. Sightseeing in gorges, fishing, and watching rare species can be carried out in the peninsula regions and adventures, such as polar mountain climbing and outdoor expeditions, can be developed in the mountainous and plateau regions.

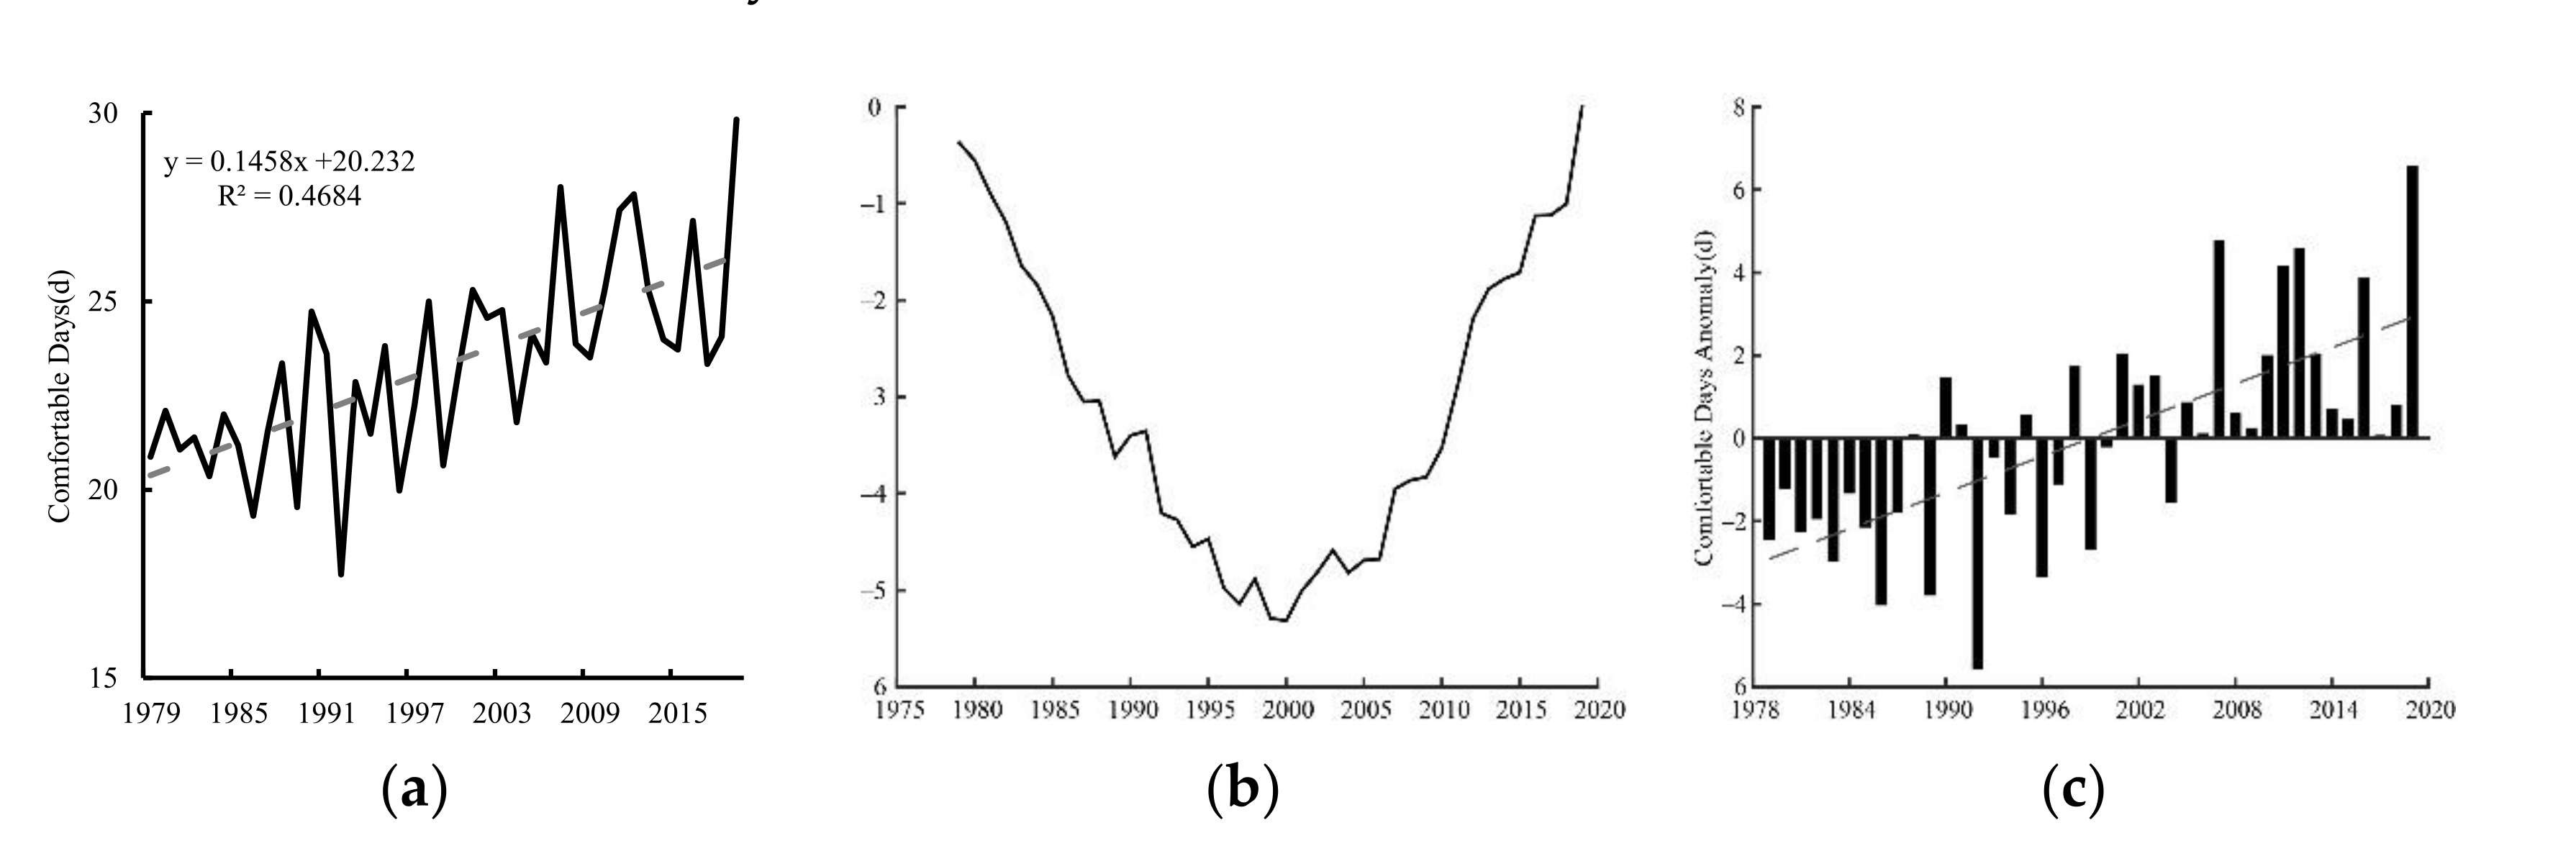
3.3. Change in the Number of Arctic Summer Comfortable Days from 1979 to 2019

There was an average of 23 Arctic summer days rated comfortable from 1979 to 2019, accounting for a quarter (25%) of the entire summer, while in the decade before and after there were 21 and 26 such days, respectively. The largest number of comfortable days was seen in 2019 (30 d), and the smallest was 18 d in 1992. The annual variation coefficient was 10.955%. The increase rate in comfortable days from 1979 to 2019 was 1.458 d/10a, which was significant (p < 0.01), and the total increase was 6 d, which indicates that the season for Arctic summer tourism activities has been significantly extended (Figure 6a). The RAPS analysis results showed that there was an obvious change in the number of comfortable days around 2000, which is consistent with the changes in UTCI values (Figure 6b). The number of comfortable days before and after the abrupt change was 22 d and 25 d, respectively. This finding was further verified by the anomaly of days (Figure 6c), indicating that a significant change occurred in the number of comfortable days in the early 21st century.
Figure 7 shows the spatial distribution of Arctic summer comfortable days from 1979 to 2019. The number of days in all grid cells rated comfortable has clearly been increasing, the area with a statistically significant increase accounted for 30% of the total Arctic area, and the increase rate ranged −1.972–7.498 d/10a. The largest increase in the number of comfortable days was in the Qeqertarsuaq region of western Greenland (31 d) and the second largest increase was in northern and eastern Siberia of Russia (8–24 d). The summer tourism seasons were extended in the areas with a large increase in the number of comfortable days, and the tourism structure could be adjusted appropriately to invest in tourism infrastructures to meet the needs created by this extension.
These Arctic summer comfortable days not only appear in the increase in grid cells but also in the change of space areas with the same level of comfortable days. Table 2 displays the area distribution of comfortable days at various frequency levels between the period of 1979–1988 and 2010–2019. The areas with 0–10, 10–20, 20–30, and 40–50 comfortable days decreased from 1979 to 1988 and from 2010 to 2019, with regions experiencing only 0–10 comfortable days declining most (by 2.96 × 10⁵ km2). Areas with 30–40, 50–60, 60–70, 70–80, and 80–90 comfortable days increased, with areas having 60–70 comfortable days increasing most (4.57 × 10⁵ km2).
In the past ten years (2010–2019), there was an average of 26 comfortable Arctic summer days, which were distributed in North America and Eurasia, excluding Greenland (Figure 8a). These basically followed a zonal distribution and gradually decreased with an increase in latitude. Mid-eastern Russia, northern Europe, Canada, and Alaska (66.5°–70 °N) had a large number of comfortable days (maximum: 90 d) and the regions north of 70 °N had a smaller number of comfortable days (average: 20 d), accounting for 21.74% of the Arctic summer. Compared with the early 1980s (Figure 8b), the number of comfortable days increased by 5 d.
In summary, there was an obvious increase in the range and number of comfortable days (between 10 d and 30 d) in the Arctic, which were mainly distributed in mid-eastern Russia (66.5°–70 °N), Greenland, and Ellesmere Island, north of 80 °N (Figure 8c). The increase in the number of comfortable days extends the summer tourism season in the Arctic, providing tourists more time to enjoy the natural scenery and creating the potential for higher economic benefits.

4. Discussion

As an area sensitive to global warming, the climate comfort level in the Arctic has changed with the warming climate, which has had positive effects on the regional tourism industry. Therefore, it is of great significance to study the changes in the areas of the Arctic that can be rated comfortable during the summer, with a particular focus on the influence of climate comfort level on tourism in the context of global warming. In this study, a quantitative analysis was carried out on the spatial-temporal evolution of the Arctic summer climate comfort zones from 1979 to 2019, as well as the influence of the change in the climate comfort levels on Arctic tourism. The results of this analysis may be helpful in optimizing the Arctic tourism industry, promoting the development of tourism destinations, and providing scientific and quantitative support for the development of Arctic tourism. The following aspects were discussed in this study.
Factors that influence the climate comfort level include temperature, relative humidity, wind speed, and sunshine duration. The relationship between meteorological elements and climate comfort level was analyzed based on the ERA5-HEAT dataset. Figure 9 shows the interannual changes in Arctic summer average temperature, relative humidity, wind speed, and TCC from 1979 to 2019, which had averages of 3.809 °C, 79.461%, 4.128 m/s, and 70.249%, respectively. The temperature rose significantly from 1979 to 2019 (p < 0.01), with a rate of 0.418 °C/10a and a total increase of 1.714 °C. The relative humidity, wind speed, and TCC fluctuated greatly, but the change was not significant (p > 0.05), which indicates that the temperature increase was the main climate change factor in the Arctic.
The correlation between the comfortable area and the number of comfortable days and various meteorological factors was also analyzed (Table 3). The comfortable area and number of days were positively correlated with the average temperature (p < 0.01) and negatively correlated with TCC; the positive correlation coefficient was much larger than the negative correlation coefficient. Thus, it appears that the comfortable area and days are mainly affected by the temperature and TCC, with the temperature being the main factor.
The spatial correlation coefficients between the number of comfortable days and temperature, relative humidity, wind speed, and TCC in the Arctic summer are analyzed (Figure 10). It showed that there are significant spatial correlations between comfortable days and temperature, relative humidity, wind speed, and TCC, which are basically distributed between 66.5–70 °N and can reach 80 °N in areas such as Canada’s Queen Elizabeth Islands and Ellesmere Island, indicating that the Arctic summer comfortable days of 66.5–70 °N is related to temperature, relative humidity, wind speed, and TCC. However, there are differences between different elements in the relevant regions. Statistics showed that the areas where summer comfortable days are significantly correlated with temperature, relative humidity, wind speed, and TCC are 5.719 × 10⁶, 3.24 × 10⁶, 3.974 × 10⁶, and 5.412 × 10⁶ km2, respectively. The average significant correlation coefficients are 0.776, −0.447, −0.506, and −0.609, respectively, indicating that the Arctic summer comfortable days have a more significant correlation with temperature, and temperature is the most important factor affecting summer climate comfort.
The spatial pattern of and change in climate comfort levels in the peri-Arctic nations and regions has been previously studied. For instance, the spatial pattern of the summer UTCI index in Russia from 2001 to 2015 was analyzed by Vinogradova et al. [58] based on data from 500 meteorological stations in Russia. The results showed that the comfortable zones were distributed in most areas of Russia in summer, and a moderate thermal stress level was observed in daytime in southern Europe. In a study by Yu et al., the hourly weather data from meteorological stations were used to calculate the modified climate index for tourism [20]. The authors suggested that the weather conditions in parts of regions in Alaska had improved greatly from 1942 to 2005, which extended the tourism season. Based on the temperature, precipitation, TCC, and visibility data, Forland et al. found that “warm” weather in Norway, north of the Arctic Circle, increased from 1981 to 2010, the summer tourism season was extended, and the improvement in the summer climate comfort level led to an increase in the number of tourists, quadrupling in the Svalbard Islands [14]. According to statistics, from 1990 to 2005, the annual growth rate of Iceland’s Arctic cruise tourists was 19.19%, from 7952 in 1990 to 266,070 in 2015, an increase of more than 30 times; in 2019, the number of overnight tourists in Greenland increased to 264,711 people, equivalent to 3.47 times the total population of the island; from 1996 to 2018, cruise tourism in Svalbard also increased greatly, and cruise tourists increased by 1.94 times [59]. These studies, to some extent, verify the findings of the present study, which showed that the Arctic summer comfortable zones have expanded and the tourism areas increased, while the number of comfortable days has significantly increased and the summer tourism season has been extended.
The results of this study showed that the Arctic summer comfortable zones have expanded and there are more comfortable days, which has created favorable conditions for tourism. In recent years, Norway, Iceland, Russia, and Canada have set up Arctic tourism routes and promoted the development of ecological tourism in the region [60]. The Arctic is the region least affected by human activities in the world, and unplanned or inadequate development of tourism resources could eventually lead to the degradation of the natural environment. Tourists are also likely to bring new species and germs into the region [61]. To achieve the sustainable development of Arctic tourism, the various countries involved should adhere to the concept of global integration and cooperate to complete legal systems for Arctic tourism development to ensure ecological balanced and sustainable growth in the region.

5. Conclusions

The average summer UTCI value in the Arctic was 0.025 °C from 1979 to 2019 and the comfort level was cool. The UTCI increased significantly at a rate of 0.457 °C/10a and there was an abrupt change in 2001. The Arctic summer comfort level changed from colder to cool after this abrupt change.
The average comfortable area in the Arctic summer from 1979 to 2019 was 1.541 × 10⁶ km2, accounting for a fifth of the Arctic land area. These comfortable zones were mainly distributed in mid-eastern Russia, Norway, Sweden, and Finland in northern Europe, as well as Alaska and the Yukon territory in Canada. The comfortable area increased significantly at a rate of 2.114 × 10⁵ km2/10a from 1979 to 2019. Compared with the 1980s, the comfortable area has increased by 6.353 × 10⁵ km2 in recent decades, mainly expanding to high-latitude and high-altitude regions, specifically distributed in the Kola Peninsula, Putorana Plateau, Verkhoyansk Mountains in Russia, and Brooks Mountains in Alaska.
The average number of Arctic summer comfortable days was 23 from 1979 to 2019, accounting for a quarter of the entire summer. These were distributed zonally and gradually decreased from low to high latitudes. The number of comfortable days increased significantly from 1979 to 2019, at a rate of 1.458 d/10a. Compared with the early 1980s, the number of comfortable days has increased by 5 d over the past decades. The range and number of summer comfortable days has increased significantly, and the largest number of comfortable days was seen in the Qeqertarsuaq region of western Greenland (31 d), while the area seeing 60–70 summer comfortable days expanded the most (by 4.57 × 10⁵ km2).
This study is only limited to the Arctic region and does not conduct a detailed analysis of the Northern Hemisphere or typical Arctic tourism cities. It has not conducted an in-depth study on how the Arctic climate comfort changes under the background of future climate change. It will be subject to special research in the future.
The improvement of Arctic summer climate comfort and the extension of suitable tourist seasons will enhance the attractiveness of Arctic tourist destinations while promoting the development and utilization of Arctic natural resources. Sightseeing in gorges, fishing, and watching rare species can be carried out in the peninsula regions and adventures, such as polar mountain climbing and outdoor expeditions, can be developed in the mountainous and plateau regions. Despite vigorously developing Arctic tourism activities, it is necessary to protect and manage Arctic tourism resources to ensure the sustainable development of Arctic tourism.

Author Contributions

Y.H. analyzed the data and drafted the manuscript; L.Z., D.Z. and X.Z. completed the manuscript and made major revisions; W.Z. completed data visualization; T.P. and C.R. downloaded data and searched references; Y.C. and Z.C. checked and proofread the manuscript. All authors have read and agreed to the published version of the manuscript.

Funding

This research was funded by National Natural Science Foundation of China (Grant No. 41771067. Supported by the National Key R&D Program of China (Grant No. 2017YFA0603301).

Institutional Review Board Statement

Not applicable.

Informed Consent Statement

Not applicable.

Data Availability Statement

The data presented in this study are available on request from the corresponding author.

Acknowledgments

Thanks to ECMWF for providing the ERA5-HEAT dataset.

Conflicts of Interest

The authors declare no conflict of interest.

References

  1. IPCC. 2021: Summary for Policymakers. In Climate Change 2021: The Physical Science Basis. Contribution of Working Group I to the Sixth Assessment Report of the Intergovernmental Panel on Climate Change; Cambridge University Press: Cambridg, UK, 2021. [Google Scholar]
  2. Chen, L.Q. Evidence of Arctic and Antarctic changes and their regulation of global climate change (further findings since the fourth IPCC assessment report released). Adv. Polar Sci. 2013, 25, 1–6. (In Chinese) [Google Scholar] [CrossRef]
  3. Semenza, J.C.; Ebi, K.L. Climate change impact on migration, travel, travel destinations and the tourism industry. J. Travel Med. 2019, 26, 1–13. [Google Scholar] [CrossRef] [Green Version]
  4. Lise, W.; Tol, R.S.J. Impact of climate on tourist demand. Clim. Chang. 2002, 55, 429–449. [Google Scholar] [CrossRef]
  5. Hall, C.M.; Saarinen, J. Polar Tourism: Definitions and Dimensions. Scand. J. Hosp. Tour. 2010, 10, 448–467. [Google Scholar] [CrossRef]
  6. Hansen, B.B.; Isaksen, K.; Benestad, R.E.; Kohler, J.; Pedersen, A.Ø.; Loe, L.E.; Coulson, S.J.; Larsen, J.O.; Varpe, Ø. Warmer and wetter winters: Characteristics and implications of an extreme weather event in the High Arctic. Environ. Res. Lett. 2014, 9, 114021. [Google Scholar] [CrossRef]
  7. Hall, C.M.; Baird, T.; James, M.; Ram, Y. Climate change and cultural heritage: Conservation and heritage tourism in the Anthropocene. J. Herit. Tour. 2016, 11, 10–24. [Google Scholar] [CrossRef]
  8. Scott, D.; Wall, G.; McBoyle, G. Chapter 7. Climate Change and Tourism and Recreation in North America: Exploring Regional Risks and Opportunities. In Tourism, Recreation and Climate Change; Hall, C.M., Higham, J., Eds.; Channel View Publications: Blue Ridge Summit, PA, USA; Bristol, UK, 2005; Volume 22, pp. 115–129. [Google Scholar] [CrossRef]
  9. Yu, W.Y.; Wang, L.; Feng, Z.G.; Zhang, C.Y. Bibliometric analysis and development trends of global Arctic marine scientific research. Mar. Sci. 2018, 42, 64–81. (In Chinese) [Google Scholar]
  10. Notz, D.; Stroeve, J. Observed Arctic sea-ice loss directly follows anthropogenic CO2 emission. Science 2016, 354, 747–750. [Google Scholar] [CrossRef] [Green Version]
  11. Fay, G.; Karlsdóttir, A. Social indicators for arctic tourism: Observing trends and assessing data. Polar Geogr. 2011, 34, 63–86. [Google Scholar] [CrossRef]
  12. Suzanne, D.L.B.; Maher, P.; Dawson, J.; Hillmer-Pegram, K.; Huijbens, E.; Lamers, M.; Liggett, D.; Müller, D.; Pashkevich, A.; Stewart, E. Tourism and Arctic Observation Systems: Exploring the relationships. Polar Res. 2016, 35, 24980. [Google Scholar] [CrossRef] [Green Version]
  13. Stephen, K. Societal Impacts of a Rapidly Changing Arctic. Curr. Clim. Chang. Rep. 2018, 4, 223–237. [Google Scholar] [CrossRef] [Green Version]
  14. Forland, E.J.; Jacobsen, J.; Denstadli, J.M.; Lohmann, M.; Hanssen-Bauer, I.; Hygen, H.O.; Tommervik, H. Cool weather tourism under global warming: Comparing arctic summer tourists’ weather preferences with regional climate statistics and projections. Tour. Manag. 2013, 36, 567–579. [Google Scholar] [CrossRef]
  15. Roshan, G.; Yousefi, R.; Kovacs, A.; Matzarakis, A. A comprehensive analysis of physiologically equivalent temperature changes of Iranian selected stations for the last half century. Theor. Appl. Climatol. 2018, 131, 19–41. [Google Scholar] [CrossRef] [Green Version]
  16. Roshan, G.; Yousefi, R.; Błażejczyk, K. Assessment of the climatic potential for tourism in Iran through biometeorology clustering. Int. J. Biometeorol. 2017, 62, 525–542. [Google Scholar] [CrossRef] [PubMed]
  17. Eludoyin, O.; Adelekan, I.; Webster, R.; Eludoyin, A. Air temperature, relative humidity, climate regionalization and thermal comfort of Nigeria. Int. J. Climatol. 2014, 34, 2000–2018. [Google Scholar] [CrossRef] [Green Version]
  18. Feng, L.; Liu, Y.X.; Feng, Z.Z.; Yang, S.Q. Analysing the spatiotemporal characteristics of climate comfort in China based on 2005–2018 MODIS data. Theor. Appl. Climatol. 2021, 143, 1235–1249. [Google Scholar] [CrossRef]
  19. Wu, F.F.; Yang, X.H.; Shen, Z.Y.; Yi, Z.J. Long-term trends and spatiotemporal variations of climate comfort in China during 1966–2016. Therm. Sci. 2020, 24, 2445–2453. [Google Scholar] [CrossRef]
  20. Yu, G.; Schwartz, Z.; Walsh, S. Effects of climate change on the seasonality of weather for tourism in Alaska. Arctic 2009, 62, 443–457. [Google Scholar] [CrossRef]
  21. Yu, Z.K.; Sun, G.N.; Feng, Q.; Luo, Z.W. Spatiotemporal dynamic analysis of tourism climate comfort and climate risk in the Tibetan Plateau. Resour. Sci. 2014, 36, 2327–2336. (In Chinese) [Google Scholar]
  22. Jin, A.Q.; Zhang, A.; Zhao, X.Y. Prediction of future climate comfort in eastern China under climate change scenario. Acta Sci. Nat. Univ. Pekin. 2019, 55, 887–898. (In Chinese) [Google Scholar]
  23. Shi, L.; Huang, X.Q.; Ni, M.J.; Ci, R.Y.Z.; Luo, Z. Analysis on the adaptability of tourism climate in Tibet Autonomous Region. J. Glaciol. Geocryol. 2015, 37, 1412–1419. (In Chinese) [Google Scholar]
  24. Sun, Y.C.; Wang, S.Y.; Li, H.; Zheng, G.F.; Wang, F.; Guan, J.D. Climate comfort analysis of summer tourism in Liu Pan Mountain Area of Ningxia. J. Arid Meteorol. 2018, 36, 1035–1042. (In Chinese) [Google Scholar]
  25. Zeng, D.; Wu, J.; Mu, Y. Spatial-Temporal Pattern Changes of UTCI in the China-Pakistan Economic Corridor in Recent 40 Years. Atmosphere 2020, 11, 858. [Google Scholar] [CrossRef]
  26. Scott, D.; Mcboyle, G.; Schwartzentruber, M. Climate change and the distribution of climatic resources for tourism in North America. Clim. Res. 2004, 27, 105–117. [Google Scholar] [CrossRef] [Green Version]
  27. Napoli, C.; Pappenberger, F.; Cloke, H. Assessing heat-related health risk in Europe via the Universal Thermal Climate Index (UTCI). Int. J. Biometeorol. 2018, 62, 1155. [Google Scholar] [CrossRef] [PubMed] [Green Version]
  28. Basarin, B.; Luki, T.; Matzarakis, A. Review of Biometeorology of Heatwaves and Warm Extremes in Europe. Atmosphere 2020, 11, 1276. [Google Scholar] [CrossRef]
  29. Basarin, B.; Lukic, T.; Matzarakis, A. Quantification and assessment of heat and cold waves in Novi Sad, Northern Serbia. Int. J. Biometeorol. 2016, 60, 139–150. [Google Scholar] [CrossRef]
  30. Nastos, P.T.; Matzarakis, A. The effect of air temperature and human thermal indices on mortality in Athens, Greece. Theor. Appl. Climatol. 2012, 108, 591–599. [Google Scholar] [CrossRef]
  31. Bleta, A.; Nastos, P.T.; Matzarakis, A. Assessment of bioclimatic conditions on Crete Island, Greece. Reg. Environ. Chang. 2014, 14, 1967–1981. [Google Scholar] [CrossRef]
  32. Katavoutas, G.; Founda, D. Response of Urban Heat Stress to Heat Waves in Athens (1960–2017). Atmosphere 2019, 10, 483. [Google Scholar] [CrossRef] [Green Version]
  33. Katavoutas, G.; Founda, D. Intensification of thermal risk in Mediterranean climates: Evidence from the comparison of rational and simple indices. Int. J. Biometeorol. 2019, 63, 1251–1264. [Google Scholar] [CrossRef]
  34. Pecelj, M.M.; Luki´c, M.Z.; Filipovi´c, D.J.; Proti´c, B.M. Summer variation of the UTCI index and Heat Waves in Serbia. Nat. Hazards Earth Syst. Sci. 2019, 1–19. [Google Scholar] [CrossRef]
  35. Rasilla, D.; Allende, F.; Martilli, A.; Fernández, F. Heat Waves and Human Well-Being in Madrid (Spain). Atmosphere 2019, 10, 288. [Google Scholar] [CrossRef] [Green Version]
  36. Wereski, S.; Krzyżewska, A.; Dobek, M. Winter UTCI variability in Poland in the 21st century. Reg. Stud. Dev. 2020, 24, 128–137. [Google Scholar] [CrossRef]
  37. Hamilton, J.M.; Tol, R. The impact of climate change on tourism in Germany, the UK and Ireland: A simulation study. Reg. Environ. Chang. 2007, 7, 161–172. [Google Scholar] [CrossRef] [Green Version]
  38. Nicholls, S.; Amelung, B. Implications of climate change for rural tourism in the nordic region. Scand. J. Hosp. Tour. 2015, 15, 48–72. [Google Scholar] [CrossRef]
  39. Nicholls, S.; Amelung, B. Climate change and tourism in northwestern europe: Impacts and adaptation. Tour. Anal. 2008, 13, 21–31. [Google Scholar] [CrossRef]
  40. Li, S.; Sun, M.S.; Zhang, W.J.; Tan, L.; Zhu, N.N.; Wang, Y.F. Spatial pattern and evolution of climatic comfort period in mainland China from 1961 to 2010. Geogr. Res. 2016, 35, 2053–2070. (In Chinese) [Google Scholar]
  41. Zhong, L.S.; Yu, H.; Zeng, Y.X. Impact of climate change on Tibet tourism based on tourism climate index. J. Geogr. Sci. 2019, 29, 2085–2100. [Google Scholar] [CrossRef] [Green Version]
  42. Haldane, J. The Influence of High Air Temperatures No. I. Epidemiol. Infect. 1905, 5, 494–513. [Google Scholar] [CrossRef]
  43. Hill, L.; Griffith, O.W.; Flack, M. The measurement of the rate of heat loss at body temperature by convection, radiation and evaporation. Philos. Trans. R. Soc. 1916, 207, 225–347. [Google Scholar] [CrossRef] [Green Version]
  44. Yaglou, C.P.; Minard, D. Control of heat casualties at military training centers. Am. Med. Assoc. Arch. Ind. Health 1957, 16, 302–316. [Google Scholar]
  45. Thorn, E.C. The discomfort index. Weathenvise 1959, 12, 57–60. [Google Scholar]
  46. Houghton, F.C.; Yaglou, C.P. Determining equal comfort lines. J. Am. Soc. Heat. Vent. Eng. 1923, 29, 165–176. [Google Scholar]
  47. Siple, P.; Passel, C.F. Measurements of dry atmospheric cooling in subfreezing temperature. Proc. Am. Philos. Soc. 1945, 89, 177–199. [Google Scholar] [CrossRef]
  48. Fanger, P.O. Thermal comfort: Analysis and applications in environmental engineering. In Thermal Comfort Analysis & Applications in Environmental Engineering; Danish Technical Press: Copenhagen, Denmark, 1970; pp. 225–240. [Google Scholar]
  49. McArdle, B.; Dunham, W.; Holling, H.E.; Ladell, W.S.S.; Scott, J.W.; Thomson, M.L.; Weiner, J.S.; Holing, H. The prediction of the physiological effects of warm and hot Environments. In Renewable Northwest Project Report; Medical Resource Council: London, UK, 1947; pp. 47–391. [Google Scholar]
  50. Hoeppe, P. Die Energiebilanz des Menschen; Muenchen Univ. Press: München, Germany, 1984. [Google Scholar]
  51. Blazejczyk, K.; Epstein, Y.; Jendritzky, G.; Staiger, H.; Tinz, B. Comparison of UTCI to selected thermal indices. Int. J. Biometeorol. 2012, 56, 515–535. [Google Scholar] [CrossRef] [Green Version]
  52. Jendritzky, G.; De, D.R.; Havenith, G. UTCI-why another thermal index? Int. J. Biometeorol. 2012, 56, 421–428. [Google Scholar] [CrossRef] [PubMed] [Green Version]
  53. Brode, P.; Fiala, D.; Blazejczyk, K.; Holmer, I.; Jendritzky, G.; Kampmann, B.; Tinz, B.; Havenith, G. Deriving the operational procedure for the Universal Thermal Climate Index (UTCI). Int. J. Biometeorol. 2012, 56, 481–494. [Google Scholar] [CrossRef] [Green Version]
  54. Kong, Q.Q.; Zheng, J.Y.; Wang, X.G. Spatial pattern and temporal variation in thermal comfort in China from 1979 to 2014. Resour. Sci. 2016, 38, 1129–1139. (In Chinese) [Google Scholar]
  55. Zhang, X.Y.; Jiang, C.; Sun, J.X.; Zhou, M.F. Spatiotemporal variation characteristics and influencing factors of climate comfort at different altitudes. Chin. J. Appl. Ecol. 2018, 29, 2808–2818. (In Chinese) [Google Scholar]
  56. Hoyt, D.V. Percent of possible sunshine and the total cloud cover. Mon. Weather Rev. 1977, 105, 648–652. [Google Scholar] [CrossRef] [Green Version]
  57. Garbrecht, J.; Fernandez, G.P. Visualization of trends and fluctuations in climatic records1. J. Am. Water Resour. Assoc. 2010, 30, 297–306. [Google Scholar] [CrossRef]
  58. Vinogradova, V. Using the Universal Thermal Climate Index (UTCI) for the assessment of bioclimatic conditions in Russia. Int. J. Biometeorol. 2021, 65, 1473–1483. [Google Scholar] [CrossRef] [PubMed]
  59. Zhang, D.; Wang, M.; Gan, M.Y.; Yang, L.S. Research progress on influencing factors of Arctic tourism. Resour. Sci. 2021, 43, 1687–1699. [Google Scholar] [CrossRef]
  60. Lan, C.Z. Polar tourism: High-end tourism and sustainable development under unique resource conditions. World Environ. 2017, 3, 70–73. (In Chinese) [Google Scholar]
  61. Luo, M.; Guo, Y.A. Legal dilemma and solution for the development of tourism resources in the Arctic region. Chin. J. Marit. Law 2020, 31, 58–66. (In Chinese) [Google Scholar]
Figure 1. Location of the study area (shaded area) and the average temperature in the Arctic from 1979 to 2019.
Sustainability 13 13056 g001
Figure 2. The framework of the study.
Sustainability 13 13056 g002
Figure 3. Change in Arctic summer UTCI from 1979 to 2019: (a) time series, (b) RAPS, (c) anomaly series.
Sustainability 13 13056 g003
Figure 4. Change in Arctic summer comfortable area from 1979 to 2019: (a) time series, (b) RAPS, (c) anomaly series.
Sustainability 13 13056 g004
Figure 5. Spatial distribution and variation of Arctic summer comfortable area: (a) 2010–2019, (b) 1979–1988, (c) spatial variation of the decade before and after.
Sustainability 13 13056 g005
Figure 6. Change in the number of Arctic summer comfortable days from 1979 to 2019: (a) time series, (b) RAPS, (c) anomaly series.
Sustainability 13 13056 g006
Figure 7. Rate of spatial change for the number of Arctic summer comfortable days from 1979 to 2019.
Sustainability 13 13056 g007
Figure 8. Spatial distribution and change in the number of Arctic summer comfortable days from 1979 to 1988 and from 2010 to 2019: (a) 2010–2019, (b) 1979–1988, (c) Spatial transformation.
Sustainability 13 13056 g008
Figure 9. Changes in the average temperature, relative humidity, wind speed, and total cloud cover in the Arctic summer from 1979 to 2019.
Sustainability 13 13056 g009
Figure 10. Spatial correlation coefficients between the number of comfortable days and temperature, relative humidity, wind speed, and TCC in Arctic summer from 1979 to 2019 (R: correlation coefficient).
Sustainability 13 13056 g010
Table 1. UTCI equivalent temperatures categorized in terms of thermal stress and thermal perception.
UTCI (°C)Stress CategoryComfort LevelUTCI (°C)Stress CategoryComfort Level
>46Extreme heat stressExtreme hot0~9Slight cold stressCool
38~46Very strong heat stressVery hot−13~0Moderate cold stressColder
32~38Strong heat stressHot−27~−13Strong cold stressCold
26~32Moderate heat stressHotter−40~−27Very strong cold stressVery cold
9~26No thermal stressComfort<−40Extreme cold stressExtreme cold
Table 2. Areas of comfort days at different levels in 1979–1988 and 2010–2019.
(105 km2)0–10 d11–20 d21–30 d31–40 d41–50 d51–60 d61–70 d71–80 d81–92 d
2010–20199.7412.7911.909.578.078.936.661.670.04
1979–198812.7015.1312.129.549.057.022.090.640.00
Difference−2.96−2.34−0.220.03−0.981.914.571.030.04
Table 3. Correlation coefficients between comfortable area, comfortable days, and meteorological factors in arctic summer from 1979 to 2019.
TemperatureRelative HumidityWind SpeedsTCC
Comfortable Area0.818 **0.07−0.218−0.340 *
Comfortable Days0.944 **0.086−0.309−0.514 **
Note: “*”, “**”: Significance at 0.05 and 0.01 levels.
Publisher’s Note: MDPI stays neutral with regard to jurisdictional claims in published maps and institutional affiliations.

