1. Introduction
The utilization of organic compounds is persistently expanding with the rapid economic developments and environmental changes. Thus, the creation of chemicals with diverse poisonous quality and unmanageability reaches abnormal levels. Moreover, regular new organic substances, which can become unmanageable contaminants, are combined and surged into the earth. Therefore, removing these dyes from wastes is considered the main concern in the ecological system [
1]. These actual scenarios cite the principal challenges in the enhancement of new and successful water treatment techniques. Currently, many research groups are developing various advanced oxidation (AO) processes. These AO processes mainly aim to produce reactive hydroxyl radicals (OH
•) for the successful degradation of organics. However, some organic compounds remain undestroyable after using these AO processes, even though some of them are quite promising [
1,
2].
The influences of solution temperature and pressure on the chemical and physical procedures in the fluid stage of electrical discharge are essential. Additional work is expected to thoroughly depict how electric discharge can fail under the high temperature and pressure of fluid stage settings. The temperature is a critical component that is required in creating the most substantial rate of dye degradation. This effect has been studied by [
3,
4]. A few articles have informed conclusions on the H
2O
2 creation and degradation of organic pollution in the corona plasma system under distinctive conditions.
However, the data concerning the influence of reaction temperature, including corona discharge plasma, are absent. This topic remains particularly critical, mainly because corona discharge plasma reactors proficiently treat polluted water. The influence of wastewater temperature should be considered because the temperatures may differ, given the wide variety of global atmospheres around the world, for instance, the icy states of wintertime or close cold waters and the sweltering ones in the summertime or hot zones. The surely understood influence of temperature degrees on the established water-stage reactions also affects the investigation of corona discharge forms affecting the oxidation of pollution in the water stage. This influence has been studied by [
5,
6,
7]. All the reactive species, such as ions, and the molecular and radical generation from the chemical reactions within diverse temperature regions (low and high temperature) can be useful in predicting the plasma activity. Various water particles initially separate the control of the production rate of item species [
8]. Wastewater temperature can influence photocatalytic reactant ozonation by advancing or impeding oxidation. The influence of temperature degrees on degradation effectiveness intended for every AO setup is caused by numerous factors, such as electric power and current flow. Case in point, expanding temperature degrees ought to prompt consequential chemical effects included in heterogeneous oxidations. Moreover, this scenario should diminish the dispersion layer’s thickness in the water polluted with dye, improving mass exchange conditions [
9]. The dye degradation rate in the polluted solution can be raised by boosting the reaction rate and improving the activity of the species. However, the increasing temperature makes the receptive radicals susceptible to effects and prompts elimination, thereby reducing the dye oxidation rate. As the solution temperature increases, the corona discharge plasma increases, and the average free path of electrons rises; this effect has been studied by [
10,
11,
12]. The expanded temperature diminishes the short life and solvency of active radical species, such as ozone in a liquid. Any deficiency in the strength of ozone adversely influences the yield of photocatalytic reaction by ozone. Moreover, Langmuir adsorption isotherm indicates that as the temperature increases at constant pressure, the contamination rate of adsorption on the photocatalyst impetus surface diminishes, and the amount adsorbed gradually expands, prompting a decline in the oxidation of adsorbed pollutions [
13].
The present study mainly aims to research the influence of Acid Blue 25 dye solution temperature on the efficiency of the decolorization process using experimental work and a simulation model. First, the 2D simulation model was introduced to explore the influence of temperature and the electric field generated by corona discharge plasma. The results showed a great match between the result of the experimental work and the simulation result. Second, the reaction rates of the organic dye degradation under the effect of varying temperature degrees were investigated depending on the Arrhenius equation to define the properties of acid anionic dye temperature. Third, dye degradation kinetics during pulse discharge processes was studied experimentally and theoretically. The performance of a corona discharge plasma was defined using a kinetic model. The kinetic models of pseudo-zero-, pseudo-first-, and pseudo-second-order reactions were used to investigate Acid Blue 25 dye degradation. Electrical Energy per Order (EE/O) and energy yield were calculated. The energy consumption requirements for the removal of Acid Blue 25 dye were also calculated.
2. Materials and Methods
2.1. Model of Wastewater Polluted Solution with Dye
Contaminated water with Acid Blue 25 Dye solution was prepared by dissolving an appropriate amount of dye in distilled water.
Figure 1 and
Table 1 show the compound structure of Acid Blue 25. Acid Blue 25 is widely used to color leather during the manufacturing process and in dyeing nylon, paper, and PC blends. It is mostly utilized for cellulose and polyamide to support the dye. Acid Blue 25 dye is also utilized in wool, nylon, modified acrylics, silk, leather, paper, ink-jet printing, and cosmetics. It is usually soluble in water. Azo (including premetallized), anthraquinone, triphenylmethane, azine, xanthene, nitro, and nitroso are the most common chemical classes of these colors. Acid Blue 25 dye is also suitable for dyeing and printing silk, wool, and mixed fabrics and is good for leather, electrically controlled aluminum soap, and color [
14].
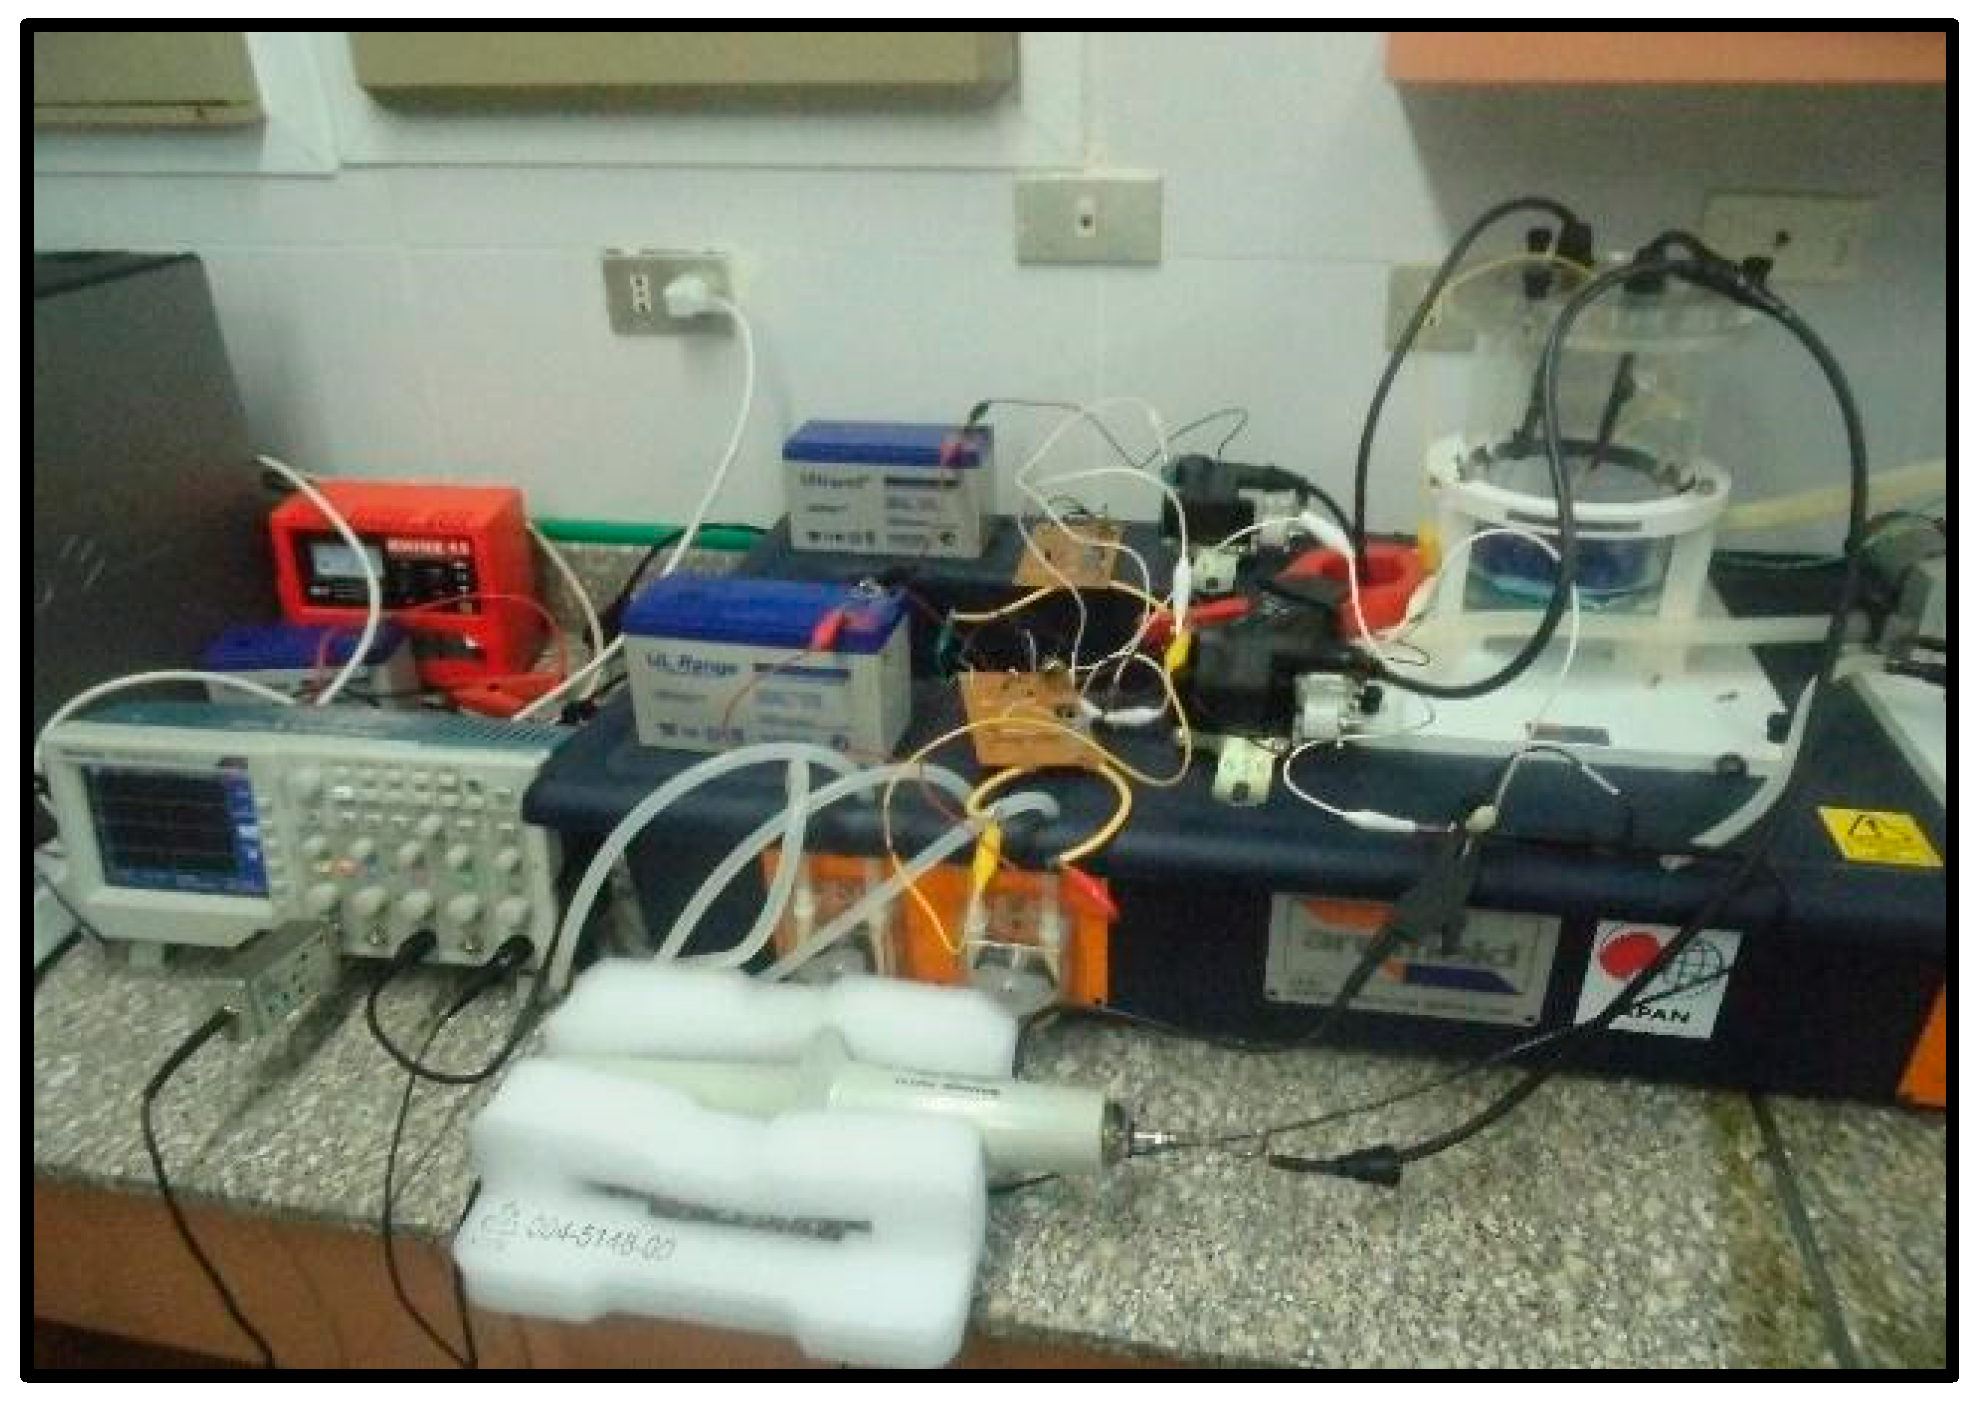
2.2. Experimental Arrangement
This experimental work sets a high-voltage conductor over the wastewater, whereas the ground was set inside the wastewater. The gas-liquid electrical discharge system utilized as a part of this study consists of dual-pin anodes. Dual-pin terminals were joined with a high voltage while the plate was ground. Computer-controlled chemical reactors (CEXC) with a continuous blended tank reactor were used in the corona discharge plasma reactor. The reactor has a diameter of 100 mm with a height of 180 mm and an exterior skeleton width of 120 mm.
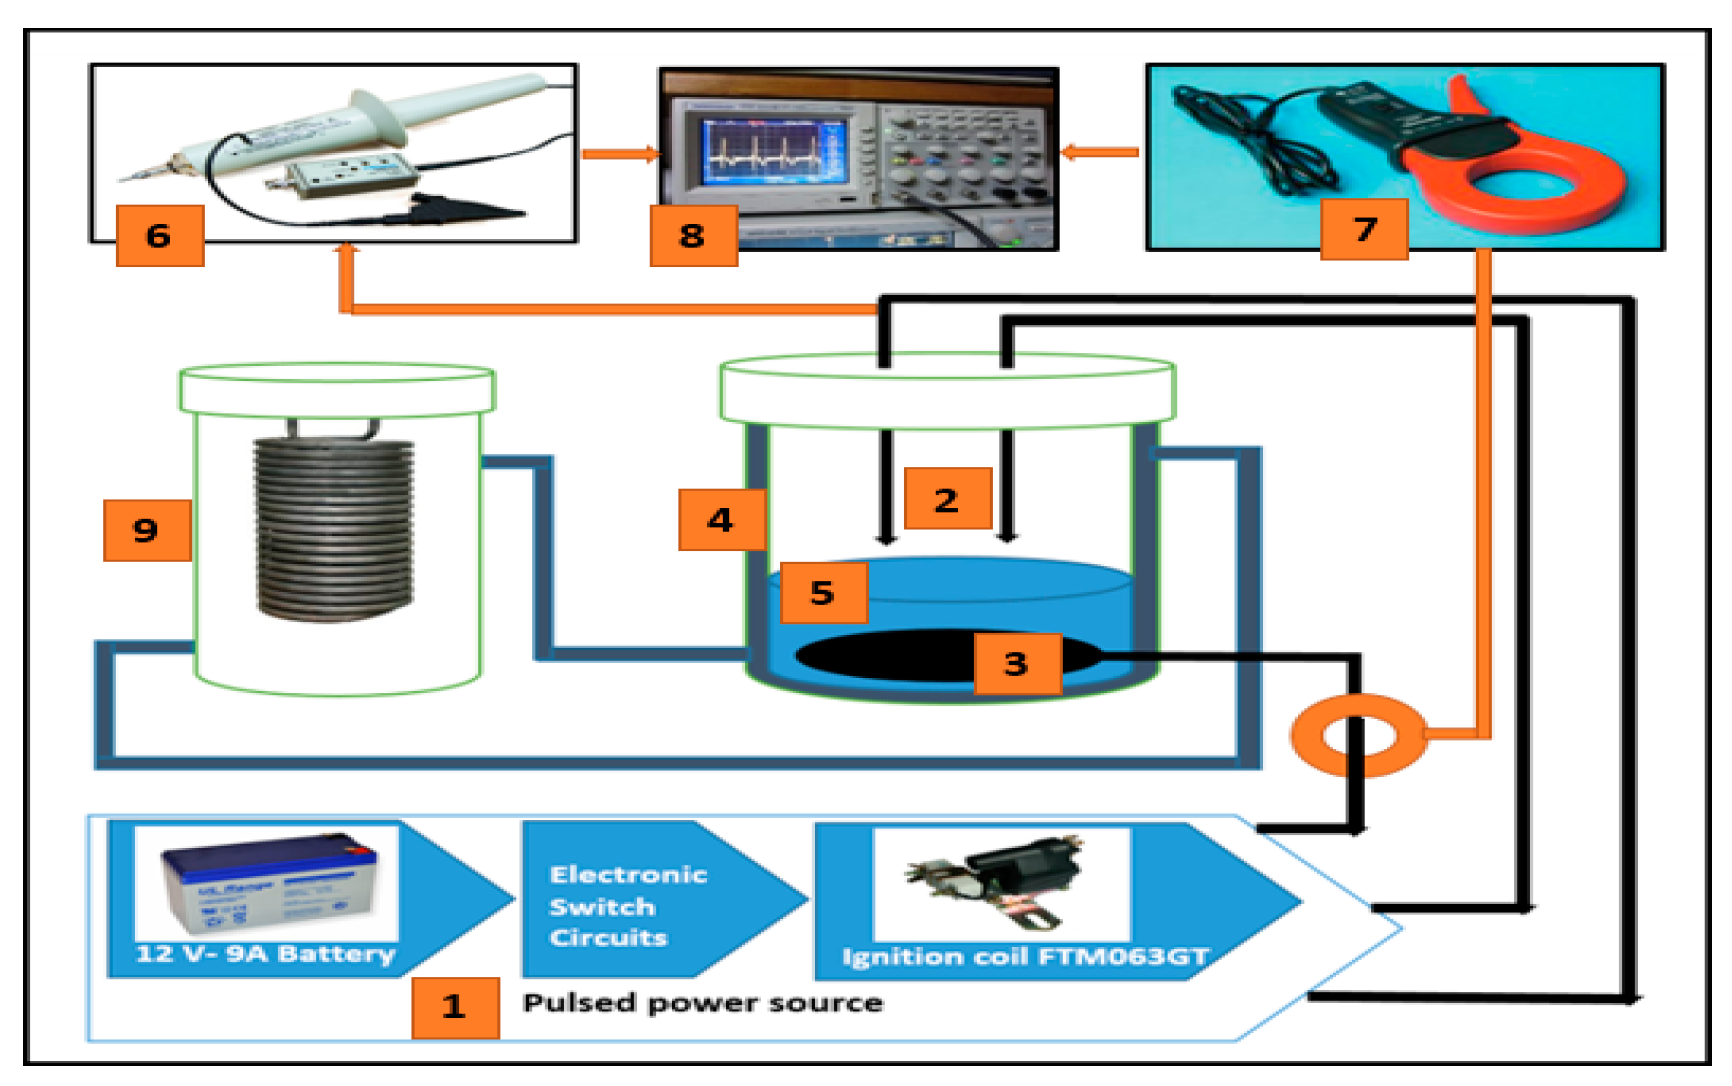
Figure 2 represents a diagram of the experimental work and the corona discharge plasma system. The high-voltage electrode pin’s diameter is 1 mm, and its height is 3 cm. The space between the two pins is 50 mm, notwithstanding that the ground conductor is a cubic measuring 5 cm × 6 cm × 0.02 cm, with an aggregate exposed range of 30 cm
2. An excitation voltage of 15 kV from the FTM063GT-GC5MIC2000 Ignition Coil was linked to the pin. Tektronix P6015A was used to measure an excitation voltage waveform. Moreover, Tektronix A6021 (Portland, Oregon, USA) current probe was used to determine the current waveform, and Tektronix TDS2014 digital storage oscilloscope was used to view the voltage and current waveforms.
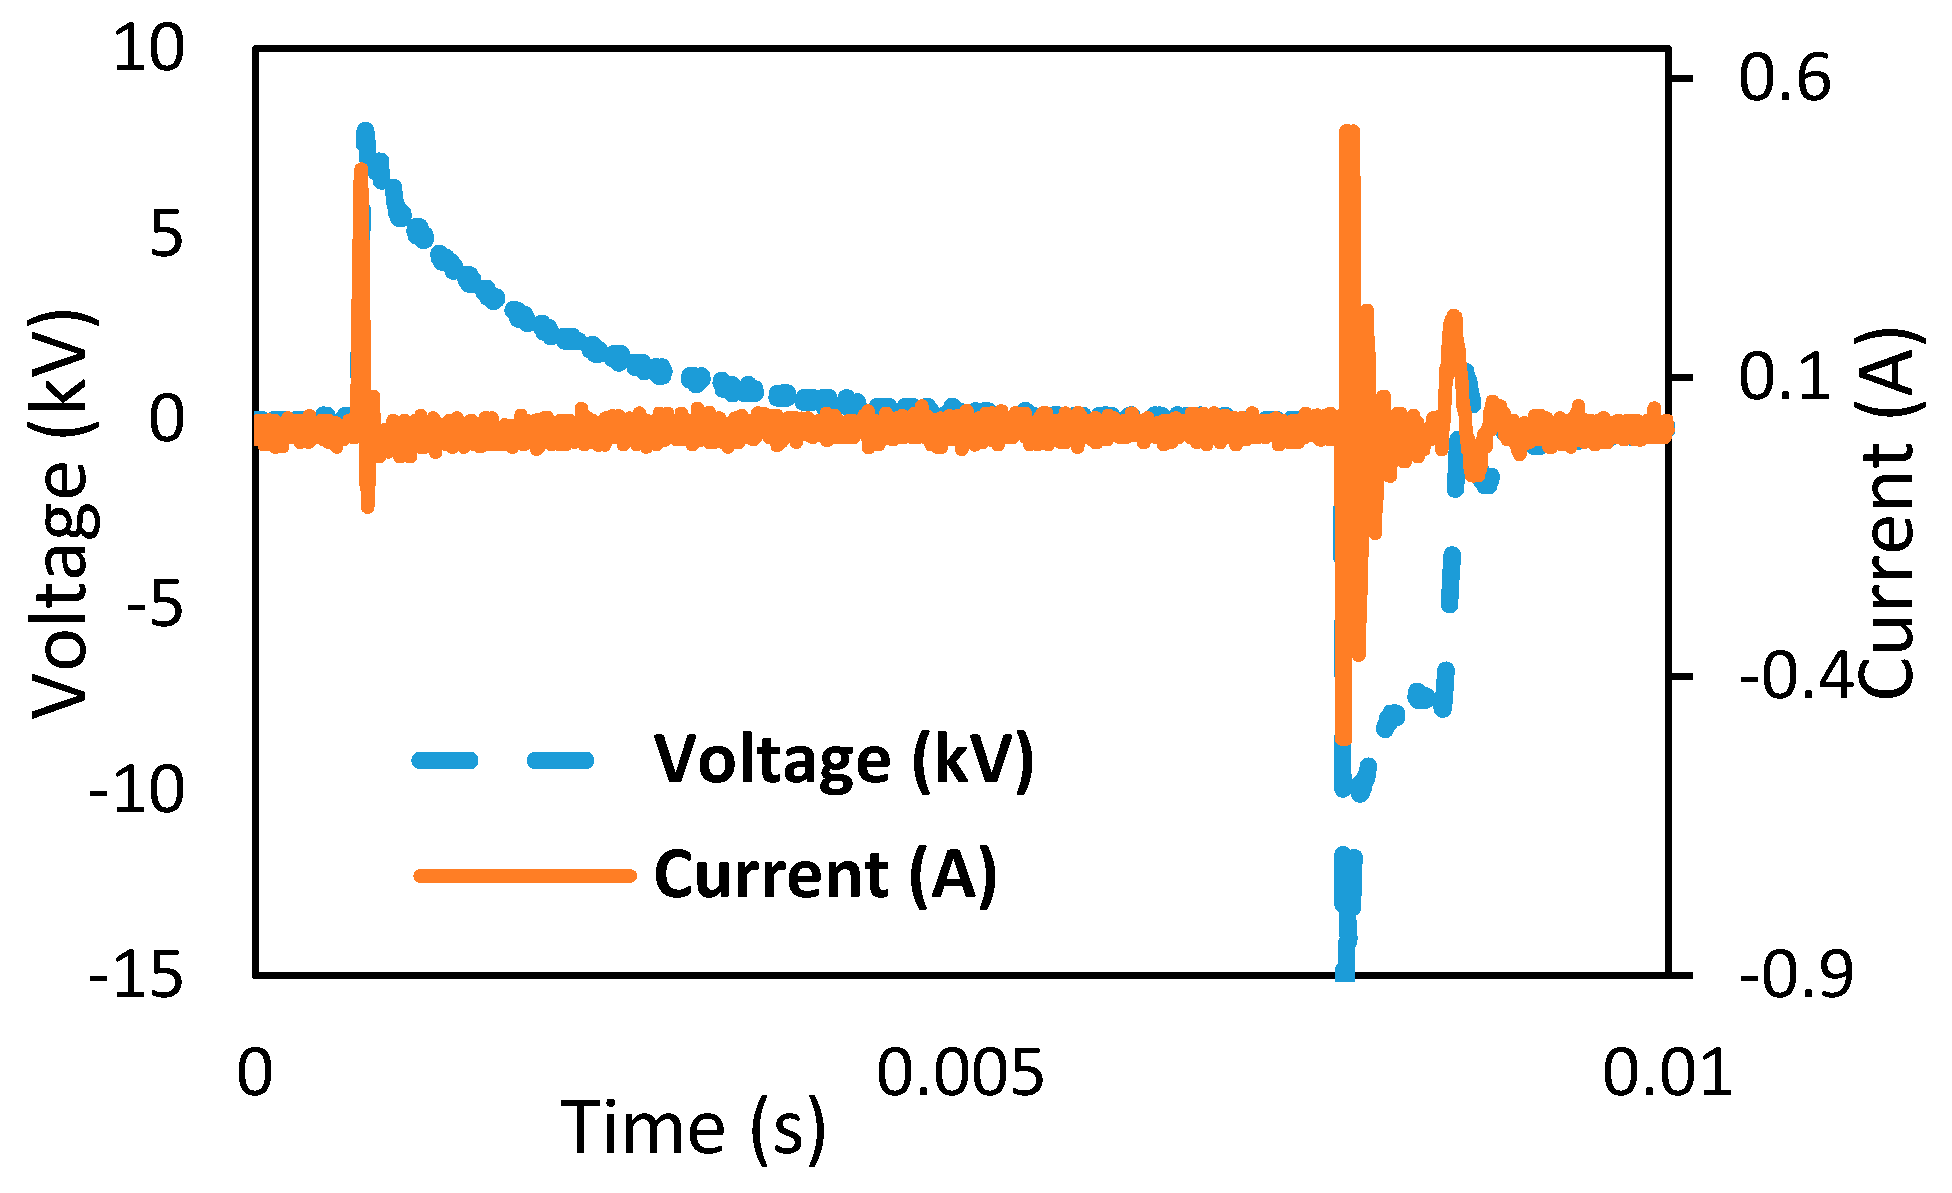
Figure 3 displays the voltage and current sequences of the gas–liquid corona discharge plasma reactor. The high-voltage and ground conductors of the distinct radii of shape separated by a 0.5 cm air gap were considered the finest distance from the simulation work. The high voltage of 15 kV with a time of 10 ms, frequency of 100 Hz, positive width of 8.615 ms, negative width of 1.376 ms, and the rise time of 70.46 µs were also considered [
9,
10,
11,
12,
13,
14]. The schematic setup is displayed in
Figure 4, demonstrating all the items used in the corona discharge plasma system. The absorption light for the dye solution before and after the trial was estimated by HITACHI U-3900 UV (Hitachi, Chiyoda, Tokyo, Japan) spectrophotometer at 600 nm wavelength.
Decolorization competence is well described as the relation of decolorization dyeing to the original dye focus, as seen in Equation (1):
where,
D% is decolorization competence,
Ai is original absorption, and
At is absorption after treatment time
t.
In the tests, the temperature of the wastewater solution was kept up at 278, 288, and 298 K by the corona reactor unit and at 308, 318, 328, 338, 348, and 358 K using the CEXC chemical reactors service unit as a cooling and heating water bath control.
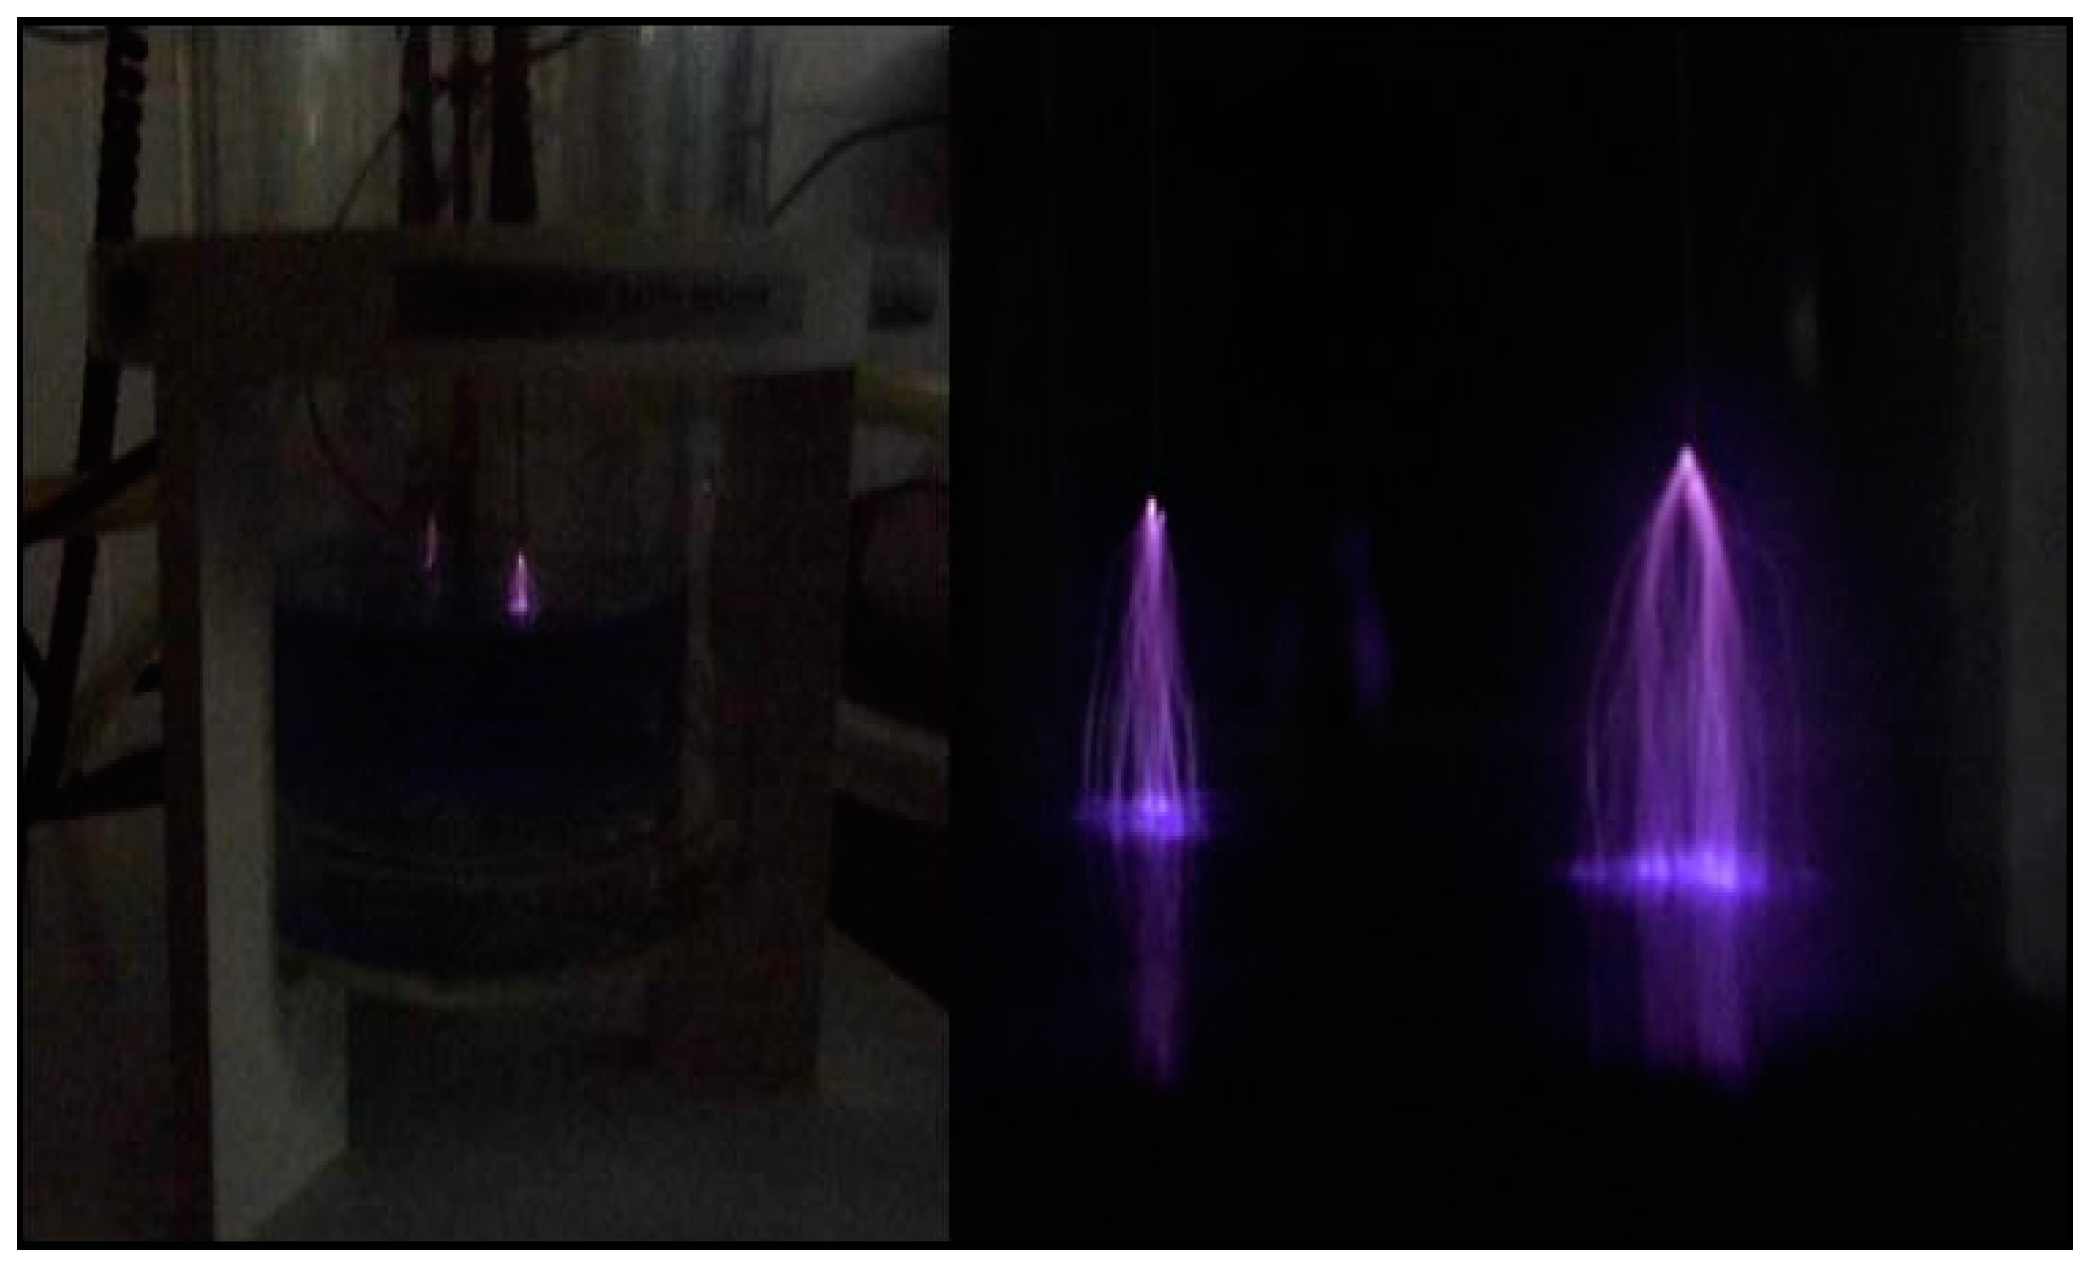
Figure 5 shows the image of corona discharge from the dual pin-to-plate electrodes [
13,
14].
3. Results and Discussion
A gas-liquid electrical discharge is inclined toward a small zone around a small radius wire. A few physical procedures occur in that region (photoionization or ionization and particle recombination). However, this phenomenon is extremely multifaceted to be counted while leaning to the great part of the conditions of reasonable interest [
15,
16]. The releases framed specifically over water surfaces are essential for the key investigations of electrohydrodynamics and uses of concoction responses at the gas-liquid interface.
3.1. Influence of Temperature Degrees
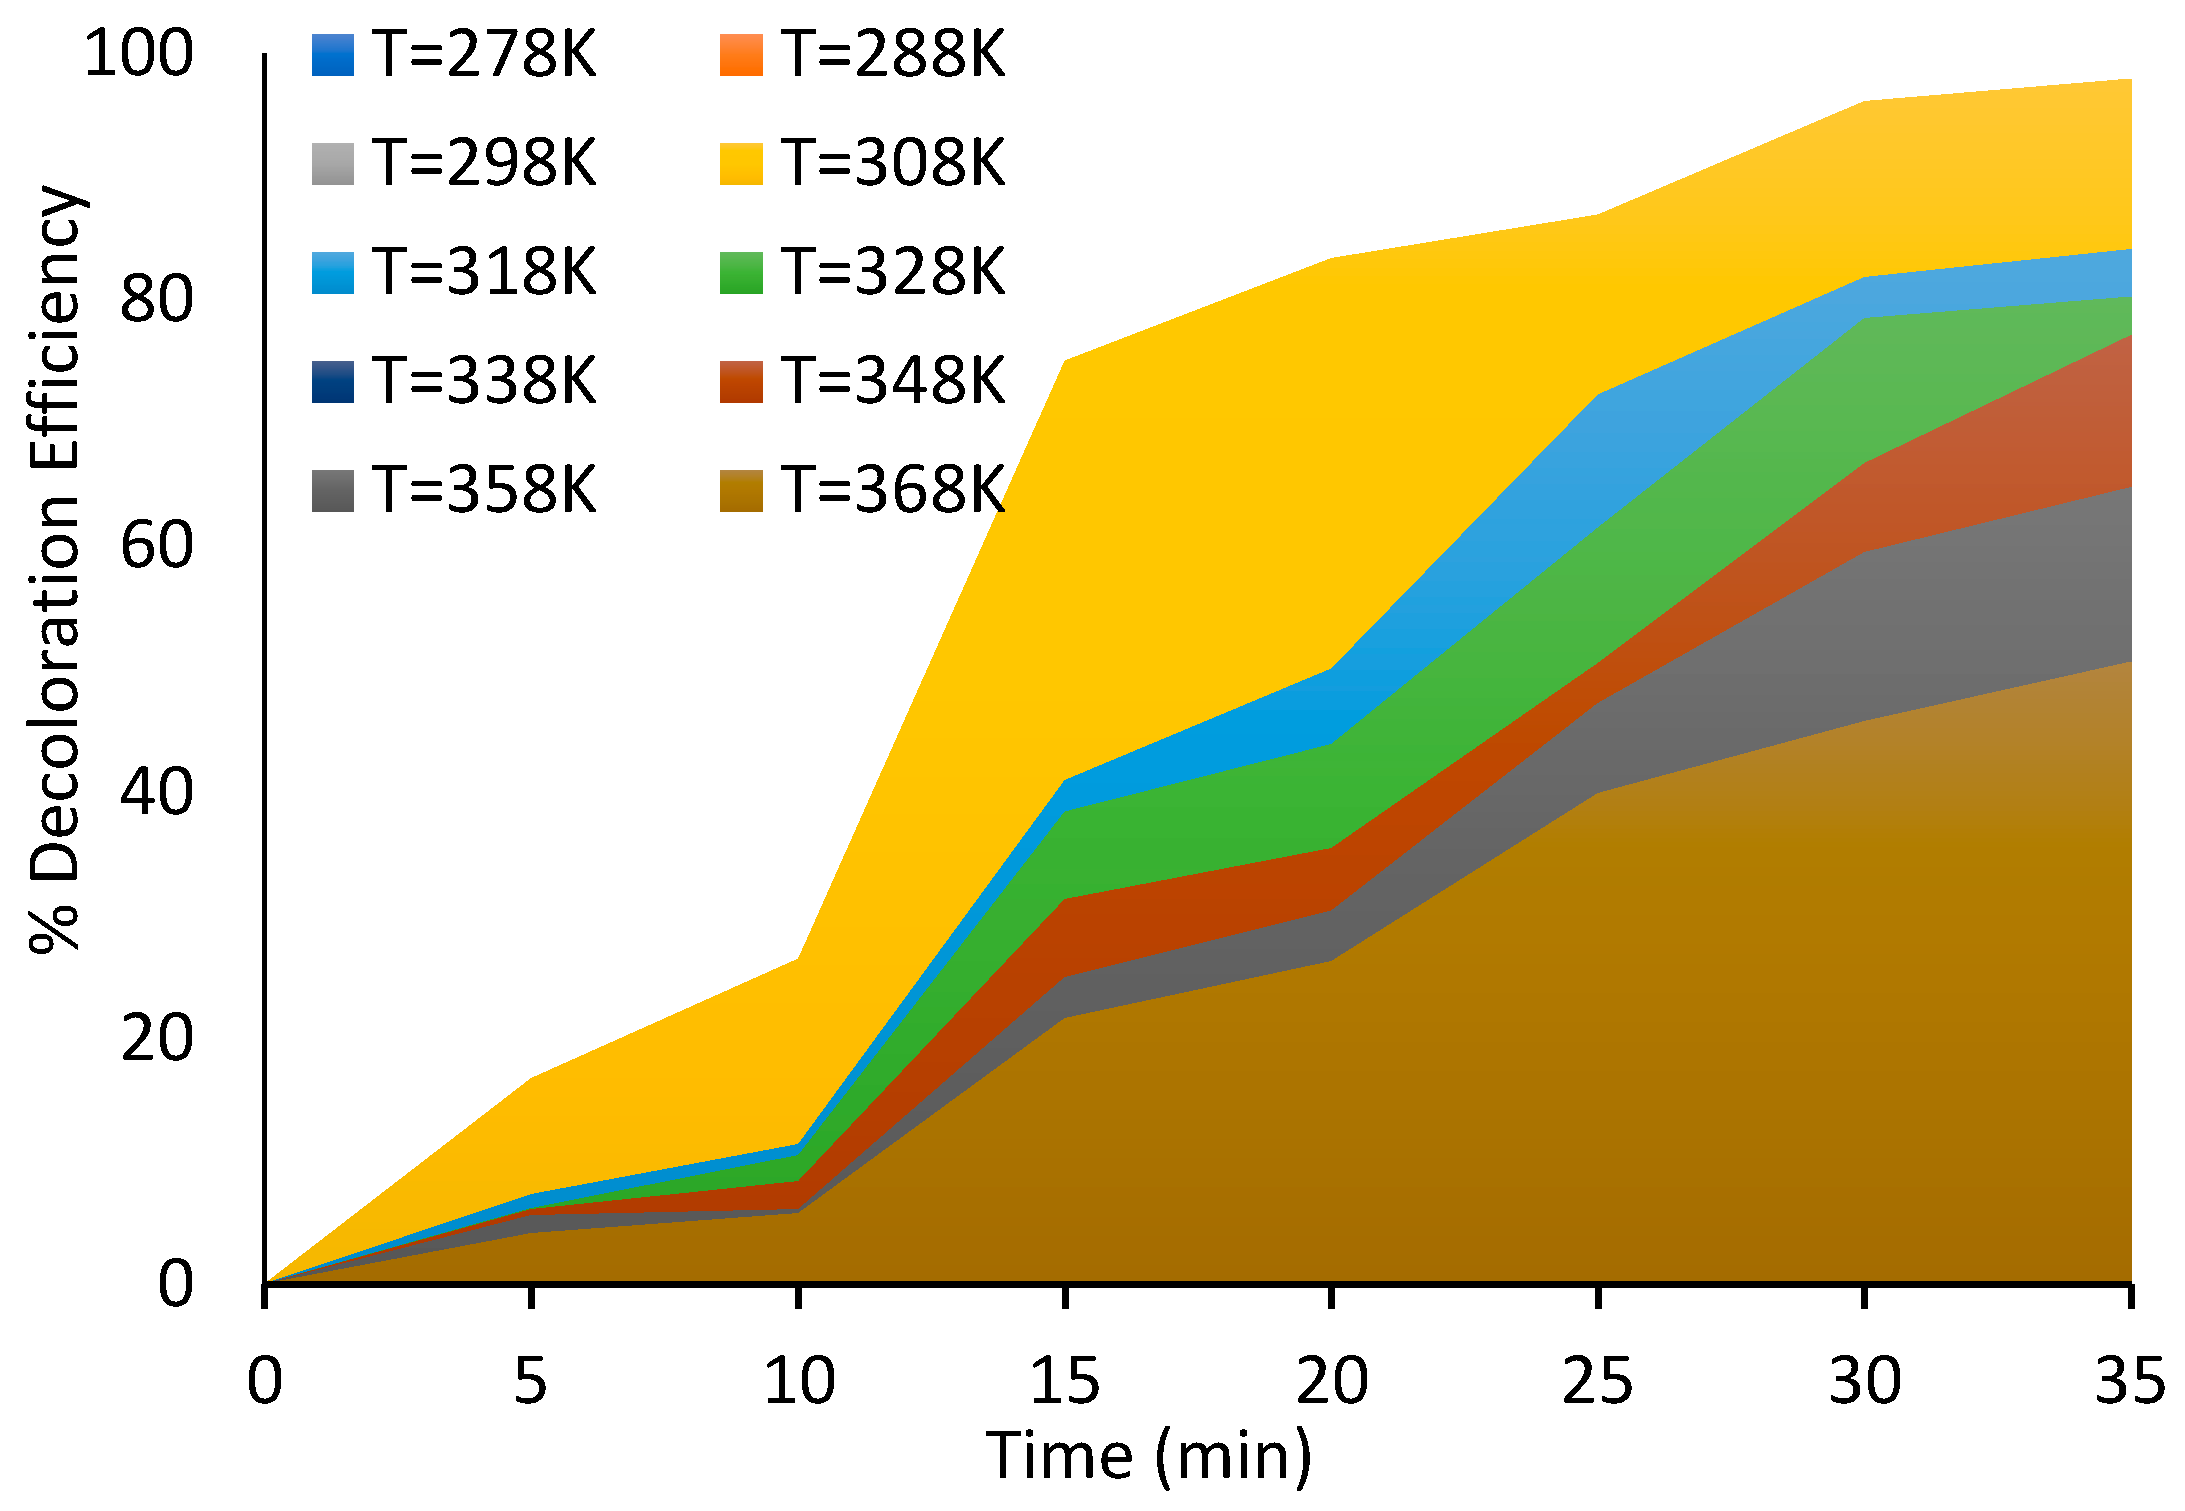
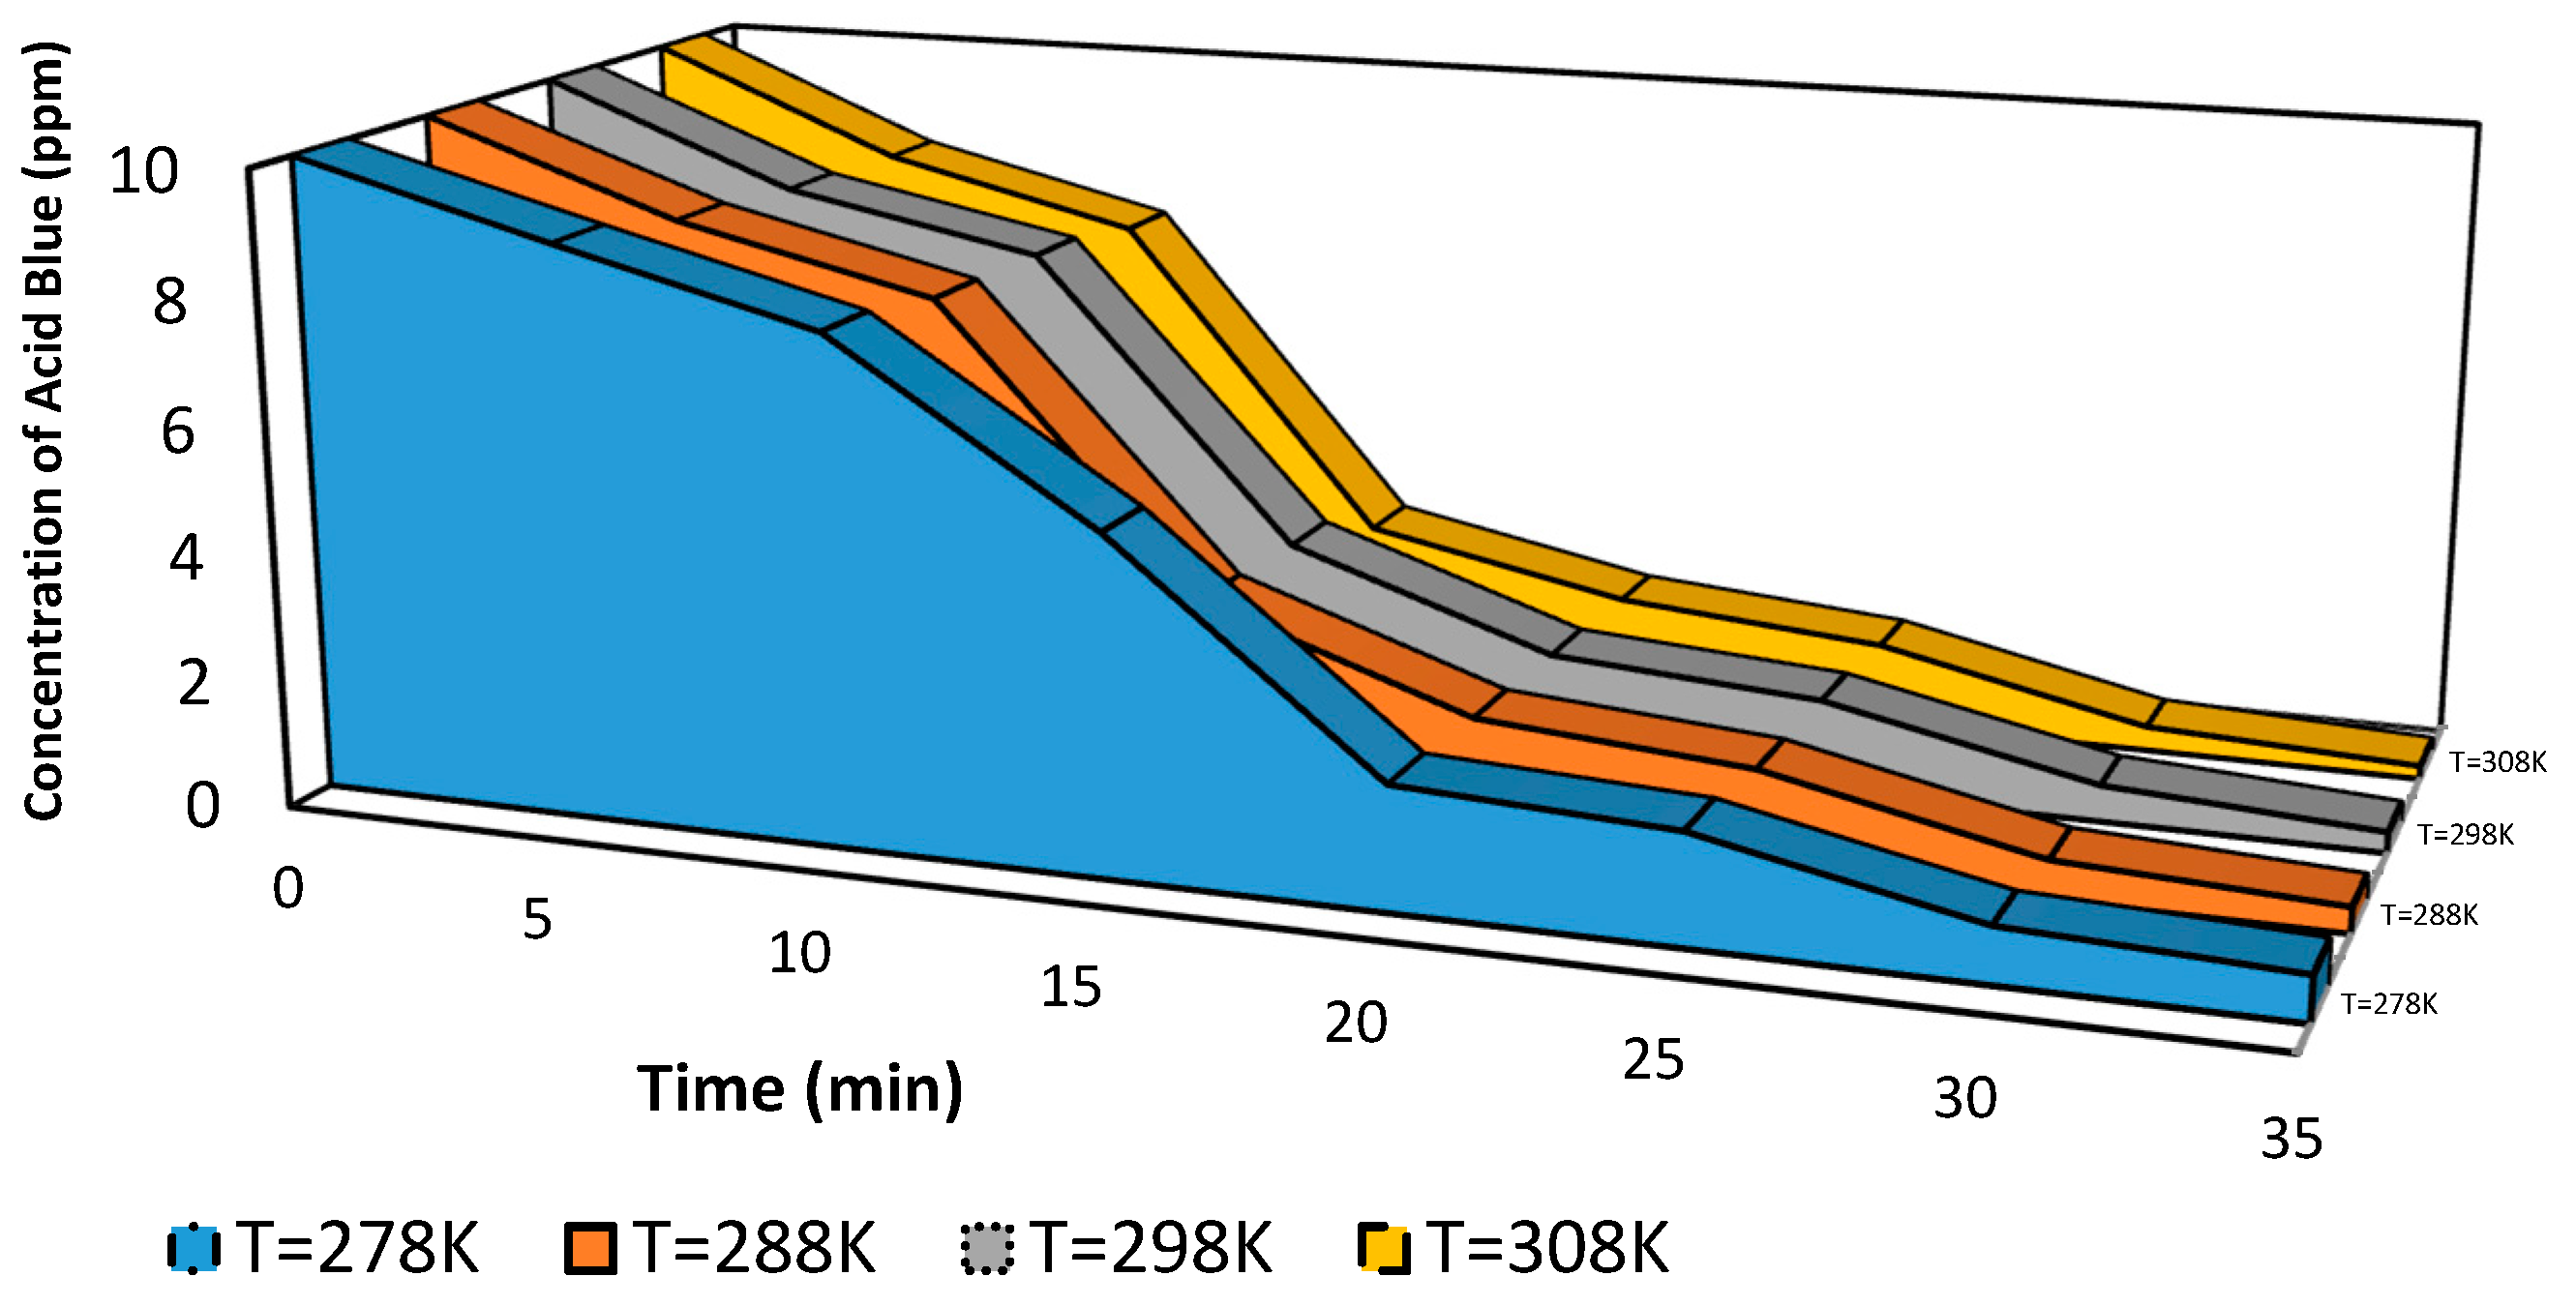
The influence of temperature degrees on organic dye degradation is critical in the wastewater treatment technique. Therefore, the color removal of polluted water with Acid Blue 25 dye was studied with varying temperature degrees from 278 K to 318 K, as shown in
Figure 6. The measurements were taken under constant dye concentrations (10 ppm) at pH 6.
Figure 6 shows that the color removal percentage of dye declines from 97% to 53% with the increase in dye solution temperature from 308 K to 368 K. However, an inverse behavior was observed at a temperature from 278 K to 308 K. The dye decolorization percentage increased from 90% to 97%. Therefore, the suitable temperature for color removal of Acid Blue 25 dye from wastewater is 308 K, close to room temperature. Thus, we conclude that Acid Blue 25 dye wastewater should cool down to room temperature before any degradation process occurs. The increase in the temperature is considered a restriction with the competence of degradation for organic dye. As in previous work, Dojčinovića [
16] stated that the ideal removal temperature for azo dye is more satisfactory at 308 K than that at 310 K. The most extreme decolorization at temperatures 298, 303, and 315 K was decreased by 13%, 37%, and 28%, respectively, compared with the decolorization at 310 K. As the temperature increased from 298 K to 315 K, the decolorization effectiveness of wastewater was increased most likely because of the increment in the movement of the huge dye particles. Chang and Ono suggested that the focus and the lifetime of active radical species are the two principal components affecting decolorization effectiveness [
17,
18,
19].
3.2. Simulation Results and Discussion
Computer simulation generally presents an information trend that provides a specific relationship between variables of interest. The real prerequisite for the development of corona discharge plasma is an adequately steep electric field distribution. The field near the electrode must be sufficiently strong to accelerate the electrons rapidly and enable them to ionize the gas molecules. This high field comes from the high voltages of a few hundred kilovolts for a whole measurement of centimeters. A few authors focused on the 2D investigation of electrical conditions by considering power as an essential instrument influencing the molecule directions. Different numerical procedures have been utilized [
20,
21,
22]: boundary element method, method of characteristics, charge simulation, finite difference method, and donor cell method. A 2D simulator based on the finite element method (FEM) was used to simulate the dual pins in high-voltage electrodes to make this study discernible. The results helped obtain the electric potential, space charge distribution, electric field appropriations, and energy density when corona discharge plasma was used in organic pollution removal under the influence of temperature. FEM is dependable in Maxwell’s equations on 2D grids, as shown in Equations (2)–(5). The mesh size gradually increases from segment to segment of the model body. Different mesh sizes were used to obtain a good result from the model. The model using a small mesh size should present good results because a small mesh size presents abundant calculating points for the electrical field from the connecting sphere.
where H is magnetic field intensity, E is electric field intensity, B is magnetic field density, D is electric field density, and J is current density.
The suggested model was created with 2D simulation software to determine the optimal temperature degree for the operation at a particular voltage of 15 kV. Understanding the creation of ozone and active radicals and the voltage and field distribution in the air gap distance between the two conductors is necessary to explain the dynamics of corona discharge. The easiest method to optimize corona devices is understanding the corona onset voltage and electric field, which may be determined using voltage and field distributions [
21,
22,
23,
24,
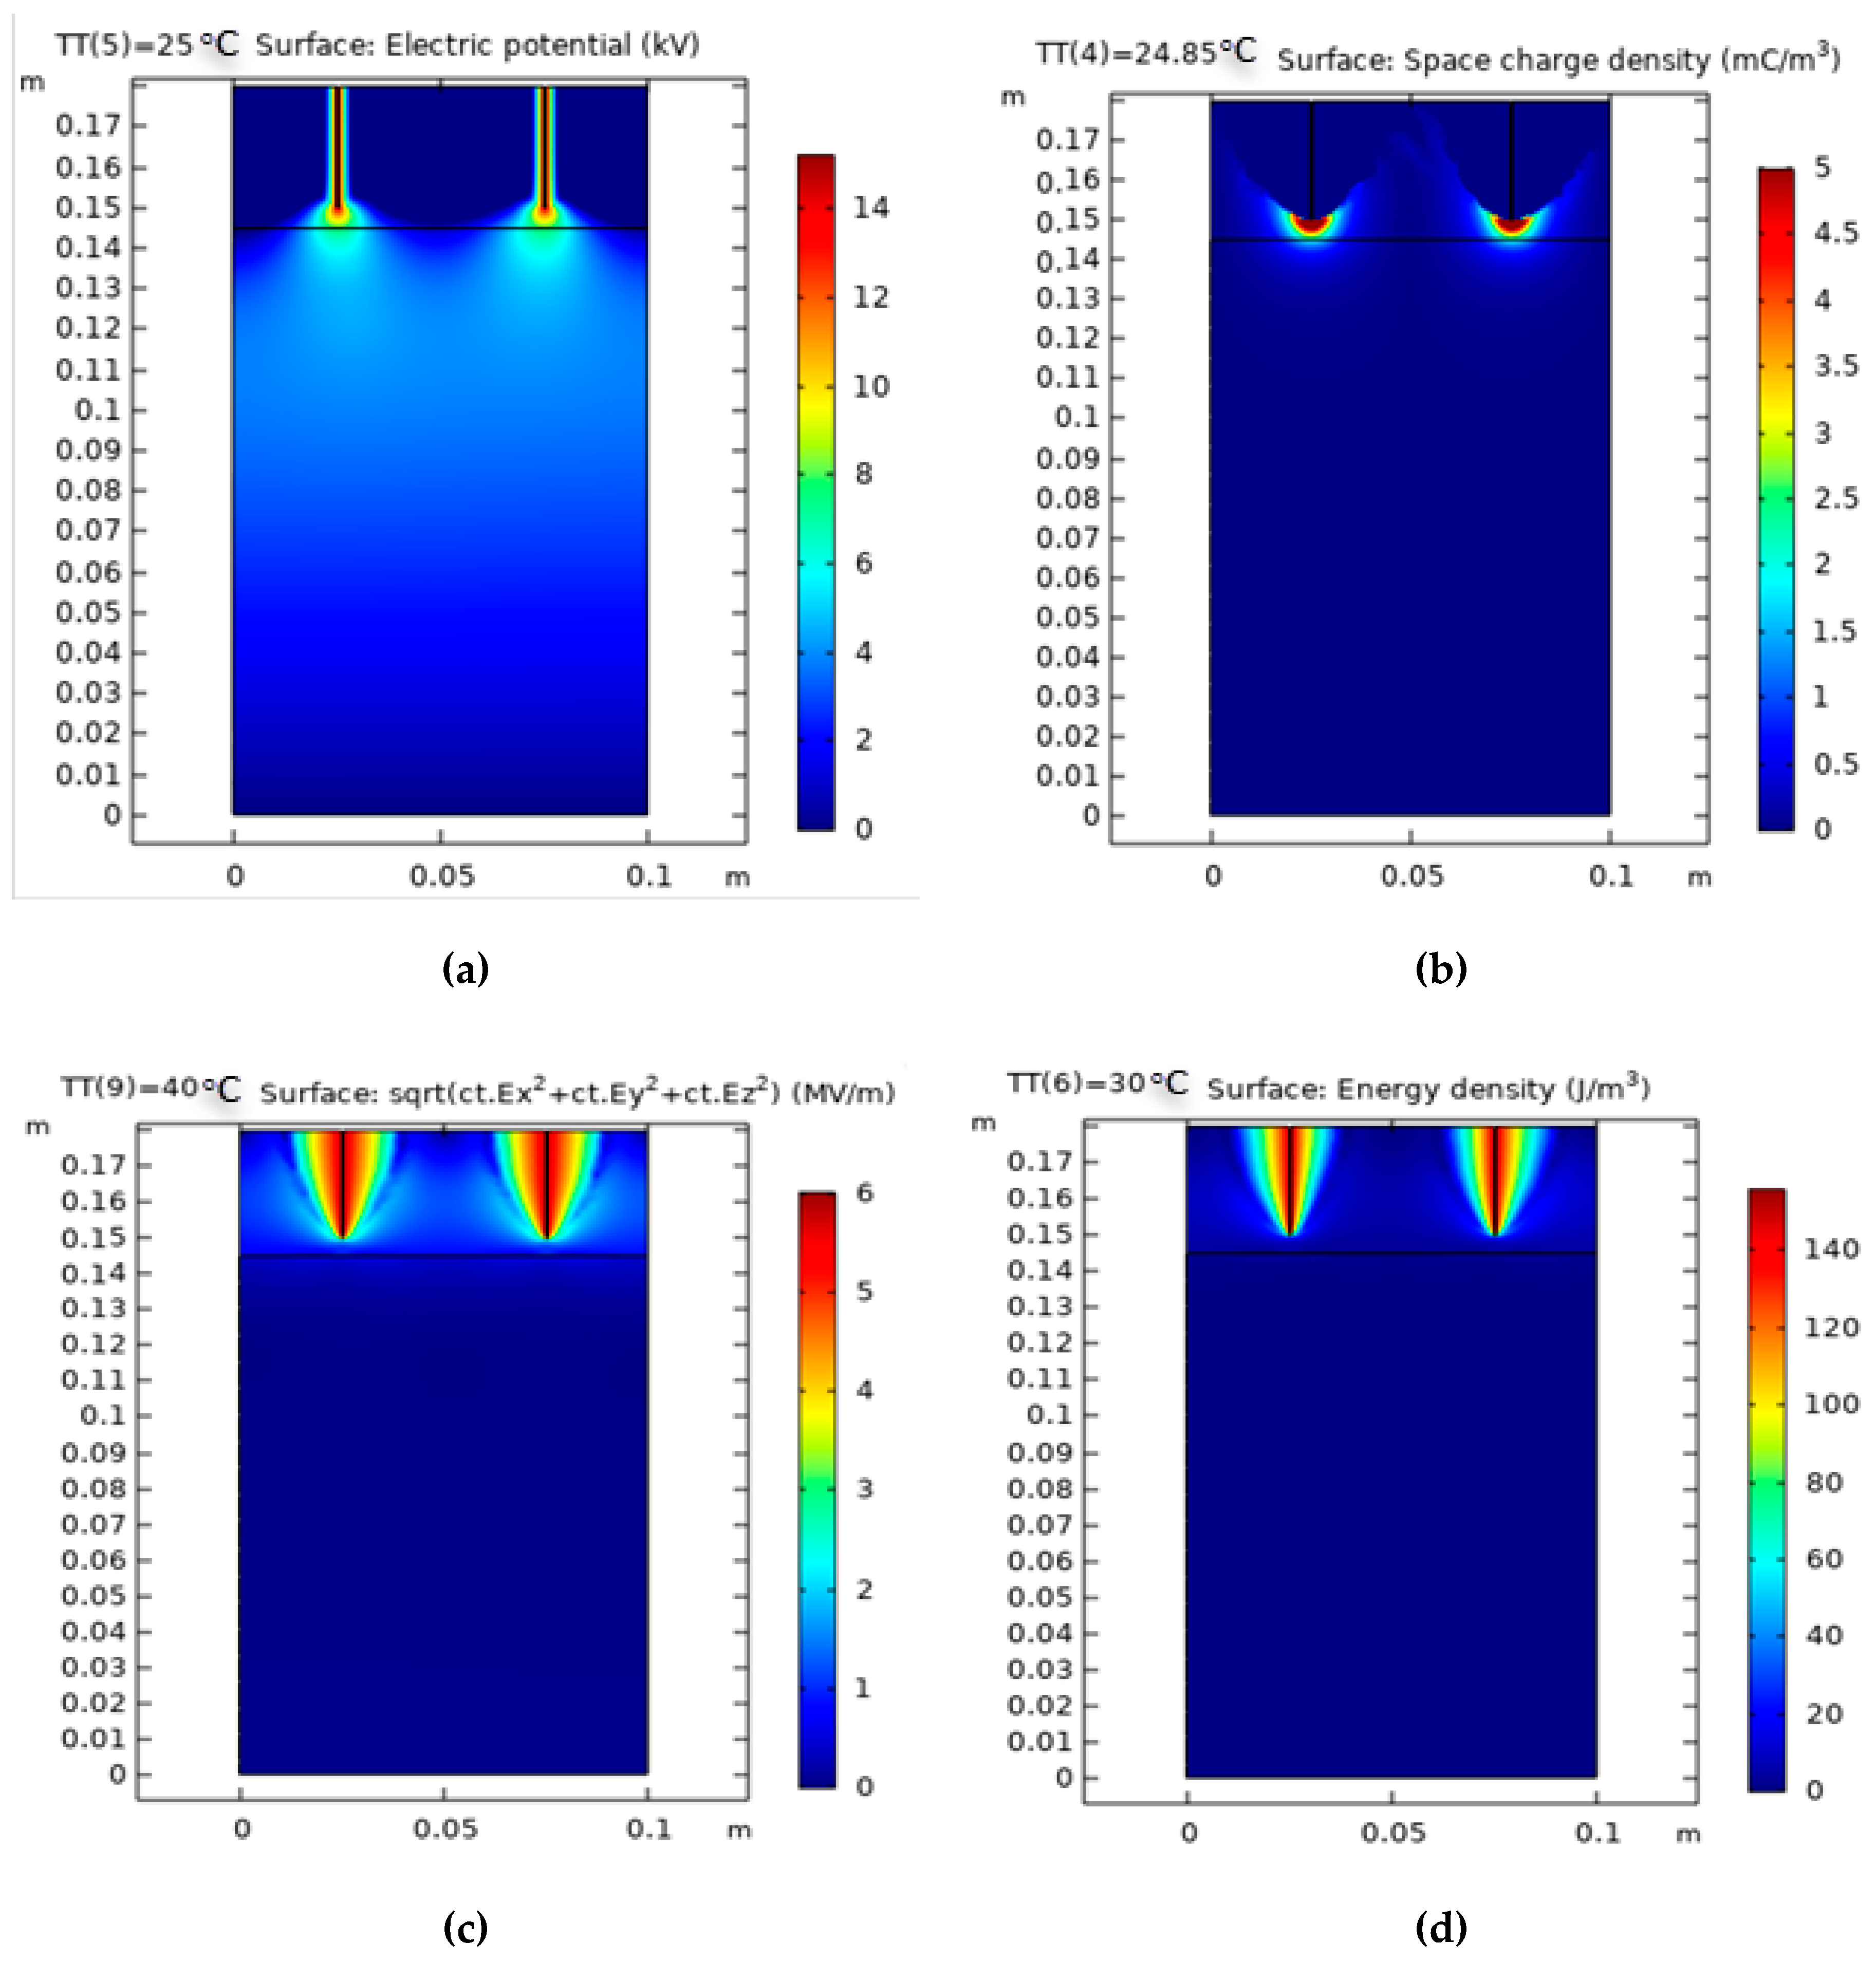
25]. The states of limit for the potential are straightforward at the high-voltage corona electrodes and zero voltage at the ground electrodes (Dirichlet limit conditions). This observation indicates that the electric field rises relatively to the voltage beneath the corona discharge plasma; however, its incentive is protected as soon as the corona streamers begin. In the model, the amount of electric field depends on two factors: radius of curvature and voltage being applied. Corona discharge is restricted to a tiny region close to the minor radius wire in the air. Numerous physiological processes occur in this zone; their modeling is too complicated to address when dealing with many practical situations. The potential and electric field variations in a dual pin-to-plate reactor were investigated with the instruments presented. The findings were obtained using a product suite that solves the partial differential equations using the FEM. The plot results of the numerical simulation of dual pins to the plate corona discharge reactor at various ambient temperatures of 25, 24.85, 40, and 30 °C, are shown in
Figure 7.
Figure 7a shows that the shaded plots of the potential distributions in the region of the high-voltage electrodes are thick with a rounded form, creating an exceptionally high and consistent electric field around the electrodes, and thin with a circular form while moving near the ground plate. The most remarkable voltage appropriation thickness is moved in the zone near the corona electrodes. Thus, the dynamic species accomplish most of their charge in this zone, acting toward the grounded gathering plates, as shown. The space charge density distribution is presented in
Figure 7b. The charge density of species is concentrated in the air gap region above the polluted water and inside the interference between the wastewater and air interface. The graph shows that no electrical field is present inside the rod. However, the electrical field is at its greatest strength or Emax at the tip of the rod. The field lines have a considerable influence on corona discharge plasma formation, as shown in
Figure 7c. The electric field must be strong enough to create electrons from all types of collisions and produce the chain reaction (photoionization, ionization, and electron emission from cathode). In addition, the electric field accelerates the active radical species in the gap between two conductors, avoiding the recombination of electrons and ions. The 2D simulation approach was employed to determine the electric field intensity in the reactor. The figure shows the electric potential conveyance in x = 0 plane of the corona discharge plasma reactor if the conductor electrode is energized with a voltage of 15 kV. The energy density distribution is presented in
Figure 7d. The influence of the varying water temperatures between two corona electrodes from 278 K to 358 K on the greatest electric field measured near the point of high-voltage conductors was examined.
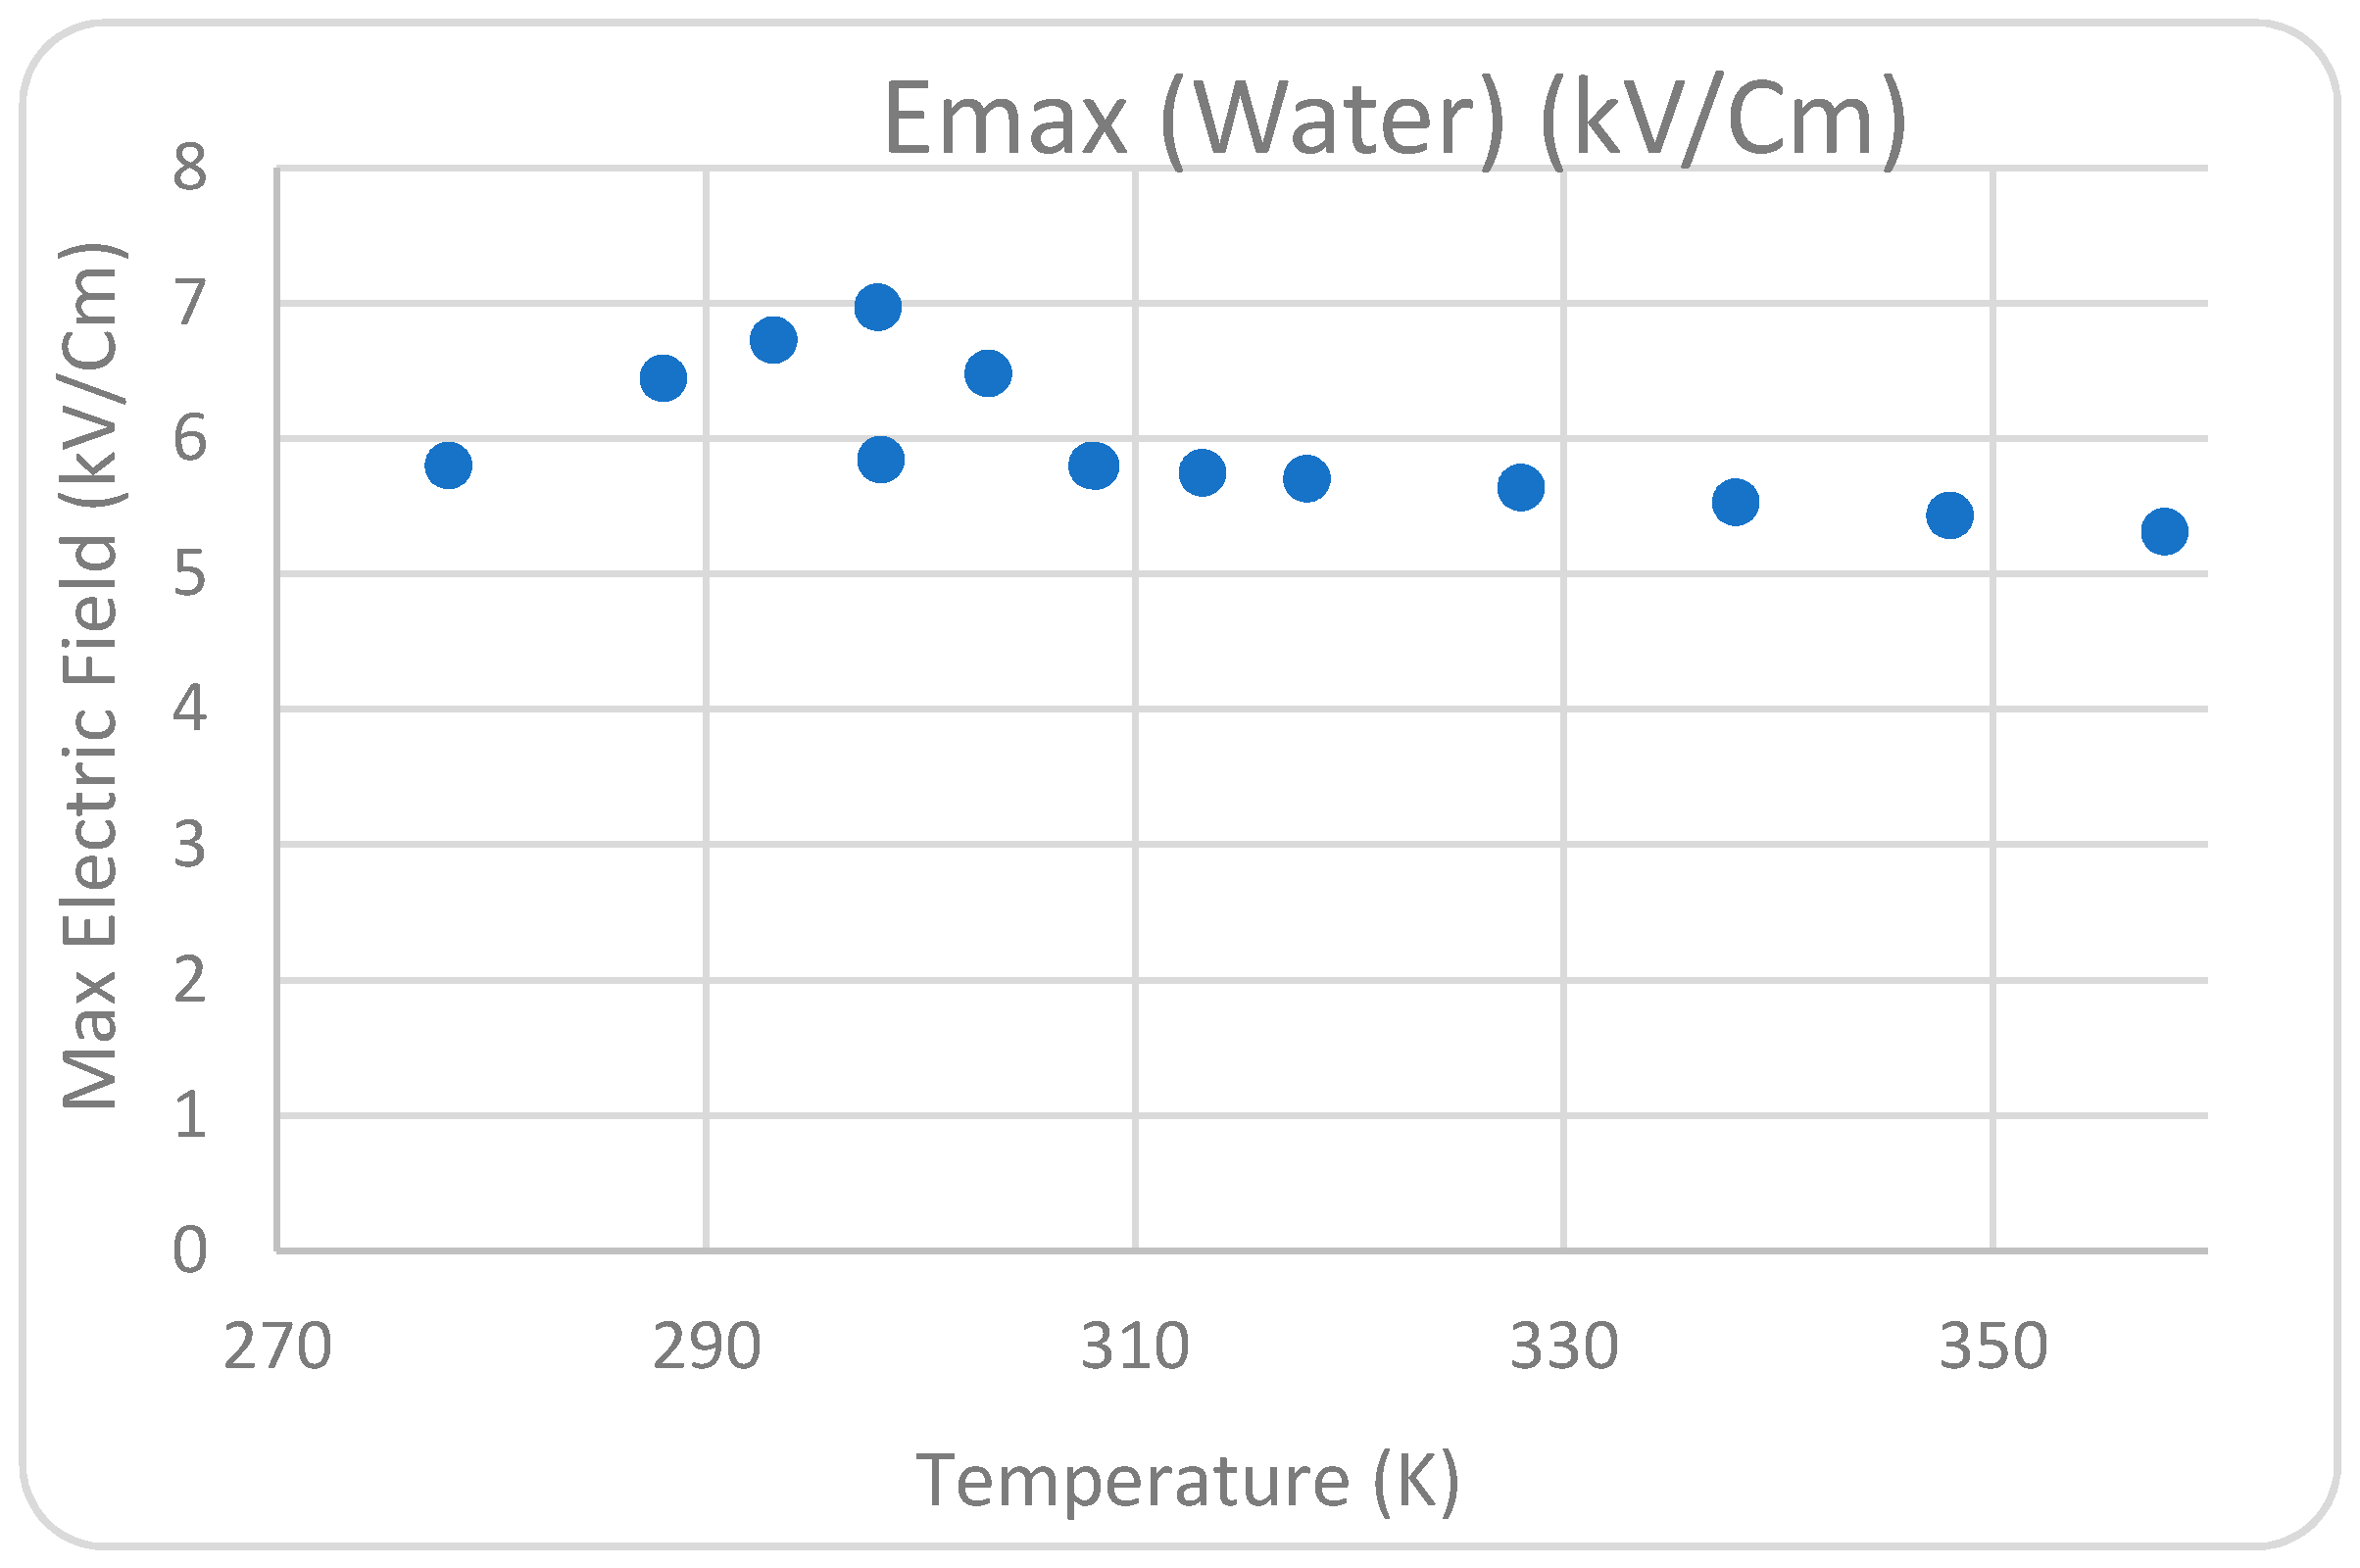
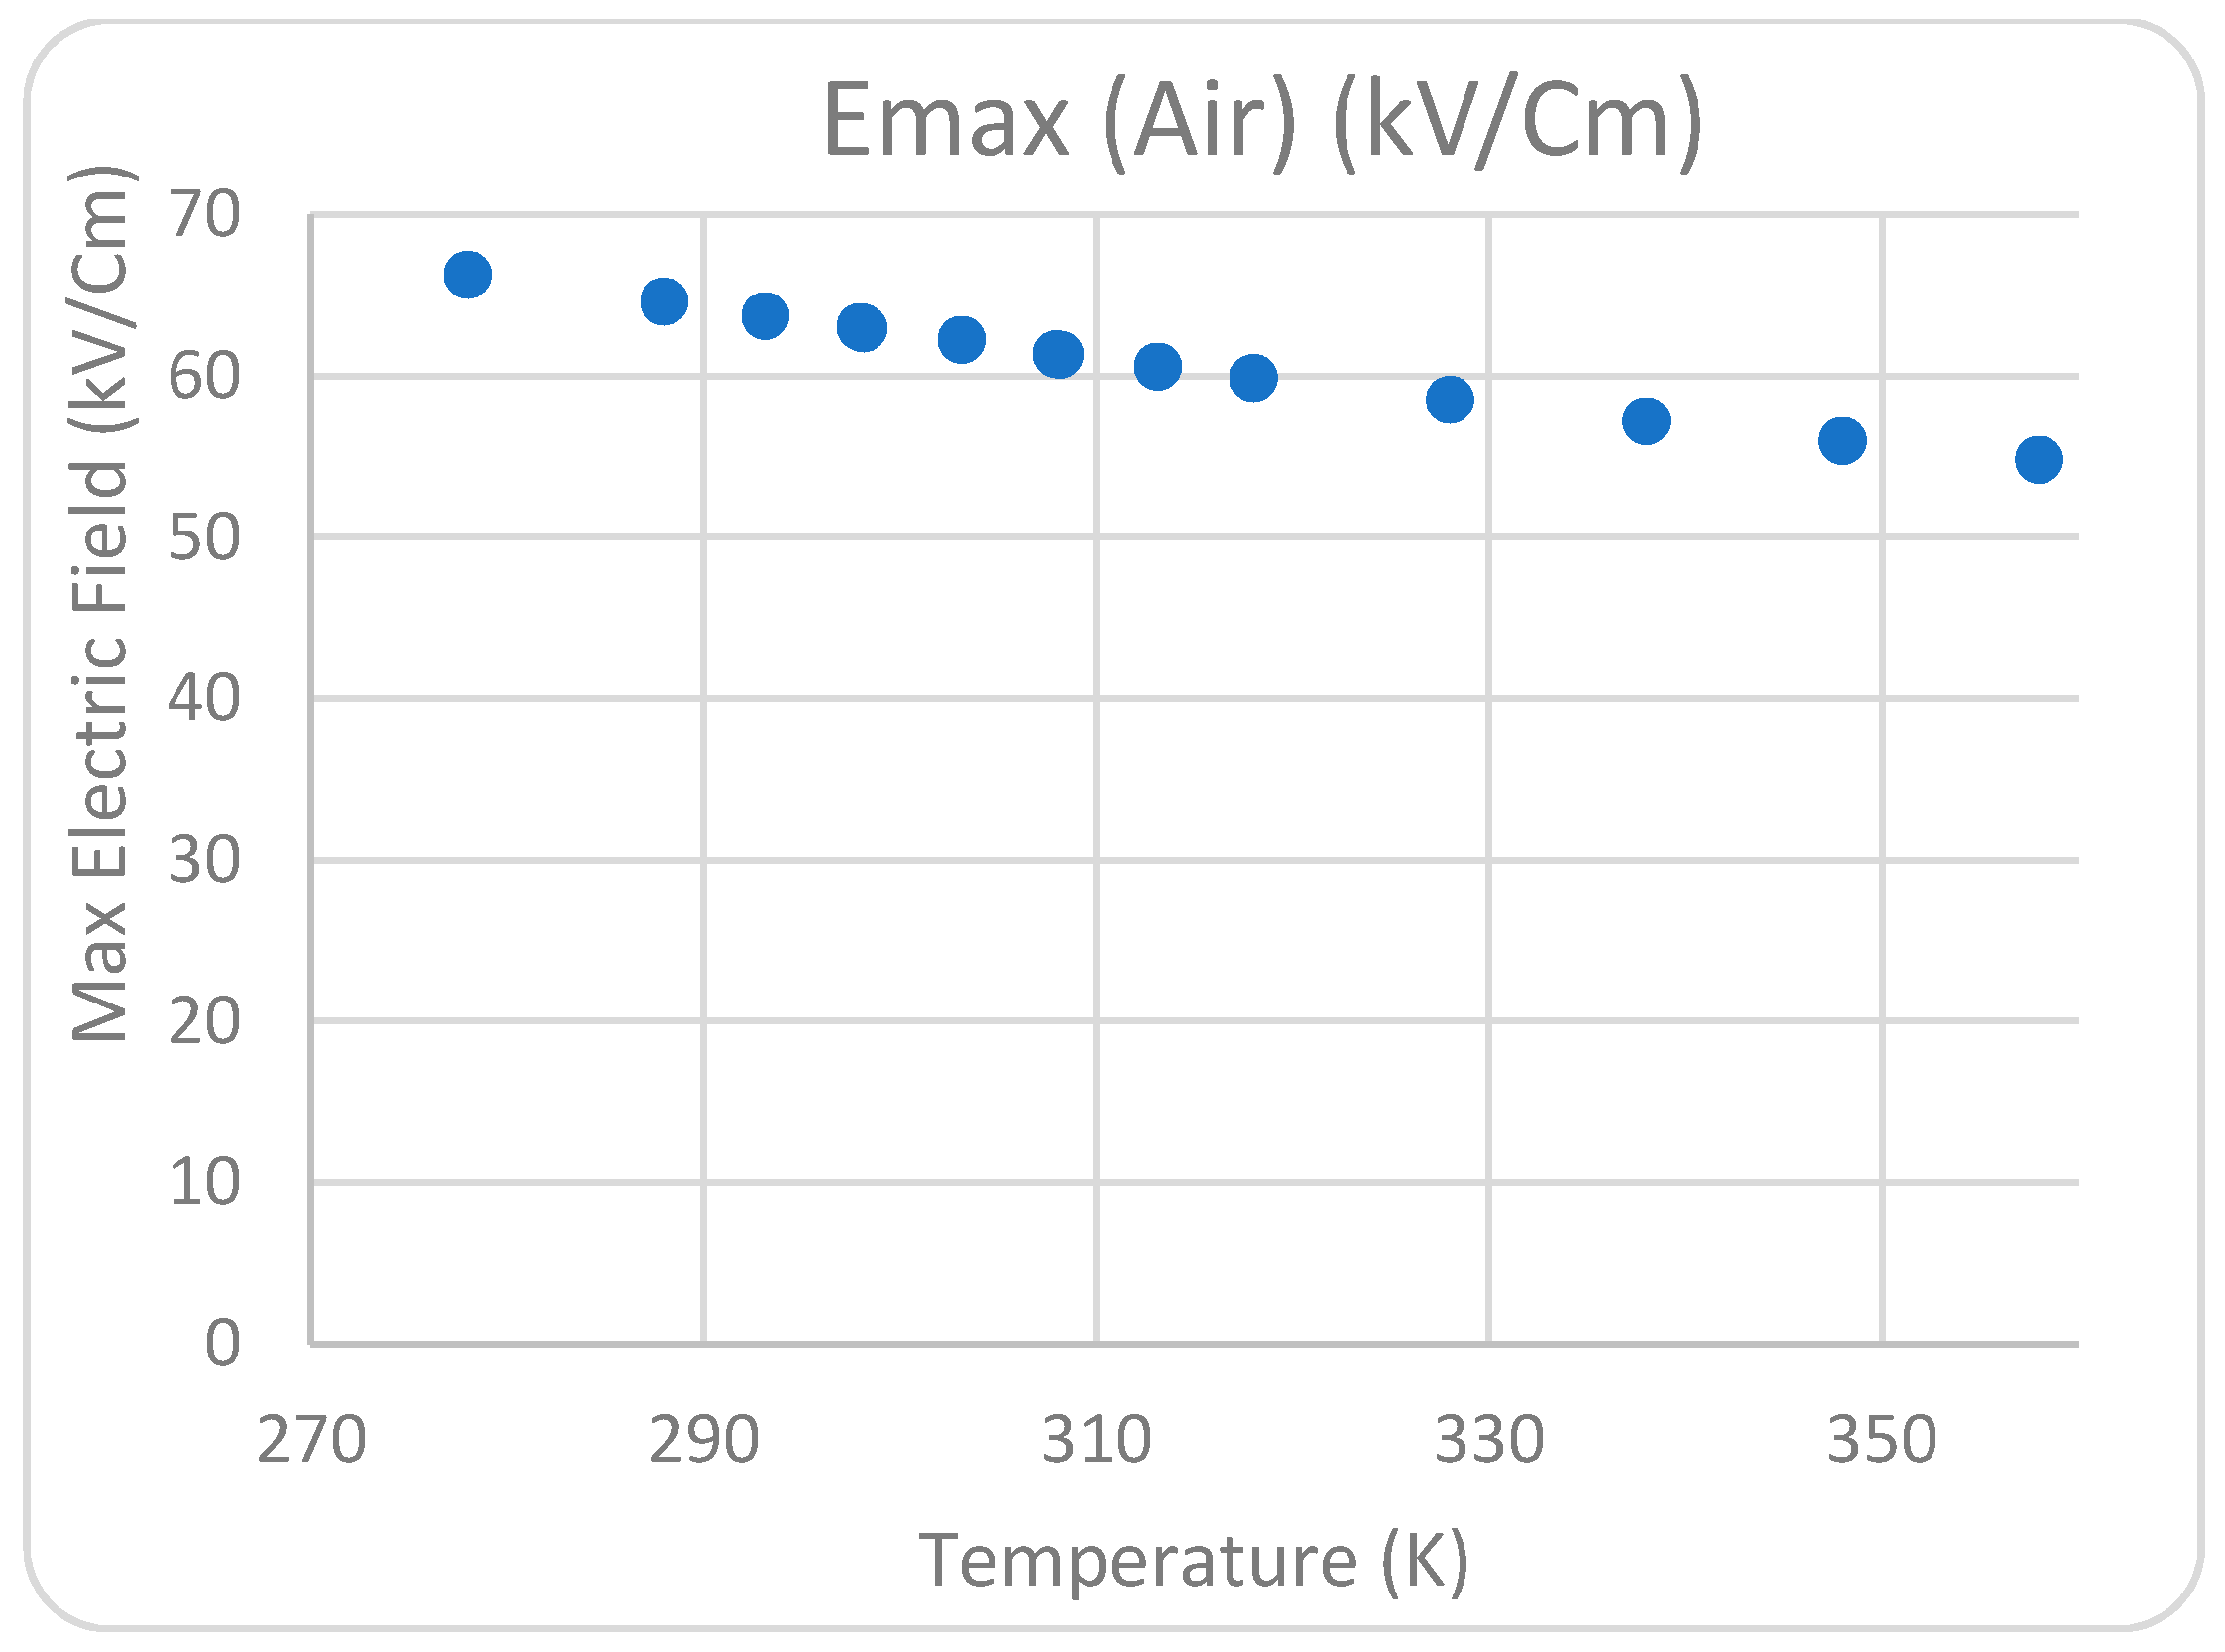
Figure 8,
Figure 9,
Figure 10 and
Figure 11 show that the temperature satisfies the space charge density and the maximum field intensity in the air and water regions. The position of the maximum point of the electric field at the tip of the pin conductor is the same for all cases at each analyzed decolorization period. The electric field surrounding the sharp pins has a high value when compared with the rest of the system, indicating that that location can be a plasma region with a high corona discharge. This conclusion is consistent with the experimental work conducted to investigate the influence of temperature on dye removal from polluted water. According to the 2D simulation model conclusions, the optimal water solution temperature between the high-voltage and ground conductors for considerable corona discharge is 298 K.
The electrical field lines were investigated closely to observe their distribution and understand further what happens during the energization of a material. A corona discharge can occur by applying a voltage to a rod above a plane. The corona is affected by the radius of curvature. The rod with a slight curve has a high concentration of corona plasma. The corona decreases or becomes nonexistent by applying the same voltage to a rod with a large radius curvature. The ionization region increases by growing the potential on the rod, and the corona becomes considerably visible. If the voltage is increased further, the air between the rod and the plane can break down.
3.3. Arrhenius Equation Applied in Analyzing the Influence of Temperature in Polluted Water
Chemical reactions occur quickly at high temperatures. The reason behind this observation is not complex. Thermal energy has a strong relation to movement at the atomic level. As the temperature increases, molecules transfer quickly and collide aggressively, incredibly improving the probability of bond cleavages and rearrangements. Chemical reactions are predicted to proceed quickly at high temperatures and slowly at low temperatures [
26,
27,
28]. Arrhenius equation is a model for temperature-dependent reaction rates. Svante Arrhenius, Father of Physical Chemistry, presented a mathematical statement in 1889. He recommended such an equation for the rates of forward and reverse responses. Arrhenius provided physical evidence and an understanding of an experimental relationship. It can be utilized to display the temperature variety of diffusion coefficients and other numerous thermally actuated procedures/reactions [
21,
22,
23,
24]. The activation energy,
Ea is the lowest energy that the molecules need to react and generate a product. The slope of the Arrhenius plot may be used to calculate the activation energy. Arrhenius relation depends on collision theory. It expresses that particles must collide with enough energy and in a suitable direction. The actuation energy and preexponential factor are obtained from the Arrhenius plot. Thus, the rate, steady at any temperature utilizing the Arrhenius equation, can be unraveled. Equations (6) and (7) are used to define the Arrhenius equation.
where
K is the rate of the reaction,
A0 is the factor of the frequency,
R is the ideal gas constant (8.314 J/(mol K)),
Ea is activation energy, and T is the temperature (Kelvin). Studying the influence of temperature on the color removal of polluted water with Acid Blue 25 dyes is vital in real industrial applications at high temperatures. Thus, the major purpose of this research is to investigate the effect of rate reactions on the decay of Acid Blue 25 dyes from wastewater as a function of solution temperature, utilizing a dual pin-to-plate corona discharge plasma reactor. In this work, the temperature of the Acid Blue 25 solution is sustained constantly.
Figure 6 indicates that the initial dye concentration is reduced with the increase in dye solution temperature from 278 K to 308 K.
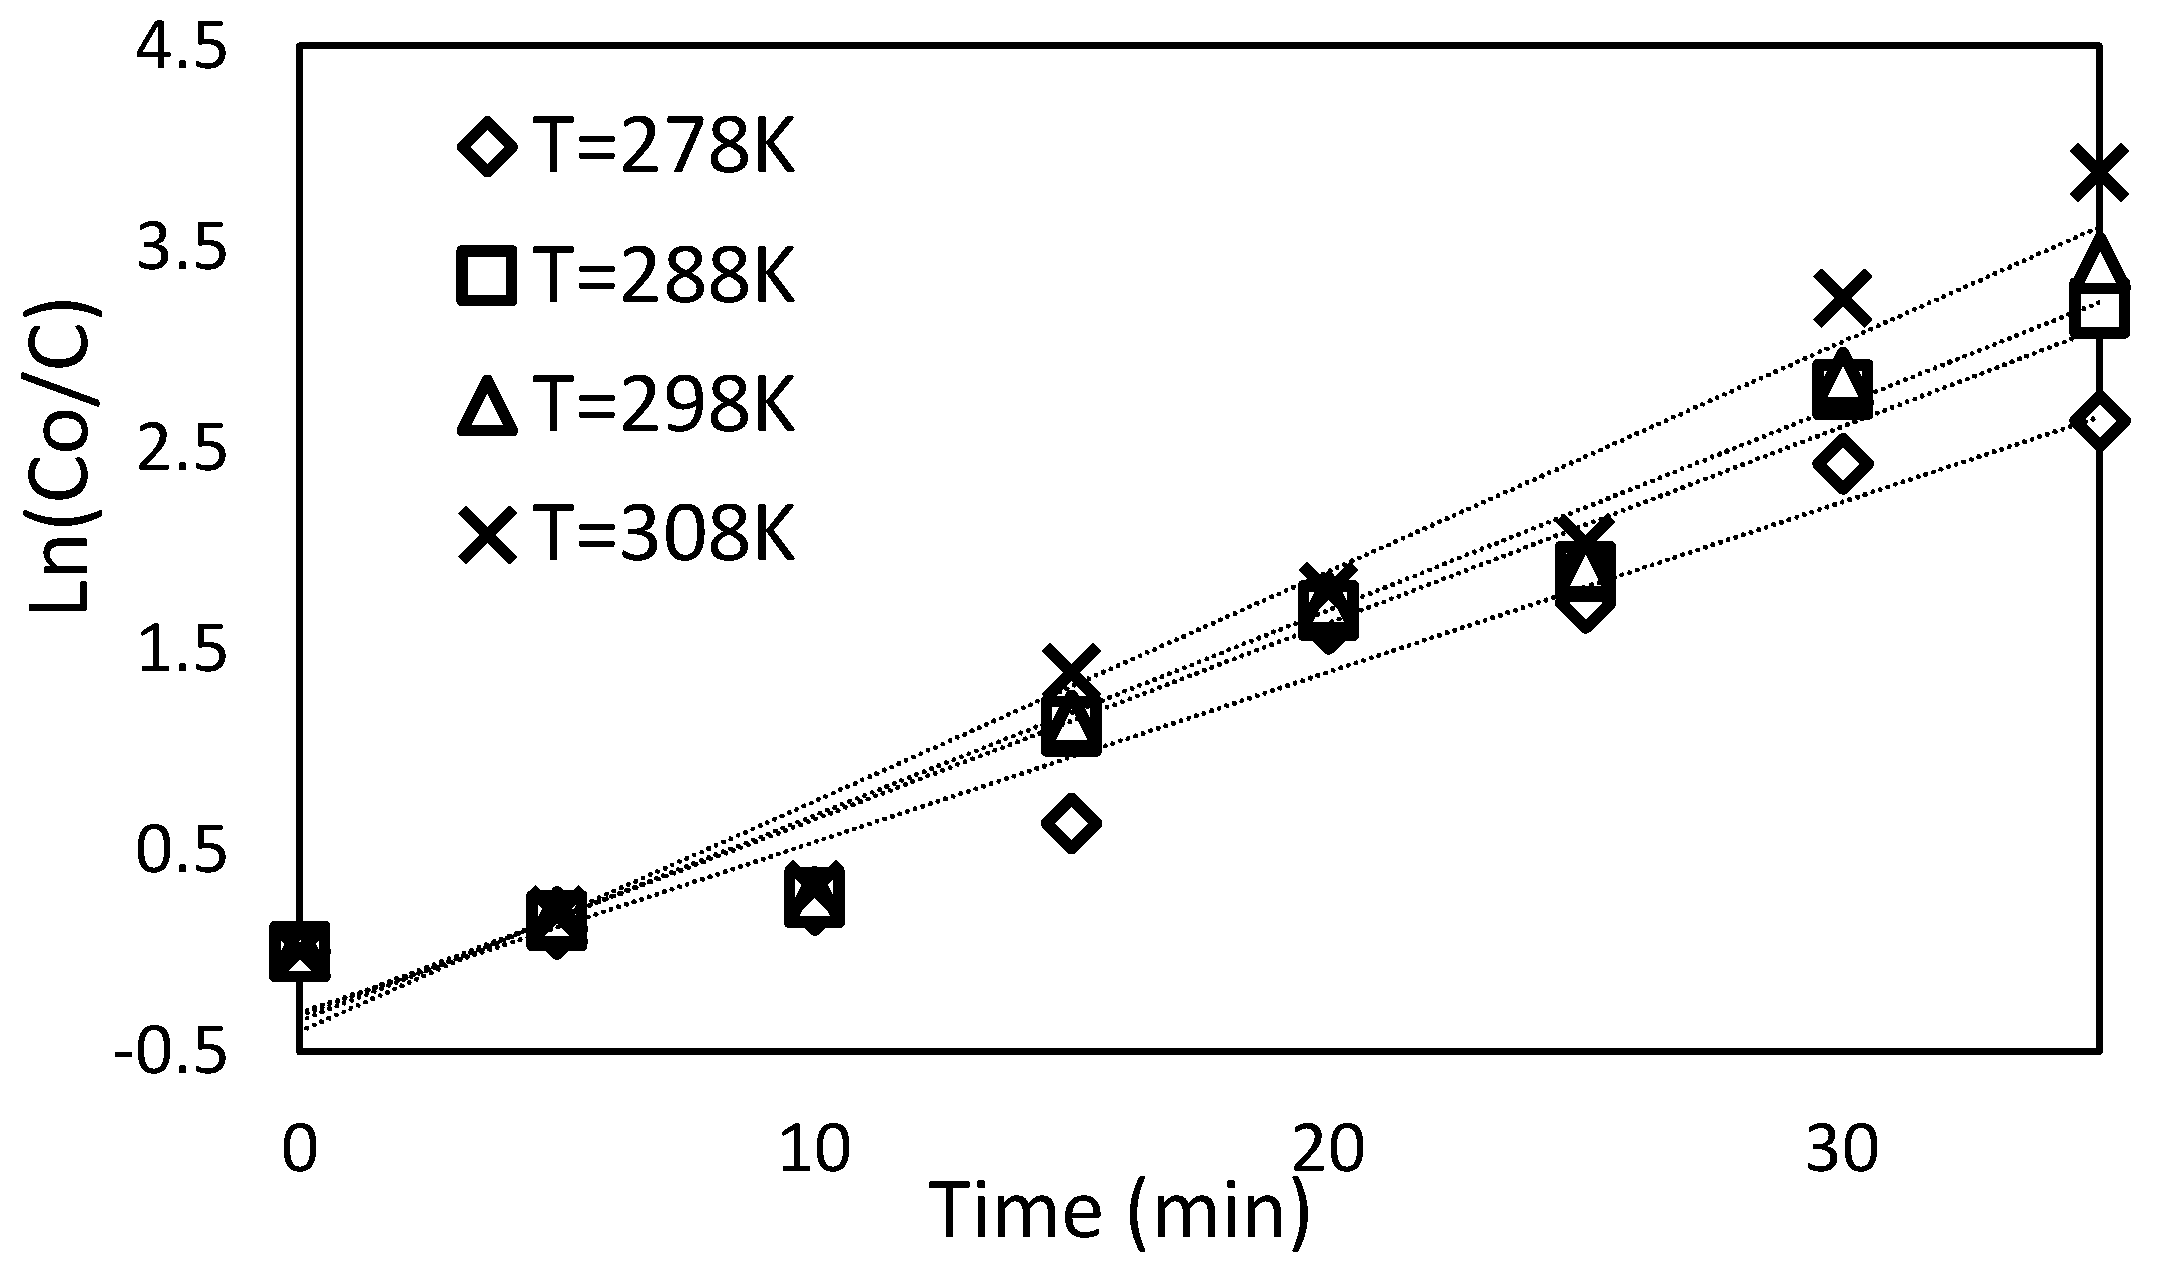
Figure 12 shows the relation between the ratio of concentration and time for different solution temperatures from 278 K to 308 K. The Ln (
K) plot with the (1/
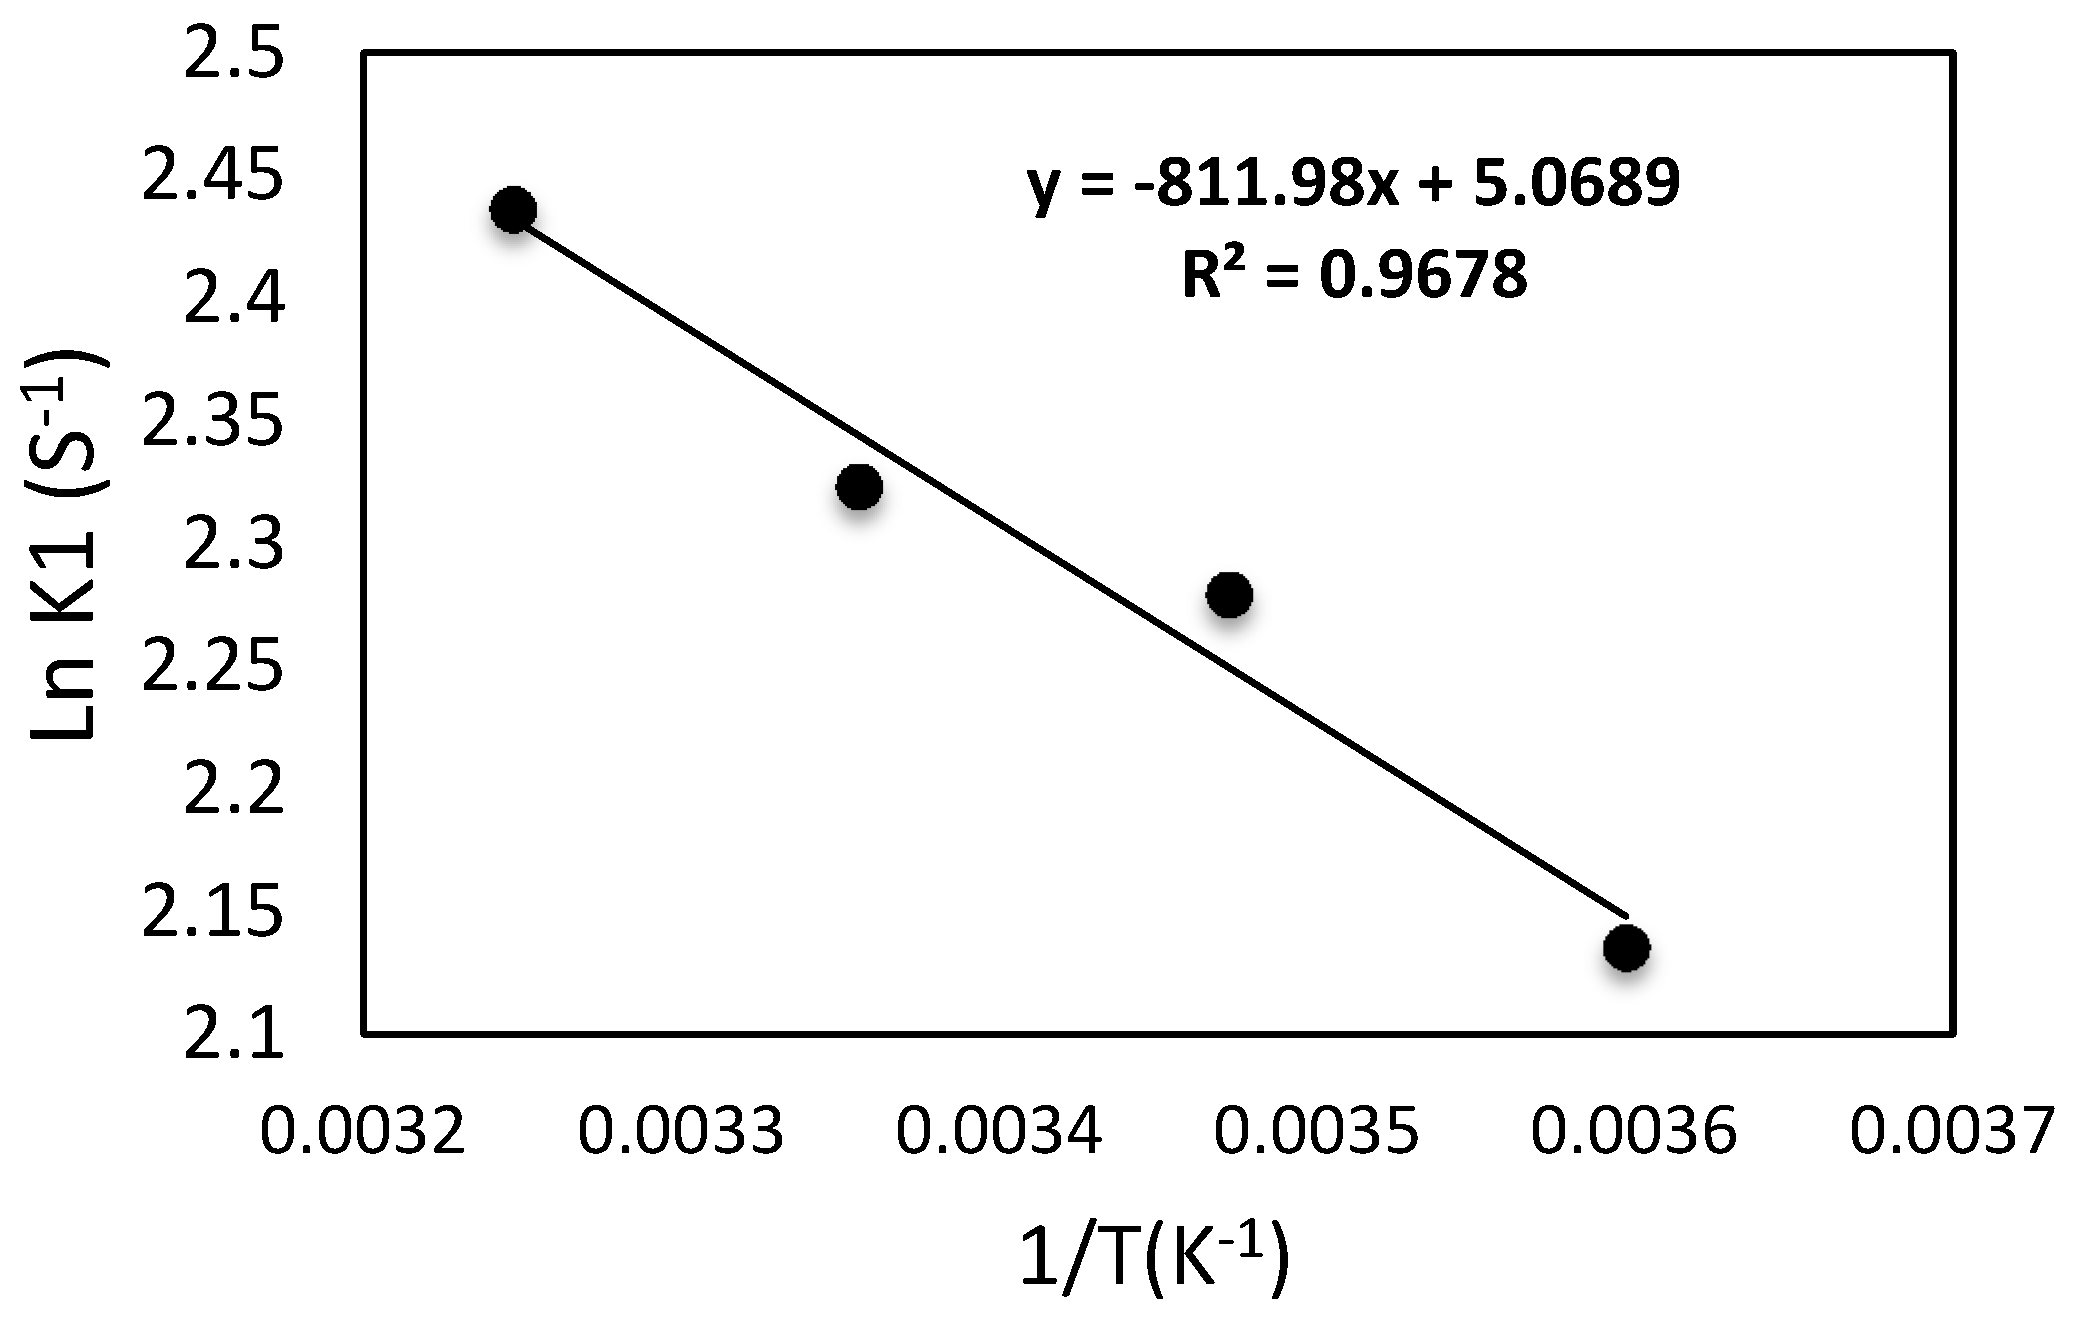
T) is presented as a straight line by applying the Arrhenius equation because of the natural logarithm, as exposed in
Figure 13 and
Figure 14. Therefore, the activation energy may be simply estimated using the line’s slope = −(
Ea/
R) and then
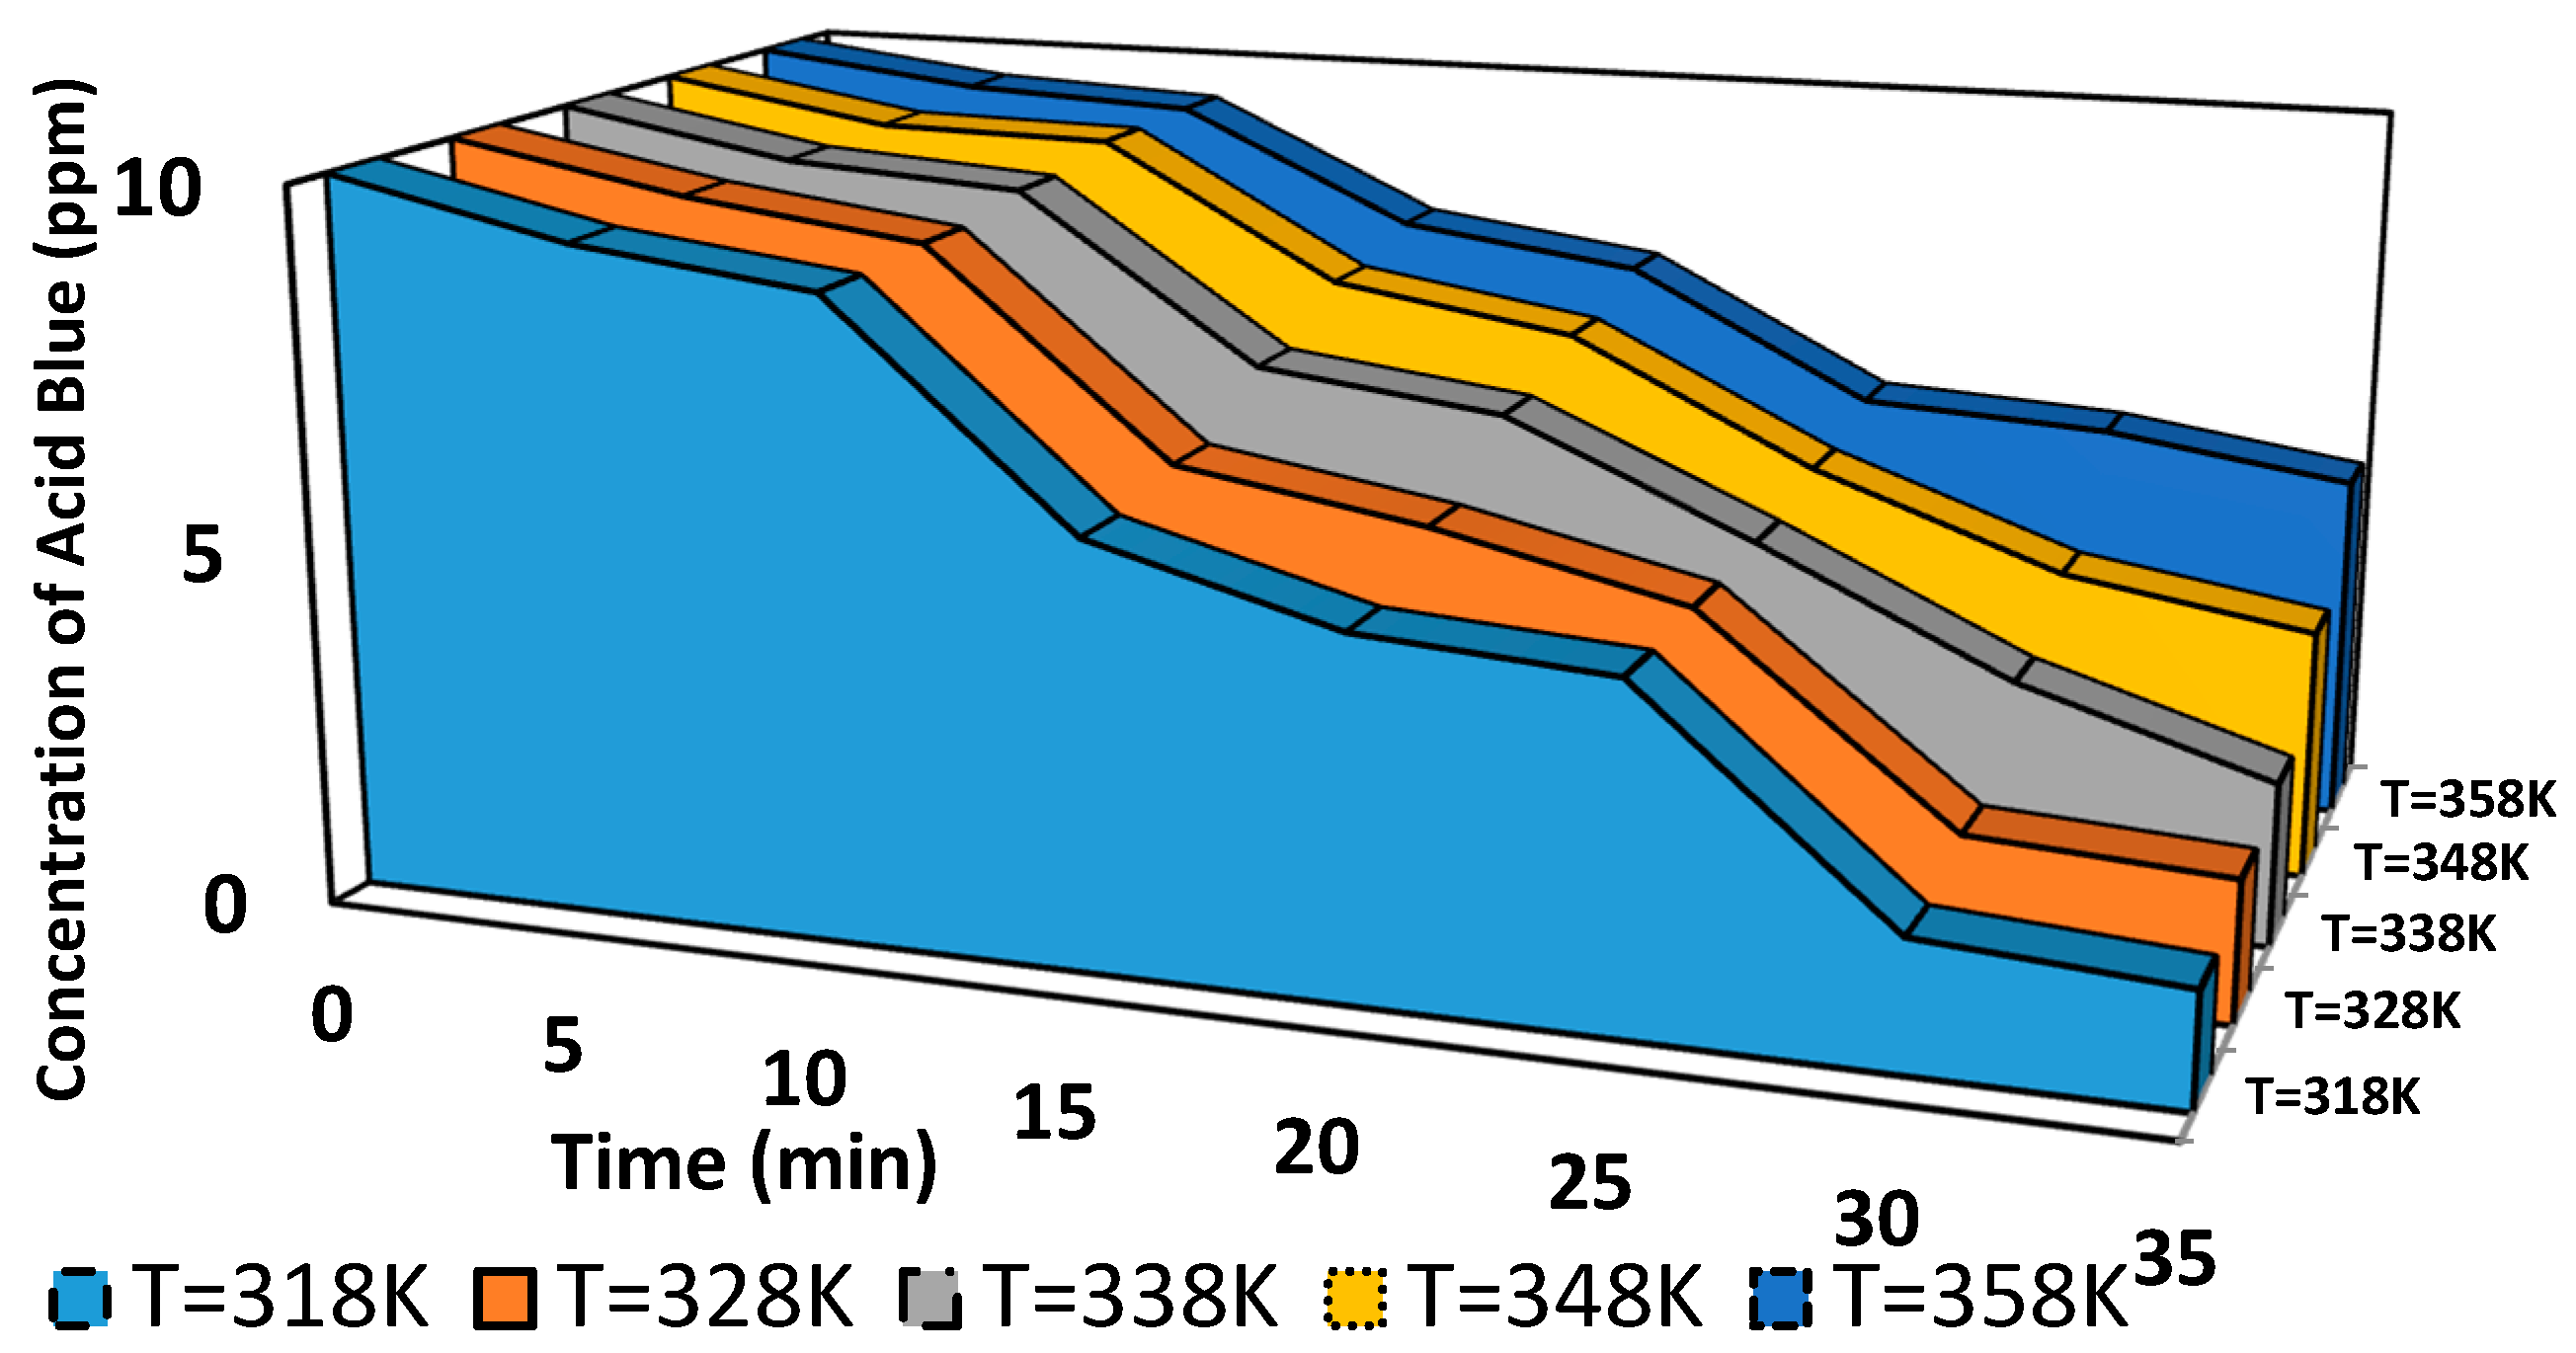
Ea = 6.750 kJ/(mol K). On the contrary, an opposite behavior is detected at a temperature higher than 308 K. The initial dye concentration is reduced by lowering the dye solution temperature from 318 K to 358 K, as shown in
Figure 15.
This behavior may be related to the fact that the temperature affects the generation of ozone and active radicals through its properties on chemical reaction rates, transport properties, and thermodynamics.
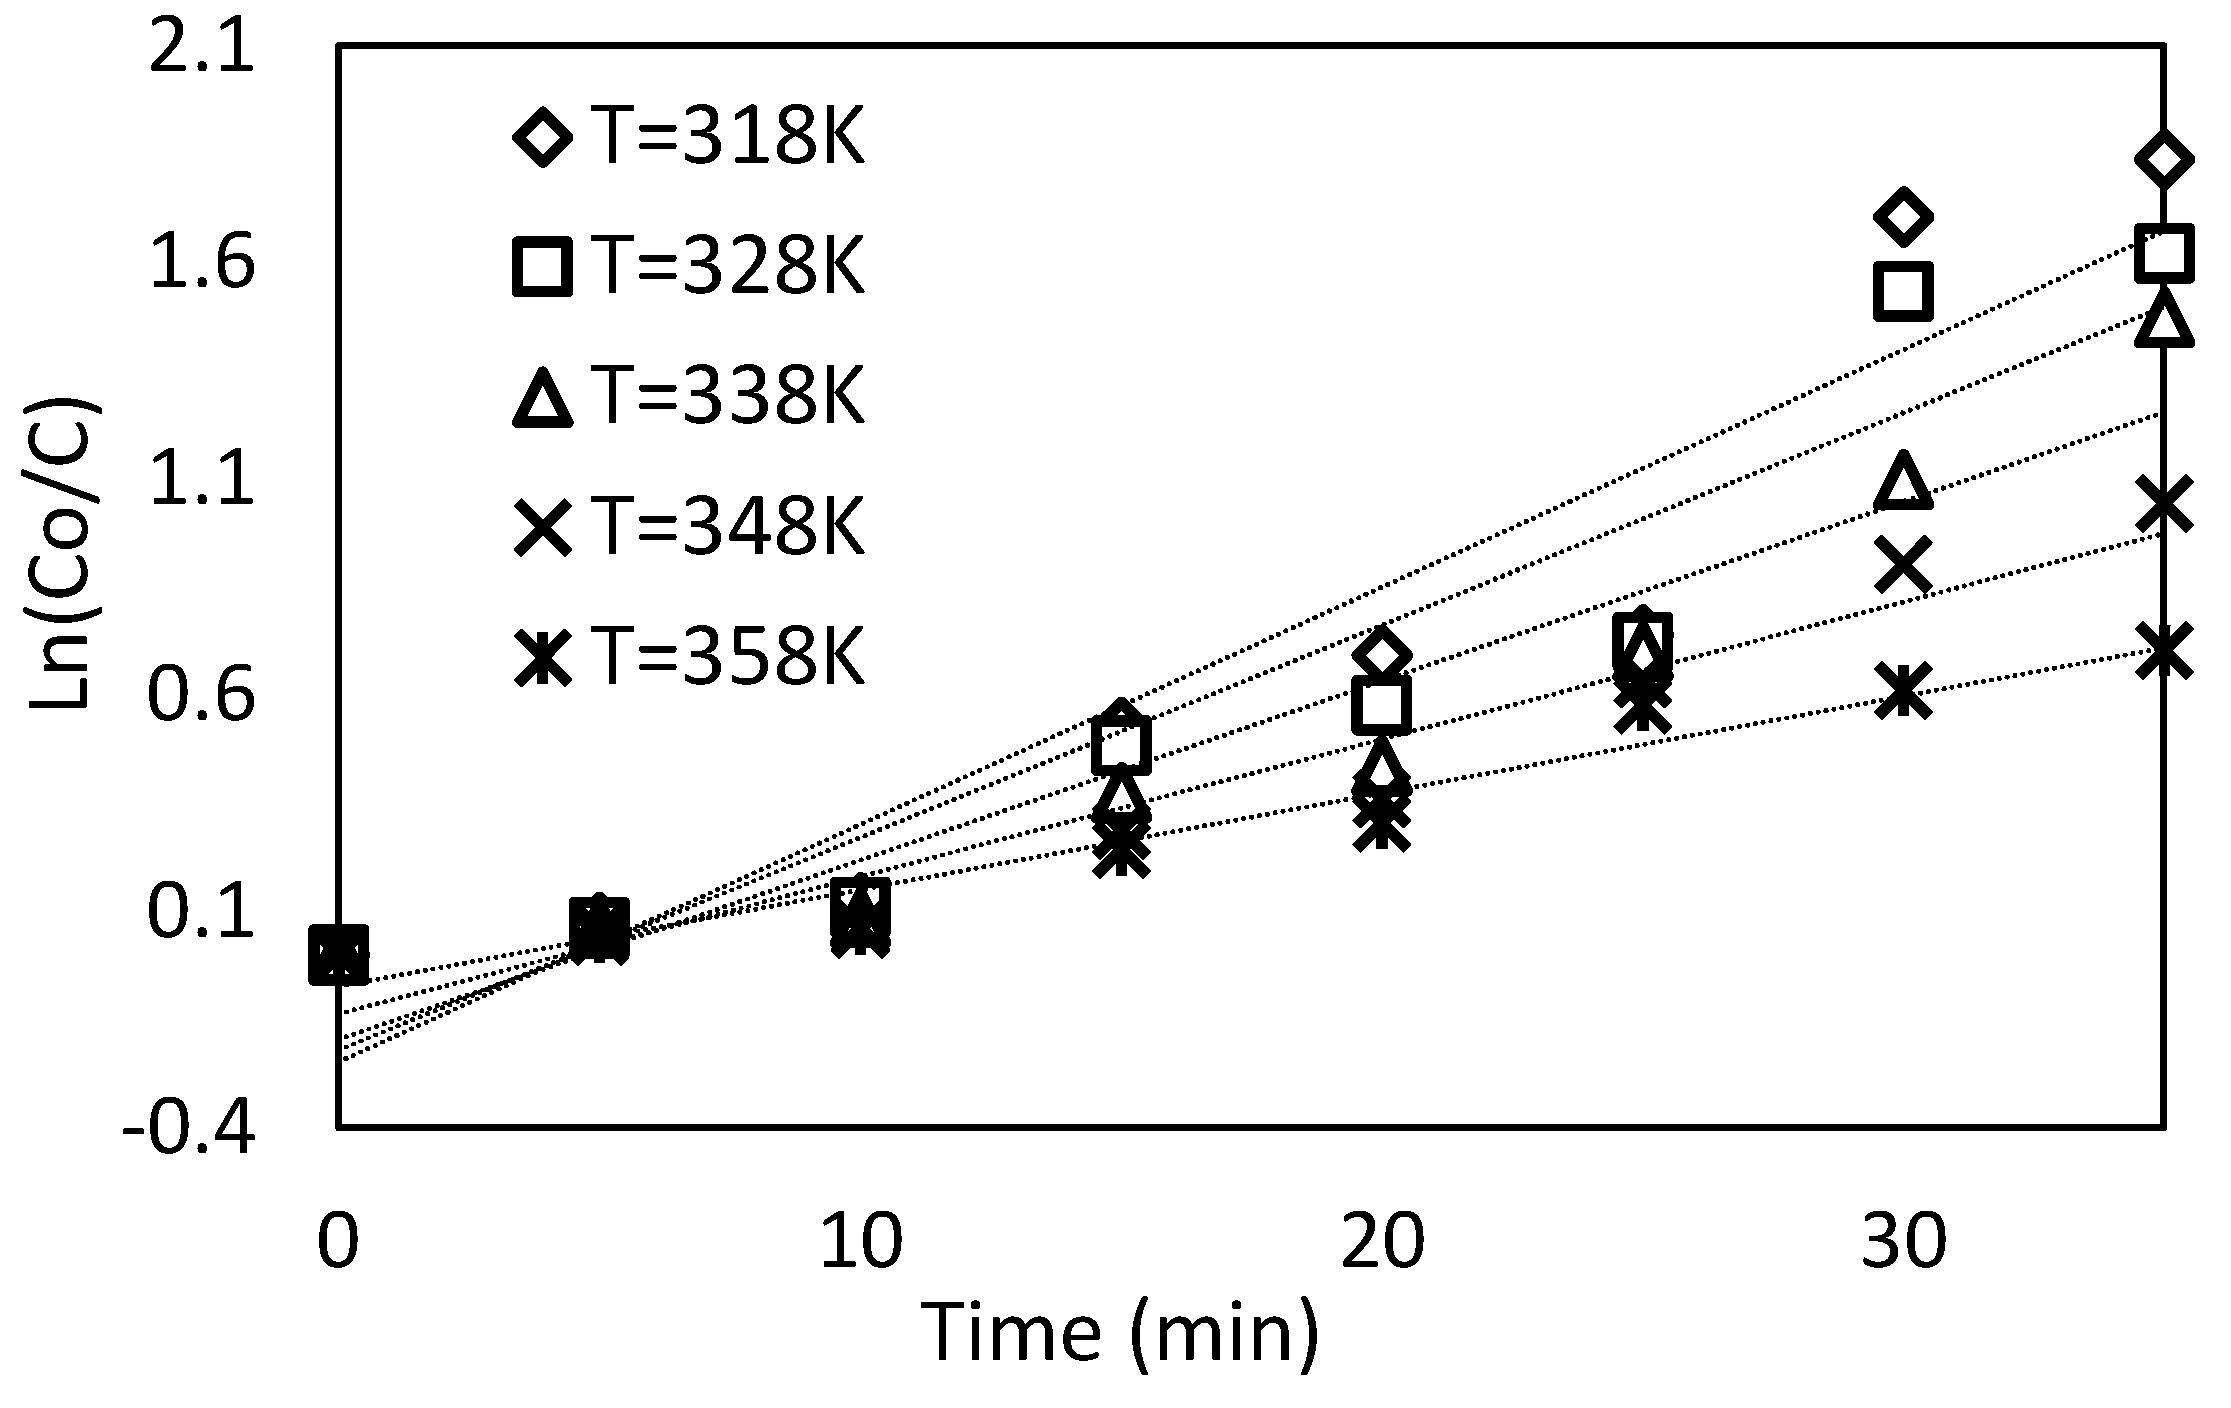
Figure 15 shows the relation between the ratio of concentration and time for different solution temperatures from 318 K to 358 K. The Ln (K) plot with the (1/T) presents a straight line by applying the Arrhenius equation because it is taking the natural logarithm as exposed. The activation energy may be simply estimated using the line’s slope = −(
Ea/
R) and then
Ea = −20.94 kJ/(mol K).
The activation energy of the reactions is very little, as seen in
Figure 16 and
Figure 17. For this situation, the primary component affecting reaction rate stability may not only be the temperature, but it may also be the concentration and the life of chemical radicals. An increase in temperature can assist in the removal of dynamic chemical radicals. The negative effect of temperature on dynamic species prompts the decrease in appropriate rate constants. The increased temperature also decreases the short life and dissolvability of active radicals and ozone in polluted water with Acid Blue 25 dye. Any deficiency in the ozone intensity adversely influences the efficiency of the decolorization process. The reaction rates of the degradation of the organic dye under the effect of temperature changes were investigated depending on Arrhenius equation to define the properties of Acid Blue 25 dye temperature in the treatment process. On the one hand, an increase in temperature can accelerate the reaction rate and increase species mobility, resulting in a fast dye degradation rate in the water solution. Moreover, the mean free path of electrons rises when the corona discharge plasma grows with the increase in temperature. Therefore, delivering electrons becomes slightly continuous with inelastic collisions, and few electrons are created. Electrons tend to assimilate considerable energy from the electric field between collisions. On the other hand, expanding temperature quickens the responsive chemical radicals to affect the treatment and prompts extinguishing. Consequently, the dye oxidation rate may diminish. Therefore, [
29,
30] investigated that for oxalic acid degradation via photocatalytic ozonation, the degradation rate of the oxalic acid from the water increases with the increase in the temperature from 283 K to 328 K. Moreover, the degradation rate has a negative influence, and it decreases with the temperature of up to 343 K. In 2004, Ghizdavu studied the degradation for 2,4-dichlorophenoxyacetic acid at different temperatures. As the solution temperature increases from 283 K to 343 K, the decomposition rate of dichloroacetic acid increases from 0.294 mM/h to 0.633 mM/h and then decreases with the temperature increase.
4. Energy Calculation
4.1. Energy Yield
Energy yield is a critical consideration in treatment procedure assessment. It is known as the
G-value, which is the number of pollutant moles ejected from a liquid by 1 J of energy provided to the procedure. For example, Equation (8) was used to determine the energy yield of the surface of the water under the pulsed corona discharge plasma system [
24,
25,
26,
27,
28]:
where
G is energy yield (g/kWh),
V0 is solution volume (L),
C0 is polluted water concentration at
t = 0,
t is time (s), and
P is power (W).
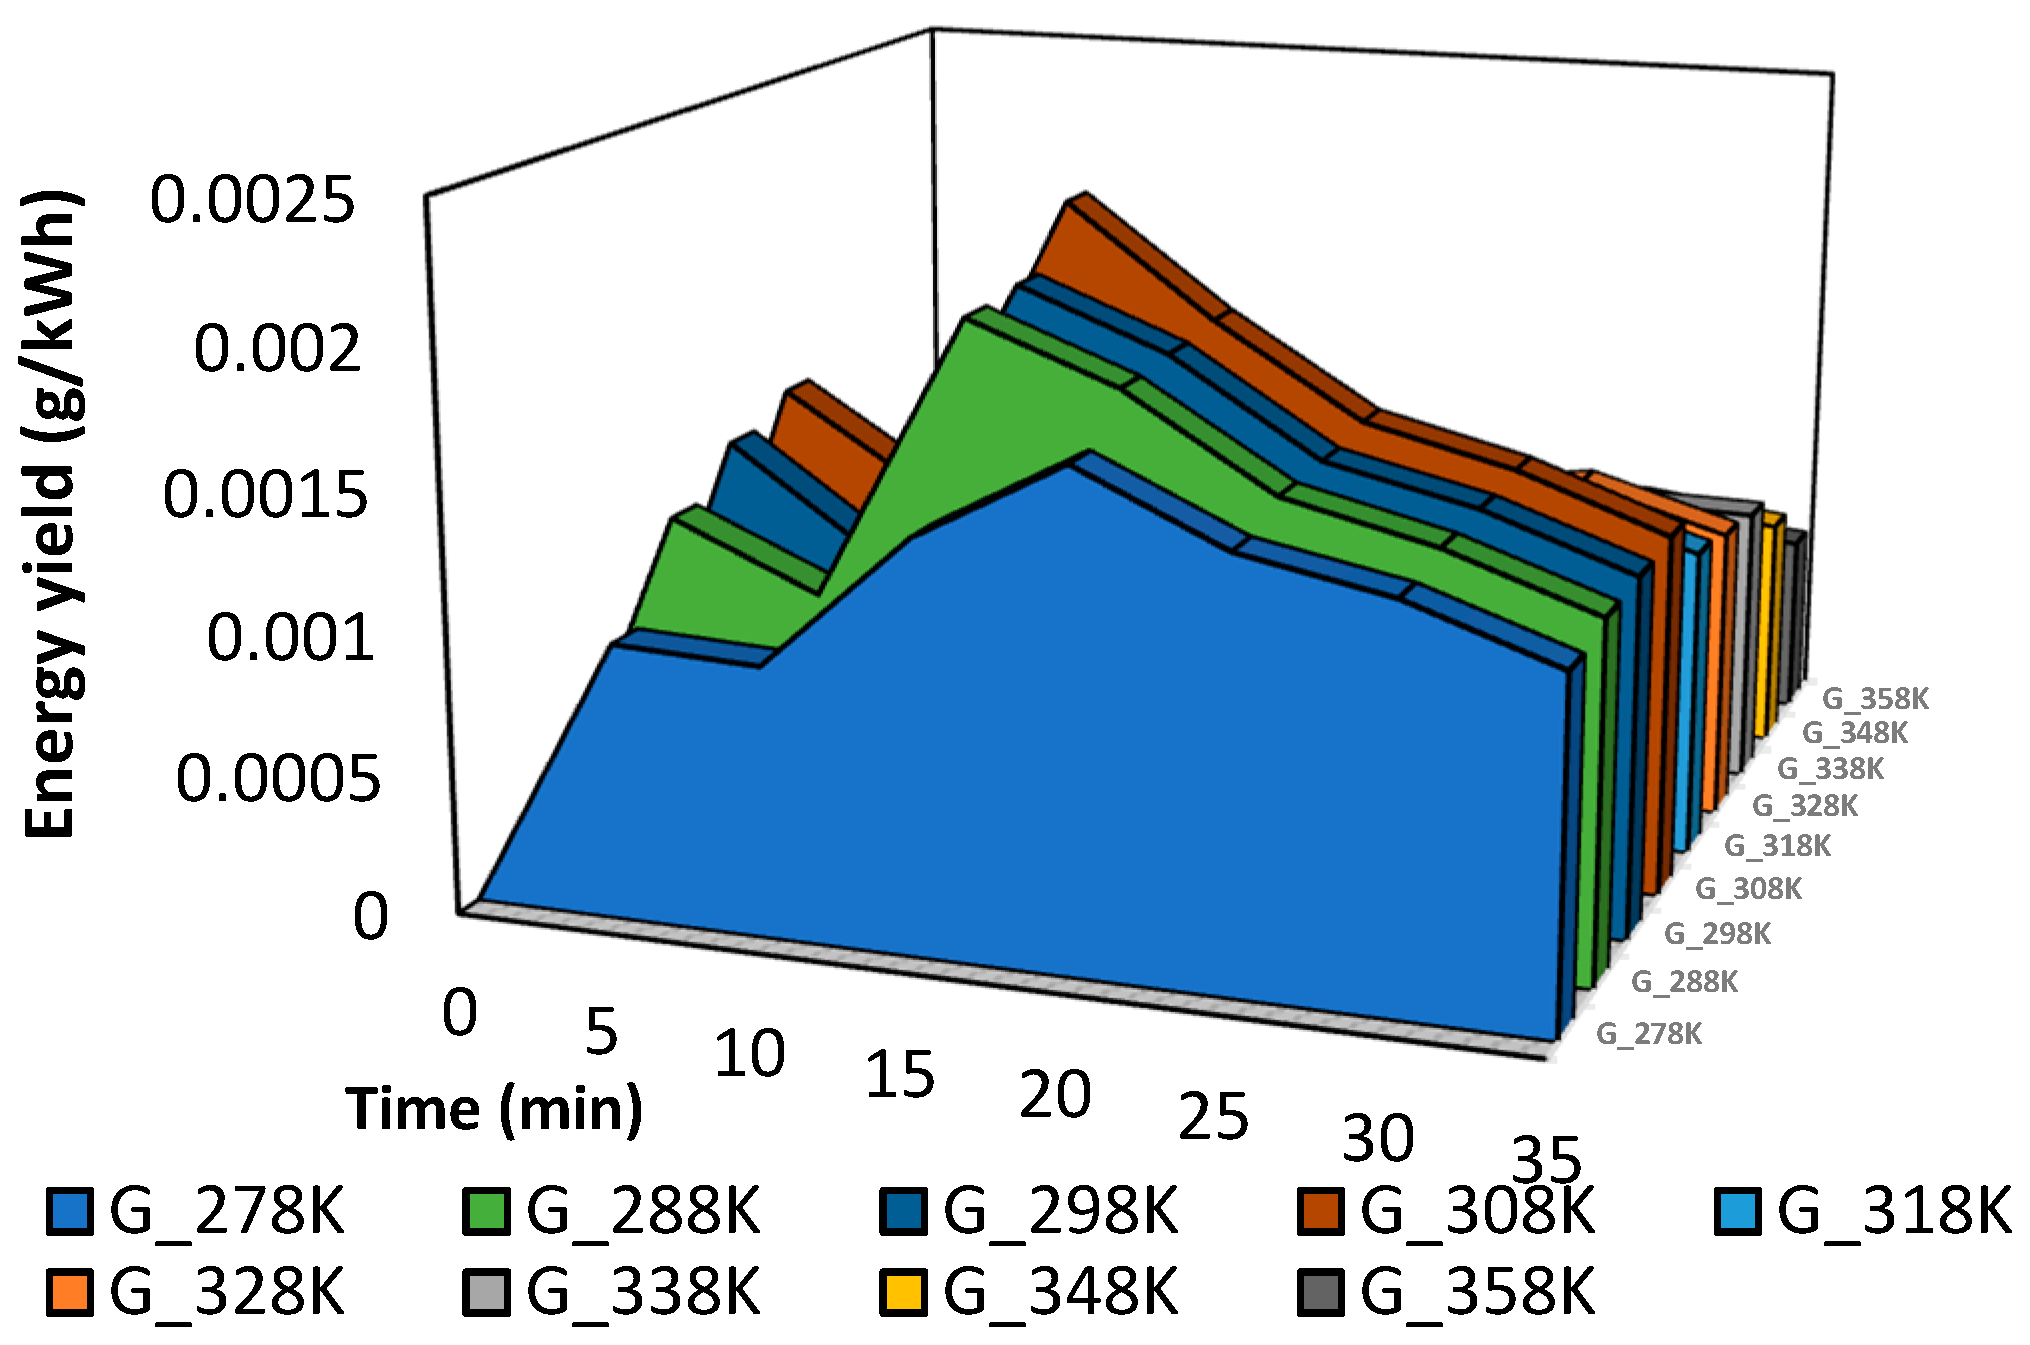
The starting volume of water V0 = 100 mL and the initial concentration C0 = 10 ppm were used to estimate the energy yield. The reactor’s power was computed using the electric voltage and current produced. The power dissipated on the ignition coil, and the electronic circuit was meant to be ignored. Thus, the power used in the release was nearly equal to the power used in the input.
The relationship between time and energy yield (g/kWh) under different temperatures of polluted water with Acid Blue 25 dye is presented in
Figure 18. The energy yield increases with the increase in the temperature from 278 K to 308 K. Then, it is reduced with the increase in the temperature from 318 K to 358 K. In the case of corona discharge plasma hitting liquid surfaces, the energy yields for 50% color removal in 15 min are high, and the best condition can affect hundreds of grams per kilowatt-hour (g/kWh).
4.2. EE/O
The energy yields (g/kW or eV/mol) or the EE/O of greatness reduction is typically used for many chemical degradation processes or oxidation processes as a distinctive evaluation of electrically driven treatment process performance. Independent of the system, the EE/O described in this study provides a direct link to the electrical efficiency (small values mean extra effective process) of an AO process. The EE/O enables a quick definition of energy costs and indicates the total power utilized, which is required for a thorough application. The EE/O is defined as the amount of electrical energy in kilowatt-hours (kWh) required to cause one order of magnitude deterioration or oxidation of a contaminated C in 1 m
3 (1000 L) of polluted water or air. Equation (9) may be fine-tuned to provide EE/O standards (in kWh/m
3) [
25,
26,
27,
28,
29,
30]:
where
P is power (kW),
V is water volume (L),
Ci is initial concentrations (mol L
−1),
T is time
t (min), 1000 is the conversion factor from g to kg, and
Cf is final concentrations (mol L
−1).
Equation (9) was used to compute the EE/O, with the starting quantity of water of
V0 = 100 mL, initial concentration of
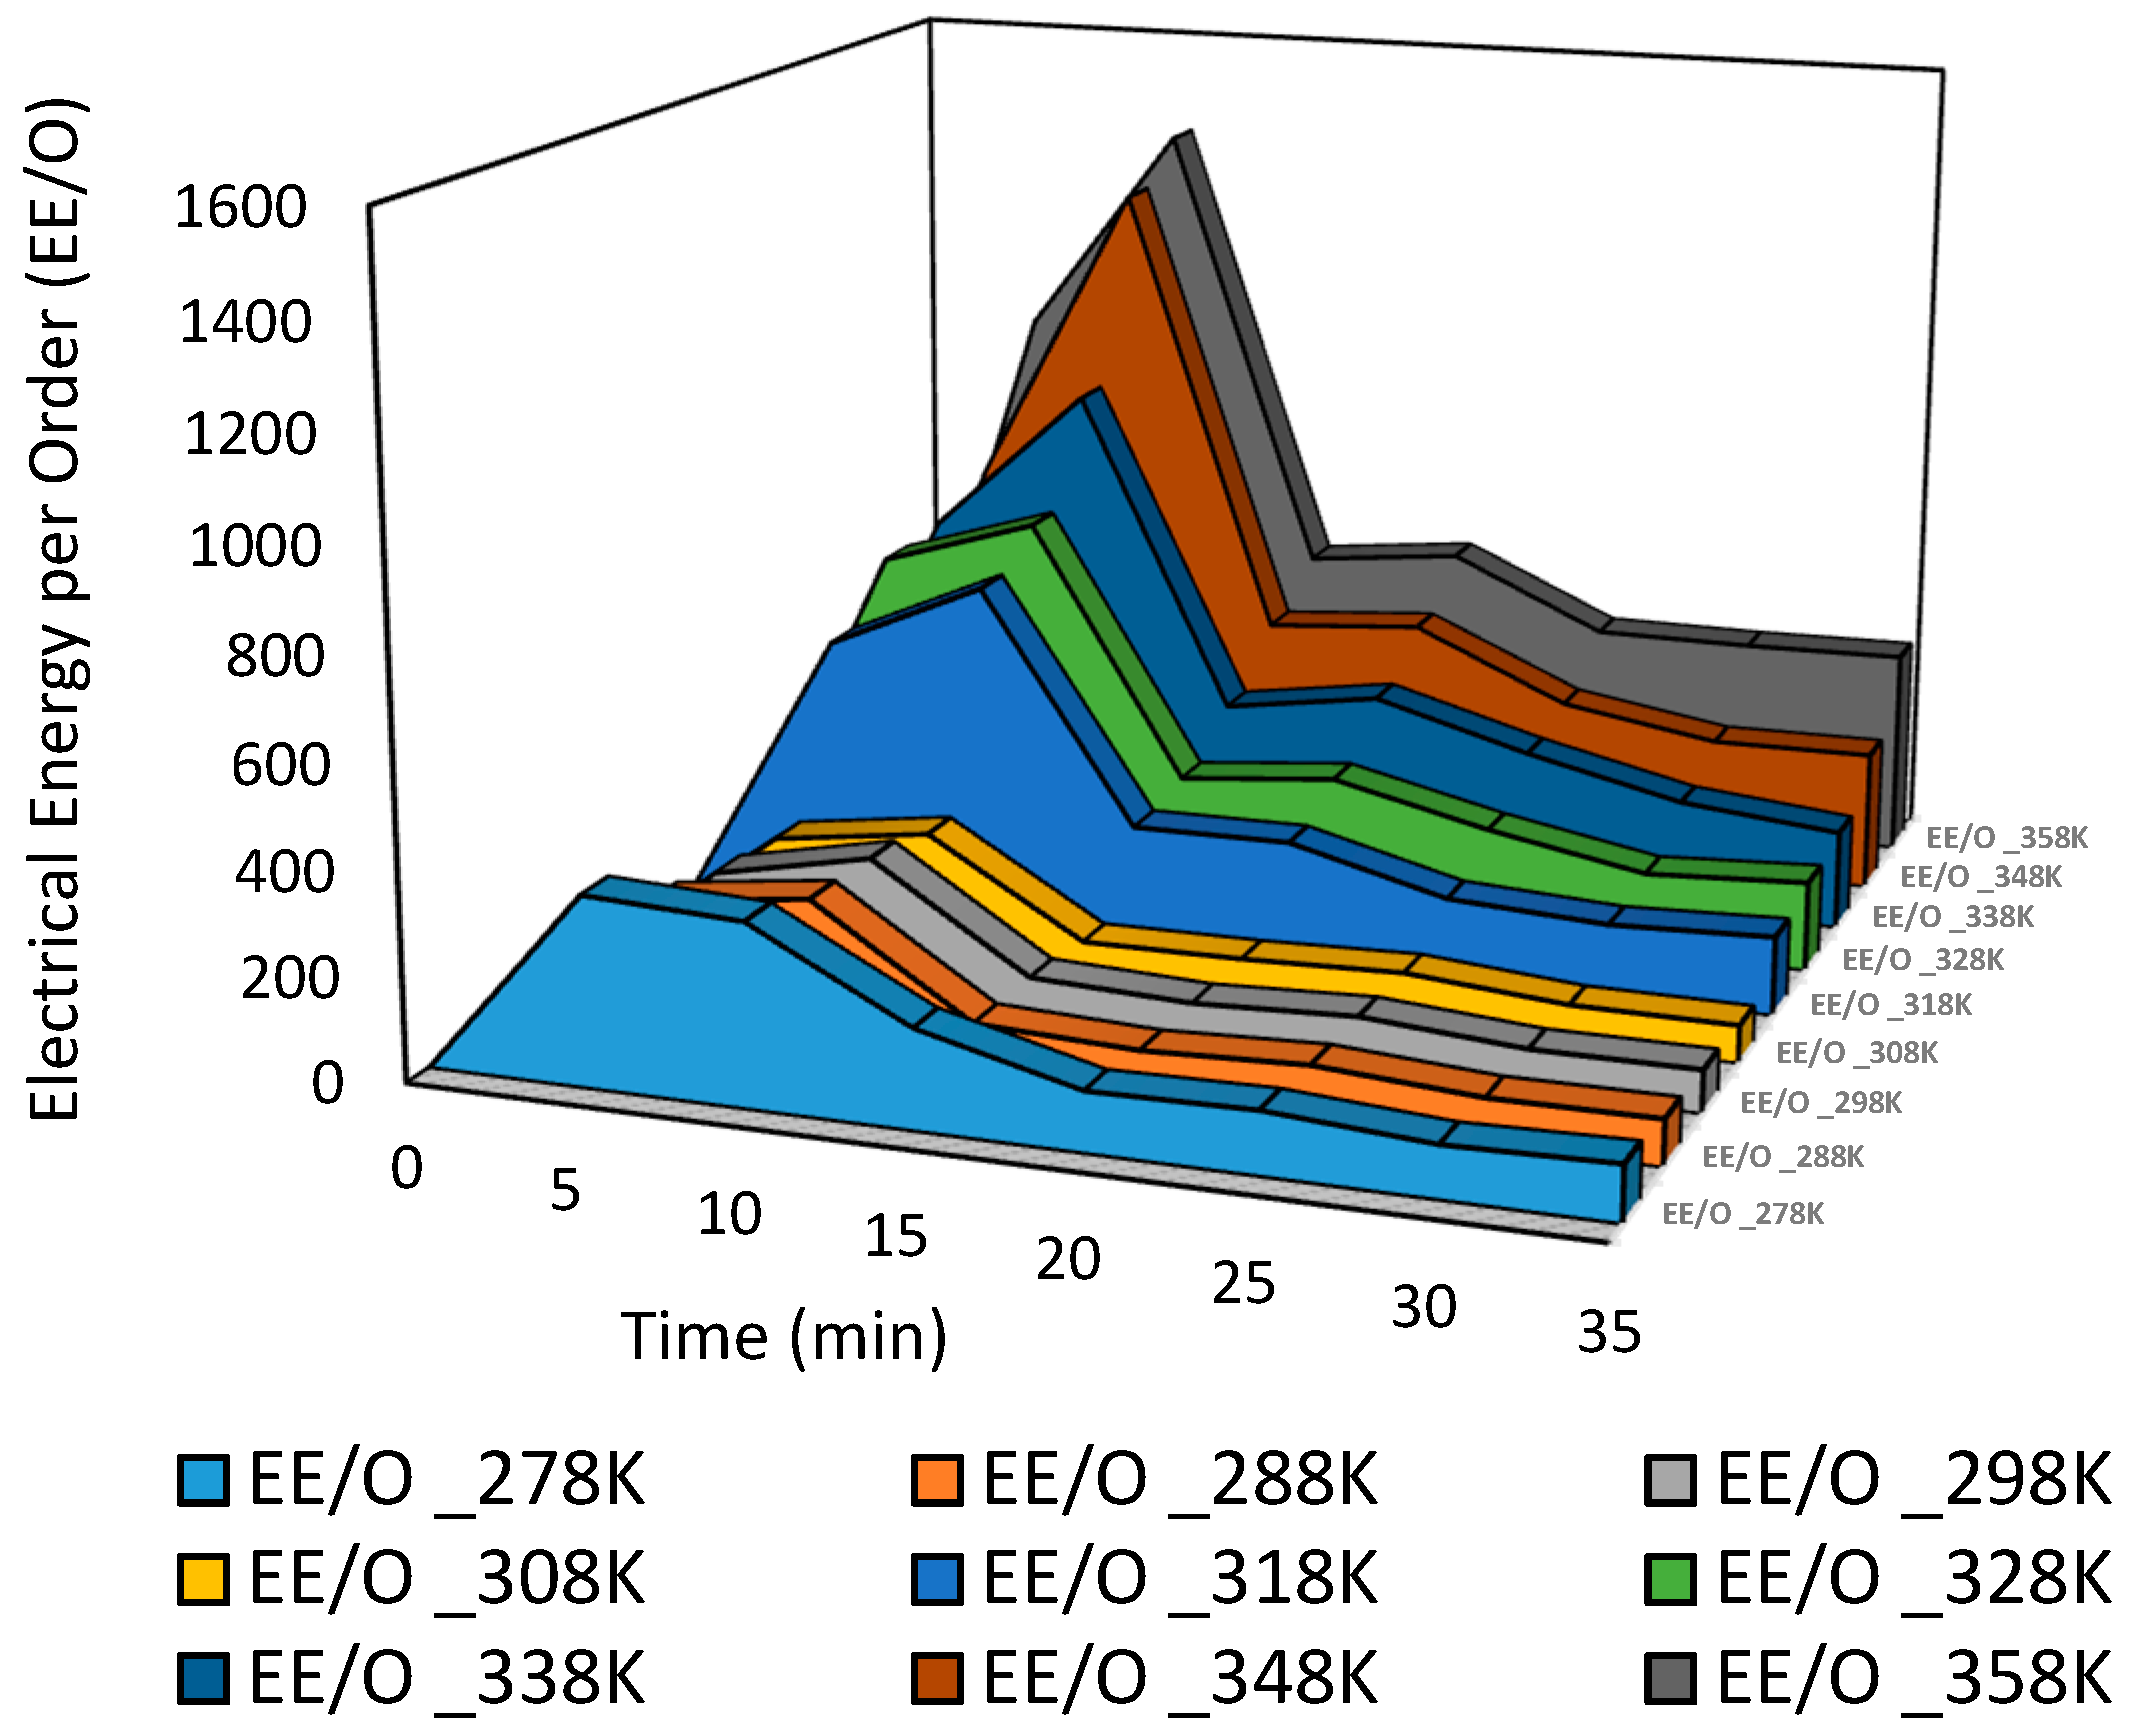
Ci = 10 ppm, the end concentration at each temperature degree, and the reactor power determined from creating the voltage and current. The power dissipated on the ignition coil, and the electronic circuit was meant to be ignored. Thus, the power used in the release was approximately equal to the power input.
Figure 19 depicts the relationship between time and EE/O for polluted water with Acid Blue 25 dye at various temperatures. EE/O increases as the temperature increases from 278 K to 358 K during a 10-min treatment period; then, it steadily decreases. If established, the EE/O provides the industry and potential workers with a standardized objective foundation for assessment. This EE/O is commonly utilized for states with a low early concentration [
30,
31].
5. Kinetics Calculation
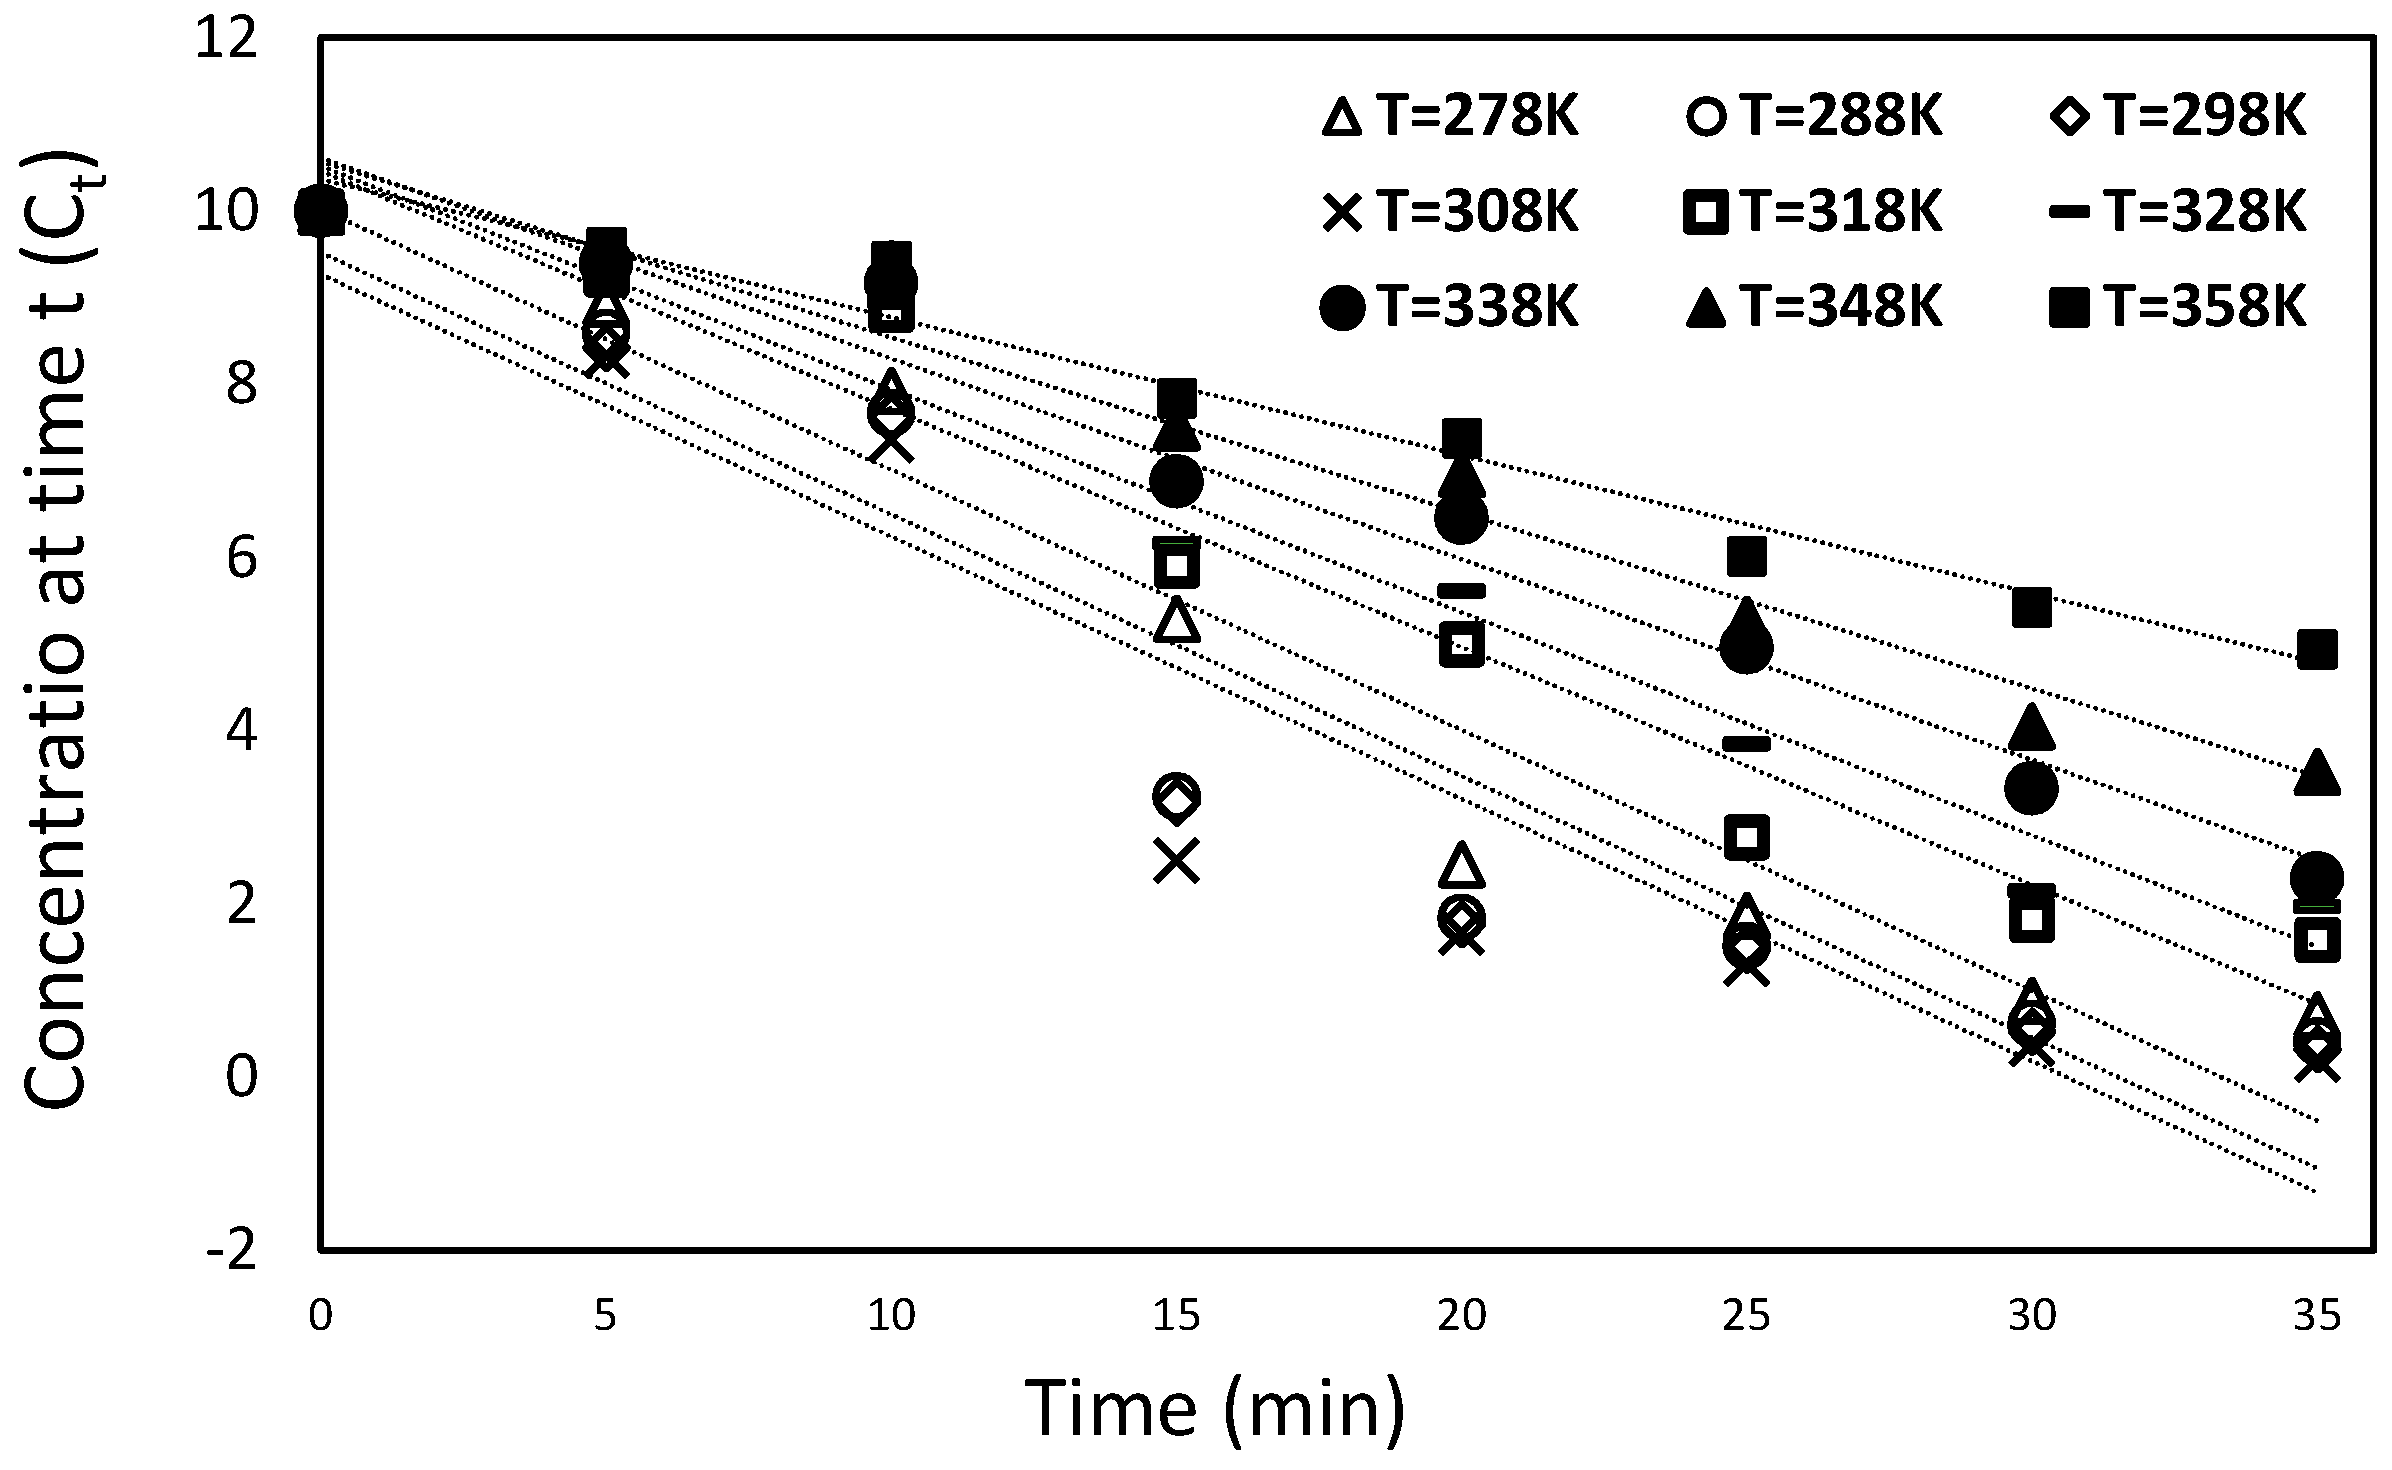
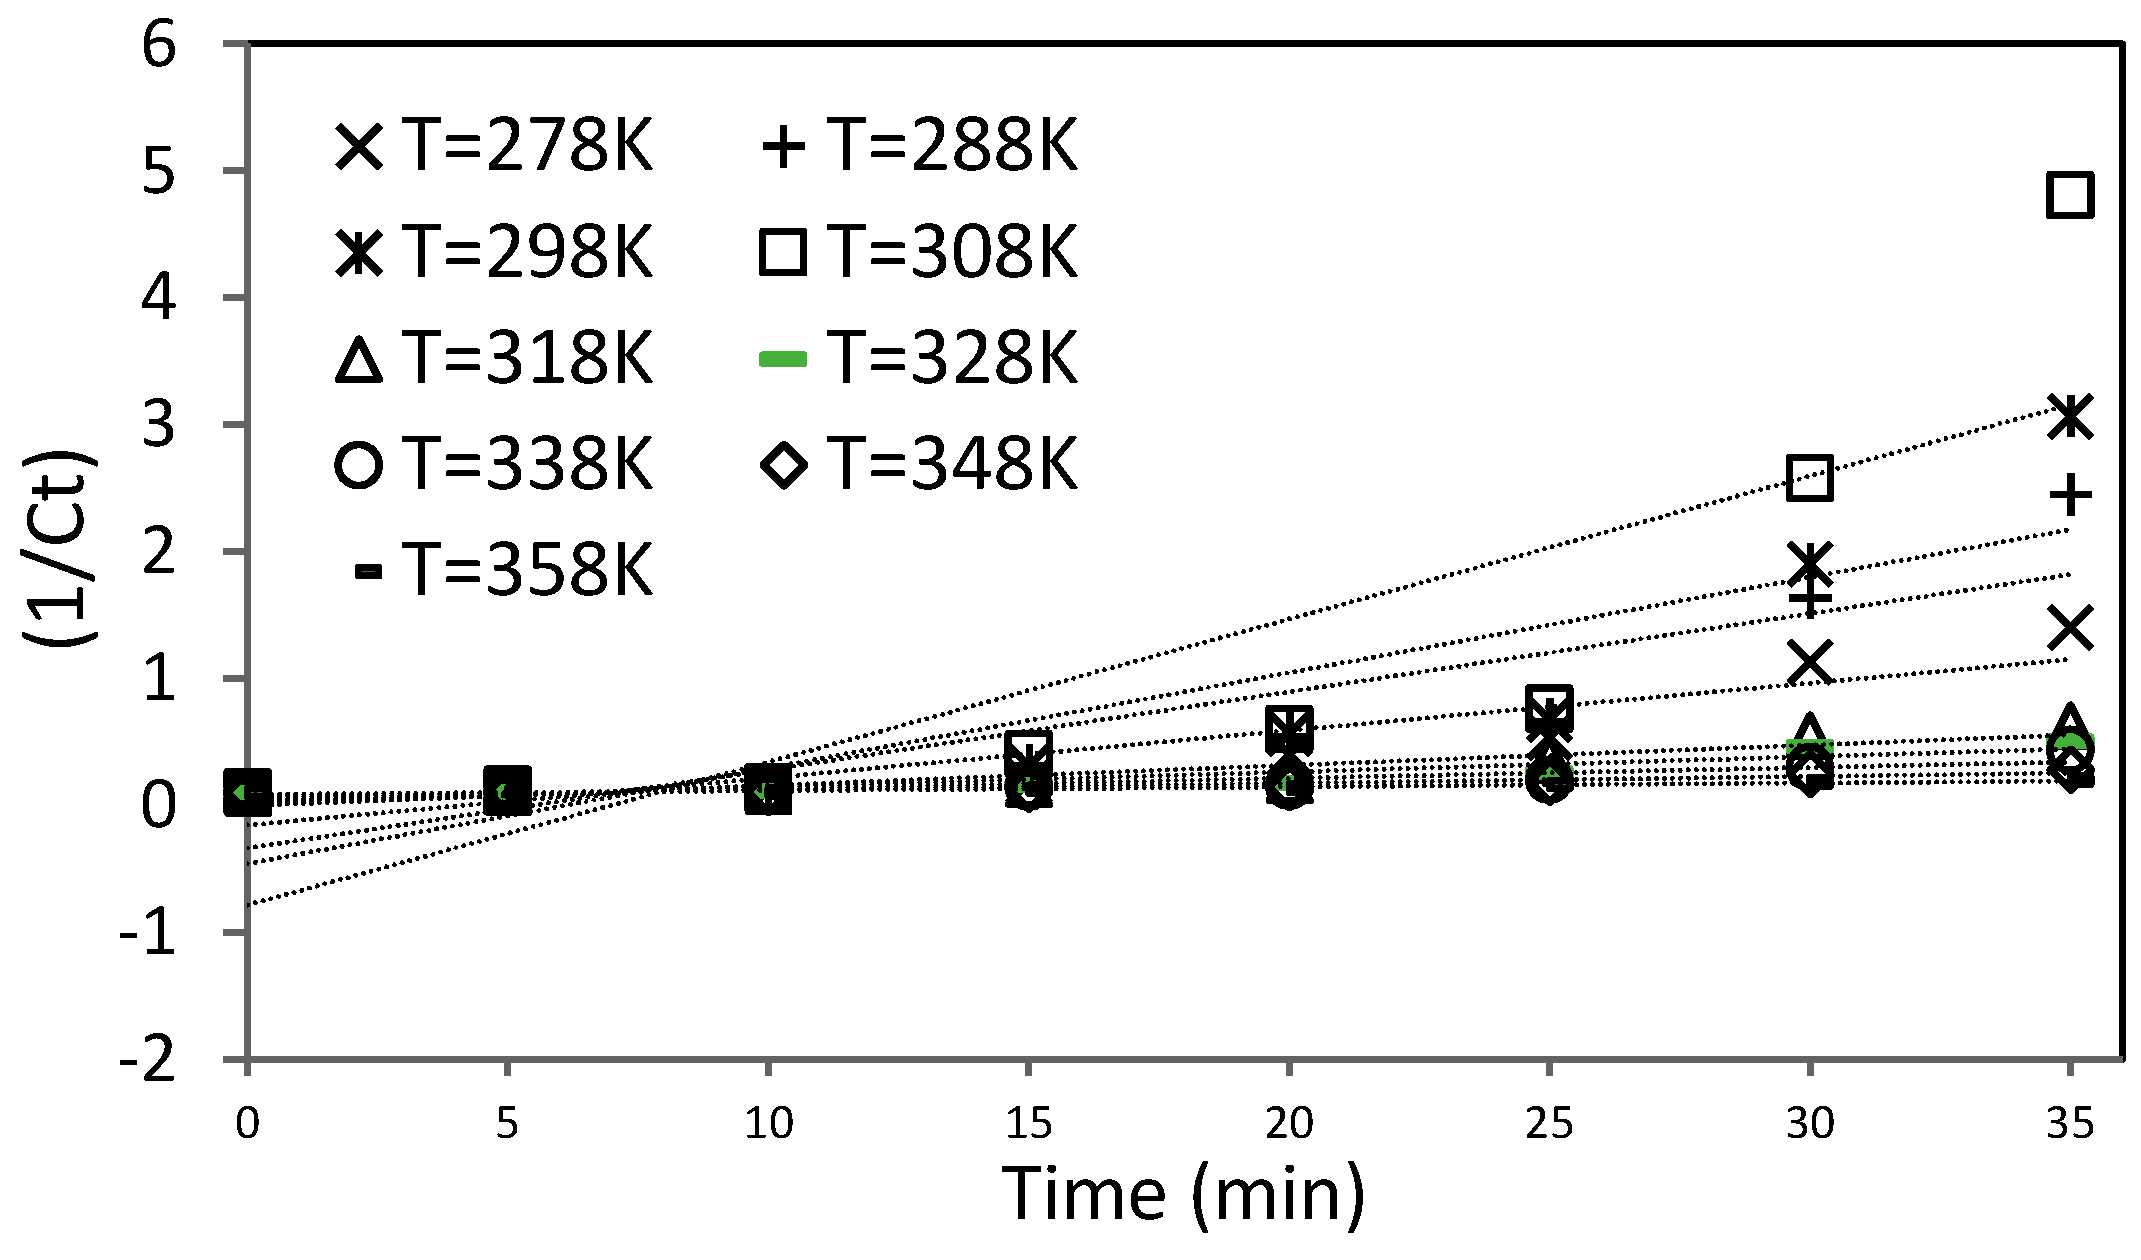
The performance of a gas-liquid corona discharge plasma was defined using a kinetic model. The discolorations of polluted water with Acid Blue 25 dye were investigated using pseudo-zero-, pseudo-first-, and pseudo-second-order reaction kinetic models. The three kinetic models may be found using the mathematical formulae shown in Equations (10)–(12).
In these equations, Ct is the concentration at time t, t is reaction time, C0 is initial concentration, k0 is the rate constant of the pseudo-zero order, k1 is the rate constant of the pseudo-first order, and k2 is the rate constant of the pseudo-second order.
The discolorations of polluted water with Acid Blue 25 were investigated using regression analysis based on the concept of pseudo-zero-, pseudo-first-, and pseudo-second-order reaction kinetics. The degradation of Acid Blue was studied experimentally using a dual-pin high-voltage electrode-to-ground electrode in a gas–liquid electrical discharge system for 25 days to explore the effect of dye solution temperature degrees.
Figure 20,
Figure 21 and
Figure 22 show the degradation of Acid Blue 25 dye after the reaction time (i.e., from 0 min to 35 min) for pseudo-zero-, pseudo-first-, and pseudo-second-order models, respectively. The outcomes are displayed in the previous figures. The slopes and intercepts computed from the plots were used to determine the pseudo-zero-, pseudo-first-, and pseudo-second-order reaction kinetics (
k0,
k1,
k2), the starting concentration (
C0), and correlation coefficients R
02, R
12, and R
22.
Table 2 presents all of the values.
This scenario shows that the three models can account for the reaction kinetics. However, the regression coefficient of pseudo-first-order kinetics is closer to 1 than the regression coefficients of pseudo-zero-and pseudo-second order kinetics, indicating that the first-order model is the most suitable in representing the discoloration kinetics of Acid Blue 25 dye.
This property is attributed to the fact that after 5 min (the induction period), the number of organic species present at the interface is inadequate. The kinetics are then controlled by the diffusion of the target molecules toward the solution’s surface. Given that it has the highest correlation coefficient (R12) value, the pseudo-first-order rate constant may be used to calculate the oxidation rate for the degradation of polluted water with Acid Blue 25 dye. Therefore, the practical initial concentration was discovered. Sunga (2010) explored atrazine decomposition by DBD discharge at a considerably high initial concentration (5 mg/L), and the same outcome was found. The authors determined that the atrazine levels decreased exponentially during the therapy. This observation allows us to deduce from the equation of a first-order reaction rate constant k1 for atrazine elimination in our reactor.
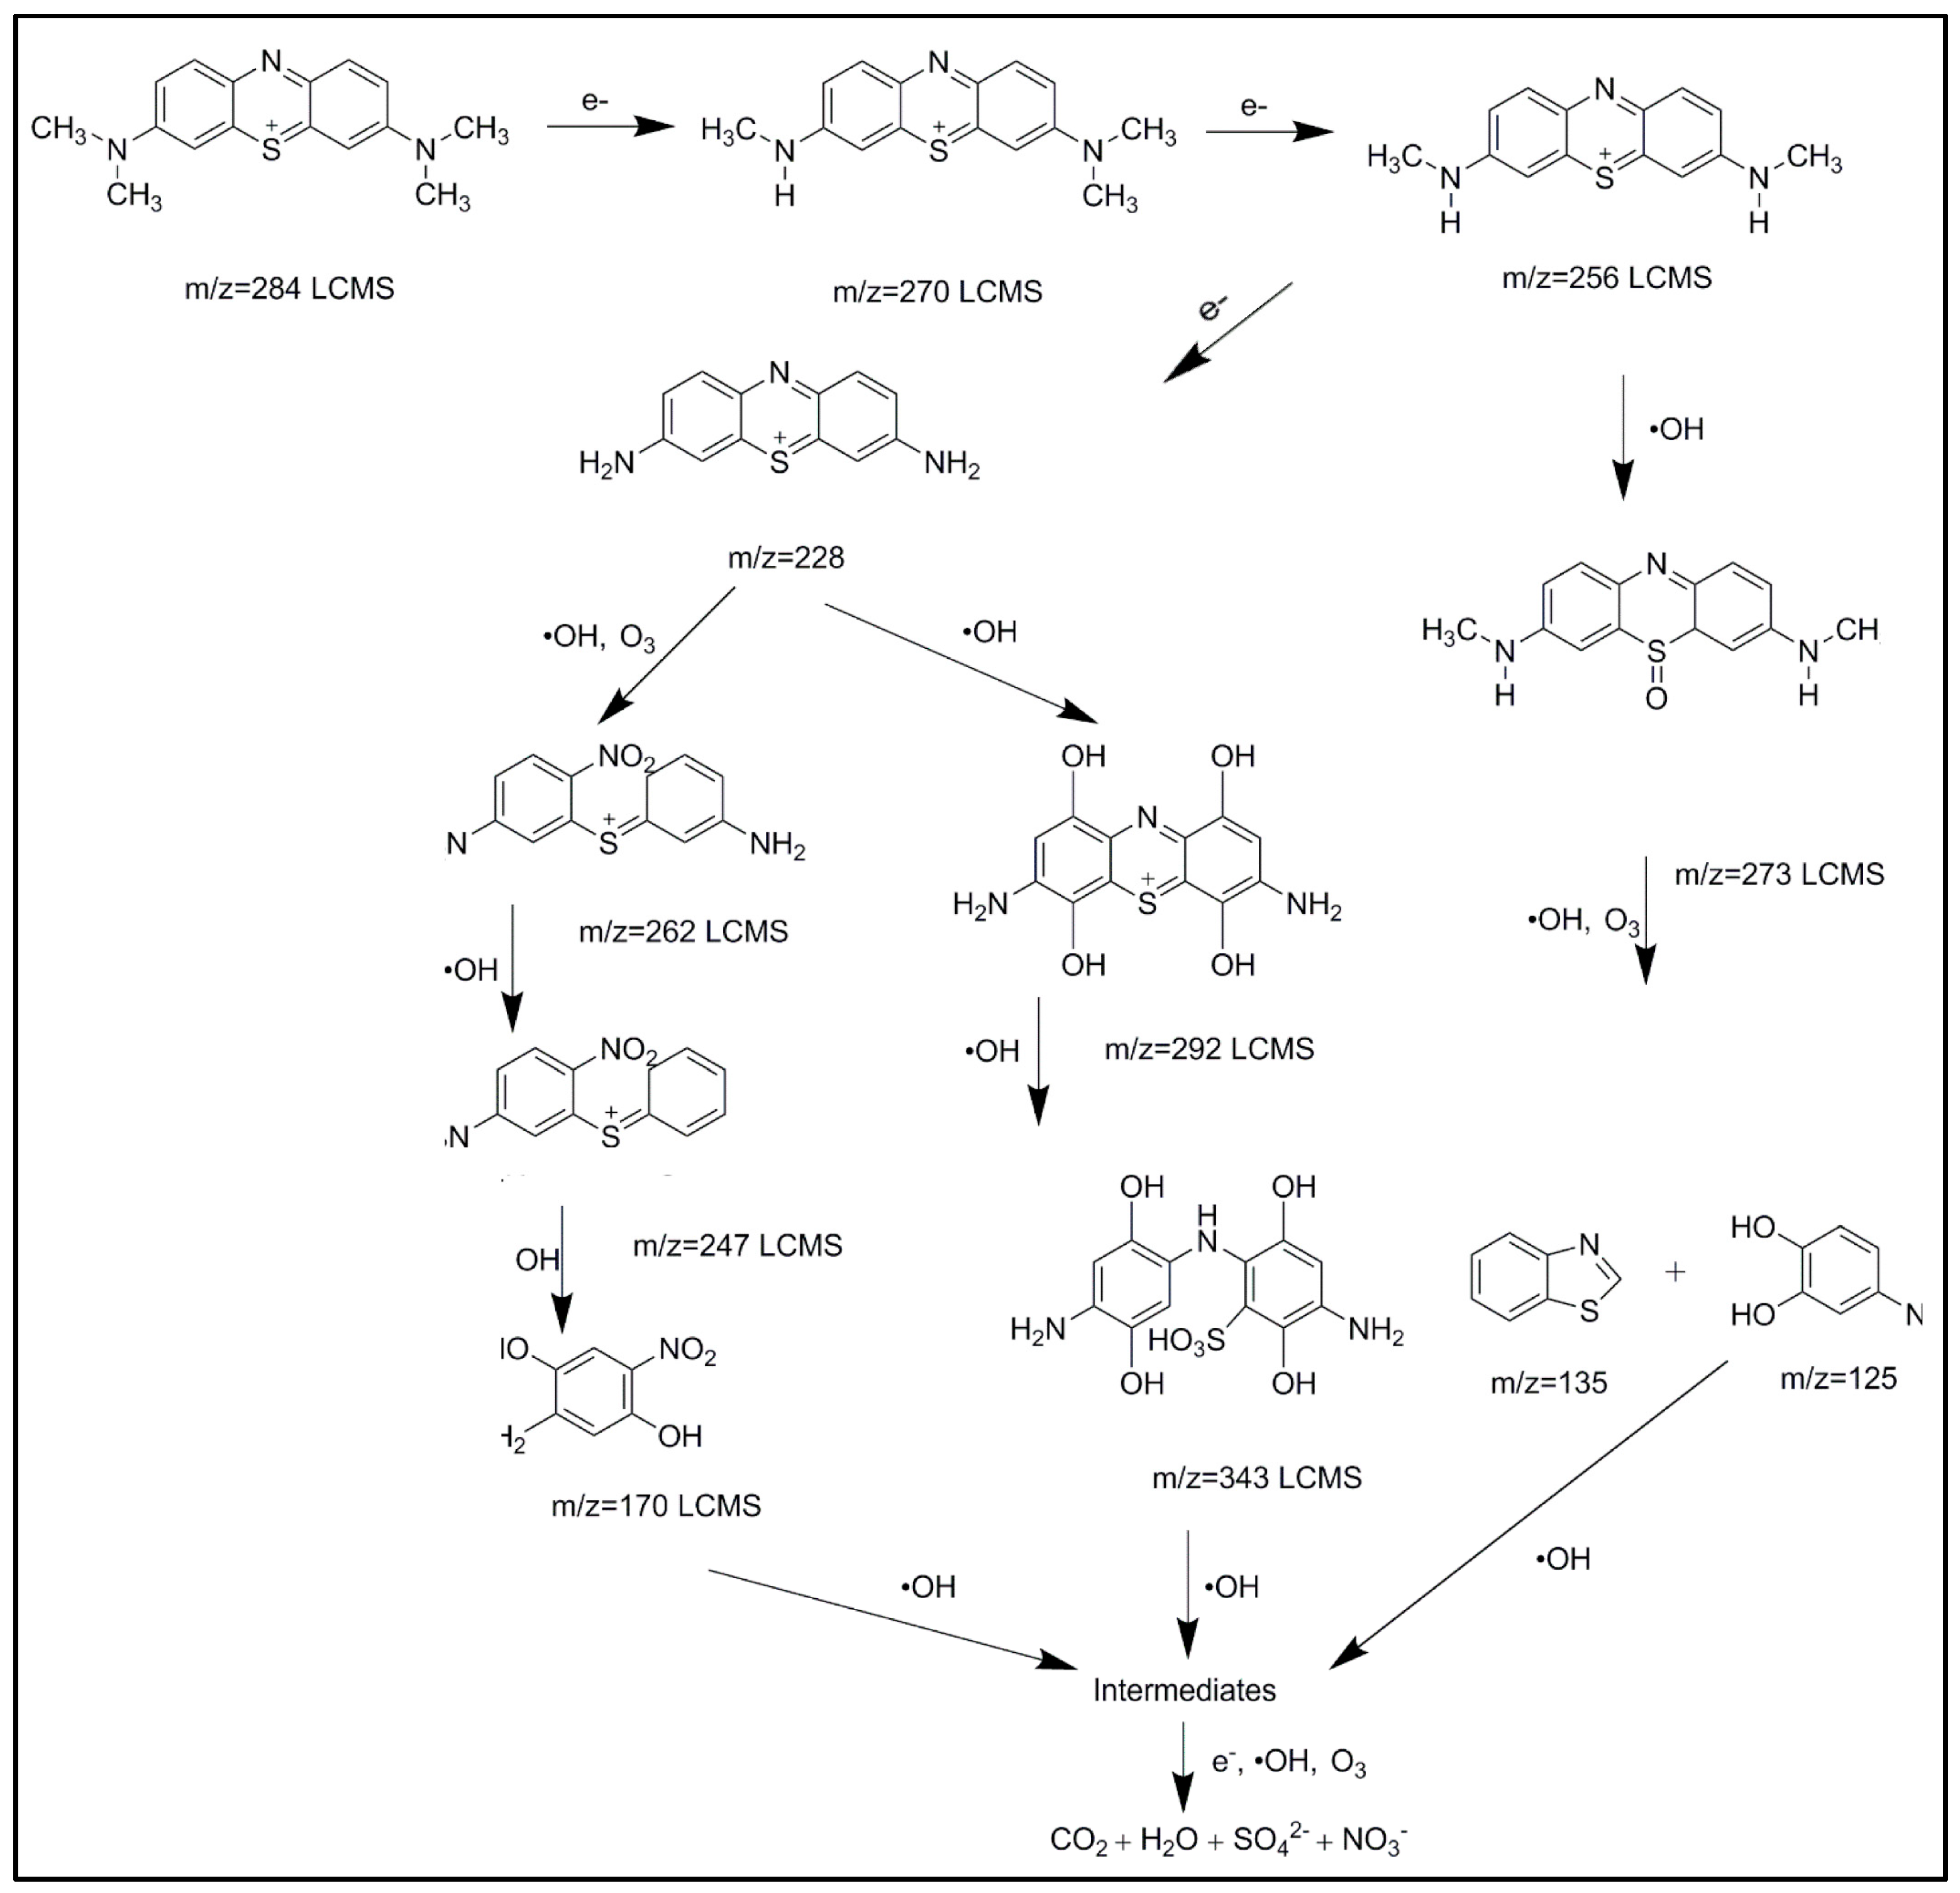
6. Reaction Pathway of Degradation Mechanism
Acid Blue 25 dye degradation in wastewater using corona discharge plasma follows several mechanisms. One of the proposed mechanisms is the formation of active radicals above the water, passing some intermediate components. The hydroxyl group may play a vital role in the degradation process [
32,
33,
34,
35]. The deterioration of Acid Blue 25 dye via corona discharge plasma is illustrated in
Figure 23. The corona discharge plasma uses choline lactate for efficient dye deterioration. A considerable amount of varied and effective species and radicals is formed during the corona discharge. Water atoms provide abundant supplies of different reactive nitrogen and reactive oxygen species, including hydroxyl radical (OH
•) and hydrogen particles (H). Ozone (O
3), singlet oxygen (O), hydrogen peroxide (H
2O
2), hydroperoxyl radical (HO
2), and superoxide radical (HO
2) are produced by nonthermal plasma corona in wet air (O
2−). Experiments revealed the ions created by the corona discharge plasma and other breakdown products. Essential oxidants, such as ozone and H
2O
2, are notable because they can be converted to free oxidants, such as OH radicals. Ozone is the most economically accessible oxidizing specialist, and it is commonly used to treat water for odor and taste elimination. Among the basic oxidizers, only the hydroxyl radical and fluorine have a higher oxidation potential than ozone. The creation of hydroxyl (OH) radicals that occur as ozone decays positively affects its use. Ozone is a potential oxidant (
Eo = 2.07 V) that reacts with various organics in either immediate or abnormal ways (principally hydroxyl radical). Ozone can indirectly deliver free radicals (OH
•,
Eo = 2.80 V) that can react with almost all natural mixtures. Free oxygen radicals are first produced via inelastic collisions. Then, the reactions of these free radicals produce ozone. This section elaborates the essential active species generated in corona discharge plasma and how they were measured under the influence of 15 kV corona discharge plasma reactors [
36,
37,
38].
7. Conclusions
In this study, a gas-liquid corona discharge plasma with a dual-pin high-voltage electrode-to-ground electrode was used to investigate experimentally the effect of dye solution temperature on the removal efficiency rate of Acid Blue 25 dye from industrial polluted water. The conclusions demonstrated that the decolorization of Acid Blue 25 dye increases with the increase in the temperature degrees of water solution from 278 K to 308 K. On the contrary, the decolorization efficiency decreases as the temperature increases above 308 K. The results indicated that the suitable temperature for dye removal is 308 K, near room temperature. Thus, treating the Acid Blue 25 dye wastewater solution at room temperature before any oxidation mechanism is recommended. The reaction rates of organic dye degradation under the effect of changes in the temperature were investigated depending on Arrhenius equation to define the properties of Acid Blue 25 dye temperature on the treatment process. The performance of the gas-liquid corona discharge plasma was defined using a kinetic model. The discolorations of Acid Blue 25 dye were studied using the pseudo-zero-, pseudo-first-, and pseudo-second-order reaction kinetic models. The Acid Blue 25 elimination process followed a complicated mechanism in which pseudo-zero- and pseudo-first-order processes occur at a comparable temperature, with pseudo-zero order in the early steps and pseudo-first order as the reaction progressed. The next pseudo-first-order kinetics in the dye concentration is the degradation rate of Acid Blue 25 dye. According to this study, the key reactive species involved in the oxidation of colored organic compounds are O3 and H2O2. Thus, the measurements for radicals and active species, such as hydrogen peroxide (H2O2) and ozone, created during the corona discharge in the optimal operation period were made (O3). The energy yield demonstrated the breakdown of O3 and H2O2. The EE/O and energy yield for decolorization were estimated. The energy needs for the breakdown of Acid Blue 25 dye were also determined.
Author Contributions
Conceptualization, A.E.-T. and A.Z.E.-D.; methodology, A.E.-T., A.Z.E.-D., A.Y.E. and E.E.H.; software, A.E.-T. and A.Z.E.-D.; validation, A.E.-T., A.Z.E.-D., A.Y.E. and E.E.H.; formal analysis, A.E.-T. and A.Z.E.-D.; investigation, A.Y.E. and E.E.H.; resources, A.Y.E. and E.E.H.; data curation, A.E.-T., A.Z.E.-D., A.Y.E. and E.E.H.; writing: original draft preparation, A.E.-T. and A.Z.E.-D.; writing: review and editing, A.Y.E. and E.E.H.; visualization A.E.-T., A.Z.E.-D., A.Y.E. and E.E.H.; supervision, A.Z.E.-D. and A.Y.E.; project administration, A.Z.E.-D. and A.Y.E.; funding acquisition, A.Y.E. All authors have read and agreed to the published version of the manuscript.
Funding
This project is funded by Taif University Researchers Supporting Project under Grant TURSP-2020/32, Taif, Saudi Arabia.
Institutional Review Board Statement
Not applicable.
Informed Consent Statement
Not applicable.
Data Availability Statement
Not applicable.
Acknowledgments
The authors would like to acknowledge the financial support received from Taif University Researchers Supporting Project Number (TURSP-2020/32), Taif University, Taif, Saudi Arabia.
Conflicts of Interest
The authors declare no conflict of interest.
References
- Aleksandrov, L.N.; Bazelyan, E.M. Ionization processes in spark discharge plasmas. Plasma Sources Sci. Technol. 1999, 8, 285. [Google Scholar] [CrossRef] [Green Version]
- Bauer, T.; Lunkenheimer, P.; Loidl, A. Cooperativity and the Freezing of Molecular Motion at the Glass Transition. Phys. Rev. Lett. 2013, 111, 225702. [Google Scholar] [CrossRef] [Green Version]
- Benetoli, L.O.B.; Cadorin, B.M.; Postiglione, C.S.; Souza, I.G.; Debacher, N.A. Effect of Temperature on Methylene Blue Decolorization in Aqueous Medium in Electrical Discharge Plasma Reactor. J. Braz. Chem. Soc. 2011, 22, 1669–1678. [Google Scholar] [CrossRef]
- Bruggeman, P.J.; Locke, B.R. Assessment of Potential Applications of Plasma with Liquid Water. In Low-Temperature Plasma Technology Methods and Applications; CRC Press: Boca Raton, FL, USA, 2013; pp. 367–399. [Google Scholar]
- Chang, J.P.; Lawless, P.; Yamamoto, T. Corona discharge processes. IEEE Trans. Plasma Sci. 1991, 19, 1152–1166. [Google Scholar] [CrossRef] [Green Version]
- Chen, G.; Zhou, M.; Chen, S.; Chen, W. The different effect s of oxygen and air DBD plasma by-products on the degradation of methyl violet 5BN. J. Hazard. Mater. 2009, 172, 786–791. [Google Scholar] [CrossRef]
- Dojčinovića, B.P.; Roglićb, G.M.; Obradovićc, B.M.; Kuraicac, M.M.; Kostićd, M.M.; Nešićb, J.; Manojlović, D.D. Decolorization of reactive textile dyes using water falling film dielectric barrier discharge. J. Hazard. Mater. 2011, 192, 763–771. [Google Scholar] [CrossRef]
- El-Sayed Gouda, O.; El Dein Adel, Z.; EL-Tayeb, A. Prediction of Flashover Voltage and Dry Band Location for Polluted Ceramic Insulators Using Dynamic Open-Model. J. Energy Power Sources 2014, 1, 304–313. [Google Scholar]
- El-Tayeb, A.; El-Shazly, A.H.; Elkady, M.F.; Abdel-Rahman, A. Investigation of the Decolorization Efficiency of Two Pin-to-Plate Corona Discharge Plasma System for Industrial Wastewater Treatment. Plasma Phys. Rep. 2016, 42, 887–899. [Google Scholar] [CrossRef]
- El-Tayeb, A.; El-Shazly, A.H.; Elkady, M.F.; Abdel-Rahman, A. Simulation and Experimental Study for Degradation of Organic Dyes Using Dual pin-to-plate Corona Discharge Plasma reactors for Industrial Wastewater Treatment. Contrib. Plasma Phys. 2016, 56, 855–869. [Google Scholar] [CrossRef]
- El-Tayeb, A.; El-Shazly, A.H.; Elkady, M.F.; Abdel-Rahman, A. Non-thermal plasma as a new advanced technique for intensifying the industrial wastewater treatment. Desalination Water Treat. 2017, 61, 230–239. [Google Scholar] [CrossRef]
- El-Tayeb, A.; El-Shazly, A.H.; Elkady, M.F.; Abdel-Rahman, A. Investigation of the Decolorization Efficiency of Pin-to-Plate Corona Discharge Plasma System for Industrial Wastewater Treatment. Available online: file:///C:/Users/MDPI/AppData/Local/Temp/myabstract.pdf (accessed on 10 November 2021).
- El-Tayeb, A.; El-Shazly, A.H.; Elkady, M.F.; Abdel-Rahman, A. Decolorization of Acid Blue 25 Dye by Non-Thermal Plasma Advanced Oxidation Process for Industrial Wastewater Treatment. In Proceedings of the 15th IEEE International Conference on Environment and Electrical Engineering (EEEIC 2015), Rome, Italy, 10–13 June 2015. [Google Scholar] [CrossRef]
- EL-Tayeb, A.; El Dein Adel, Z. Performance of Ceramic Insulator String for 132kV under Different Polluted Conditions. J. Energy Power Sources 2014, 1, 152–160. [Google Scholar]
- Gaoa, L.; Suna, L.; Wanb, S.; Yua, Z.; Mingjie, L. Degradation kinetics and mechanism of emerging contaminants in water by dielectric barrier discharge non-thermal plasma: The case of 17 β-Estradiol. Chem. Eng. J. 2013, 228, 790–798. [Google Scholar] [CrossRef]
- Ghizdavu, L.; Suarasan, I.; Dascalescu, L.; Morar, R. Optimized geometry of a corona electrode arrangement for water ozonation. Inst. Phys. Conf. Ser. 2004, 178, 291–296. [Google Scholar]
- Hayashi, Y.; Wahyudiono Machmudah, S.; Takada, N.; Kanda, H.; Sasaki, K.; Goto, M. Decomposition of methyl orange using pulsed discharge plasma at atmospheric pressure: Effect of different electrodes. Jpn. J. Appl. Phys. 2014, 53, 010212. [Google Scholar] [CrossRef]
- Jiang, B.; Zheng, J.; Liu, Q.; Wu, M. Degradation of azo dye using non-thermal plasma advanced oxidation process in a circulatory airtight reactor system. Chem. Eng. J. 2012, 204–206, 32–39. [Google Scholar] [CrossRef]
- Shih, K.Y.; Locke, B.R. Effects of Electrode Protrusion Length, Pre-Existing Bubbles, Solution Conductivity and Temperature, on Liquid Phase Pulsed Electrical Discharge. Plasma Process. Polym. 2009, 6, 729–740. [Google Scholar] [CrossRef]
- Krugly, E.; Martuzevicius, D.; Tichonovas, M.; Jankunaite, D.; Rumskaite, I.; Sedlina, J.; Racys, V.; Baltrusaitis, J. Decomposition of 2-naphthol in water using a non-thermal plasma reactor. Chem. Eng. J. 2015, 260, 188–198. [Google Scholar] [CrossRef]
- Locke, B.R.; Brisset, J.L.; Parvulescu, V.I.; Magureanu, M.; Lukes, P. Aqueous-Phase Chemistry of Electrical Discharge Plasma in Water and in Gas-Liquid Environments. In Plasma Chemistry and Catalysis in Gases and Liquids; Wiley-VCH Verlag GmbH & Co. KGaA: Weinheim, Germany, 2012; p. 422. [Google Scholar]
- Locke, B.R.; Brisset, J.L.; Parvulescu, V.I.; Magureanu, M.; Lukes, P. Elementary Chemical and Physical Phenomena in Electrical Discharge Plasma in Gas-Liquid Environment s and in Liquids. In Plasma Chemistry and Catalysis in Gases and Liquids; Wiley-VCH Verlag GmbH & Co. KGaA: Weinheim, Germany, 2012. [Google Scholar]
- Lukes, P.; Locke, B.R. Degradation of Substituted Phenols in a Hybrid Gas−Liquid Electrical Discharge Reactor. Ind. Eng. Chem. Res. 2005, 44, 2921–2930. [Google Scholar] [CrossRef]
- Mehrjouei, M.; Müller, S.; Möller, D. A review on photocatalytic ozonation used for the treatment of water and wastewater. Chem. Eng. J. 2015, 263, 209–219. [Google Scholar] [CrossRef]
- Moka, Y.S.; Joa, J.O.; Whiteheadb, J.C. Degradation of an azo dye Orange II using a gas phase dielectric using discharge reactor submerged in water. Chem. Eng. J. 2008, 142, 56–64. [Google Scholar] [CrossRef]
- Ono, R.; Oda, T. Ozone production process in pulsed positive dielectric barrier discharge. J. Phys. D Appl. Phys. 2007, 40, 176. [Google Scholar] [CrossRef]
- Sander, N.; Veldhuizen, E.; Bruggeman, P.; Ebert, U. An Introduction to Non-equilibrium Plasmas at Atmospheric Pressure. In Plasma Chemistry and Catalysis in Gases and Liquids; Wiley-VCH Verlag GmbH & Co. KGaA: Weinheim, Germany, 2012. [Google Scholar]
- Sunga, T.L.; Wengb, W.P.; Gua, A.R.; Jhana, X.C. Energy consumption of atmosphere pen-like plasma for discoloration. Surf. Coat. Technol. 2010, 205, S459–S461. [Google Scholar] [CrossRef]
- Tichonovasa, M.; Krugly, E.; Races, V.; Hippler, R.; Kauneliene, V.; Stasiulaitiene, I.; Martuzevicius, D. Degradation of various textile dyes as wastewater pollutants under dielectric barrier discharge plasma treatment. Chem. Eng. J. 2013, 229, 9–19. [Google Scholar] [CrossRef]
- El-Tayeb, A.; El-Shazly, A.H.; Elkady, M.F. Investigation the Influence of Different Salts on the Degradation of Organic Dyes Using Non-Thermal Plasma. Energies 2016, 9, 874. [Google Scholar] [CrossRef]
- Zuraida, M.S.; Nurhaslina, R.C.; Ku Halim, K.H. Influence of agitation, pH and temperature on growth and decolorization of batik wastewater by bacteria Lactobacillus delbruckii. Int. J. Res. Rev. Appl. Sci. IJRRAS 2013, 14, 269–275. [Google Scholar]
- Sekar, S.; Surianarayanan, M.; Ranganathan, V.; MacFarlane, D.R.; Manda, A.B. Choline-Based Ionic Liquids-Enhanced Biodegradation of Azo Dyes. Environ. Sci. Technol. 2012, 46, 4902–4908. [Google Scholar] [CrossRef] [PubMed]
- Ghodbane, H.; Hamdaoui, O. Degradation of Acid Blue 25 in aqueous media using 1700 kHz ultrasonic irradiation: Ultrasound/Fe(II) and ultrasound/H2O2 combinations. Ultrason. Sonochemistry 2009, 16, 593–598. [Google Scholar] [CrossRef]
- Song, K.; Wang, H.; Jiao, Z.; Qu, G.; Chen, W.; Wang, G.; Wang, T.; Zhang, Z.; Ling, F. Inactivation efficacy and mechanism of pulsed corona discharge plasma on virus in water. J. Hazard. Mater. 2022, 422, 126906. [Google Scholar] [CrossRef]
- Aziz, K.H.; Miessner, H.; Mahyar, A.; Mueller, S.; Moeller, D.; Mustafa, F.; Omer, K.M. Degradation of perfluorosurfactant in aqueous solution using non-thermal plasma generated by nano-second pulse corona discharge reactor. Arab. J. Chem. 2021, 14, 103366. [Google Scholar] [CrossRef]
- Nippatlapalli, N.; Ramakrishnan, K.; Philip, L. Enhanced degradation of complex organic compounds in wastewater using different novel continuous flow non-thermal pulsed corona plasma discharge reactors. Environ. Res. 2022, 203, 111807. [Google Scholar] [CrossRef]
- Leea, T.; Park, H. Degradation of benzopyrene and acrylamide in roasted coffee beans by corona discharge plasma jet (CDPJ) and its effects on biochemical and sensory properties. Food Chem. 2020, 328, 127117. [Google Scholar] [CrossRef] [PubMed]
- El-Tayeb, A.; El-Shazly, A.H.; Elkady, M.F. Impacts of Different Salts on the Degradation of Acid Blue 25 Dye Using Non-Thermal Plasma. In Proceedings of the 16th IEEE International Conference on Environment and Electrical Engineering (EEEIC 2016), Florence, Italy, 7–10 June 2016. [Google Scholar] [CrossRef]
Figure 1.
Configurations of Acid Blue 25.
Figure 1.
Configurations of Acid Blue 25.
Figure 2.
Setup system of corona discharge plasma.
Figure 2.
Setup system of corona discharge plasma.
Figure 3.
Current and voltage waveforms.
Figure 3.
Current and voltage waveforms.
Figure 4.
Diagram of system setup. 1: source of pulsed voltage; 2: conductor pins of high voltage; 3: conductor ground plate; 4: reactor shell; 5: wastewater solution; 6: voltage probe; 7: current probe; 8: oscilloscope; 9: heater.
Figure 4.
Diagram of system setup. 1: source of pulsed voltage; 2: conductor pins of high voltage; 3: conductor ground plate; 4: reactor shell; 5: wastewater solution; 6: voltage probe; 7: current probe; 8: oscilloscope; 9: heater.
Figure 5.
Corona release from the dual pin-to-ground electrodes.
Figure 5.
Corona release from the dual pin-to-ground electrodes.
Figure 6.
Effect of temperature on dye removal using corona discharge plasma.
Figure 6.
Effect of temperature on dye removal using corona discharge plasma.
Figure 7.
Simulation results of dual-pin corona discharge plasma reactor. (a) Electric potential (kV); (b) surface charge density (mC/m3); (c) electric field distribution (V/m); (d) energy density (J/m3).
Figure 7.
Simulation results of dual-pin corona discharge plasma reactor. (a) Electric potential (kV); (b) surface charge density (mC/m3); (c) electric field distribution (V/m); (d) energy density (J/m3).
Figure 8.
Relationship between maximum electric field and temperature (K) in water.
Figure 8.
Relationship between maximum electric field and temperature (K) in water.
Figure 9.
Relationship between maximum electric field and temperature (K) in air.
Figure 9.
Relationship between maximum electric field and temperature (K) in air.
Figure 10.
The relationship between space charge density and temperature (K) in air.
Figure 10.
The relationship between space charge density and temperature (K) in air.
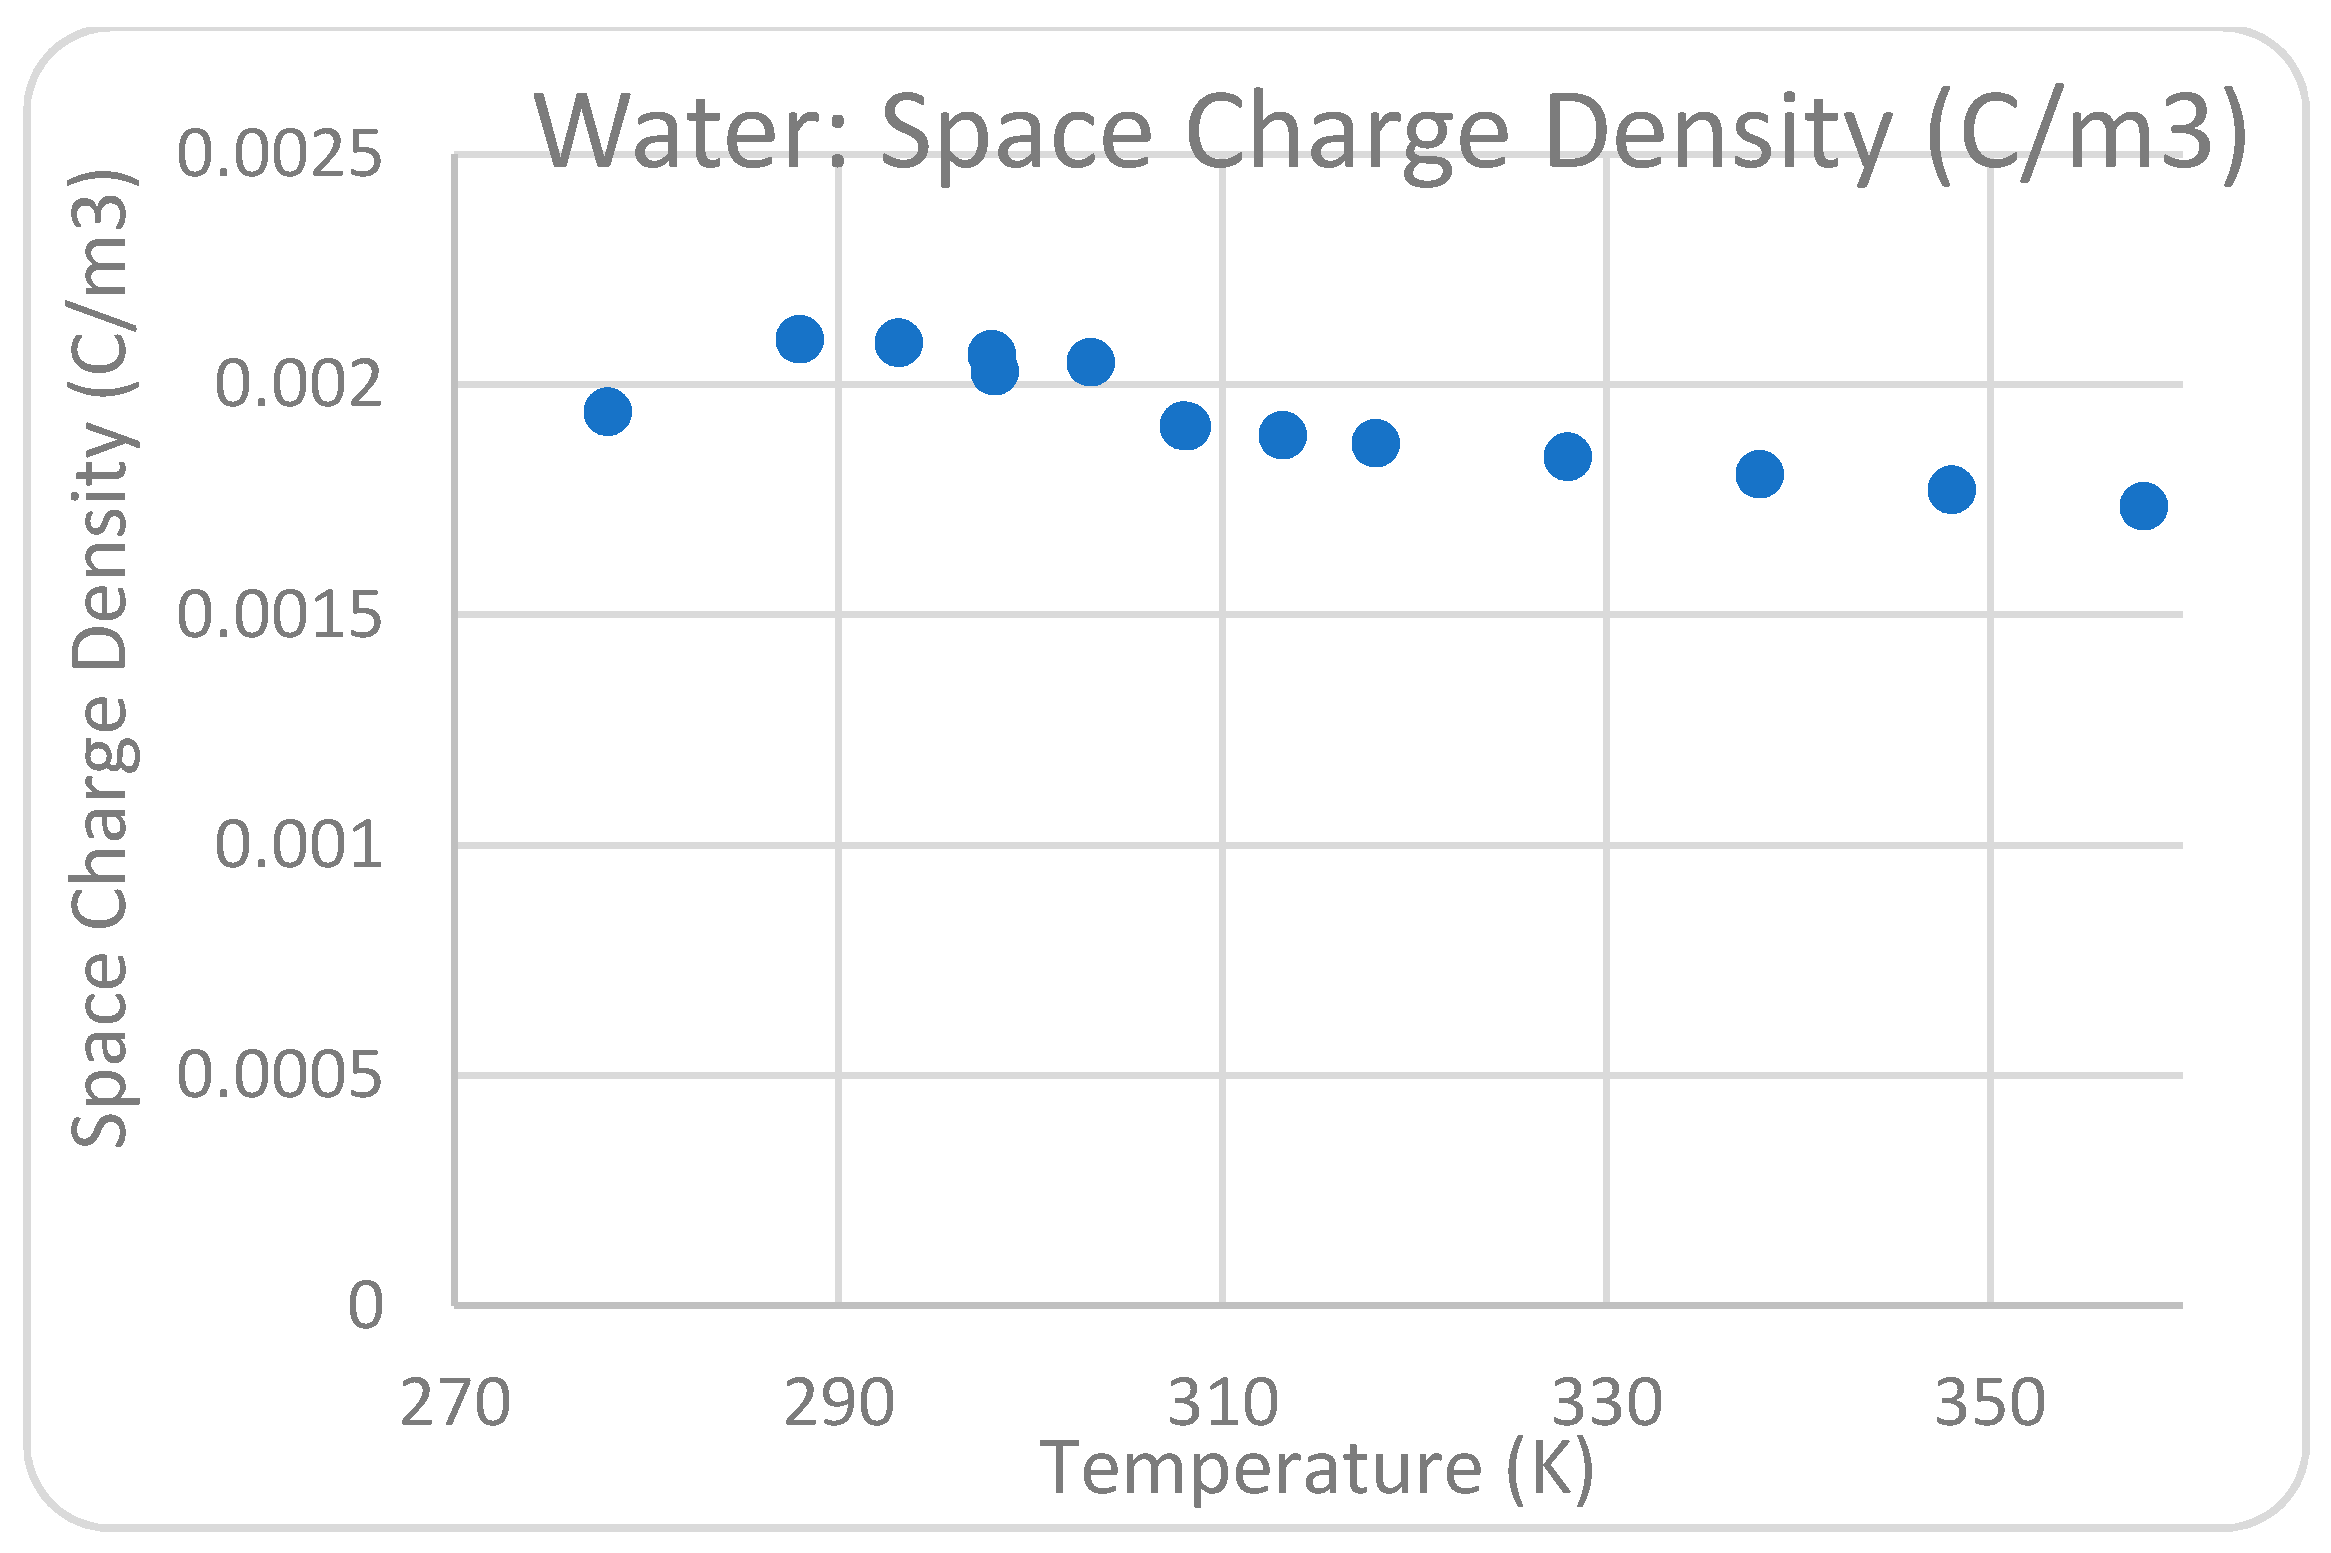
Figure 11.
Relationship between space charge density and temperature (K) in water.
Figure 11.
Relationship between space charge density and temperature (K) in water.
Figure 12.
Relationship between the concentration and time at different temperatures from 278 K to 308 K.
Figure 12.
Relationship between the concentration and time at different temperatures from 278 K to 308 K.
Figure 13.
Relationship between the ratio of initial to final concentrations and time at different temperatures from 278 K to 308 K.
Figure 13.
Relationship between the ratio of initial to final concentrations and time at different temperatures from 278 K to 308 K.
Figure 14.
Reaction rate constant with the reverse of temperature (Kelvin) with different temperatures from 278 to 308 K.
Figure 14.
Reaction rate constant with the reverse of temperature (Kelvin) with different temperatures from 278 to 308 K.
Figure 15.
Relationship between the concentration and time at different temperatures from 318 K to 358 K.
Figure 15.
Relationship between the concentration and time at different temperatures from 318 K to 358 K.
Figure 16.
Relationship between ratio of concentration and time at different temperatures from 318 K to 358 K.
Figure 16.
Relationship between ratio of concentration and time at different temperatures from 318 K to 358 K.
Figure 17.
Reaction rate constant with the reverse of temperature (K) at different temperatures from 318 K to 358 K.
Figure 17.
Reaction rate constant with the reverse of temperature (K) at different temperatures from 318 K to 358 K.
Figure 18.
Relationship between energy yield and time at different temperatures from 318 K to 358 K.
Figure 18.
Relationship between energy yield and time at different temperatures from 318 K to 358 K.
Figure 19.
Relationship between time and EE/O at various temperatures from 318 K to 358 K.
Figure 19.
Relationship between time and EE/O at various temperatures from 318 K to 358 K.
Figure 20.
Pseudo-zero order for temperatures from 278 K to 358 K.
Figure 20.
Pseudo-zero order for temperatures from 278 K to 358 K.
Figure 21.
Pseudo-first order for temperatures from 278 K to 358 K.
Figure 21.
Pseudo-first order for temperatures from 278 K to 358 K.
Figure 22.
Pseudo-second order for temperatures from 278 K to 358 K.
Figure 22.
Pseudo-second order for temperatures from 278 K to 358 K.
Figure 23.
Degradation pathways of Acid Blue 25 dye.
Figure 23.
Degradation pathways of Acid Blue 25 dye.
Table 1.
Acid Blue 25 dye physical and chemical feature.
Table 1.
Acid Blue 25 dye physical and chemical feature.
| Name | Acid Blue 25 Dye |
|---|
| Color | Blue |
| Class | Anthraquinone |
| Physical State | Data |
| Ionization | Acidic |
| Molecular Weight | 416.382 g/mol |
| Monoisotopic Mass | 416.044287 g/mol |
| Surface Area | 138 A2 |
| Atom Count | 29 |
| Appearance: | Powder |
| Absorption (λmax): | 600 nm |
| Molecular Formula: | C20H13N2NaO5S |
Table 2.
Correlation coefficient for various temperatures.
Table 2.
Correlation coefficient for various temperatures.
| T | Pseudo-Zero Order | Pseudo-First Order | Pseudo-Second Order |
|---|
| R02 | k0 | C0 | R12 | K1 | C0 | R22 | K2 | C0 |
|---|
| 278 | 0.947 | 0.301 | 10.02 | 0.956 | 0.084 | 13.82 | 0.825 | 0.037 | 6.587 |
| 288 | 0.905 | 0.302 | 9.52 | 0.966 | 0.098 | 13.76 | 0.777 | 0.061 | 2.987 |
| 298 | 0.906 | 0.303 | 9.45 | 0.961 | 0.103 | 14.26 | 0.739 | 0.075 | 2.193 |
| 308 | 0.889 | 1.515 | 10.78 | 0.953 | 0.114 | 14.89 | 0.679 | 0.112 | 1.276 |
| 318 | 0.962 | 0.275 | 10.46 | 0.943 | 0.059 | 12.81 | 0.859 | 0.016 | 1000 |
| 328 | 0.968 | 1.288 | 11.81 | 0.932 | 0.051 | 12.47 | 0.833 | 0.012 | 44.61 |
| 338 | 0.972 | 1.159 | 11.77 | 0.914 | 0.041 | 12.16 | 0.794 | 0.043 | 1111 |
| 348 | 0.966 | 1.014 | 11.58 | 0.940 | 0.032 | 11.46 | 0.886 | 0.005 | 14.30 |
| 358 | 0.971 | 0.796 | 11.16 | 0.964 | 0.022 | 10.76 | 0.944 | 0.003 | 11.57 |
| Publisher’s Note: MDPI stays neutral with regard to jurisdictional claims in published maps and institutional affiliations. |
© 2021 by the authors. Licensee MDPI, Basel, Switzerland. This article is an open access article distributed under the terms and conditions of the Creative Commons Attribution (CC BY) license (https://creativecommons.org/licenses/by/4.0/).


