
GIS-Based Urban Flood Risk Assessment and Management—A Case Study of Delhi National Capital Territory (NCT), India


 ,
,  ,
,  ,
,  ,
,  and
and
Abstract
:1. Introduction
2. Materials and Methods
3. Results and Discussion
4. Limitations and Future Scope
5. Conclusions
Author Contributions
Funding
Institutional Review Board Statement
Informed Consent Statement
Data Availability Statement
Acknowledgments
Conflicts of Interest
References
- Katiyar, V.; Tamkuan, N.; Nagai, M. Near-Real-Time Flood Mapping Using Off-the-Shelf Models with SAR Imagery and Deep Learning. Remote Sens. 2021, 13, 2334. [Google Scholar] [CrossRef]
- Moniruzzaman, M.; Thakur, P.K.; Kumar, P.; Ashraful Alam, M.; Garg, V.; Rousta, I.; Olafsson, H. Decadal Urban Land Use/Land Cover Changes and Its Impact on Surface Runoff Potential for the Dhaka City and Surroundings Using Remote Sensing. Remote Sens. 2021, 13, 83. [Google Scholar] [CrossRef]
- Meraj, G.; Romshoo, S.A.; Yousuf, A.R.; Altaf, S.; Altaf, F. Assessing the influence of watershed characteristics on the flood vulnerability of Jhelum basin in Kashmir Himalaya. Nat. Hazards 2015, 77, 153–175. [Google Scholar] [CrossRef]
- Bera, A.; Taloor, A.K.; Meraj, G.; Kanga, S.; Singh, S.K.; Đurin, B.; Anand, S. Climate vulnerability and economic determinants: Linkages and risk reduction in Sagar Island, India; A geospatial approach. Quat. Sci. Adv. 2021, 4, 100038. [Google Scholar] [CrossRef]
- Meraj, G.; Khan, T.; Romshoo, S.A.; Farooq, M.; Rohitashw, K.; Sheikh, B.A. An integrated geoinformatics and hydrological modelling-based approach for effective flood management in the Jhelum Basin, NW Himalaya. Proceedings 2018, 7, 8. [Google Scholar] [CrossRef] [Green Version]
- Pandey, A.C.; Singh, S.K.; Nathawat, M.S. Waterlogging and flood hazards vulnerability and risk assessment in Indo Gangetic plain. Nat. Hazards 2010, 55, 273–289. [Google Scholar] [CrossRef]
- Supattra, P.; Paramate, H. Internetworking flood disaster mitigation system based on remote sensing and mobile GIS. Geomatics. Nat. Hazards Risk 2020, 11, 1886–1911. [Google Scholar] [CrossRef]
- Uddin, K.; Matin, M.A. Potential flood hazard zonation and flood shelter suitability mapping for disaster risk mitigation in Bangladesh using geospatial technology. Prog. Disaster Sci. 2021, 18, 100185. [Google Scholar] [CrossRef]
- Merz, B.; Blöschl, G.; Vorogushyn, S.; Dottori, F.; Aerts, J.C.; Bates, P.; Bertola, M.; Kemter, M.; Kreibich, H.; Lall, U.; et al. Causes, impacts and patterns of disastrous river floods. Nat. Rev. Earth Environ. 2021, 10, 1–8. [Google Scholar] [CrossRef]
- Berke, P.; Kates, J.; Malecha, M.; Masterson, J.; Shea, P.; Yu, S. Using a resilience scorecard to improve local planning for vulnerability to hazards and climate change: An application in two cities. Cities 2021, 119, 103408. [Google Scholar] [CrossRef]
- Brinkmann, K.; Hoffmann, E.; Buerkert, A. Spatial and Temporal Dynamics of Urban Wetlands in an Indian Megacity over the Past 50 Years. Remote Sens. 2020, 12, 662. [Google Scholar] [CrossRef] [Green Version]
- Wang, X.; Xie, H. A Review on Applications of Remote Sensing and Geographic Information Systems (GIS) in Water Resources and Flood Risk Management. Water 2018, 10, 608. [Google Scholar] [CrossRef] [Green Version]
- Mason, D.C.; Dance, S.L.; Cloke, H.L. Floodwater detection in urban areas using Sentinel-1 and WorldDEM data. J. Appl. Remote Sens. 2021, 15, 032003. [Google Scholar] [CrossRef]
- Ismail, E. Flash Flood Hazard Mapping Using Satellite Images and GIS Tools: A case study of Najran City, Kingdom of Saudi Arabia (KSA). Egypt. J. Remote Sens. Space Sci. 2015, 18, 261–278. [Google Scholar] [CrossRef] [Green Version]
- Liu, R.; Chen, Y.; Wu, J.; Gao, L.; Barrett, D.; Xu, T.; Li, L.; Huang, C.; Yu, J. Assessing spatial likelihood of flooding hazard using naïve Bayes and GIS: A case study in Bowen Basin, Australia. Stoch. Environ. Res. Risk Assess. 2016, 30, 1575–1590. [Google Scholar] [CrossRef]
- Liu, R.; Chen, Y.; Wu, J.; Gao, L.; Barrett, D.; Xu, T.; Li, X.; Li, L.; Huang, C.; Yu, J. Integrating entropy—based naïve Bayes and GIS for spatial evaluation of flood hazard. Risk Anal. 2017, 37, 756–773. [Google Scholar] [CrossRef] [PubMed]
- Chen, Y.; Liu, R.; Barrett, D.; Gao, L.; Zhou, M.; Renzullo, L.; Emelyanova, I. A spatial assessment framework for evaluating flood risk under extreme climates. Sci. Total Environ. 2015, 538, 512–523. [Google Scholar] [CrossRef]
- Liu, S.; Liu, R.; Tan, N. A Spatial Improved-kNN-Based Flood Inundation Risk Framework for Urban Tourism under Two Rainfall Scenarios. Sustainability 2021, 5, 2859. [Google Scholar] [CrossRef]
- Dhiman, R.; Vishnu, R.; Eldho, R.; Inamdar, A. Flood risk and adaptation in Indian coastal cities: Recent scenarios. Appl. Water Sci. 2019, 9, 5. [Google Scholar] [CrossRef] [Green Version]
- Sowmya, K.; John, C.M.; Shrivasthava, N.K. Urban flood vulnerability zoning of Cochin City, southwest coast of India, using remote sensing and GIS. Nat. Hazards 2015, 75, 1271–1286. [Google Scholar] [CrossRef]
- Amarnath, G. An algorithm for rapid flood inundation mapping from optical data using a reflectance differencing technique. J. Flood Risk Manag. 2014, 7, 239–250. [Google Scholar] [CrossRef]
- Mazumder, S.K. Determination of waterway under a bridge in Himalayan Region-Some Case Studies. J. Indian Roads Congr. 2009. [Google Scholar]
- Pramanik, N.; Panda, R.K.; Sen, D. One dimensional hydrodynamic modeling of river flow using DEM extracted river cross-sections. Water Resour. Manag. 2010, 24, 835–852. [Google Scholar] [CrossRef]
- Timbadiya, P.V.; Patel, P.L.; Porey, P.D. Calibration of channel and flood plain roughness using 1d/2d integrated hydrodynamic model: A study of surat city on lower tapi river. In Proceedings of the 10th International Conference on Hydroscience and Engineering, Orlando, FL, USA, 4–7 November 2012; pp. 4–7. [Google Scholar]
- Doiphode, S.L.; Oak, R.A. Dynamic Flood Routing and Unsteady Flow Modeling: A Case Study of Upper Krishna River. IJAET 2012, 3, 55–59. [Google Scholar]
- Sankhua, R.N.; Sathe, B.K.; Srivastava, A.K. A Case Study on Dynamic Wave Routing and Unsteady Flood Modelling of Part of Krishna Basin with HEC-RAS. India Water Week Water, Energy and Food Security. 2012. Available online: https://indiawaterweek.thewaternetwork.com/storage/TFX%5CDocumentBundle%5CEntity%5CDocument-n4buNwYaAKy1H0H2WbUErQ/FPssPyCjnA0AFVCVCYX4Ww/file/A%20Case%20Study%20on%20Dynamic%20Wave%20Routing%20and%20Unsteady%20Flood%20Modelling%20of%20Part%20of%20Krishna%20Basin%20With%20Hecras.pdf (accessed on 17 November 2021).
- Vijay, R.; Sargoankar, A.; Gupta, A. Hydrodynamic simulation of river Yamuna for riverbed assessment: A case study of Delhi region. Environ. Monit. Assess. 2007, 130, 381–387. [Google Scholar] [CrossRef]
- Vijay, R.; Sargaonkar, A.; Gupta, A. A hydrodynamic approach to address Yamuna riverbed development in Delhi. Can. J. Civ. Eng. 2009, 36, 1155–1163. [Google Scholar] [CrossRef]
- Husain, A.; Sharif, M.; Ahmad, M.L. Simulation of Floods in Delhi Segment of River Yamuna Using HEC-RAS. Am. J. Water Resour. 2018, 6, 162–168. [Google Scholar]
- Kumar, M.; Sharif, M.; Ahmed, S. Flood Estimation in River Yamuna (India) Using Peak-Over-Threshold Method. ISH 2018, 26, 291–300. [Google Scholar]
- Kumar, M.; Sharif, M.; Ahmed, S. Flood risk management strategies for national capital territory of Delhi, India. ISH J. Hydraul. Eng. 2019, 25, 248–259. [Google Scholar] [CrossRef]
- Biswas, A.K.; Saklani, U.; Tortajada, C. Truth about urban flooding: Cities like Mumbai get inundated regularly due to administrative apathy, not climate change. Times India Mumbai Ed. 2017, 31, 2017. [Google Scholar]
- Gupta, S. Impact of Floods in Delhi; Climatrans: New Delhi, India, 2017. [Google Scholar]
- Gupta, K. Challenges in developing urban flood resilience in India. Philos. Trans. R. Soc. A Math. Phys. Eng. Sci. 2020, 378, 20190211. [Google Scholar] [CrossRef] [PubMed] [Green Version]
- Singh, O.; Kumar, M. Flood occurrences, damages, and management challenges in India: A geographical perspective. Arab. J. Geosci. 2017, 10, 102. [Google Scholar] [CrossRef]
- Rafiq, F.; Ahmed, S.; Ahmad, S.; Khan, A.A. Urban floods in India. Int. J. Sci. Eng. Res. 2016, 7, 721–734. [Google Scholar]
- Madan, A.; Routray, J.K. Institutional framework for preparedness and response of disaster management institutions from national to local level in India with focus on Delhi. Int. J. Disaster Risk Reduct. 2015, 14, 545–555. [Google Scholar] [CrossRef]
- Gosain, A.K.; Khandelwal, P.K.; Kulshrestha, S. Urban floods: Case study of Delhi. Disaster Dev. 2009, 3, 15. [Google Scholar]
- Ghosh, S.K.; Gupta, H.N.; Johri, A.P. A comparative hydro meteorological study of the historical floods in the Yamuna river. Mausam 1982, 33, 197–206. [Google Scholar]
- Prashar, S.; Shaw, R.; Takeuchi, Y. Assessing the resilience of Delhi to climate-related disasters: A comprehensive approach. Nat. Hazards 2012, 64, 1609–1624. [Google Scholar] [CrossRef]
- Ghosh, S.; Duggal, Y.; Roy, N.; Mehra, H. Rainfall in the upper Yamuna catchment in relation to moisture transport over Delhi. Mausam 1987, 38, 93–96. [Google Scholar]
- Parida, Y.; Saini, S.; Chowdhury, J.R. Economic growth in the aftermath of floods in Indian states. Environ. Dev. Sustain. 2020, 23, 535–561. [Google Scholar] [CrossRef]
- Mall, R.K.; Singh, R.; Gupta, A.; Singh, R.S.; Rathore, L.S. Water Resources and Climate Change: An Indian perspective. Curr. Sci. 2006, 90, 1610–1626. [Google Scholar]
- Parida, Y. Economic impact of floods in the Indian states. Environ. Dev. Econ. 2019, 25, 267–290. [Google Scholar] [CrossRef]
- Gupta, S.; Javed, A.; Datt, D. Economics of Flood Protection in India. InFlood Problem and Management in South Asia; Springer: Dordrecht, The Netherlands, 2003; pp. 199–210. [Google Scholar]
- Ahmed, M.L.; Sharif, M.; Shakeel, M. Analysis of Discharge and Gauge Level Data at Old Railway Bridge, Delhi. In Proceedings of the International Conference on Artificial Intelligence, Energy and Manufacturing Engineering (ICAEME’2014), Kuala Lumpur, Malaysia, 9 June 2014. [Google Scholar]
- De, U.S.; Singh, G.P.; Rase, D.M. Urban flooding in recent decades in four mega cities of India. J. Ind. Geophys. Union 2013, 17, 153–165. [Google Scholar]
- India, P. Census of India 2011 Provisional Population Totals; Office of the Registrar General and Census Commissioner: New Delhi, India, 2011. [Google Scholar]
- Jain, M.; Dimri, A.P.; Niyogi, D. Urban Sprawl Patterns and Processes in Delhi from 1977 to 2014 Based on Remote Sensing and Spatial Metrics Approaches. Earth Interact. 2016, 20, 1–29. [Google Scholar] [CrossRef]
- Jain, M.; Taubenböck, H.; Namperumal, S. Seamless urbanisation and knotted city growth: Delhi Metropolitan Region. In Proceedings of the Real Corp, Essen, Germany, 18–20 May 2011; pp. 853–862. [Google Scholar]
- Singh, R.; Salunkhe, U.; Patil, V.V. Nature and determinants of migration: Insights from NSSO data in three states of India. Migr. Lett. 2021, 18, 261–280. [Google Scholar] [CrossRef]
- Sutoris, P. Elitism and its challengers: Educational development ideology in postcolonial India through the prism of film, 1950–1970. Int. J. Educ. Dev. 2018, 60, 1–9. [Google Scholar] [CrossRef]
- Han, Y.; Qin, R.; Huang, X. Assessment of dense image matchers for digital surface model generation using airborne and spaceborne images—An update. Photogramm. Record 2020, 35, 58–80. [Google Scholar] [CrossRef]
- Doğruluk, M.; Yanalak, M. Object-based modelling and accuracy assessment of Gordion tumuli using very high-resolution stereo satellite images. Int. J. Remote Sens. 2021, 42, 7239–7269. [Google Scholar] [CrossRef]
- Meraj, G.; Romshoo, S.A.; Yousuf, A.R. Geoinformatics approach to qualitative forest density loss estimation and protection cum conservation strategy-a case study of Pir Panjal range, J.&K.; India. Int. J. Curr. Res. Rev. 2012, 4, 47–61. [Google Scholar]
- Meraj, G.; Singh, S.K.; Kanga, S.; Islam, N. Modeling on comparison of ecosystem services concepts, tools, methods and their ecological-economic implications: A review. Model. Earth Syst. Environ. 2021, 1–20. [Google Scholar] [CrossRef]
- Meraj, G.; Kanga, S.; Kranjčić, N.; Đurin, B.; Singh, S.K. Role of Natural Capital Economics for Sustainable Management of Earth Resources. Earth 2021, 2, 622–634. [Google Scholar] [CrossRef]
- Elmhirst, R.; Middleton, C.; Resurrección, B.P. Migration and floods in Southeast Asia: A mobile political ecology of vulnerability, resilience and social justice. In Living with Floods in a Mobile Southeast Asia; Routledge: Abingdon, UK, 2017; pp. 1–21. [Google Scholar]
- Venkatappa, M.; Sasaki, N.; Han, P.; Abe, I. Impacts of droughts and floods on croplands and crop production in Southeast Asia–An application of Google Earth Engine. Sci. Total Environ. 2021, 795, 148829. [Google Scholar] [CrossRef] [PubMed]
- Middleton, C.; Elmhirst, R.; Chantavanich, S. (Eds.) Living with Floods in a Mobile Southeast Asia: A Political Ecology of Vulnerability, Migration and Environmental Change; Routledge: Abingdon, UK, 2017. [Google Scholar]
- Tembata, K.; Takeuchi, K. Floods and Exports: An Empirical Study on Natural Disaster Shocks in Southeast Asia. Econ. Disasters Clim. Chang. 2018, 3, 39–60. [Google Scholar] [CrossRef] [Green Version]
- Chen, A.; Giese, M.; Chen, D. Flood impact on Mainland Southeast Asia between 1985 and 2018—The role of tropical cyclones. J. Flood Risk Manag. 2020, 13, e12598. [Google Scholar] [CrossRef]
- Hochrainer-Stigler, S.; Schinko, T.; Hof, A.; Ward, P.J. Adaptive risk management strategies for governments under future climate and socioeconomic change: An application to riverine flood risk at the global level. Environ. Sci. Policy 2021, 125, 10–20. [Google Scholar] [CrossRef]
- García-Ayllón, S. New Strategies to Improve Co-Management in Enclosed Coastal Seas and Wetlands Subjected to Complex Environments: Socio-Economic Analysis Applied to an International Recovery Success Case Study after an Environmental Crisis. Sustainability 2019, 11, 1039. [Google Scholar] [CrossRef] [Green Version]
- Katusiime, J.; Schütt, B. Integrated Water Resources Management Approaches to Improve Water Resources Governance. Water 2020, 12, 3424. [Google Scholar] [CrossRef]
- Tellman, B.; Sullivan, J.A.; Kuhn, C.; Kettner, A.J.; Doyle, C.S.; Brakenridge, G.R.; Erickson, T.A.; Slayback, D.A. Satellite imaging reveals increased proportion of population exposed to floods. Nature 2021, 596, 80–86. [Google Scholar] [CrossRef]
- Bhola, P.K.; Leandro, J.; Disse, M. Building hazard maps with differentiated risk perception for flood impact assessment. Nat. Hazards Earth Syst. Sci. 2020, 20, 2647–2663. [Google Scholar] [CrossRef]
- Allen, S.; Ballesteros-Canovas, J.; Randhawa, S.; Singha, A.; Huggel, C.; Stoffel, M. Translating the concept of climate risk into an assessment framework to inform adaptation planning: Insights from a pilot study of flood risk in Himachal Pradesh, Northern India. Environ. Sci. Policy 2018, 87, 1–10. [Google Scholar] [CrossRef]
- Mustafa, A.; Szydłowski, M. Application of different building representation techniques in HEC-RAS 2-D for urban flood modeling using the Toce River experimental case. Peer J. 2021, 9, e11667. [Google Scholar] [CrossRef]
- Attari, M.; Hosseini, S.M. A simple innovative method for calibration of Manning’s roughness coefficient in rivers using a similarity concept. J. Hydrol. 2019, 575, 810–823. [Google Scholar] [CrossRef]
- Chang, C.-H.; Lee, H.; Hossain, F.; Basnayake, S.; Jayasinghe, S.; Chishtie, F.; Saah, D.; Yu, H.; Sothea, K.; Du Bui, D. A model-aided satellite-altimetry-based flood forecasting system for the Mekong River. Environ. Model. Softw. 2018, 112, 112–127. [Google Scholar] [CrossRef]
- Pal, S.; Singha, P. Analyzing sensitivity of flood susceptible model in a flood plain river basin. Geocarto Int. 2021, 1–35. [Google Scholar] [CrossRef]
- Yusoff, I.M.; Ramli, A.; Al-Kasirah, N.A. Geospatial Data and Technology Application Towards Managing Flood Disaster in the Context of Industrial Revolution 4.0 (IR4. 0). J. Adv. Geospat. Sci. Technol. 2021, 1, 38–69. [Google Scholar]
- Jain, M.; Dawa, D.; Mehta, R.; Dimri, A.P.; Pandit, M. Monitoring land use change and its drivers in Delhi, India using multi-temporal satellite data. Model. Earth Syst. Environ. 2016, 2, 1–14. [Google Scholar] [CrossRef]
- Amin, A.; Iqbal, J.; Asghar, A.; Ribbe, L. Analysis of Current and Future Water Demands in the Upper Indus Basin under IPCC Climate and Socio-Economic Scenarios Using a Hydro-Economic WEAP Model. Water 2018, 10, 537. [Google Scholar] [CrossRef] [Green Version]
- Tena, T.M.; Mwaanga, P.; Nguvulu, A. Impact of Land Use/Land Cover Change on Hydrological Components in Chongwe River Catchment. Sustainability 2019, 11, 6415. [Google Scholar] [CrossRef] [Green Version]
- Babaei, S.; Ghazavi, R.; Erfanian, M. Urban flood simulation and prioritization of critical urban sub-catchments using SWMM model and PROMETHEE II approach. Phys. Chem. Earth Parts A/B/C 2018, 105, 3–11. [Google Scholar] [CrossRef]
- Zeng, Z.; Yuan, X.; Liang, J.; Li, Y. Designing and implementing an SWMM-based web service framework to provide decision support for real-time urban stormwater management. Environ. Model. Softw. 2020, 135, 104887. [Google Scholar] [CrossRef]


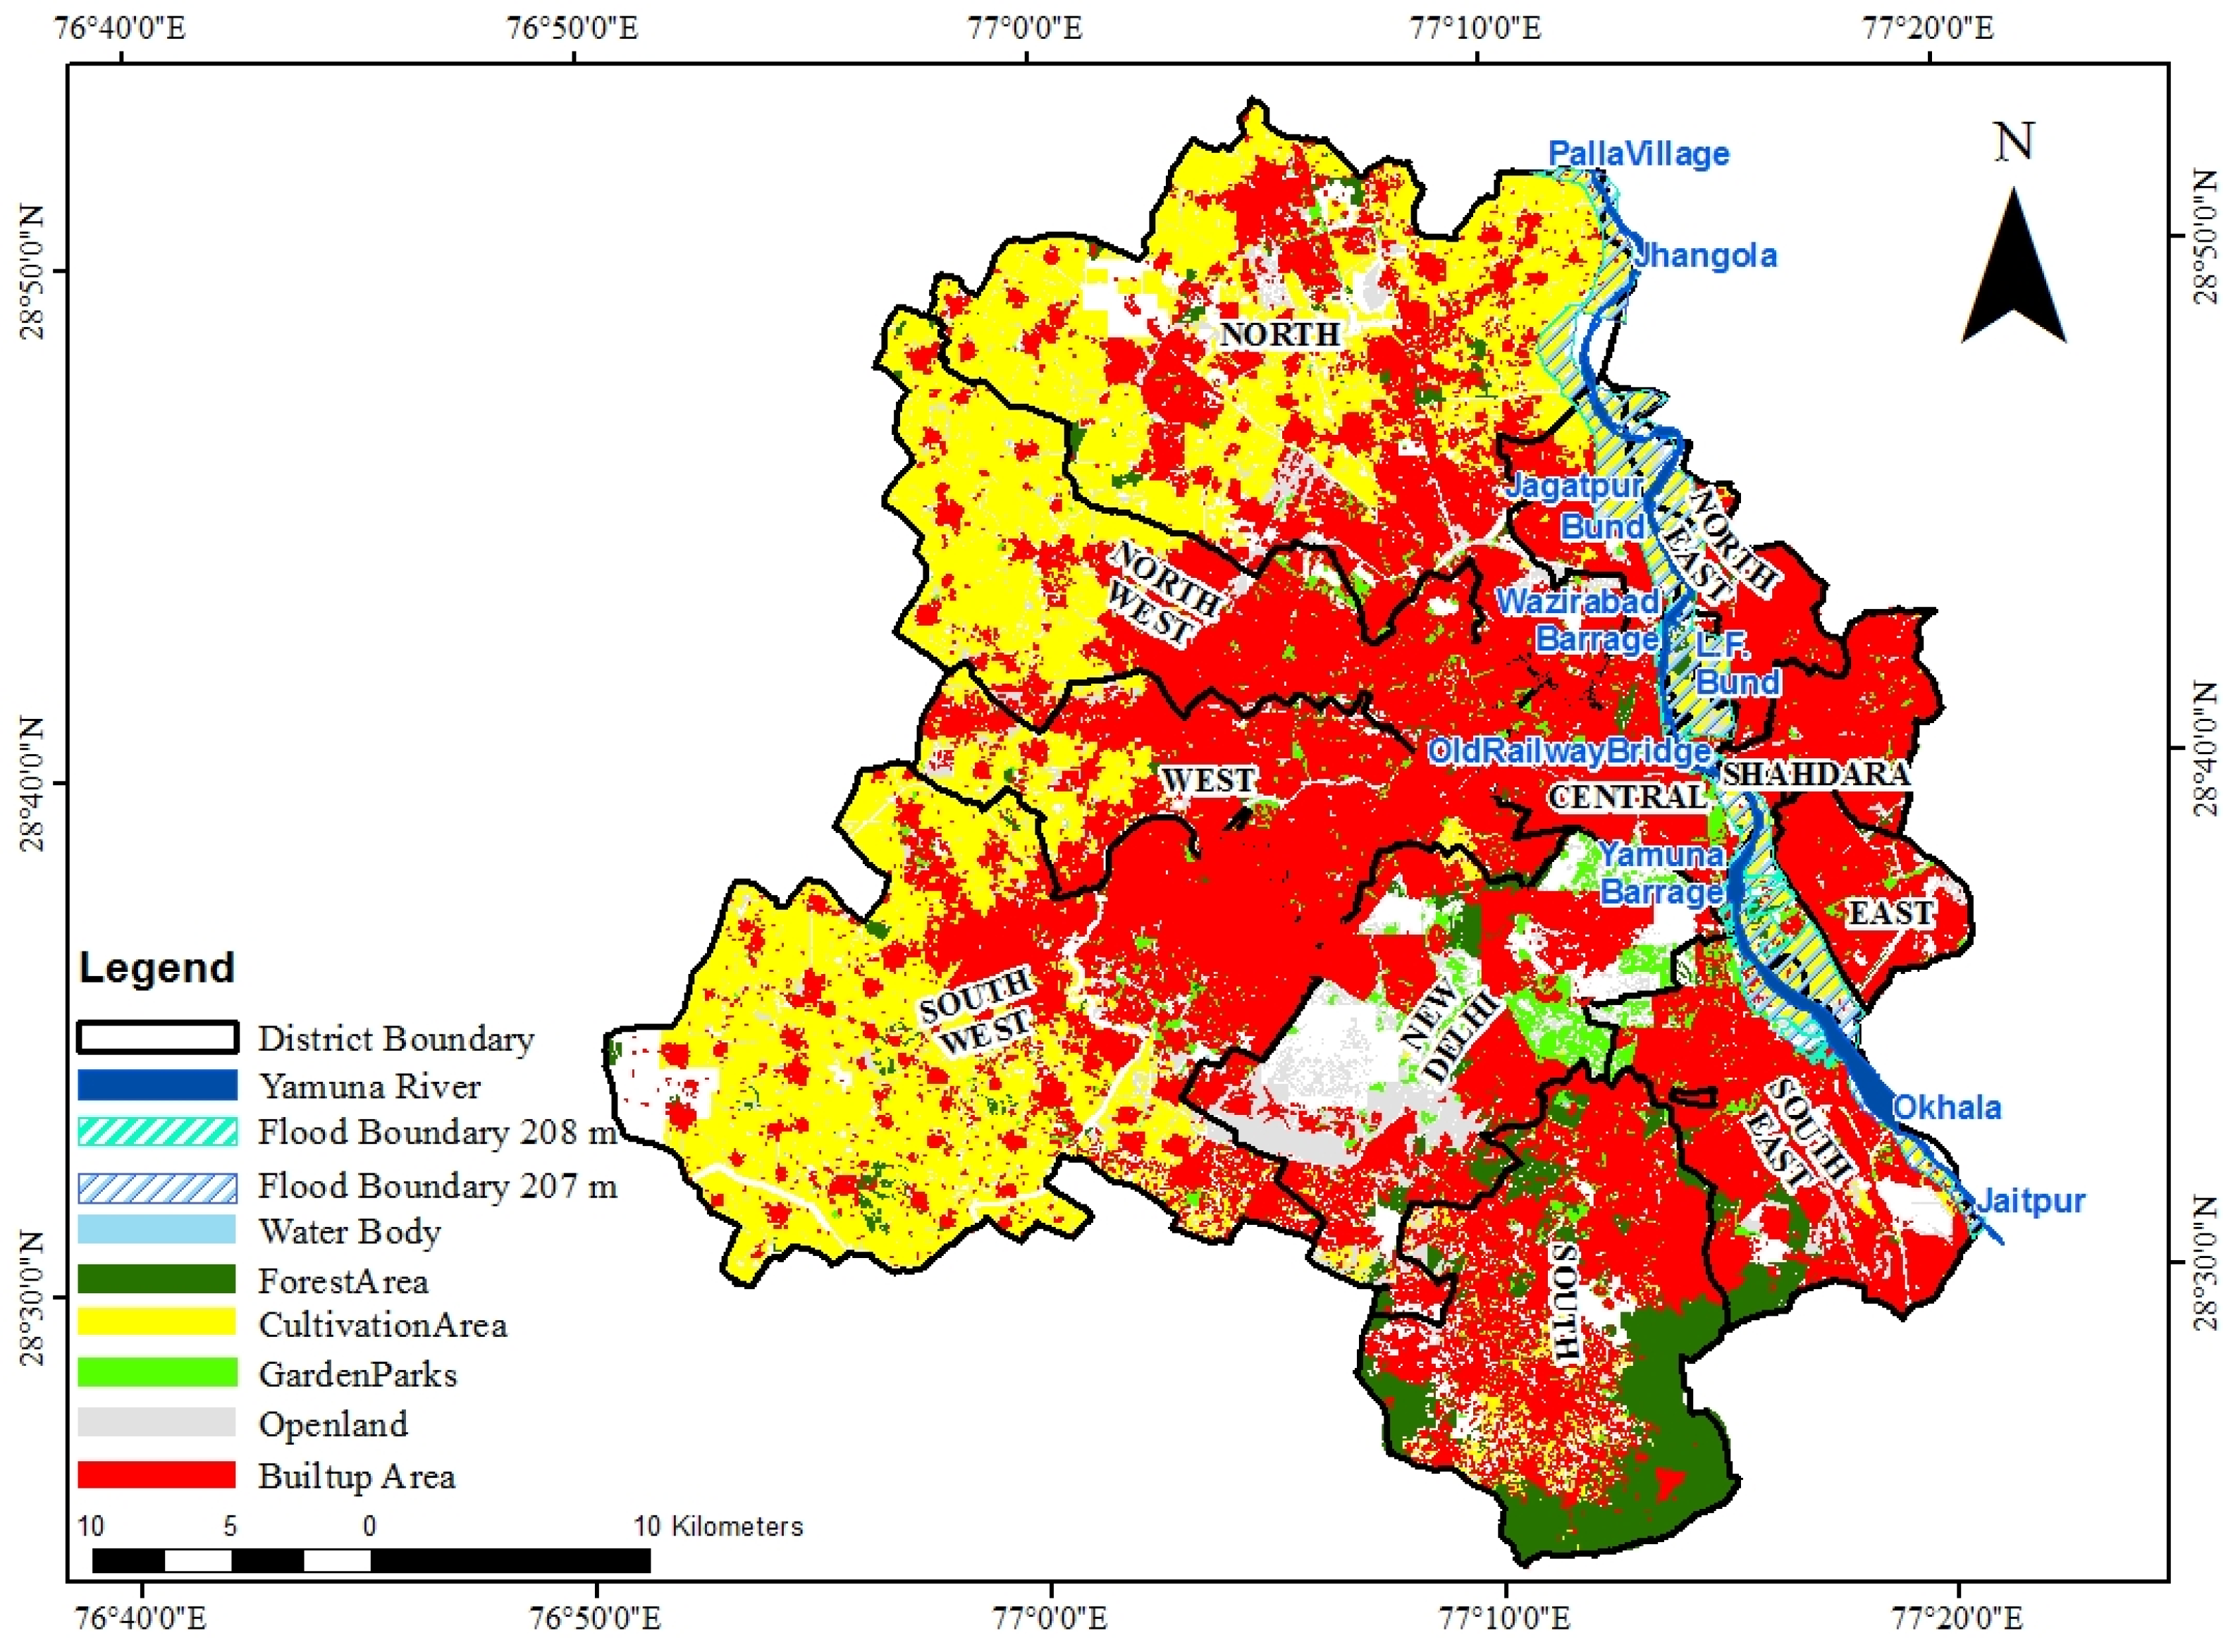
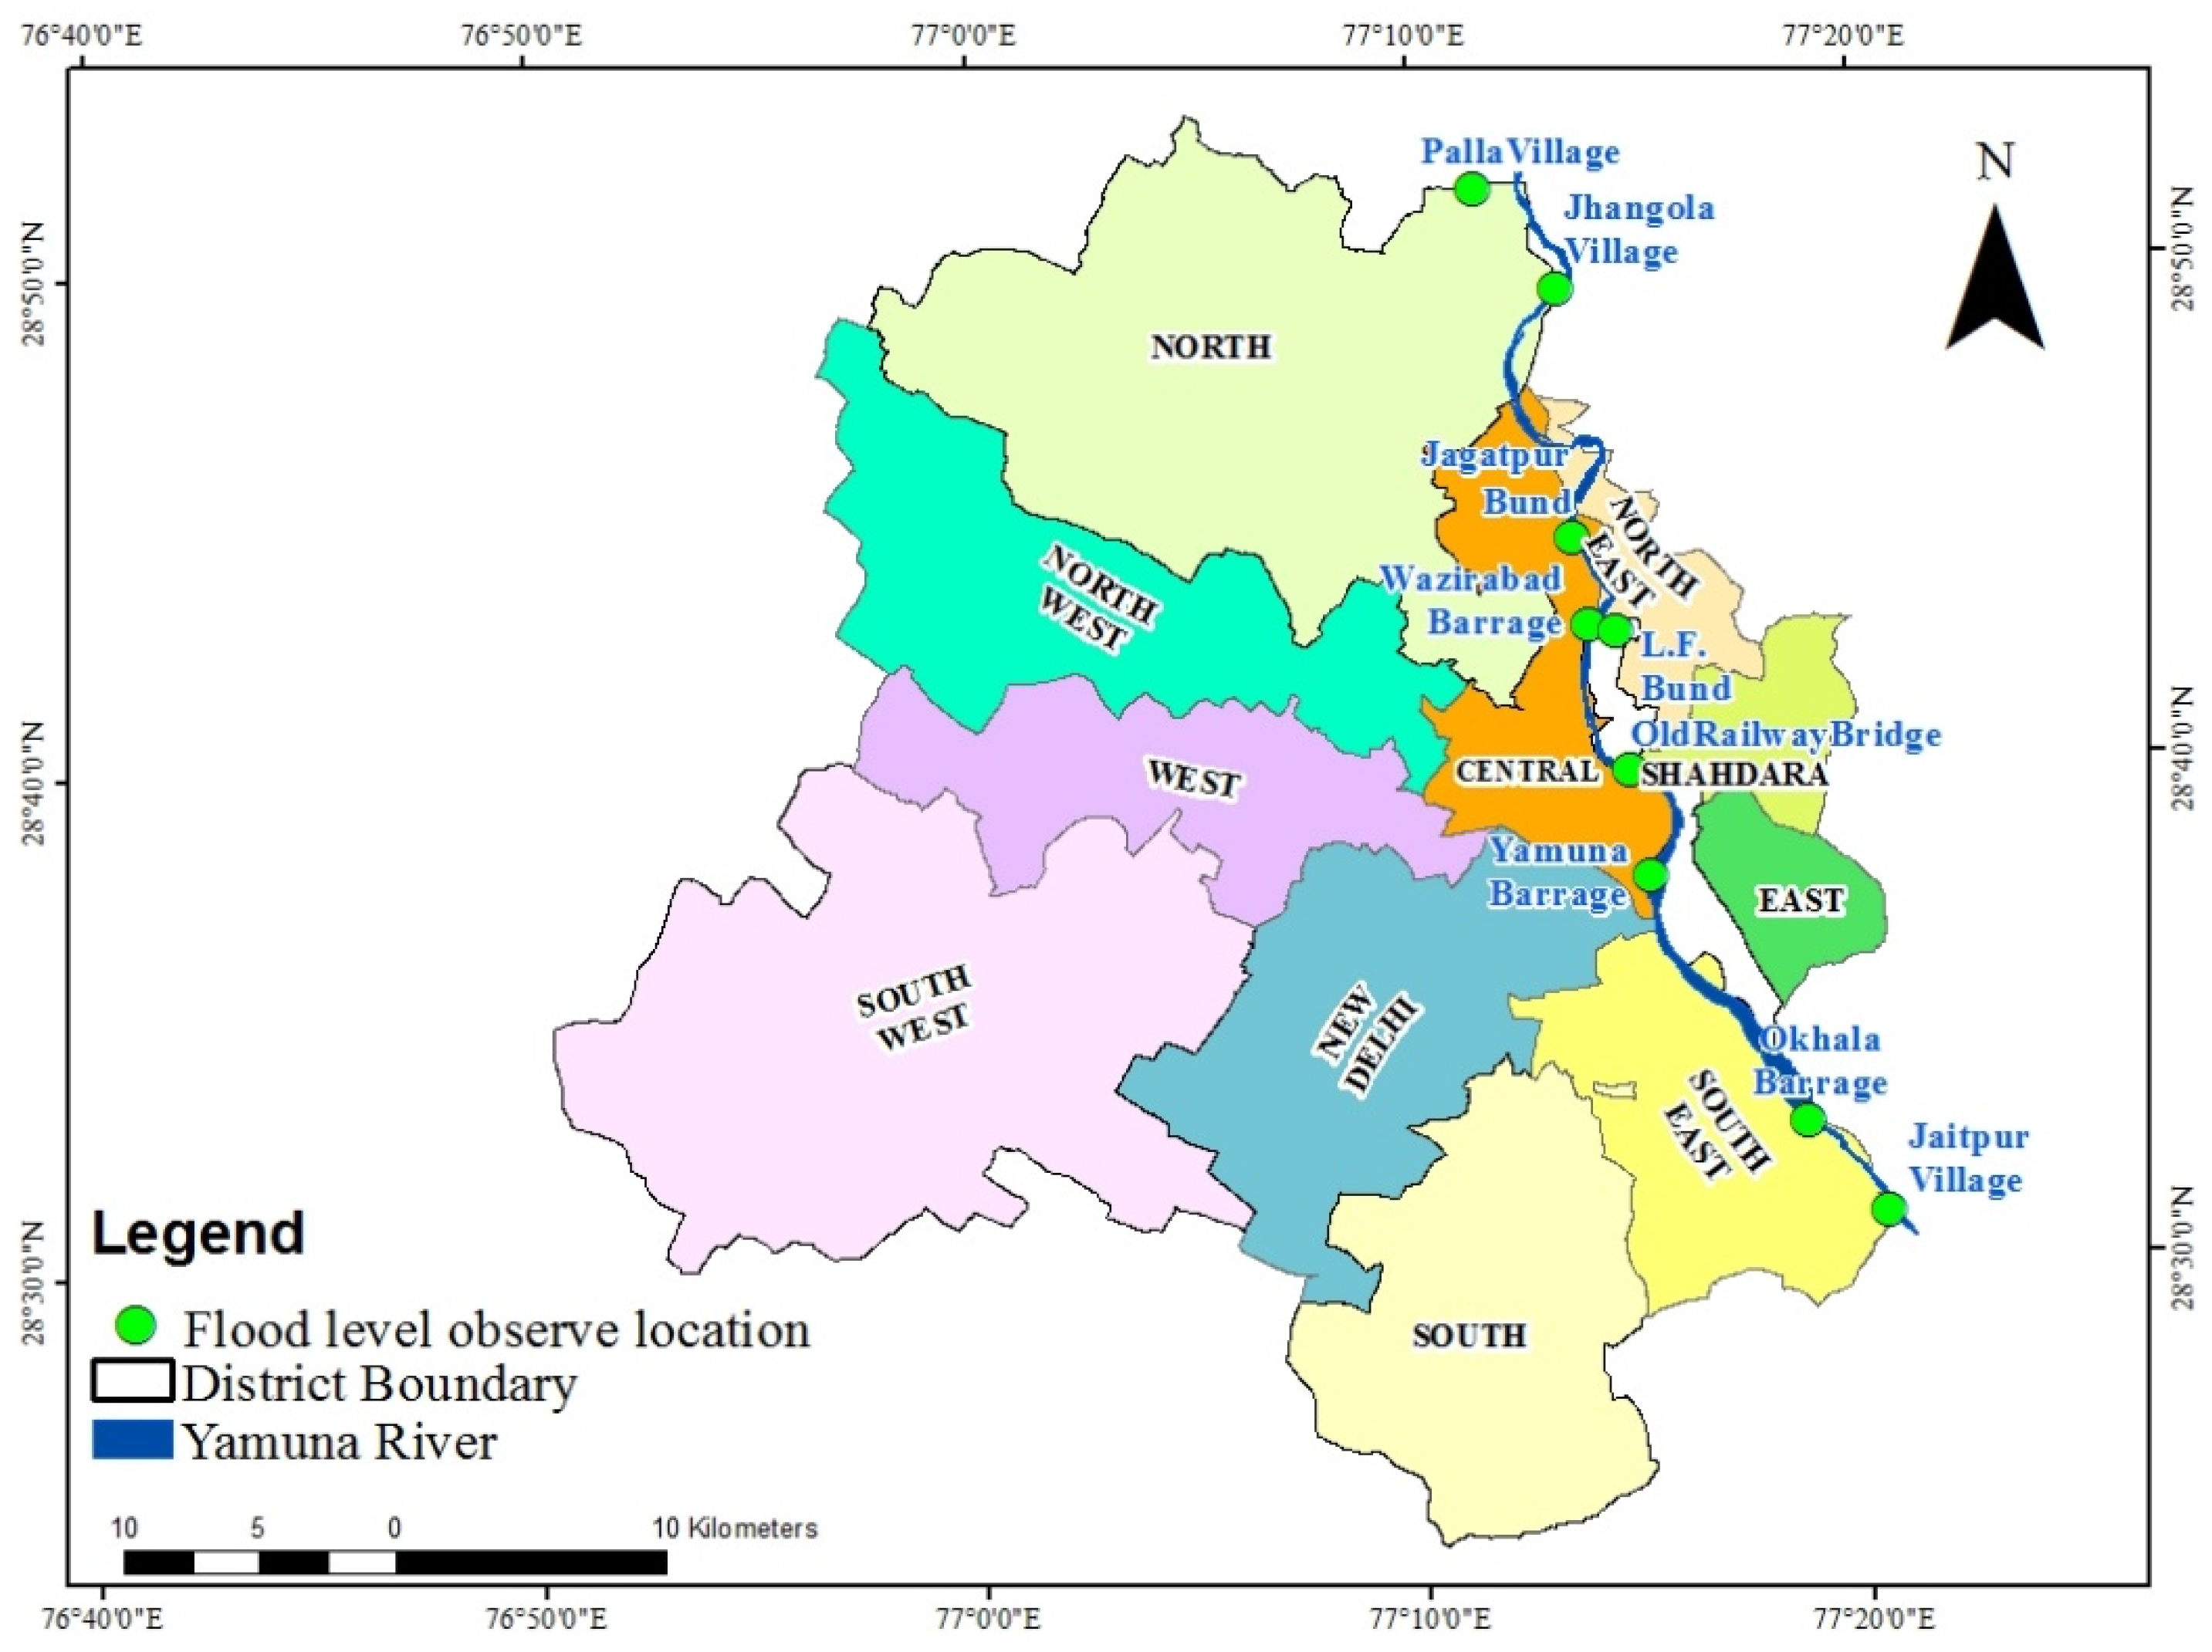
| Site Number | Location Name | Actual Flood Level Value 1 |
|---|---|---|
| 1 | Palla Village | 212.30 m |
| 2 | Jhangola Village | 211.15 m |
| 3 | Jagatpur Bund | 209.35 m |
| 4 | Wajirabad Barrage | 208.05 m |
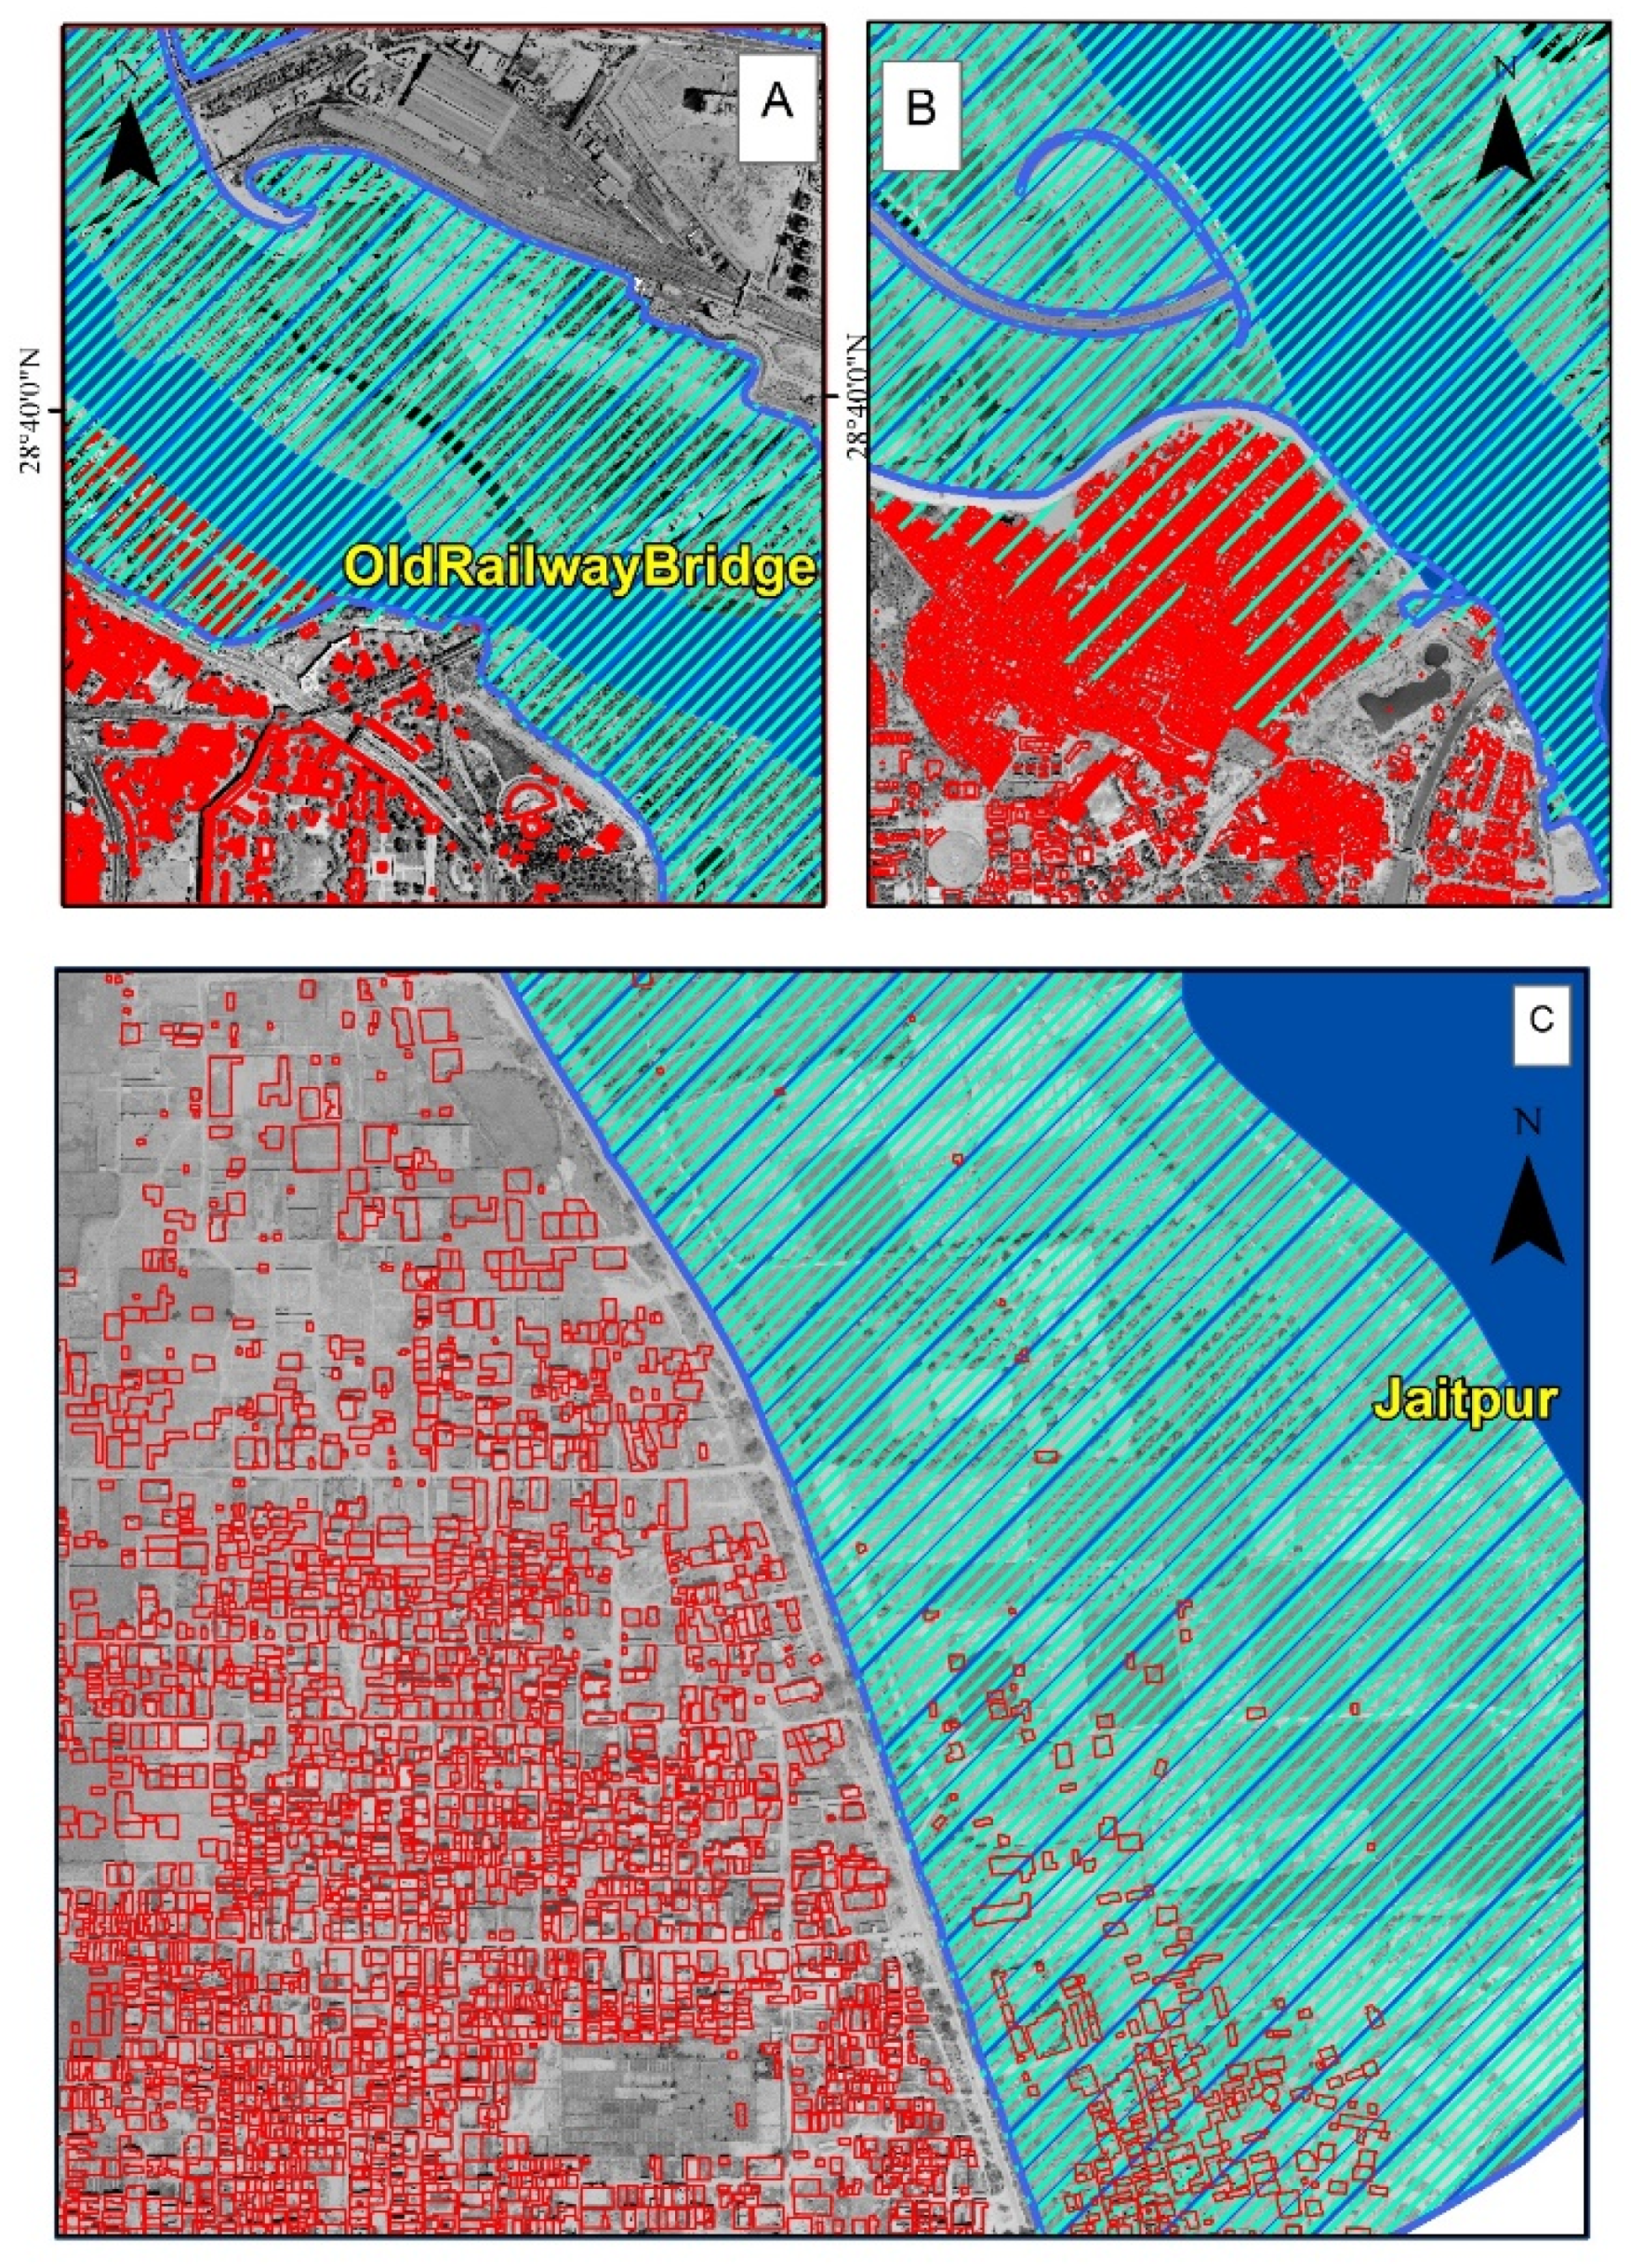
| 5 | Old Delhi Railway Bridge | 207.11 m |
| 6 | Yamuna Barrage | 205.06 m |
| 7 | Okhla Barrage | 200.10 m |
| 8 | Jaitpur Village | 198.07 m |
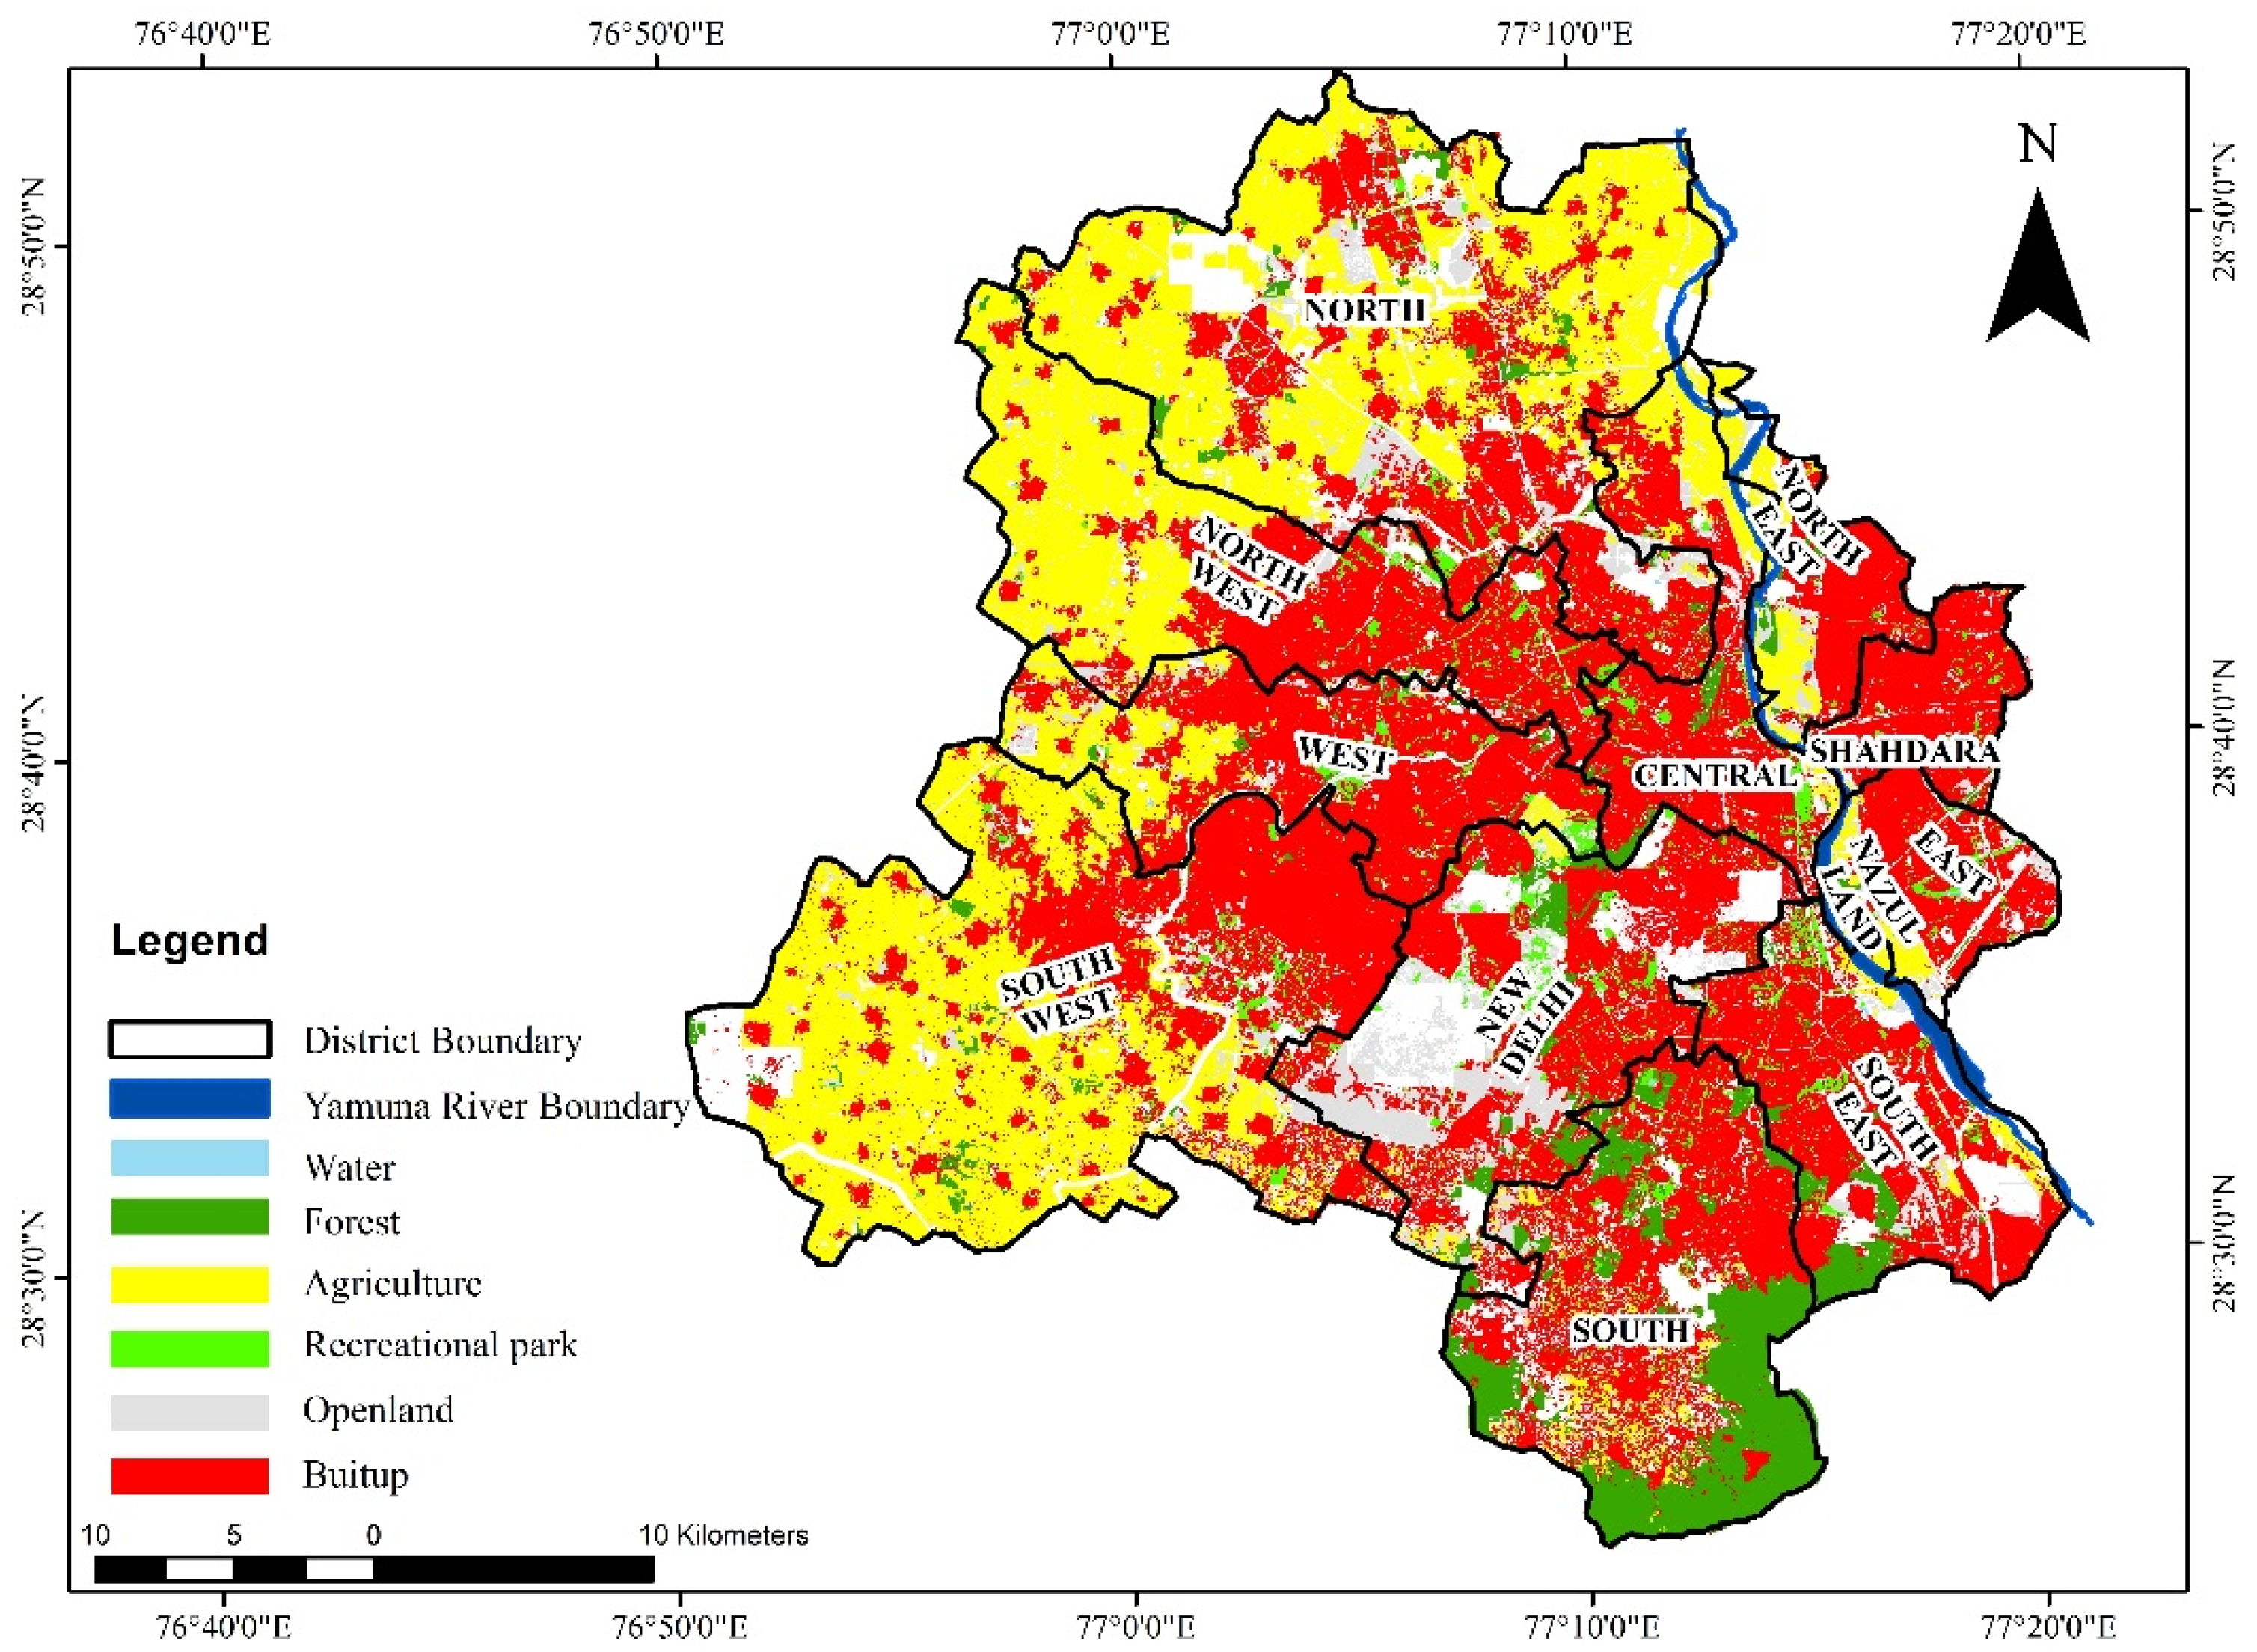
| S. No. | Class Name | Area (km2) | Percentage |
|---|---|---|---|
| 1 | Cultivation land | 450.69 | 42.05 |
| 2 | Forest | 131.35 | 12.26 |
| 3 | Water Bodies | 2.04 | 0.19 |
| 4 | Parks | 70.64 | 6.59 |
| 5 | Open Land | 252.82 | 23.59 |
| 6 | Built up | 164.13 | 15.32 |
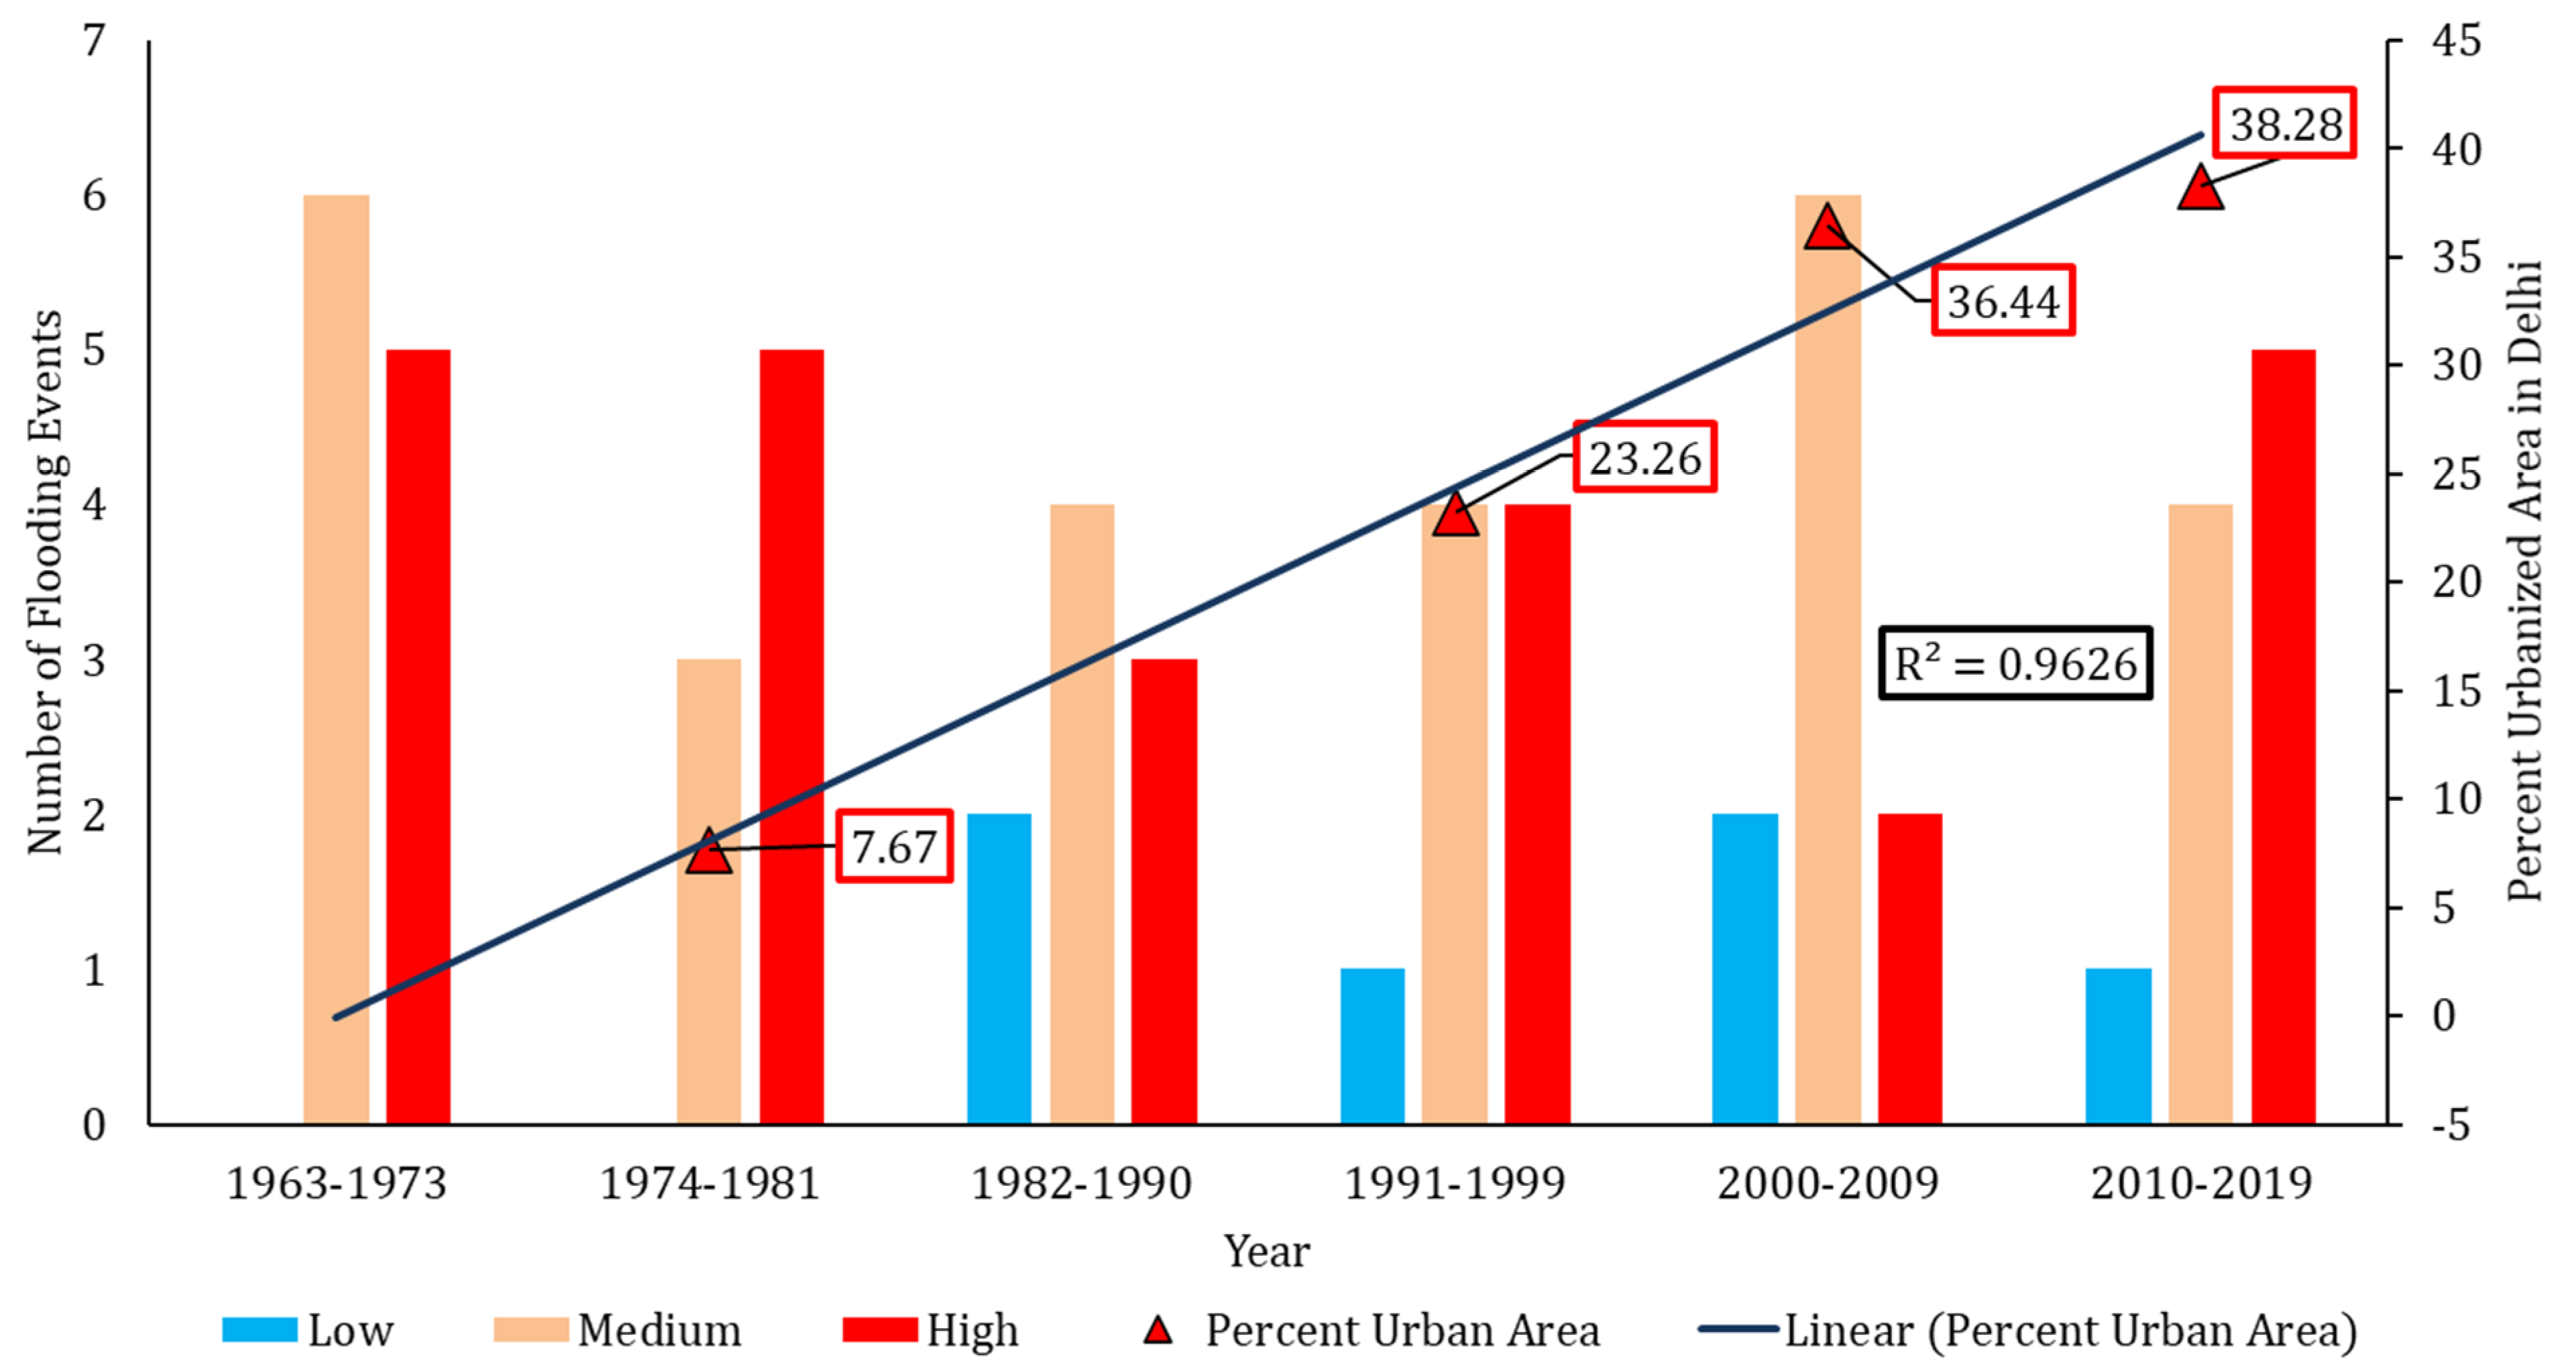
| Time Period | No. of Flooding Events * | Percent Urban Area # | ||
|---|---|---|---|---|
| Low (<204.22 m) | Medium (204.22 m–205.44 m) | High (>204.44 m) | ||
| 1963–1973 | 0 | 6 | 5 | - |
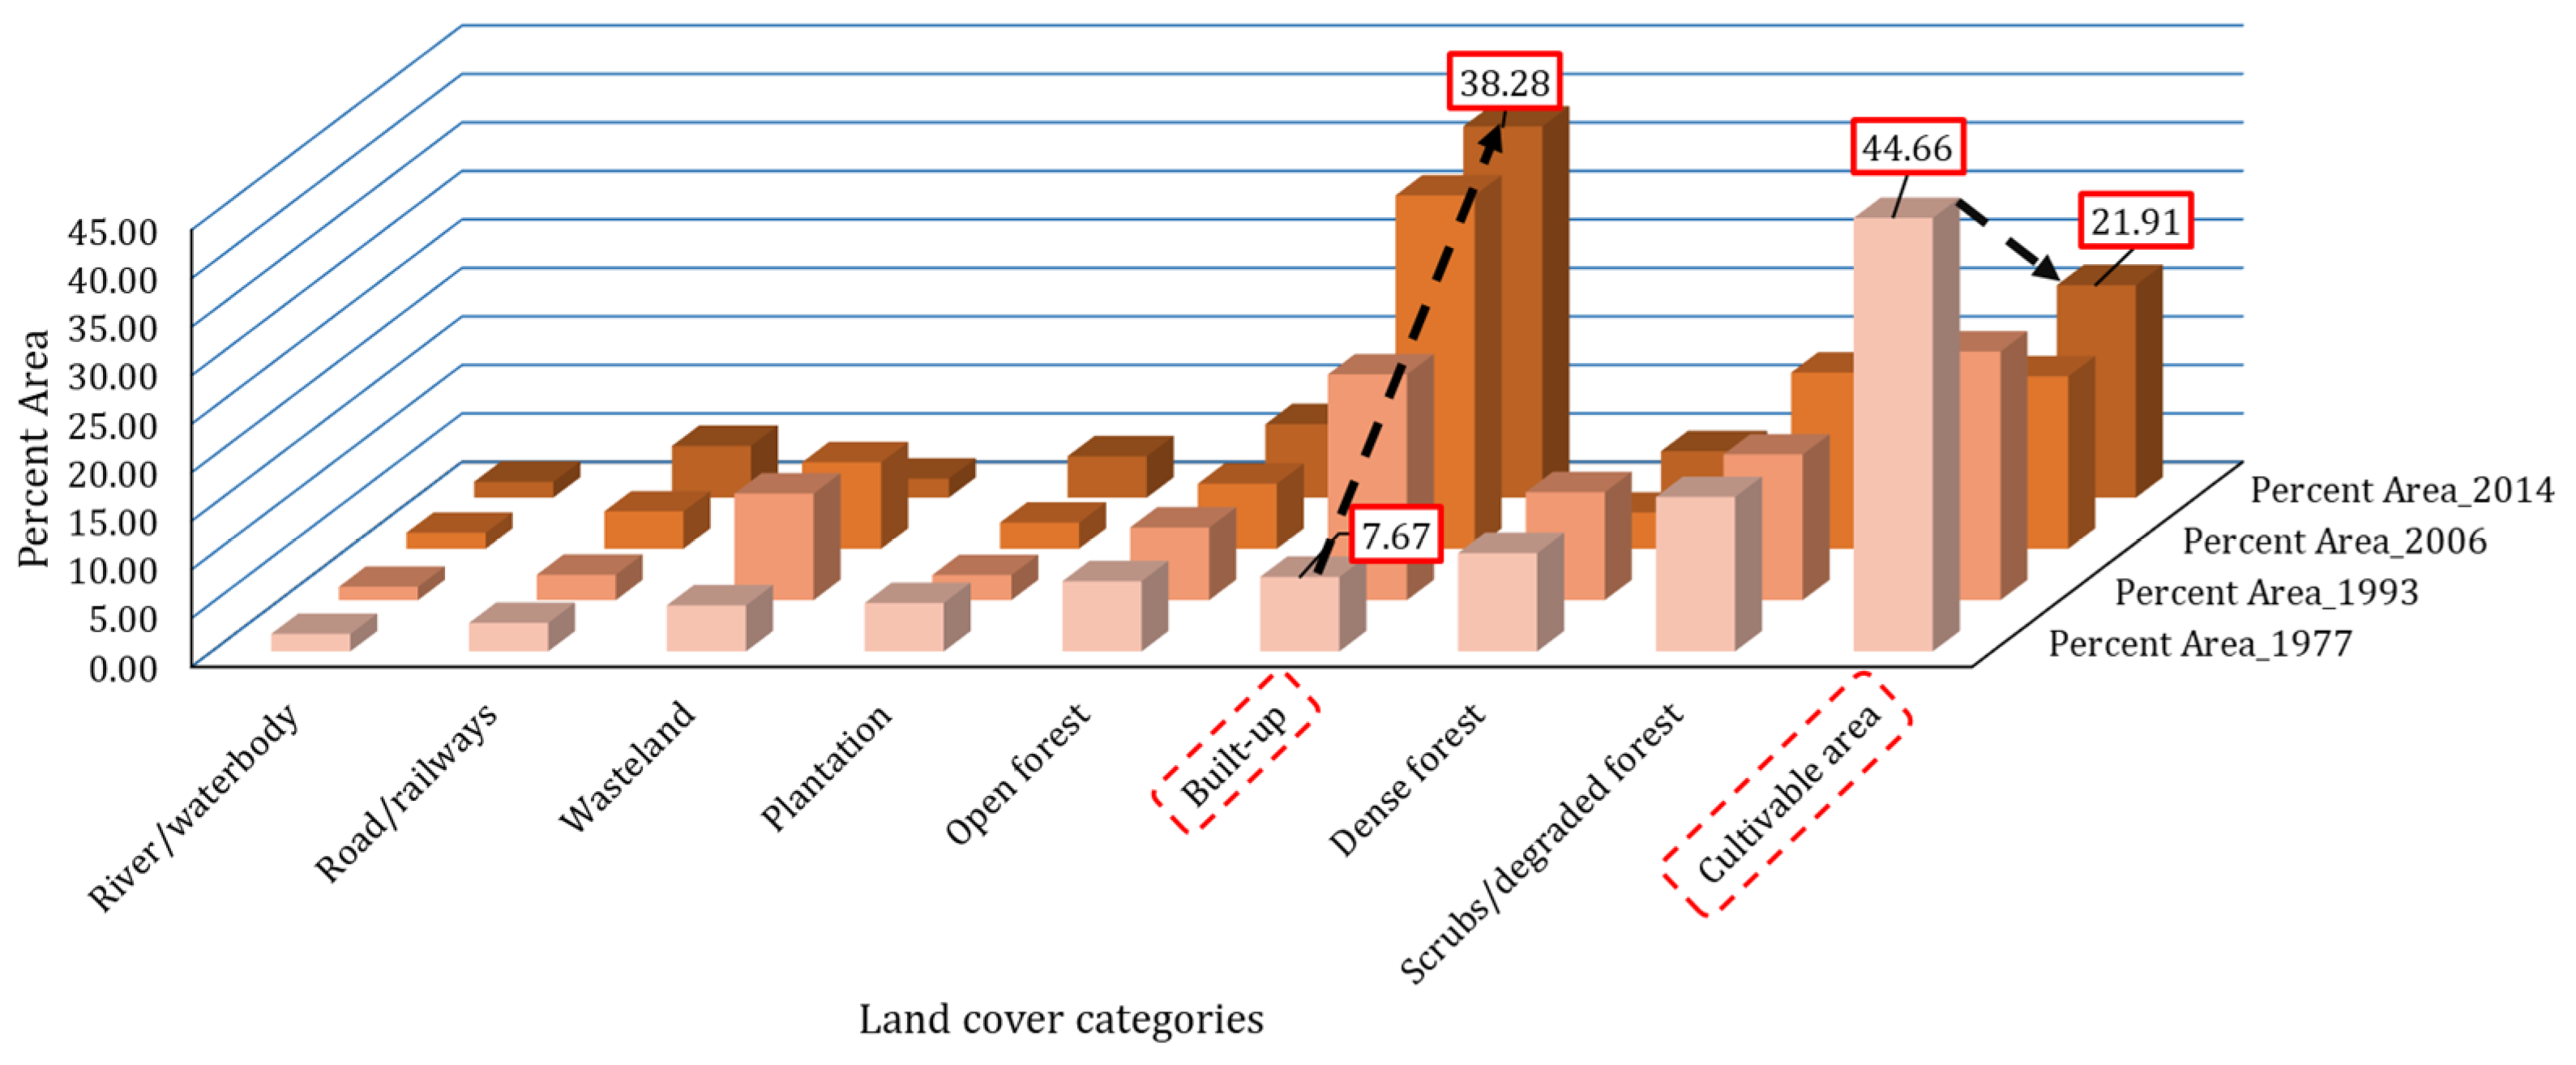
| 1974–1981 | 0 | 3 | 5 | 7.67 |
| 1982–1990 | 2 | 4 | 3 | - |
| 1991–1999 | 1 | 4 | 4 | 23.26 |
| 2000–2009 | 2 | 6 | 2 | 36.44 |
| 2010–2019 | 1 | 4 | 5 | 38.28 |
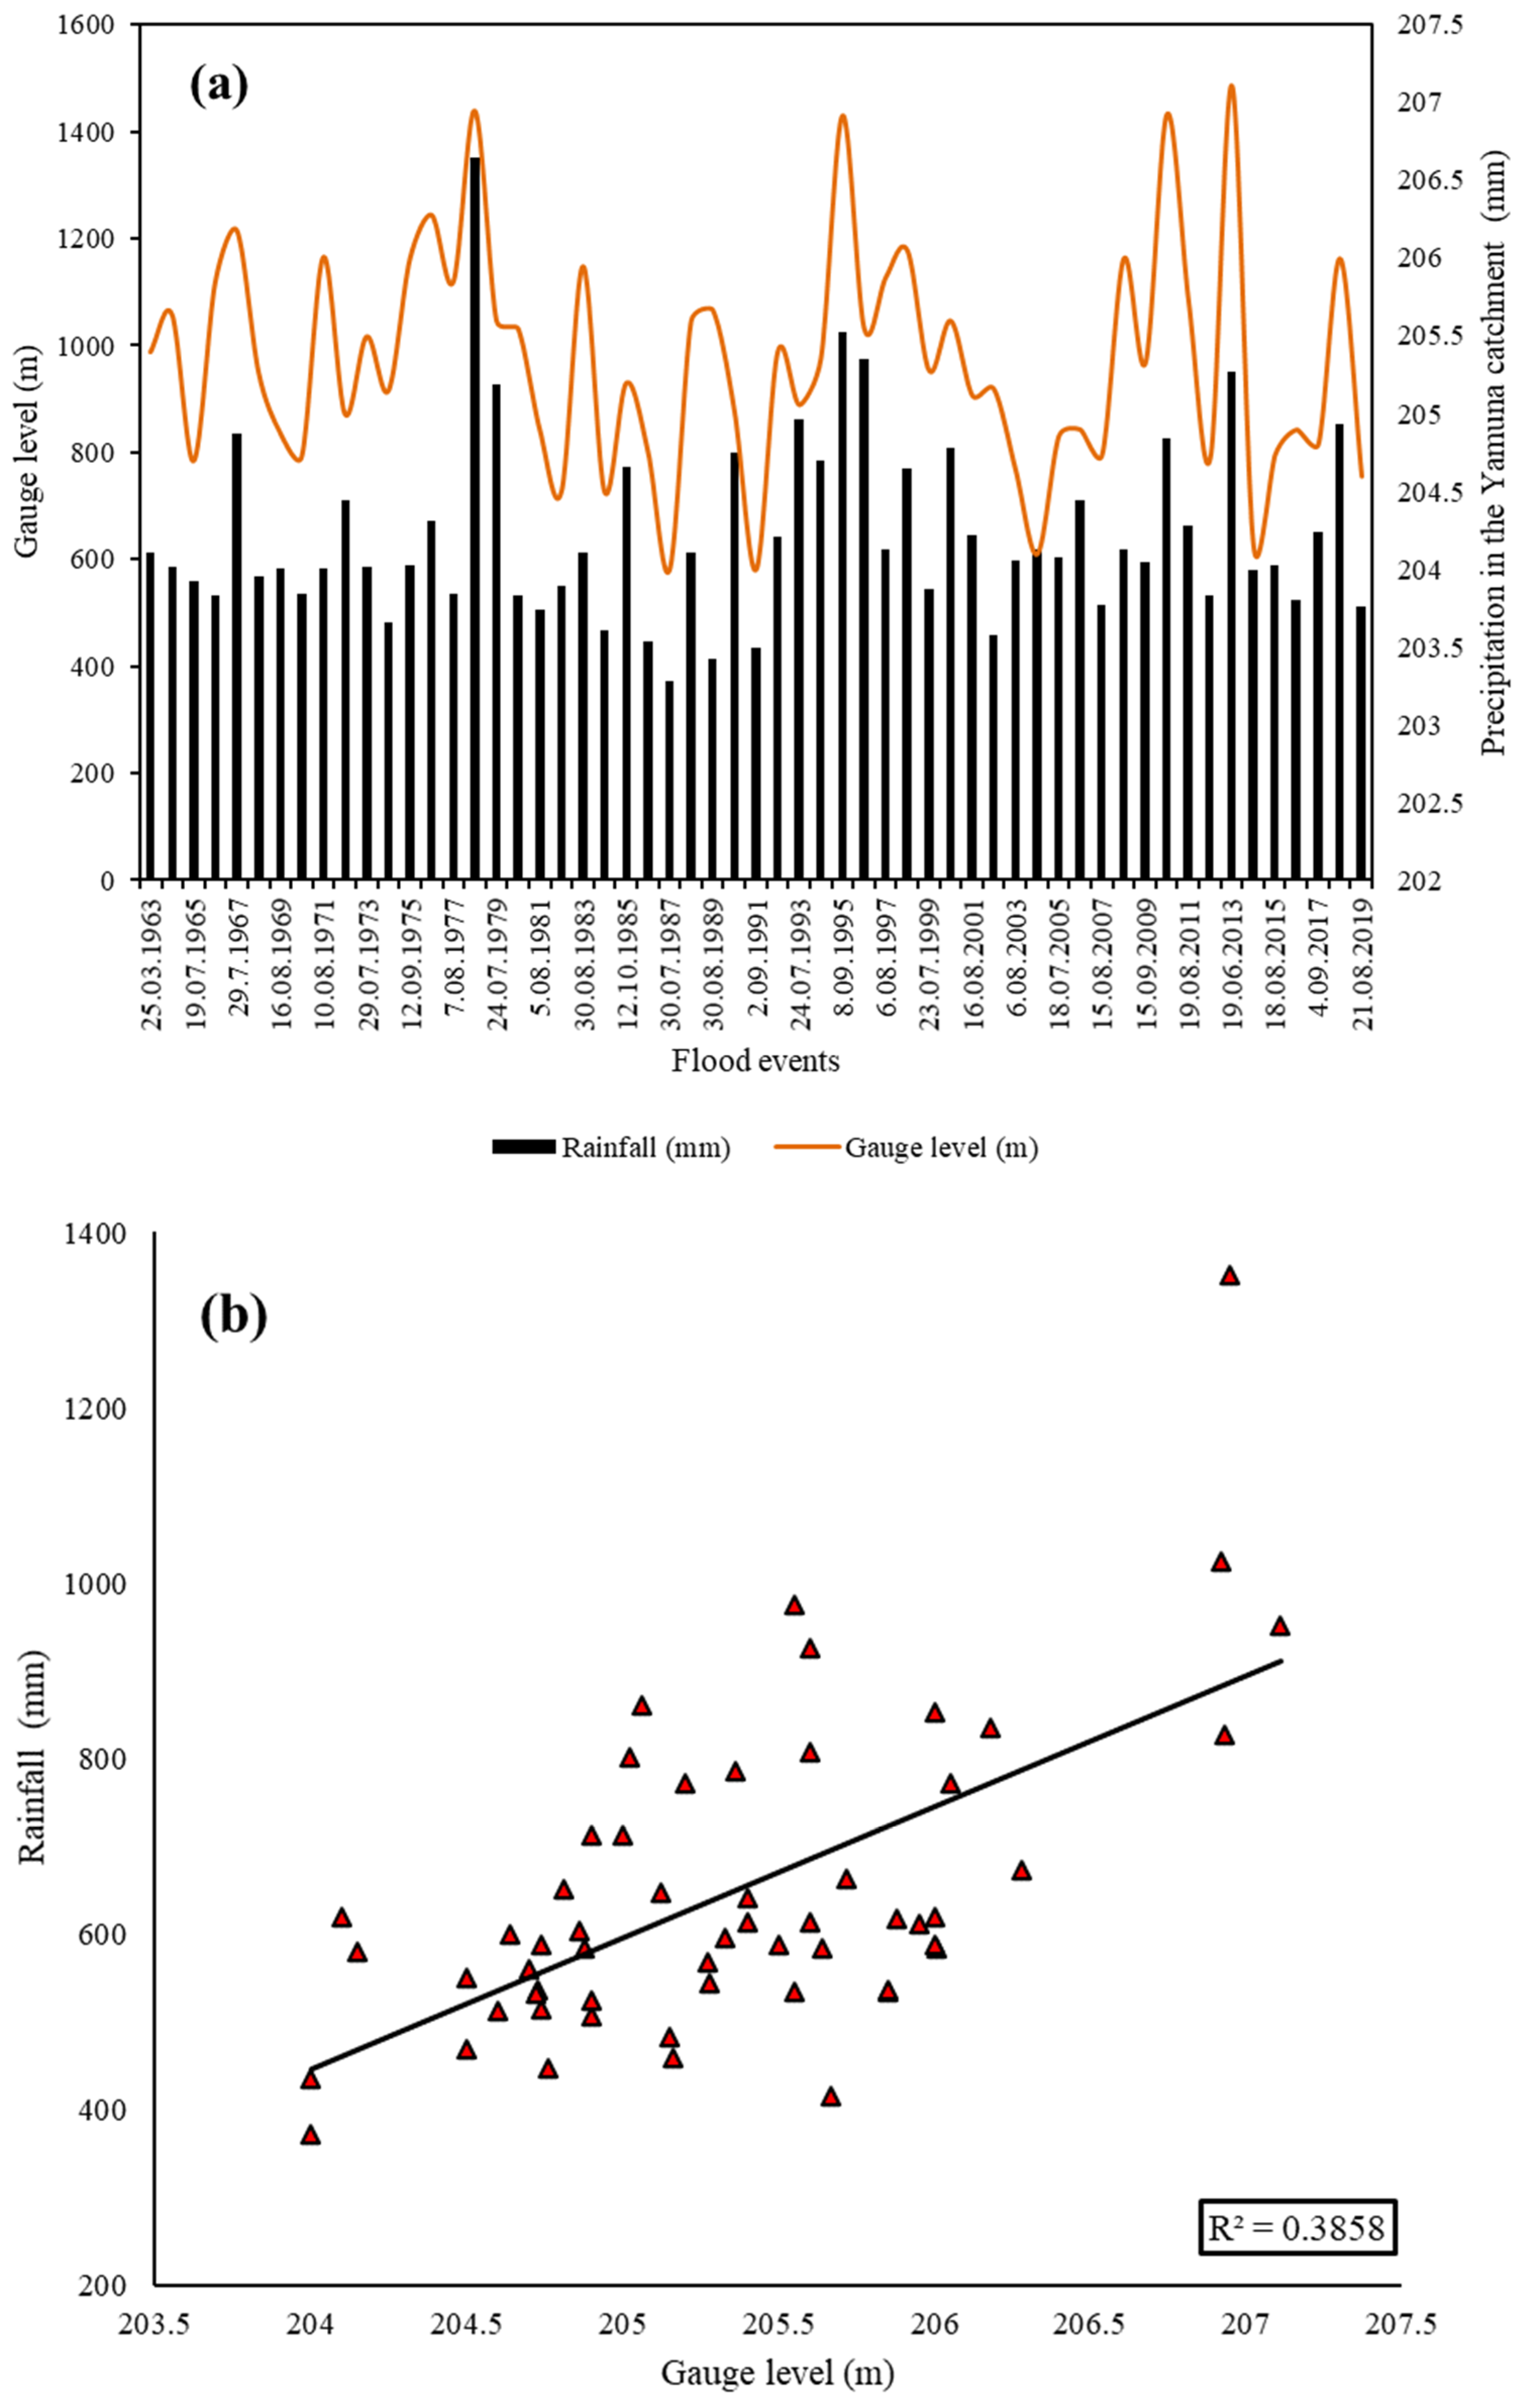
| (a) Regression Statistics of the linear regression model | ||||||||
| Multiple R | 0.65 | |||||||
| R Square | 0.41 | |||||||
| Adjusted R Square | 0.40 | |||||||
| Standard Error | 0.57 | |||||||
| Observations | 56 | |||||||
| (b) Significance of linear regression model | ||||||||
| Coefficients | Standard Error | t Stat | p-Value | Lower 95% | Upper 95% | Lower 95.0% | Upper 95.0% | |
| Intercept | 203.70 | 0.2781 | 732.45 | 0.005 | 203.14 | 204.25 | 203.14 | 204.25 |
| 613.607 | 0.0025 | 0.00041 | 6.145 | 0.005 | 0.0017 | 0.0033 | 0.0017 | 0.0033 |
| Land Use | Level on 207 m Old Delhi Railway Bridge | Level on 208 m Old Delhi Railway Bridge |
|---|---|---|
| Built up | 0.88 | 1.00 |
| Sand Area | 0.02 | 0.027 |
| Barren Land | 3.43 | 2.59 |
| Cultivation Area | 37.87 | 38.12 |
| Scrub Area | 6.16 | 6.22 |
| Vegetation Area | 2.23 | 0.34 |
| District Name | Actual Flood Boundary Area | Built-Up Area |
|---|---|---|
| Southeast | 10.71 | 0.42 |
| East | 12.01 | 0.20 |
| Shahdara | 1.101 | 0.0002 |
| Central | 16.05 | 0.12 |
| Northeast | 20.84 | 0.24 |
| North | 8.18 | 0.005 |
| Total | 68.89 | 1.00 |
| District Name | Actual Flood Boundary Area | Built-Up Area |
|---|---|---|
| Southeast | 9.81 | 0.60 |
| East | 11.83 | 0.20 |
| Shahdara | 1.08 | 0.0002 |
| Central | 15.39 | 0.042 |
| Northeast | 20.84 | 0.024 |
| North | 8.14 | 0.005 |
| Total | 67.09 | 0.88 |
Publisher’s Note: MDPI stays neutral with regard to jurisdictional claims in published maps and institutional affiliations. |
© 2021 by the authors. Licensee MDPI, Basel, Switzerland. This article is an open access article distributed under the terms and conditions of the Creative Commons Attribution (CC BY) license (https://creativecommons.org/licenses/by/4.0/).
Share and Cite
Tomar, P.; Singh, S.K.; Kanga, S.; Meraj, G.; Kranjčić, N.; Đurin, B.; Pattanaik, A. GIS-Based Urban Flood Risk Assessment and Management—A Case Study of Delhi National Capital Territory (NCT), India. Sustainability 2021, 13, 12850. https://doi.org/10.3390/su132212850
Tomar P, Singh SK, Kanga S, Meraj G, Kranjčić N, Đurin B, Pattanaik A. GIS-Based Urban Flood Risk Assessment and Management—A Case Study of Delhi National Capital Territory (NCT), India. Sustainability. 2021; 13(22):12850. https://doi.org/10.3390/su132212850
Chicago/Turabian StyleTomar, Pallavi, Suraj Kumar Singh, Shruti Kanga, Gowhar Meraj, Nikola Kranjčić, Bojan Đurin, and Amitanshu Pattanaik. 2021. "GIS-Based Urban Flood Risk Assessment and Management—A Case Study of Delhi National Capital Territory (NCT), India" Sustainability 13, no. 22: 12850. https://doi.org/10.3390/su132212850
APA StyleTomar, P., Singh, S. K., Kanga, S., Meraj, G., Kranjčić, N., Đurin, B., & Pattanaik, A. (2021). GIS-Based Urban Flood Risk Assessment and Management—A Case Study of Delhi National Capital Territory (NCT), India. Sustainability, 13(22), 12850. https://doi.org/10.3390/su132212850