Article

Customer Experience and Satisfaction of Disneyland Hotel through Big Data Analysis of Online Customer Reviews

School of Hospitality & Tourism Management, Kyungsung University, Busan 48434, Korea
*
Author to whom correspondence should be addressed.
Sustainability 2021, 13(22), 12699; https://doi.org/10.3390/su132212699
Submission received: 28 September 2021 / Revised: 3 November 2021 / Accepted: 10 November 2021 / Published: 17 November 2021
(This article belongs to the Special Issue Big Data and Sustainability in the Tourism Industry)

Abstract

:
Online customer reviews have become a significant information source for scholars and practitioners to understand customer experience and its association with their satisfaction to maintain the sustainable development of relative industries. Thus, this study attempted to find the underlying dimensionality in online customer reviews reflecting customers experience in the Hong Kong Disneyland hotel and identified its relationship with customer satisfaction. Semantic network analysis by Netdraw and factor analysis and linear regression analysis by SPSS 26.0 (IBM, New York, NY, USA) were applied for data analysis. As a result, 70 keywords with high frequency were extracted, and their connection to each other was calculated based on their centralities. Consequently, seven factors were explored by exploratory factor analysis, and moreover, three factors, “Family Empathy”, “Value”, and “Food Quality”, were testified to be negatively related to customer satisfaction. The findings of this study, to a great extent, could be utilized as a research scheme for future research to investigate theme hotels with big data analytics of online customer reviews. More importantly, some new insights and practical implications for the future research and industry development were provided and discussed as well.

1. Introduction

The tremendous growth of social media and consumer-generated content on the Internet, such as their online reviews for specific products or services, photos or videos customers posted, etc., has inspired the development of so-called big data and big data analytics to understand and solve real-life problems [1]. There is no doubt that these social media platforms and consumer-generated content on the Internet continue to grow and impact the tourism and hospitality industry. In the last decade, a great number of studies and real applications in the industry have demonstrated the huge potential of big data and relative analytics to promote the industry development and procure business intelligence to maintain the economic sustainability of the industry [2,3,4].
Different types of hotels have different core products and services [5]. In addition, customers rank the importance of each service dimension differently because they have varying perceptions, expectations, and preferences for each type of hotel [6]. Theme hotels, as one of the outcomes of market segmentation in the hotel industry, have undergone rapid growth and have become one of the most attractive lodging segments in the last two decades [7,8]. Alongside this trend, different types of theme hotels have been widely recognized by customers, for instance, Disneyland hotel for family with children entertainment, W and Aloft hotels for lifestyle, Bulgari and Armani hotels for super luxury, green hotels, etc. Theme hotels with different themes or cultural backgrounds have attracted different customers with different purposes [9].
Typically, Disneyland hotels are one of theme hotels which are suitable for customers travelling with children because of the popularity and influence of Disney series cartoon movies [10]. Hong Kong Disneyland hotel, as a typical representative of world-class theme hotels first introduced to the Chinese market, deserves further in-depth study and investigation in terms of customers’ experience, facilities, themes, and environment to promote the sustainable development of the industry [11]. Specifically, in the hospitality industry, customer experience and satisfaction have been widely recognized as topics of interest because they greatly contribute to customer loyalty, repeat purchases, favorable word-of mouth, and, ultimately, higher profitability and improve hotels’ financial performance.
By synthesizing previous studies, a handful of studies have employed new data sources to tackle important research problems in the hotel industry, while another area of interest where research is limited refers to the examination of particular hotel types [12]. More importantly, studies to explore factors reflecting customer experience and testify the association of these factors with customer satisfaction by big data analytics of online customer reviews in the context of theme hotels were still limited. Therefore, in order to fill this research gap, this study adopted online customer reviews of Disneyland hotels with related big data analytics to explore dimensions reflecting customer experience and its association with their satisfaction of theme hotels. Collectively, the goals of this research are to explore and demonstrate the utility of semantic network analysis, which is one of the important sections of big data analytics, to understand texts in the research of theme hotels, and then to identify to what extent it can help us to understand customer experience through their online reviews with semantic network analysis. Furthermore, the quantitative analysis (factor analysis and linear regression analysis) was performed to more precisely explore factors reflecting customer experience and then to understand its relationship with customer satisfaction. At last, the implications summarized from the results of this study both from the perspectives of academia and practice could be the basic information for the future development of the industry and research of theme hotels.
The following sections of this study were organized as follows. Section 2 reviewed relative research regarding theme hotels, development and application of online customer reviews in the hospitality industry, and big data analytics. Then, Section 3 explained major procedures of research methodology. Section 4 narrated major analytical results with elaborate and explanatory tables and figures. Finally, the conclusions and relative discussions of research findings were well provided.

2. Literature Review

2.1. Theme Hotel

There are many competitors in the tourism sector, and hotel managers provide mainly similar products and services, which encourages managers to discriminate their hotels among their competitors [12]. Naturally, continuous market segmentation has become an important trend in the hotel industry worldwide because it allows hotels to differentiate themselves from their competitors and to better serve the diverse needs of guests. Theme hotels are a relatively new hotel type resulting from the continuous development of market segmentation trends in the lodging industry [13]. Theme hotels have also emerged as one of the most attractive new lodging segments in recent years.
Based on previous studies, theme hotels are one form of hotel that take the specific culture as the theme, reflect this culture in the hotel hardware, facilities, and software such as environment, atmosphere, and employee service; provide customers with specialized and personalized service based on the customer experience; and satisfy the customers’ deeper needs for pursuit of individuality, happiness, and enjoyment by creating value through service [14]. Theme hotels, not only themselves but also as one important section of the theme parks industry, have undergone rapid growth and were challenged with fierce competition as other themes hotels greatly increase [15]. Hong Kong Disneyland hotel is the second Disney hotel in the Hong Kong Disneyland Resort in Penny’s Bay, Lantau Island, Hong Kong, and as a famous theme hotel, the theme of this hotel is of a Victorian style and is located near Disneyland Harbour.
So far, studies related to theme hotels, mainly concentrated on hotel design, summarization of hotel development, product innovation, etc., for example, Bodet, Anaba, and Bouchet collected data from customers of Disneyland hotels to understand hotel attributes and consumer satisfaction from the perspective of cross-country and cross-hotel [16], Kasiri, Torabi Farsani, and Moazzen Jamshidi investigated domestic tourists’ preferences of theme hotels, etc. Nevertheless, a limited number of studies in relation to theme hotels were conducted with online customer reviews to explore the dimensions of customer experience and its association with their satisfaction [17].

2.2. Online Customer Reviews

Big data analytics have been used to describe data sets and analytical techniques in applications that are so large (from terabytes to exabytes) and complex (from sensor to social media data) that they require diverse techniques such as web crawling, computational linguistics, machine learning, and statistical techniques to collect, analyze, and interpret different findings for business problems [18,19]. Nowadays, the rise of digital and mobile communication has made the world become more connected, networked, and traceable and has typically led to the availability of such large scale datasets, and these data and their relative techniques were utilized in various industries, for example, Gao, Tang, Wang, and Yin adopted comparative relation mining from large-scale online reviews to provide suggestions for the restaurant industry [20], Kim and Noh utilized a great number of online customer-generated content to assist the mechanical design of washing machines [21], etc.
In the context of tourism and hospitality, online customer reviews, as a part of digital data with large scales, are increasingly available online for a wide range of products and services. The literature has suggested that hotel guest reviews are characterized by a growing importance and impact on the consumer decision-making process and hotel selection [22]. Additionally, it was suggested that when choosing a destination, reviews and ratings from others on the destination website and/or on social media websites are important to tourists before making the travel plan [22]. At the same time, business intelligence and brand-new insights for industries have been generated based on diverse data extracted from the Internet. For example, Xiang et al. adopted online hotel guest reviews to explore facets reflecting customers experience and its association with their satisfaction [1], Gao et al. performed a competitive analysis between different restaurants based on online customer reviews with aspect-oriented comparative analysis [20], and so on. An increasing number of studies has demonstrated the great significance of analyzing online customer reviews for the industry’s development and brought new insight and direction for research [23,24]. It has also been demonstrated that the textual data provided by customers fits well for the purpose of identifying hidden topics and information crucial for a variety of business intelligence [25].
Specifically, for the hotel industry, the research mainly focused on the customers experience, satisfaction attributes, and their dissatisfaction with general hotels [21,26,27]. However, studies for specific types of hotel, such as theme hotels such as Disneyland hotel, were conducted with online customer reviews and relative analytical methods. Therefore, for the promotion of the research of theme hotels, it is imperative to induce new data sources to help us generate brand-new insights for the research and the industry.

2.3. Big Data Analytics

Generally, big data analytics is a wide concept that has been defined as techniques that are deployed to uncover hidden patterns and bring insights into interesting relations in understanding contexts by examining, processing, discovering, and exhibiting the outputs with the advantages of cost reduction and effective timeliness. Based on previous studies [28,29,30,31,32] and the research purposes, the big data analytics performed in this research consists of text mining, semantic network analysis, and quantitative analysis (factor analysis and linear regression analysis).
Firstly, text mining was applied to process the data pre-processing, and it is a technique for extracting relation data from unstructured data of large-scale text (which, in this study, is online textual reviews).
Secondly, suggested by the study by Köseoglu, the integration of text mining techniques as big data method with network analysis to form a competitor analysis is rational [25]. Thus, in order to understand the hidden connection among these top frequencies, semantic network analysis was conducted. Generally, network analytics is a nascent research area that has evolved from the earlier citation-based bibliometric analytics to include new computational models for online community and social network analysis [18]. In this decade, semantic network analysis, as a part of network analysis, has drawn great attention from the tourism and hospitality industry since it is an effective method to analyze the connection of texts [33,34,35]. Generally, semantic network analysis analyzes the semantic pattern of a message through the relationship between the frequency of words and words used simultaneously in one sentence without assuming a specific nominal [36] and is based on the frequency of usage of the main words on the web, the link status between the main words, and the structure of the network [37].
According to previous studies by [24,35,37], two basic centralities have been discussed in the network analysis literature to recognize the power of nodes in a network: one is Freeman’s degree centrality, and the other is the Eigenvector centrality. Freeman’s centrality refers to the number of direct ties a word has. The higher the degree of centrality a word has, the more connection it is has with other nodes in the network [38]. As for Eigenvector centrality, it capitalizes on how differences in degree can propagate through a network, and it extends the concept of connective centrality by considering not only the number of words connected but also how important a connected relationship is [39].
The clustering of identified centralized words was conducted by CONCOR analysis and different attributes reflecting customers experience were extracted [24,40,41]. CONCOR analysis is an effective method of clustering with analyzing text in the structure of meaning through a “keyword × keyword” co-occurrence matrix to discover hidden subgroups and relations among each group. Subjects are grouped through CONCOR between the matrix and inverse matrix of subjects [42,43].
Based on vital words extracted by semantic network analysis, quantitative analysis with exploratory factor analysis and linear regression analysis was performed to quantitatively explore the variables reflecting customer experience and its relationship with customer satisfaction. In this process, a dummy variable was adopted to transfer the qualitative data to a quantitative format [1].

3. Methodology

The methodology used in this study is online customer reviews with big data analytics. The typical process of big data analytics in hospitality and tourism industry is first, data collection, which contains the selection of appropriate platform to collect relative data and specific material (e.g., textual reviews, membership information, review time, etc.). The second is data analysis of collected data and specific methods of data analysis that vary from different research objectives [1,19,44]. Without any exception, the methodology of this study concluded two major parts, data collection and data analysis.

3.1. Data Collection

Google travel was used to collect relative online customer reviews, which is a trip planner service developed by Google for the web [45]. The data collection process was conducted by SCTM3, which is a developed by Wellness and Tourism Big Data Institute, Kyungsung University. SCTM3 is a web crawling program capable of simultaneously collecting and processing data on the web by using CentOS Linux 7. The data collection period set in this research was four years, which is from 1 January 2017 to 4 May 2021, and “Disneyland Hotel” + “Hong Kong” were used as keywords for data collection since Hong Kong Disneyland hotel is a typical theme hotel owned by the Disney Company. Additionally, authors of this study have higher expertise and familiarity with Hong Kong Disneyland hotel, which contributes to the effective and accurate interpretation of the obtained results [32]. As a result, a total of 1493 reviews were collected with textual reviews, numerical ratings (from 1 to 5), reviewers’ information, and review date.

3.2. Data Analysis

Data analysis performed in this study mainly consists of three procedures. The first step is data pre-processing with text mining techniques, and in this step, collected data with sentences were divided into singe words with their relative frequency. The second procedure is semantic network analysis of the top frequency words selected by the author based on the selection criteria that words related to the research subject could be chosen. In the meantime, this procedure, which dealt with text, could be recognized as qualitative analysis. In terms of semantic network analysis in this study, centrality (Freeman’s degree and Eigenvector) analysis and CONCOR analysis were conducted to, firstly, help us identify the significance of these top frequencies with their centrality value and, secondly, to obtain the dimensions reflecting customers’ perception and cognition of Disneyland hotel in Hong Kong by illustrating the intertwined relevance among the top frequency words. Generally, semantic network analysis was conducted based on the co-occurrence matrix (keyword × keyword) of top frequency words [33,46]. In addition, Ucinet 6.0 packaged with Netdraw was adopted for data analysis and visualization for results of data analysis.
At last, quantitative analysis with factor analysis and linear regression analysis was conducted to explore factors reflecting customer experience and testified its relationship with customer satisfaction. Customer satisfaction used in this study was based on overall customer satisfaction ratings provided by reviewers themselves with 1 representing the most dissatisfied to 5 representing the most satisfied [1,33,46].

4. Results

4.1. Data Pre-Processing

As a result of text mining, 1493 reviews of Disneyland Hotel in Hong Kong with 14,556 word times were collected and calculated. Accordingly, the frequency of numerical ratings from 1 to 5 were synthesized into Table 1, and this could be adopted as baseline data for evaluating the customer satisfaction level. The average satisfaction rating was 4.43 out of 5, and 88.41% of reviewers showed a high level of satisfaction with their experience in Disneyland hotel, posting a rating of 4 or 5. Meanwhile, 7.50% of customers tended to be dissatisfied with their staying experience, giving a rating of 3. Typically, 4.09% of customers are obviously unsatisfied with their experience since they gave a rating of 1 or 2.
The words that appeared in the valid comments that had been collected were ranked according to their frequency. Then, the top 70 words with high frequency to reflect customers experience were extracted and sorted, which is demonstrated in Table 2. The selection of top frequency words followed the criteria that these words were closely related to the research subject [24,31]. The proportion of each word in the overall word frequency was calculated, and the higher the frequency of the words appearing in the comments, the higher they ranked.
It could be seen from Table 2 that words such as “Good”, “Disney”, “Room”, “Place, “Service”, etc., had high visibility; for example, “Good” was used 317 times, “Disney” was used 314 times, “Room” was used 190 times, and so on. The network of the top frequency words can be seen in Figure 1, and it can be seen that their connection is complicated and intertwined. These 70 words reflect a wide spectrum of aspects related to hotel customer experience, which includes 7 aspects. The first aspect is the very core products provided by hotels, which consists of “Room”, “Lobby”, etc. The second aspect is hotel amenities, and terms such as “Restaurant”, “Buffet”, “Pool”, and “Garden” were extracted from online customer reviews. The third is staff-related descriptors such as “Service”, “Staff”, “Check”, “Friendly”, etc. The fourth aspect is hotel service encounters such as “Shuttle”, “Bus”, “Location”, etc. The fifth is items related to the travel context with “Kids”, “Family”, and so on. The sixth is words related to customers’ emotion or their evaluation of the hotel such as “Good”, “Nice”, “Convenient”, and “Comfortable”. The seventh can be summarized as a dining-related dimension with words such as “Food”, “Breakfast”, “Delicious”, “Dinner”, etc.
Although, based on the study by Jia (2018), it was suggested that the identification of topics from texts could be conducted manually, the overlapping words in different topics were difficult to interpret [47]. Thus, this list of words segmentation, to a great extent, does not reflect certain dimensions of customers’ experiences, and data-driven methodology was required to explore the internal and hidden meaning and connection among these words. Consequently, the semantic network analysis of these top frequency words was performed to more accurately explore the inside meaning hidden in the textual reviews [24,35].

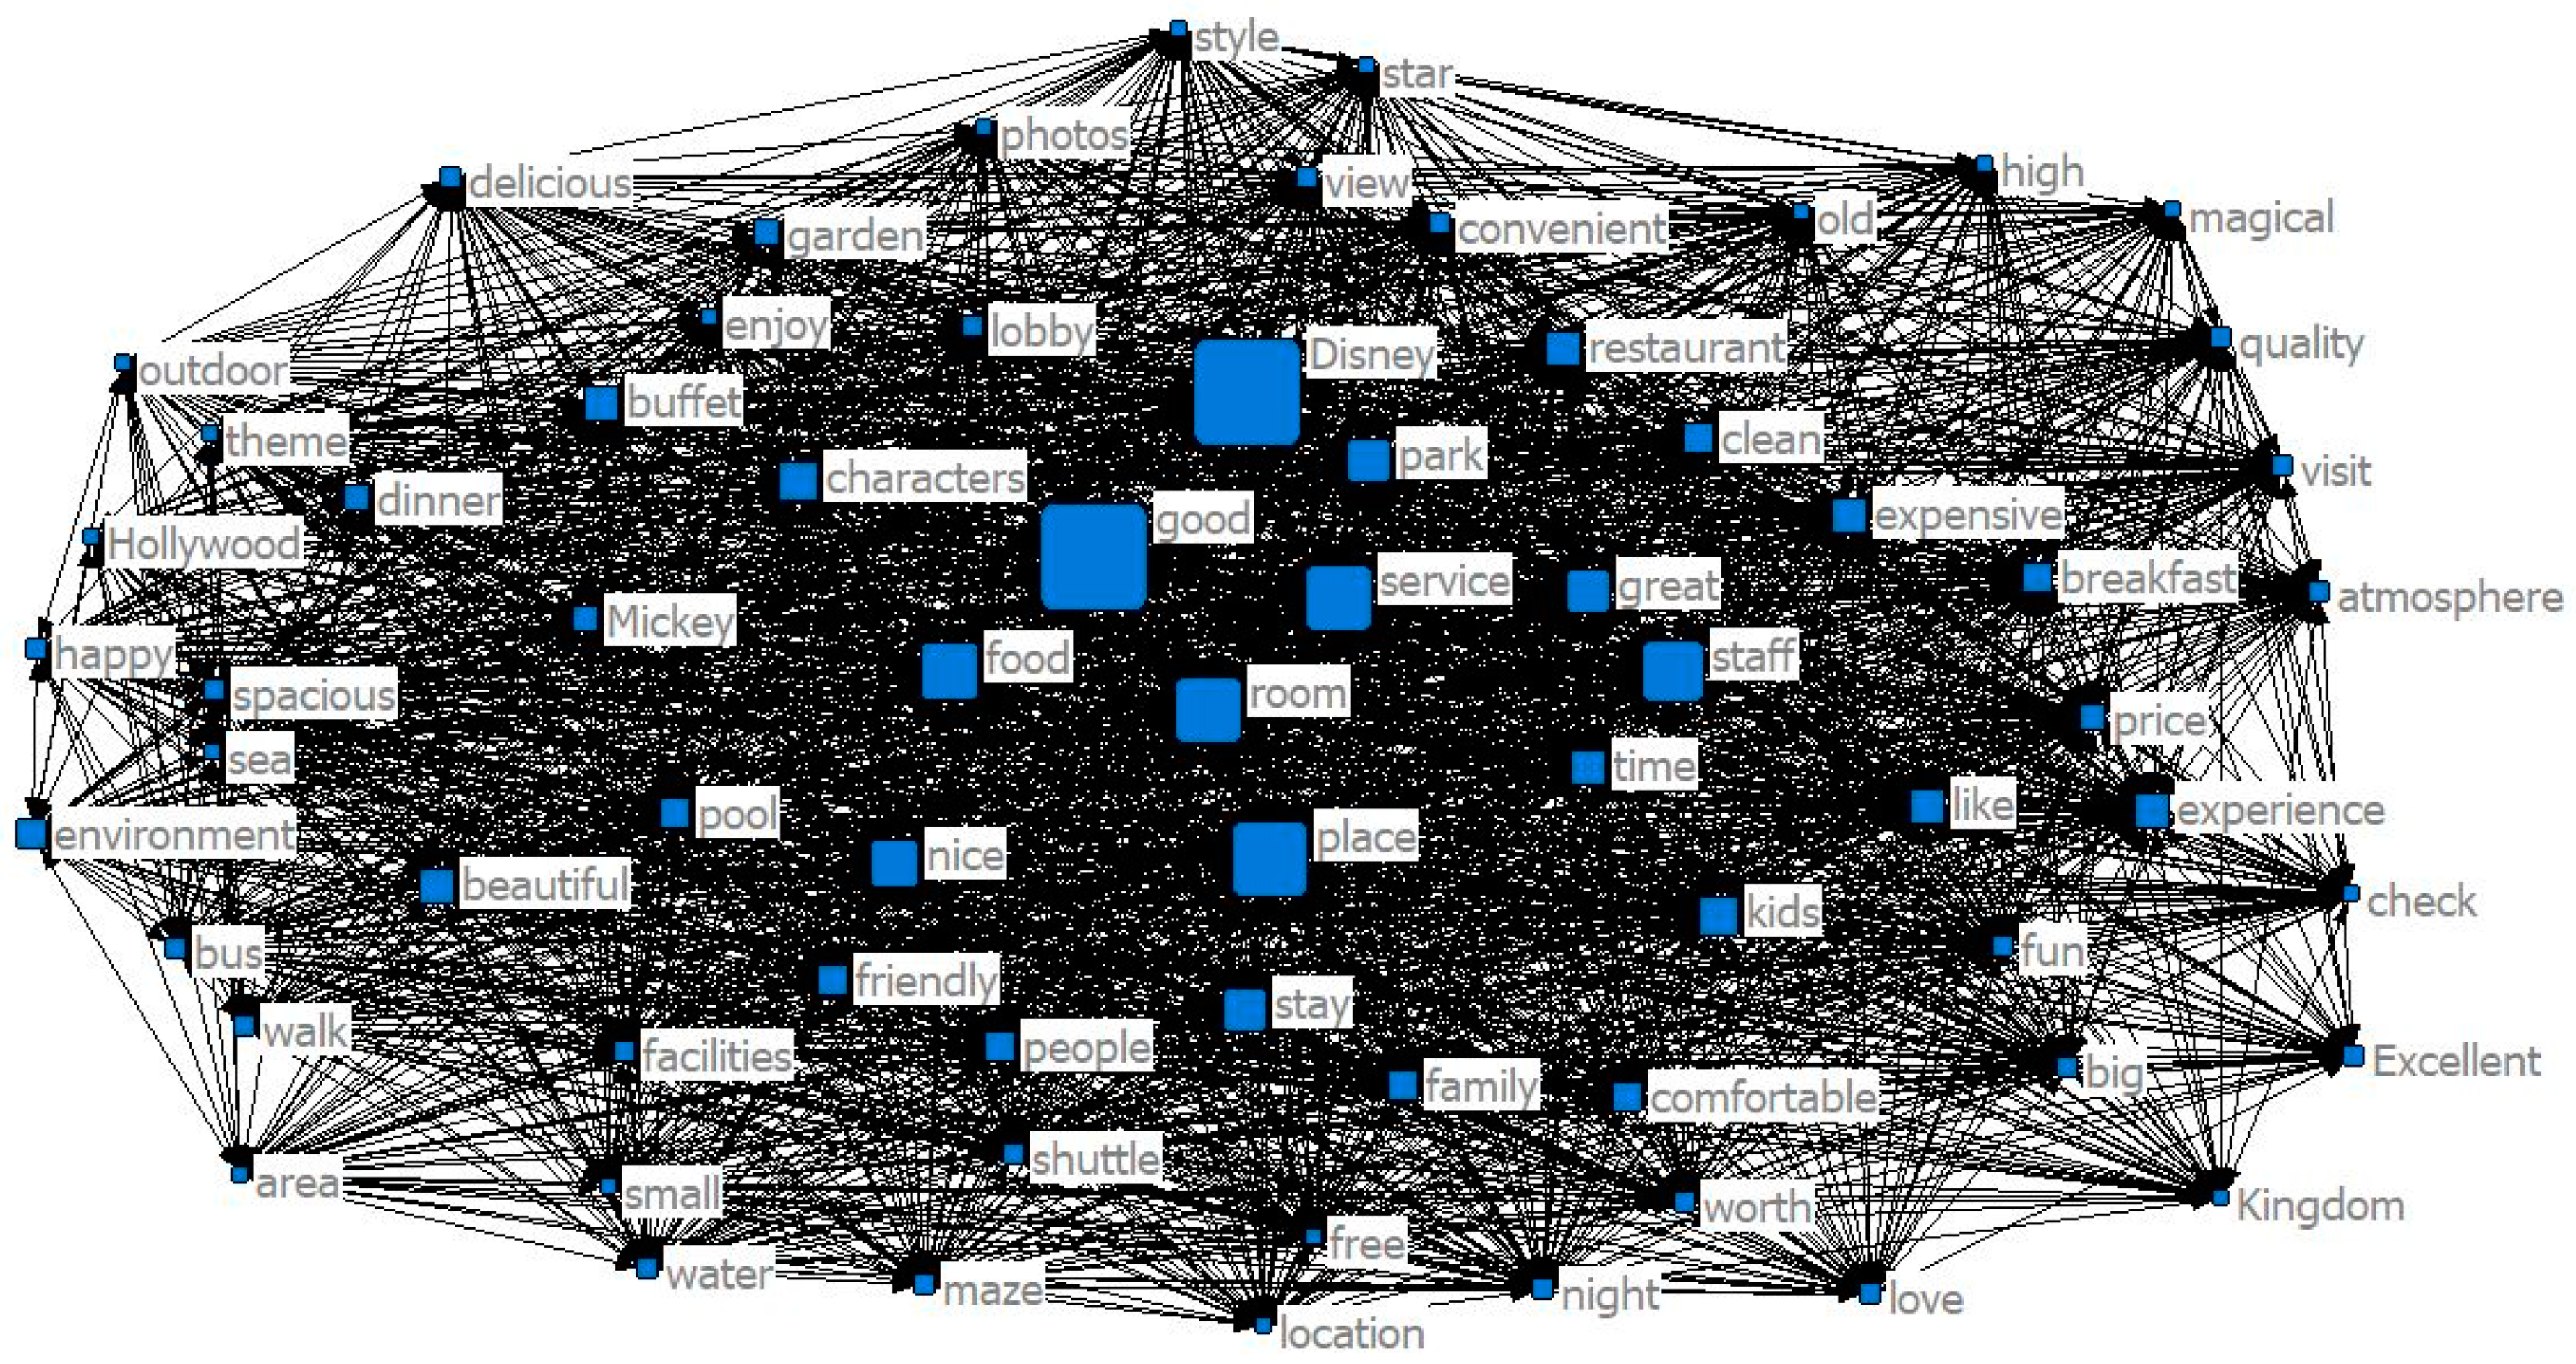
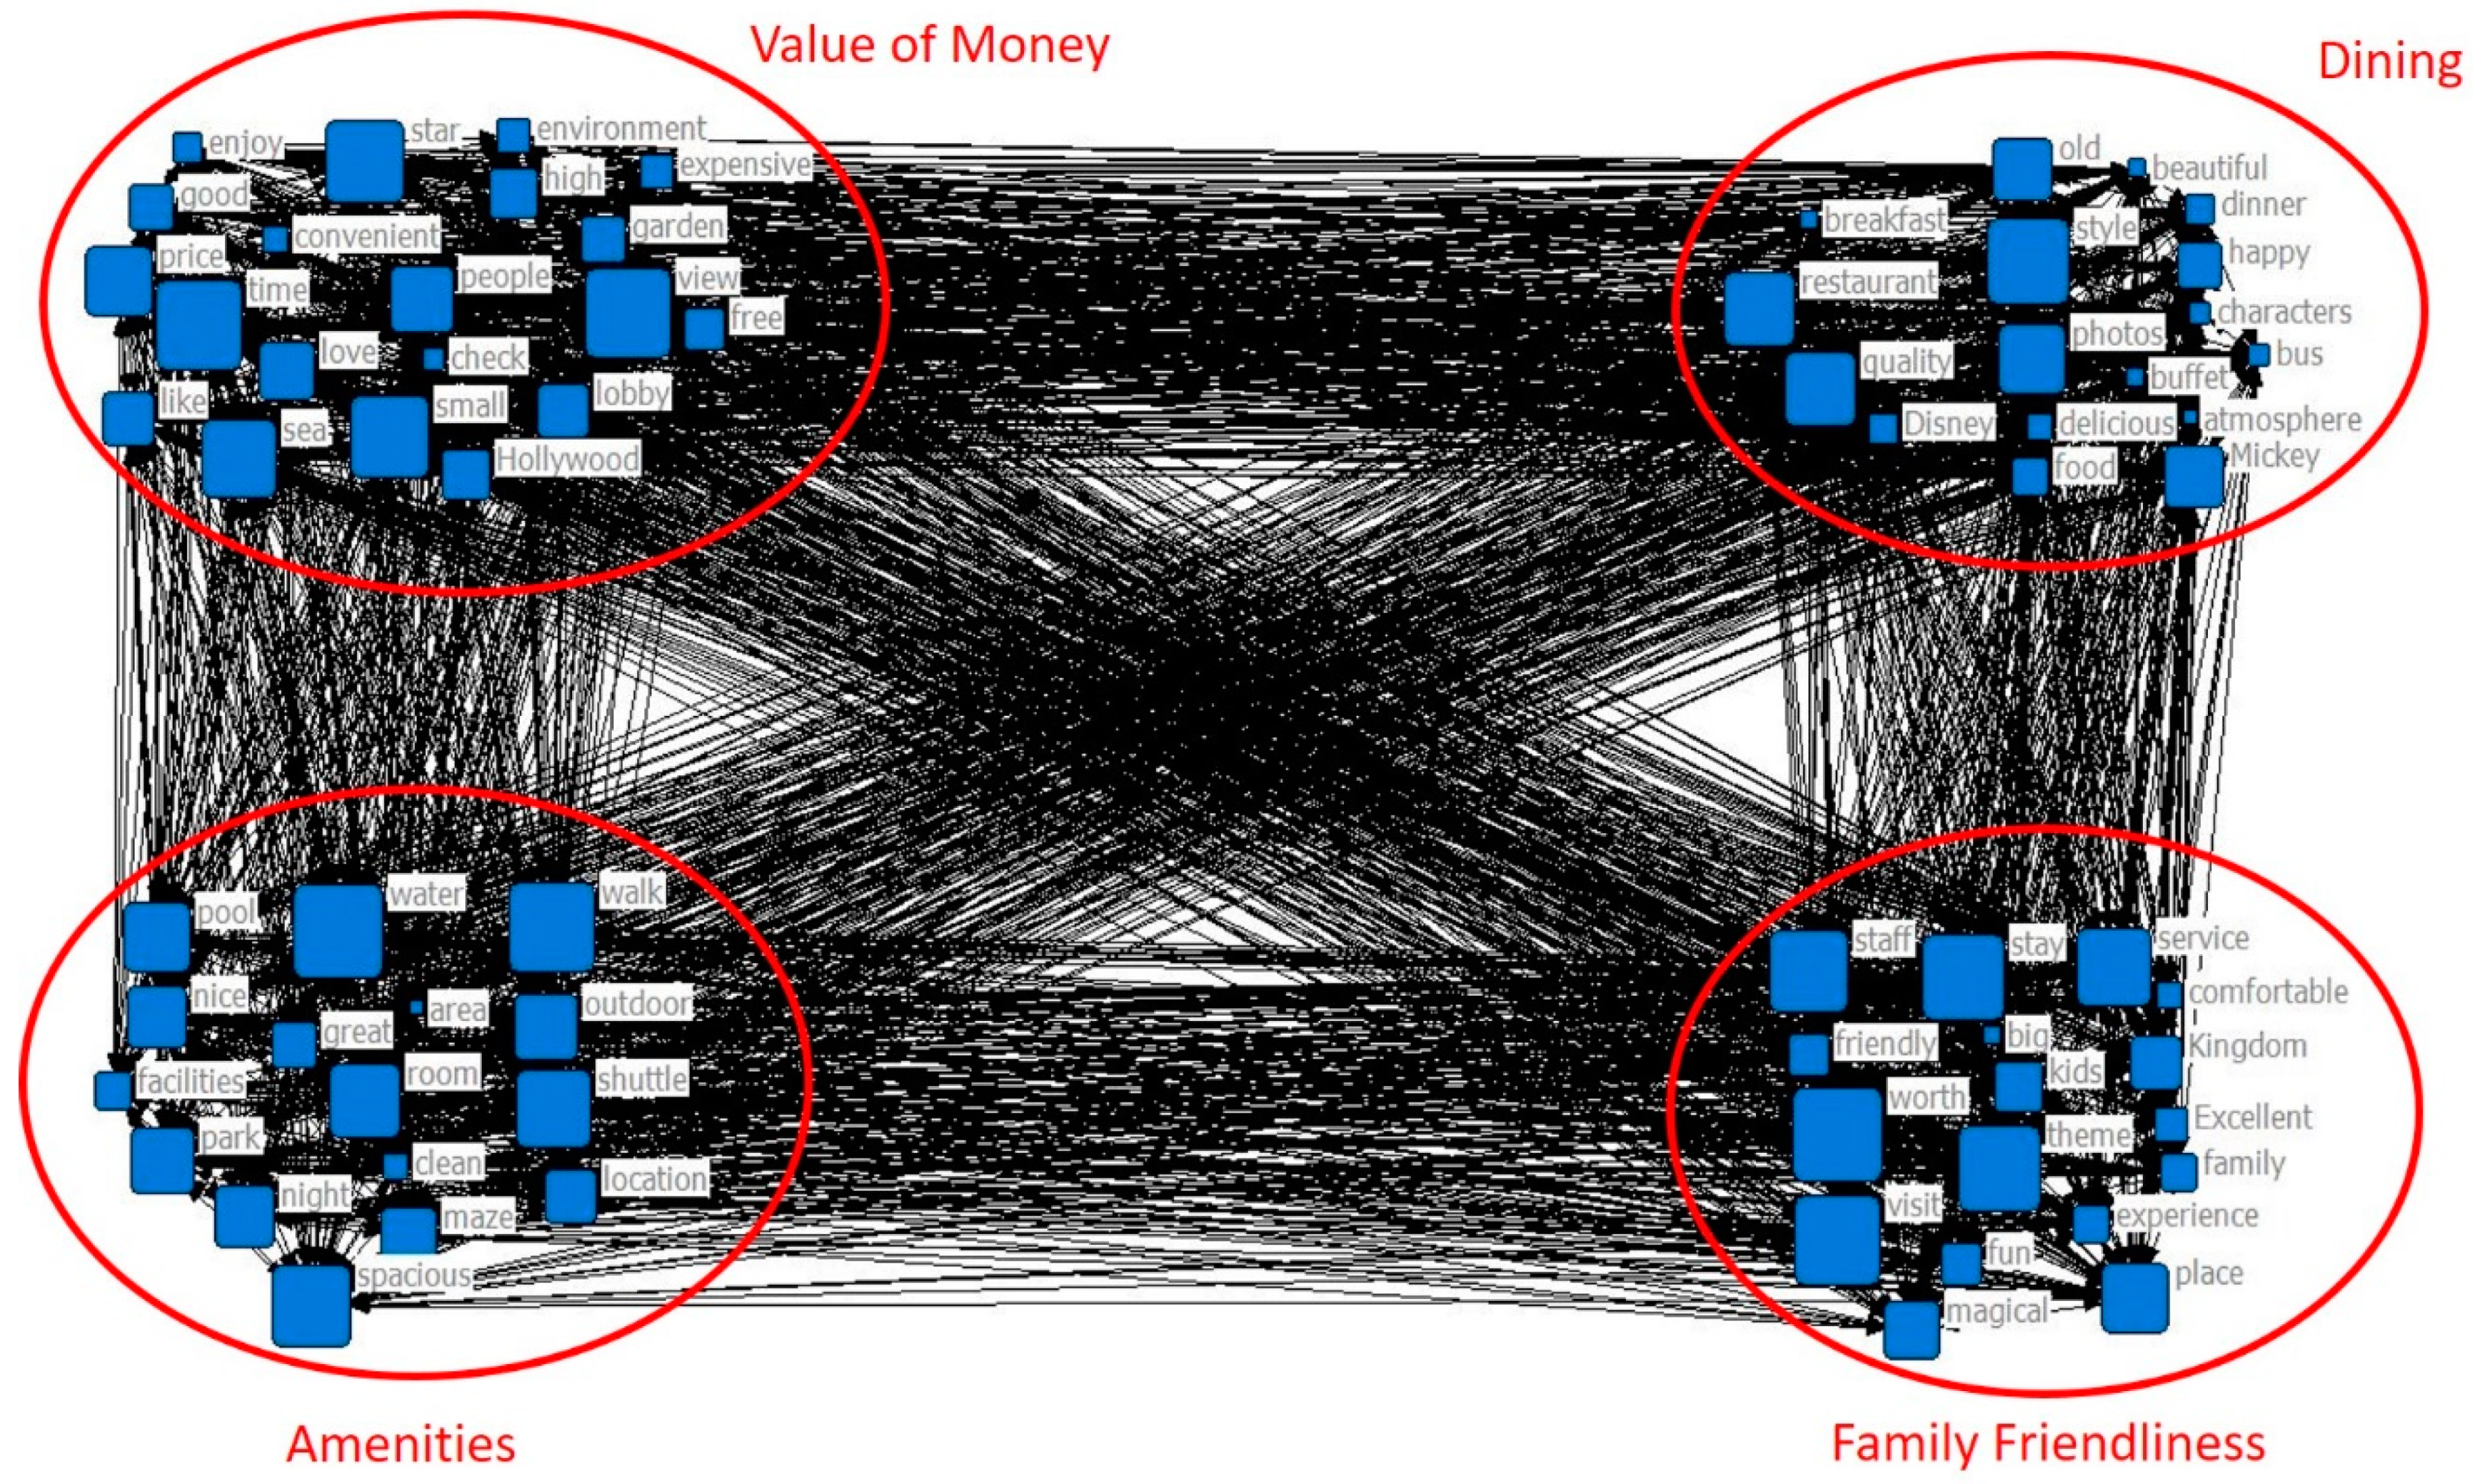
4.2. Semantic Network Analysis

Semantic network analysis refers to the method of obtaining meaning from texts by linking concepts that occur in close proximity to one another [48,49]. It can be useful to recognize humans’ communication channels by identifying the internal structure of data because this method is one of the few options that can extract meanings from text [50,51]. In this research, Freeman’s degree centrality and Eigenvector centrality were performed to measure how close a word is to the center in a network to conduct the analysis of semantic network of these top frequency words [34].
Typically, Freeman’s degree centrality is a measure of how connected a node is to other nodes in the network [37], and Eigenvector centrality is a useful index to find the most influential node in the network [51]. At last, the clustering analysis with CONCOR analysis was adopted. CONCOR (CONergence of iterated CORrelation) analysis is a method of repeatedly performing correlation analysis to find an appropriate level of similarity groups, and it is capable of identifying the blocks of nodes according to the correlation coefficient of the metrics of the concurrent keywords. It forms clusters that include keywords with similarities [43].
As a results, the centralities (Freeman’s degree and Eigenvector centrality) of 40 top frequency words were calculated and compared with the words’ frequencies, which is synthesized into Table 3. Generally, the distribution patterns of the Freeman’ degree centrality and the Eigenvector centrality was very similar to each other since they have almost the same ranking regarding their centrality value. However, compared to their accordingly frequency, some differences were revealed. For example, a word such as “Place” had a high frequency, ranking at 3, while its centralities were ranked at 17 and 20, respectively. This implicitly suggested that although this word was shown in the customer reviews a lot, its connection to other nodes is not that strong. That is, “Place” does not have great influence in expressing reviewers’ experience. By looking through the original reviews, it is not hard to interpret “Place” exposed by customers in the reviews a lot, while the connection and influence with other words in the network is not that strong: for instance, in reviews such as “Nice place but a bit remote” or “A fabulous place for vacation”, the use of place here is only the byword for Disneyland hotel without real and deep meaning.
Additionally, several words such as “Environment”, “Facilities”, “Quality”, “Fun”, etc., shared the same pattern as “Place” with high frequency and relatively low centralities. This demonstrated that these words were common words used in customer reviews while, to a great extent, they are meaningless to explain the whole semantic network since their connection and influence to other words or nodes are not strong [34,46].
On the contrary, nodes such as “Park”, “Buffet”, “Pool”, “Garden”, “Dinner”, etc., were with relatively higher rank of centrality compared to their ranks of frequency. For instance, the frequency of “Pool” ranked at 22, while its Freeman’s degree and Eigenvector centrality ranked at 13 and 14, respectively. This finding indicated that even though some words had low frequency, which means they were used by reviewers when they write their comments, their relationship and impact to other nodes in the network have great significance. Collectively, centralities analysis is instrumental to identify significant words in a semantic network so as to assist to procure a more precise understanding of the hidden meaning and connection of these nodes in the network.
Semantic network analysis with CONCOR showed distinguishable clusters on reviewers’ experiences in Hong Kong Disneyland hotel. Clusters generated as a result of semantic networking using the CONCOR clustering method were named based on notable words and their relative meaning in the original reviews. The visualization of CONCOR analysis was indicated in Figure 2. In order to make it easier to identify which words belonged to each group, the words grouped in the cluster and the ones to be noted were listed and synthesized into Table 4.
As a result, there are four clusters generated from online customer reviews. The first cluster is “Family Friendliness” with words such as “Staff”, “Service”, “Nice”, Kids”, “Comfortable”, “Friendly”, etc., and these words are also of relatively high frequency (e.g., “Staff” was used 176 times ranked at 6, “Family” was used 71 times and ranked at 24). The expression of these words in reviews were shown in the following way: “Nice hotel and family friendly, Staff at lobby was very friendly they gave my kids many beautiful stickers…”, “happy stay with family…”, etc. These expressions are closely associated with service/staff friendliness to family.
The second cluster presents “Amenities” with words such as “Pool”, “Room”, “Shuttle”, “Facilities”, and so on. These words are the representatives of amenities provided by hotels. They are expressed in the reviews such as, “One of the best pools a Hotel can offer”, ”There’s a shuttle to and from Disney Land for free”, “The back garden maze is also fun for kids…”, etc.
The third cluster is “Value of Money” covering words such as “High”, “Price”, and “Expense”, which are related to the price issue of hotel performance, for example, “The facilities or programs were shut down for two consecutive days and the price of consumer goods was too high”, “Definitely worth the price especially if you take advantage of promos for booking”, and so on.
The last cluster is named as “Dining” apparently, since this cluster consists of many notable words closely related to customers dining experience, such as “Delicious”, “Restaurant”, “Buffet”, “Breakfast”, etc. They were expressed in customer reviews as follows: “Food was very delicious, “The weekend buffets are quite good and an excellent opportunity for…”, etc.

4.3. Quantitative Analysis

Exploratory factor analysis could be used for discovering the commonalities among these keywords and to show the connection of variables through the variance of keywords within the same online hotel reviews [52,53]. In this research, the purpose of factor analysis is to reduce a large number of variables into a smaller number of variables using variance rotation process. A total of 59 significant words that are intimately associated with nodes in the semantic network were extracted from the top 70 frequency words, and later, they were adopted as independent variables. Common factorial criteria were used in extracting the factors, and only variables with factor loadings greater than 0.400 were performed in the final model [54]. Additionally, variables which were loaded at two factors simultaneously would be deleted. Consequently, 20 vital words within 7 factors contributing to 54.290% of all variance to derive the main factors affecting customer satisfaction were used as independent variables.
The results of the factor analysis are illustrated in Table 5, and it can be seen that the KMO is 0.665, close to 0.700, signifying that it is fundamentality based on the recommend value [40]. Furthermore, the Bartlett chi-square is 3216.835 and p < 0.001, which verifies that the use of factor analysis was appropriate for this study. These seven factors were labelled as “Dining”, “Transportation”, “Outdoor Pool”, “Employee Attitude”, “Family Empathy”, “Value”, and “Food Quality”, and the labelling of each factor was based on the variables including in each individual factor [1,30]. The labelling process was firstly conducted by two authors and then these labels were cross-checked by another two graduate students who are familiar with the research subject.
After conducting factor analysis, the linear regression analysis to explore the relationships between factors reflecting customer experience (independent variables) and customer satisfaction (dependent variable) was performed, and it is demonstrated in Table 6. Among these seven factors, “Dining” (β = −0.017, p > 0.05), “Transportation” (β = −0.016, p > 0.05), “Outdoor Pool”, and “Employee Attitude” (β = 0.033, p > 0.05) were identified to be, statistically, not associated with customer satisfaction with p > 0.05. Meanwhile, “Family Empathy” (β = −0.060, p < 0.05), “Value” (β = −0.076, p < 0.01), and “Food Quality” (β = −0.119, p < 0.001) were verified to be significantly but negatively related to customer satisfaction. Among these three significant factors impacting customer satisfaction, factor “Food Quality” was identified to be with the highest beta value, which implicitly illustrated that “Food Quality” was, to a great extent, dissatisfying for customers. Original reviews such as “The food quality need to be improved!”, “I can say that the services and experience was below standard. In addition, the quality of food was not the best” were typical demonstration of customers’ opinion to their staying experience in Disneyland hotel. As for the negative relation with customer satisfaction of the factor “Family Empathy”, with words “Location”, “Family”, and “Room”, it was illustrated in the original reviews that this dimension was frequently mentioned with factor “Value”, for instance, “Tickets are more expensive. If a family goes to the park, it will cost more.”, “Pretty nice place for family, but it is too expensive”, etc. This is very consistent with the brand image created by Disneyland hotel that it is a great place for family with children, but the price here is expensive.

5. Conclusions

This research attempted to explore dimensions reflecting customer experience and verified the association with customer experience and satisfaction so as to provide qualitative and quantitative data information for the research and industry development of theme hotels. The research related to theme hotels could be concerned as a significant policy which affects a hotel’s operations, production and facilities and helps the formulation of customer segmentation [6,54,55]. Thus, Hong Kong Disneyland hotel, as a typical example of a theme hotel, was selected as the research data source, and online customer reviews of this hotel were collected. Furthermore, big data analytics with text mining, semantic network analysis, and quantitative analysis was performed to explore hidden meanings and associations among the collected reviews.
As a result, firstly, the general understanding generated from customers’ reviews to Disneyland hotel could be synthesized by identifying the top frequency words with their relative frequency. There is no surprise that words such as “Room”, “Service”, “Staff”, “Facility”, etc., had high frequencies since they are closely related to hotel industry. At the same time, words such as “Character”, “Kids”, “Family”, “Mickey”, and “Magical”, which are very typical images of Disneyland hotels, were extracted, and this implies that customers do have the clear cognition of theme hotels they stay at since they mentioned these specific images of this theme hotel in their online reviews.
Secondly, the semantic network of these top frequency words was analyzed based on their co-occurrence matrix. Freeman’s degree and the Eigenvector centrality of these words were calculated to explore the hidden connection among these words. Several words such as “Place”, “Beautiful”, etc., had a high frequency while their relationships with other nodes in the network are not intimate, which suggests that even though these words were exposed on the platform a lot, their impact and significance are unequal to their frequency. By contrast, some words are the opposite, with low frequency and relative high centrality, such as “Park”, “Time”, “Pool”, “Breakfast”, etc., which demonstrates that these words were important in the semantic network. By analyzing these words, it could be understood apparently that the dimensions represented by these words were important to reflect customer experience. In addition, words such as “Disney”, “Room”, “Staff”, and “Food” possess the similar ranks both in frequency and centrality.
Thirdly, high-frequency words were segmented by CONCOR analysis, and there are four clusters extracted, which are “Family Friendliness”, “Amenities”, “Value of Money”, and “Dining”. Each group contains several specific keywords, and the labeling of each group was performed based on the notable words in that group. This result could help us to deepen the understanding and knowledge of the Internet users. At the same time, four groups also provide directions for the future development and renovation of Hong Kong Disneyland hotel. More importantly, this finding could serve as a reference for other theme hotels, facilitating the whole industry to improve standards and establish a new brand image.
At last, with the dummy variables, the qualitative data of words extracted from textual reviews were transformed into a quantitative format. Then, exploratory factor analysis was applied to discover factors reflecting customer experience. A total of seven factors, “Dining”, “Transportation”, “Outdoor Pool”, “Employee Attitude”, “Family Empathy”, “Value”, and “Food Quality”, were discovered. Furthermore, in order to understand the relationship between customer experience and their satisfaction, linear regression analysis with factors as independent variables and the overall customer satisfaction rating as the dependent variable was conducted, and three factors, “Family Empathy”, “Value”, and “Food Quality”, were significantly but negatively related to customer satisfaction. The identification of cluster “Value” with the terms “Worth” and “Price” and its negative contribution to customer satisfaction are in line with the findings by Berezina, Bilgihan, Cobanoglu, and Okumus that, based on the findings of online customer reviews, the value for money may represent the finance category identified in the negative reviews [56]. As for the negative impact of the “Food Quality” factor on customer satisfaction, it was apparently demonstrated in customer reviews that the food and pricing of food in hotel is dissatisfying to customers.

6. Discussion

Based on the results of this study, there are several implications both theoretically and practically. In addition, sustainable strategic development and industry management could be suggested. For the theoretical implications of this study, first and foremost, previous studies of theme hotels have been conducted with questionnaire research [53,54] or qualitative analysis with content analysis, focus groups, etc. To a great extent, research subjects were limited to a specific scope and relative questions. However, this study was performed with online customer reviews, which are open sources to hear from customers without time and space limitations. Therefore, this study could be recognized as one research scheme for future research on theme hotels with review data to understand their customers. The utilization of online customer reviews in the hotel sector and its great financial value to save time or energy to collect customer comments could be considered as one of the new engines for stimulating the sustainable and lasting development of the industry. For example, the dimensions explored by the CONCOR analysis and factor analysis could be references for determining key attributes reflecting customers’ experience of theme hotels. In addition, the analytical results of online customer reviews could be the basic data foundation for developing relative marketing strategies, and this has been the latest trend to procure brand-new insights for the hospitality and tourism industry. There are similar studies conducted by Ahani, Nilashi, Ibrahim, Sanzogni, and Weaven, and they performed machine learning of SOM, HOSVD, and CART to explore the hotel segmentation of spa hotels [23]. Additionally, there are studies using big data analytics method by Kim and Noh, and they extract design factors for washing machines [21]. In addition, Ban and Kim explored TripAdvisor reviews of restaurant [57].
Secondly, meaningful results extracted from online customer reviews with semantic network analysis have demonstrated the instrumental usage of semantic network analysis for coping with texts. Consequently, for future research dealing with human languages or texts, it will be imperative to perform semantic network analysis of relative keywords to explore the hidden meaning and connection among words or nodes in the semantic network. Thirdly, the meaningful findings extracted from online customer reviews by qualitative and quantitative analysis together could be an instrumental premise for future research related to online texts. Even for the well-studied fields, with new data sources and methodologies, new cognitions and insights could still be generated. Therefore, for the sustainable development and continuous improvement of their service quality, it is essential for hoteliers to track the trend and development for collecting voices from their customers [58,59,60,61,62].
In terms of managerial implications, firstly, compared to other studies in the hotel industry, the soft service in theme hotels tends to be of great importance since there is a great number of words related to this aspect in customer reviews, such as “Service”, “Staff”, “Comfortable”, “Character”, and “View”. This revealed that for theme hotels, it is pivotal for managers or employees to put more effort to provide these soft services to their customers, and to a great extent, their target customers are family with kids for which “Family Friendliness” was recognized as an independent variable reflecting customer experience. This is very consistent with the study by Xiang et al. (2015) that found that even for the general hotels, “Family Friendliness” was indicated to be statistically related to customers experience [1]. Furthermore, the factor “Family Empathy” explored by factor analysis was testified to be negatively associated with customer satisfaction, and this greatly emphasized the importance of family-related service; so far, it is not satisfied by customers. Naturally, improving the services and facilities related to family or kids is essential for theme hotels to maintain and then to improve their customer satisfaction level so as to achieve the sustainable development of this type of hotel.
In addition, dimensions generated in this study with “Food Quality” (Dining), “Value”, and “Value of Money” are supposed to attract the attention from managers, since these dimensions are the focusing points of customers, thus it is beneficial for practitioners of Disneyland hotel to pay more attention to these facets to satisfy their customers’ demands. For instance, “High”, “Price”, and “Expense” were clustered into one cluster, and this may suggest that the rational price or relative low expense in hotels could be made to satisfy their customers more. Thirdly, the great potential and information of online customer reviews are supposed to draw practitioners’ attention since these data are instrumental data sources for them to understand their customers in real-time and more precisely. Currently, this trend has drawn much attention, and its great value and potential to assist the industrial development have been well-proved. Given the brand-new findings of this research and the trend, performing studies with social media data and related analytics has been meaningful and essential [61].
At last, though this study has been completed, several limitations should be announced and dealt with caution. In addition, relative suggestions for future research are discussed as well. Firstly, compared with other research with online customer reviews, the dataset used in this study was relatively small, and the research has employed a sampling frame that is inclusive of online reviews for only one theme hotel, which is Hong Kong Disneyland Hotel. It was stated that small samples are prone to selection biases and estimation biases, leading to incorrect analysis results that might be opposite to the real situations and the generalized findings. Moreover, some of the categories that were identified are typical for this hotel and may not be generalized to the entire market in the theme hotels industry. Consequently, for the future research, a larger-scale sample size is desirable [3], and the sampling of data is supposed to be wider. Secondly, the complexity and unstructured format of human language required more precise and scientific methods to process these data, the semantic network analysis used in this study, as one of the effective methods to deal with texts [34], though, could help us understand customers, and some hidden information in the text also needs to be explored with more advanced technologies. Thus, for the future research, if it is possible, more data-driven techniques should be adopted to analyze these reviews. Finally, there may be a lack of objectivity since the data coding and interpretation in some data processing procedures depends on the researcher’s expertise, ability, and unbiasedness [60]. Moreover, the influence of reviewers’ personality traits [63], demographic characteristics, etc., on their expression were supposed to attract attention as well. Therefore, it is necessary to input more scientific techniques to procure the results and more variables were covered in the analytical process.

Author Contributions

H.-S.K. and X.Z. constructed the research and X.Z. analyzed online review data with the instruction of H.-S.K., X.Z. wrote the draft and English-editing was conducted by H.-S.K. All authors have read and agreed to the published version of the manuscript.

Funding

This work was supported by the Ministry of Education of the Republic of Korea and the National Research Foundation of Korea (NRF-2019S1A5A2A03049170).

Institutional Review Board Statement

Not applicable.

Informed Consent Statement

Not applicable.

Conflicts of Interest

The authors declare no conflict of interest.

References

  1. Xiang, Z.; Schwartz, Z.; Gerdes, J.H., Jr.; Uysal, M. What can big data and text analytics tell us about hotel guest experience and satisfaction? Int. J. Hosp. Manag. 2015, 44, 120–130. [Google Scholar] [CrossRef]
  2. Li, X.; Law, R. Network analysis of big data research in tourism. Tour. Manag. Persp. 2020, 33, 100608. [Google Scholar] [CrossRef]
  3. Li, J.; Xu, L.; Tang, L.; Wang, S.; Li, L. Big data in tourism research: A literature review. Tour. Manag. 2018, 68, 301–323. [Google Scholar] [CrossRef]
  4. Mariani, M.; Baggio, R.; Fuchs, M.; Höepken, W. Business intelligence and big data in hospitality and tourism: A systematic literature review. Int. J. Contemp. Hosp. Manag. 2018, 30, 3514–3554. [Google Scholar] [CrossRef] [Green Version]
  5. Tanford, S.; Raab, C.; Kim, Y.S. Determinants of customer loyally and purchasing behavior for full service and limited-service hotels. Int. J. Manag. 2014, 36, 255–262. [Google Scholar]
  6. Zhang, W.; Li, Y.Q. Mapping knowledge analysis of theme hotel in China—Based on CNKI from 2005 to 2015. J. Qufu Norm. Univ. (Nat. Sci.) 2017, 2, 101–107. [Google Scholar]
  7. Bower, L. Fantasy-Themed Hotel Rooms. Available online: http://www.life123.com/sports/vacations-vacation-planning/hotels/fantasy-themed-hotel-rooms.shtml (accessed on 20 August 2021).
  8. Wei, X. Culture as a Sustainable Competitive Advantage. Available online: http://www.ith.com.cn/Article/html/311.html (accessed on 15 August 2021).
  9. Sun, J.; Chen, P.J.; Ren, L.; Shih, E.H.W.; Ma, C.; Wang, H.; Ha, N.H. Place attachment to pseudo establishments: An application of the stimulus-organism-response paradigm to themed hotels. J. Bus. Res. 2021, 129, 484–494. [Google Scholar] [CrossRef]
  10. Hunt, P.; Frankenberg, R. It’s a small world: Disneyland, the family and the multiple re-representations of American childhood. In Constructing and Reconstructing Childhood; Routledge: Abingdon-on-Thames, UK, 2015. [Google Scholar]
  11. Mao, R.Z.; He, J.M. Research on Shanghai Disneyland’s impact on the industrial development of Shanghai Disneyland’s surrounding areas—Based on international experience. East China Econ. Manag. 2010, 5, 1–5. [Google Scholar]
  12. Xu, X.; Li, Y. The antecedents of customer satisfaction and dissatisfaction toward various types of hotels: A text mining approach. Int. J. Manag. 2017, 55, 57–69. [Google Scholar] [CrossRef]
  13. Xiao, Q.; Zhang, H.Q.; Huang, H. The effects of hotel theme strategy: An examination on the perceptions of hotel guests on theme elements. J. China Tour. Res. 2013, 9, 133–150. [Google Scholar] [CrossRef]
  14. Sun, F.; Bi, T.; Ouyang, C.S. Research on O2O service encounter of theme hotel based on customer experience. Adv. Econ. Bus. Mgmt. Res. 2019, 111, 5–12. [Google Scholar]
  15. Kang, X.; Ren, H. Comparative study on experience perception of Chinese and foreign brand theme park hotels: Based on the online review of Shanghai Disney Hotel and Guangzhou Changlong Hotel. J. Taishan Univ. 2019, 5, 41–49. [Google Scholar]
  16. Bodet, G.; Anaba, V.; Bouchet, P. Hotel attributes and consumer satisfaction: A cross-country and cross-hotel study. J. Trav. Tour. Market. 2017, 34, 52–69. [Google Scholar] [CrossRef]
  17. Kasiri, Z.; Torabi Farsani, N.; Moazzen Jamshidi, H. Investigating the preferences of domestic tourists in relation to themed hotels (Case study: Isfahan city). Geogr. Environ. Plan. 2019, 30, 99–114. [Google Scholar]
  18. Chen, H.; Chiang, R.H.; Storey, V.C. Business intelligence and analytics: From big data to big impact. MIS Q. 2012, 36, 1165–1188. [Google Scholar] [CrossRef]
  19. Xiang, Z.; Du, Q.; Ma, Y.; Fan, W. A comparative analysis of major online review platforms: Implications for social media analytics in hospitality and tourism. Tour. Manag. 2017, 58, 51–65. [Google Scholar] [CrossRef]
  20. Gao, S.; Tang, O.; Wang, H.; Yin, P. Identifying competitors through comparative relation mining of online reviews in the restaurant industry. Int. J. Hosp. Manag. 2018, 71, 19–32. [Google Scholar] [CrossRef]
  21. Kim, H.S.; Noh, Y. Elicitation of design factors through big data analysis of online customer reviews for washing machines. J. Mech. Sci. Technol. 2019, 33, 2785–2795. [Google Scholar] [CrossRef]
  22. Dedeoğlu, B.B.; Bilgihan, A.; Ye, B.H.; Wang, Y.; Okumus, F. The role of elaboration likelihood routes in relationships between user-generated content and willingness to pay more. Tour. Rev. 2019, 76, 1660–5373. [Google Scholar] [CrossRef]
  23. Ahani, A.; Nilashi, M.; Ibrahim, O.; Sanzogni, L.; Weaven, S. Market segmentation and travel choice prediction in Spa hotels through TripAdvisor’s online reviews. Int. J. Hops. Manag. 2019, 80, 52–77. [Google Scholar] [CrossRef]
  24. Bilgihan, A.; Seo, S.; Choi, J. Identifying restaurant satisfiers and dissatisfiers: Suggestions from online reviews. J. Hosp. Market. Manag. 2018, 27, 601–625. [Google Scholar] [CrossRef]
  25. Köseoglue, M.A.; Mehraliyev, F.; Altin, M.; Okumus, F. Competitior intelligence and analysis (CIA) model and online reviews: Integrating big data text mining with network analysis for strategic analysis. Tour. Rev. 2020, 76, 529–552. [Google Scholar] [CrossRef]
  26. Mankad, S.; Han, H.S.; Goh, J.; Gavirneni, S. Understanding online hotel reviews through automated text analysis. Ser. Sci. 2016, 8, 124–138. [Google Scholar] [CrossRef]
  27. Li, H.; Liu, Y.; Tan, C.W.; Hu, F. Comprehending customer satisfaction with hotels: Data analysis of consumer-generated reviews. Int. J. Contemp. Hosp. Manag. 2020, 32, 1713–1735. [Google Scholar] [CrossRef]
  28. Radojevic, T.; Stanisic, N.; Stanic, N.; Davidson, R. The effects of traveling for business on customer satisfaction with hotel services. Tour. Manag. 2018, 67, 326–341. [Google Scholar] [CrossRef]
  29. Zhao, Y.; Xu, X.; Wang, M. Predicting overall customer satisfaction: Big data evidence from hotel online textual reviews. Inter. J. Hosp. Manag. 2019, 76, 111–121. [Google Scholar] [CrossRef]
  30. Wang, H.; Cui, Z.; Sun, H.; Rahnamayan, S.; Yang, X.S. Randomy attracted firefly algorithm with neighborhood search and dynamic parameter adjustment mechanism. Soft Com. 2017, 21, 5325–5339. [Google Scholar] [CrossRef]
  31. Ban, H.J.; Kim, H.S. Understanding customer experience and satisfaction through airline passengers’ online review. Sustainability 2019, 11, 4066. [Google Scholar] [CrossRef] [Green Version]
  32. Tao, S.; Kim, H.S. Cruising in Asia: What can we dig from online cruiser reviews to understand their experience and satisfaction. Asia Pac. J. Tour. Res. 2019, 24, 514–528. [Google Scholar] [CrossRef]
  33. Ban, H.J.; Kim, H.S. Semantic network analysis of hotel package through the big data. Culin. Sci. Hosp. Res. 2019, 25, 110–119. [Google Scholar]
  34. Oh, M.M.; Kim, S.S. Dimensionality of ethnic food fine dining experience: An application of semantic network analysis. Tour. Manag. Persp. 2020, 35, 100719. [Google Scholar] [CrossRef]
  35. Aralbayeva, S.; Tao, S.; Kim, H.S. A study of comparison between restaurant industries in Seoul and Busan through big data analytics. Culin. Sci. Hosp. Res. 2018, 24, 109–118. [Google Scholar]
  36. Shim, H.J.; Kim, Y.C.; Shon, H.Y.; Lim, J.Y. An exploratory usage pattern research of smartphone and social media users through semantic network analysis: Gender and age differences in perception and evaluation of usage pattern. Korean J. Bro 2011, 25, 28–138. [Google Scholar]
  37. Kim, H.S. A semantic network analysis of big data regarding food exhibition at convention center. Culin. Sci. Hosp. Res. 2017, 23, 257–270. [Google Scholar]
  38. Freeman, L.C. A set of measures of centrality based on betweenness. Sociometry 1977, 40, 35–41. [Google Scholar] [CrossRef]
  39. Bonacich, P. Some unique properties of eigenvector centrality. Soc. Net. 2007, 29, 555–564. [Google Scholar] [CrossRef]
  40. Kang, W.G.; Ko, E.S.; Lee, H.R.; Kim, J.N. A study of the consumer major perception of packaging using big data analysis-Focusing on text mining and semantic network analysis. J. Korea. Converg. Soc. 2018, 9, 15–22. [Google Scholar]
  41. Kim, D.J.; Lee, S. A study of consumer perception on fashion show using big data analysis. J. Fash. Bus. 2019, 23, 85–100. [Google Scholar]
  42. Park, C.; Lee, T.M. Information direction, website reputation and eWOM effect: A moderating role of product type. J. Bus. Res. 2009, 62, 61–67. [Google Scholar] [CrossRef]
  43. Wasserman, S.; Faust, K. Social Network Analysis: Methods and Applications; Cambridge University Press: Cambridge, UK, 1994. [Google Scholar] [CrossRef]
  44. Guo, Y.; Barnes, S.J.; Jia, Q. Mining meaning from online ratings and reviews: Tourist satisfaction analysis using latent dirichlet allocation. Tour. Manag. 2017, 59, 467–483. [Google Scholar] [CrossRef] [Green Version]
  45. Wikepedia. Google Travel. Available online: https://en.wikipedia.org/wiki/Google_Travel (accessed on 15 August 2021).
  46. Tao, S.; Kim, H.S. A study of comparison between cruise tours in China and USA through big data analytics. Culin. Sci. Hosp. Res. 2017, 23, 1–11. [Google Scholar]
  47. Jia, S. Behind the ratings: Text mining of restaurant customers’ online reviews. Int. J. Mark. Res. 2018, 60, 561–572. [Google Scholar] [CrossRef]
  48. Shi, F.; Chen, L.; Han, J.; Childs, P. A data-driven text mining and semantic network analysis for design information retrieval. J. Mech. Des. 2017, 139, 111402. [Google Scholar] [CrossRef]
  49. Doerfel, M.L. What constitutes semantic network analysis? A comparison of research and methodologies. Connections 1998, 21, 16–26. [Google Scholar]
  50. Doerfel, M.L.; Barnett, G.A. A semantic network analysis of the International Communication Association. Hum. Comm. Res. 1999, 25, 589–603. [Google Scholar] [CrossRef] [Green Version]
  51. Kim, H.S. An exploratory study on the semantic network analysis of food tourism through the big data. Culin. Sci. Hosp. Res. 2017, 23, 22–32. [Google Scholar]
  52. Ban, H.J.; Choi, H.; Choi, E.K.; Lee, S.; Kim, H.S. Investigating key attributes in experience and satisfaction of hotel customer using online review data. Sustainability 2019, 11, 6570. [Google Scholar] [CrossRef] [Green Version]
  53. Wen, J.; Zeng, T. An empirical study of the relationship between customer perceived service quality and post-purchase behavior in theme hotel of Shenzhen. Hum. Geogr. 2011, 26, 127–131. [Google Scholar]
  54. Kaiser, H.F. An index of factorial simplicity. Psychometrika 1974, 39, 31–36. [Google Scholar] [CrossRef]
  55. Kitsios, F.; Kamariotou, M.; Karanikolas, P.; Grigoroudis, E. Digital marketing platforms and customer satisfaction: Identifying eWom using big data and text mining. Appl. Sci. 2021, 11, 8032. [Google Scholar] [CrossRef]
  56. Berezina, K.; Bilgihan, A.; Cobanoglu, C.; Okumus, F. Understanding satisfied and dissatisfied hotel customers: Text mining of hotel reviews. Int. J. Hosp. Mark. Manag. 2015, 25, 1–24. [Google Scholar] [CrossRef]
  57. Ban, H.J.; Kim, H.S. A study on the TripAdvisor review analysis of restaurant recognition in Busan 1: Especially concerning English reviews. Culin. Sci. Hosp. Res. 2019, 25, 1–11. [Google Scholar]
  58. Lee, M.; Cai, Y.; DeFranco, F.; Lee, J. Exploring influential factors affecting guest satisfaction: Big data and business analytics in consumer-generated reviews. J. Hosp. Tour. Technol. 2020, 11, 137–153. [Google Scholar] [CrossRef]
  59. Xie, H.; Miao, L.; Kuo, P.J.; Lee, B.Y. Consumers’ responses to ambivalent online hotel reviews: The role of perceived source credibility and pre-decisional disposition. Int. J. Hosp. Manag. 2011, 30, 178–183. [Google Scholar]
  60. Herjanto, H.; Amin, M.; Okumus, F.; Cobanoglu, C. Airline service: Low-cost-carriers (LCCs) failure and passenger emotional experience. Tour. Rev. 2021. [Google Scholar] [CrossRef]
  61. Lan, T.; Feng, X.; Zeng, Z. Effect of B&B host response to online reviews on subsequent reviews: The moderating effect of class level. Tour. Rev. 2021. [Google Scholar] [CrossRef]
  62. Yadav, N.; Verma, S.; Chikhalkar, D.R. eWOM, destination preference and consumer involvement a stimulus organism-response (SOR) lens. Tour. Rev. 2021. [Google Scholar] [CrossRef]
  63. Leri, I.; Theodoridis, P. How do personality traits affect visitor’s experience, emotional stimulation and behaviour? The case of wine tourism. Tour. Rev. 2020, 76, 1013–1049. [Google Scholar] [CrossRef]
Figure 1. Network visibility of top frequency words.
Sustainability 13 12699 g001
Figure 2. Visualization of CONCOR analysis.
Sustainability 13 12699 g002
Table 1. Summarization of overall satisfaction rating.
RatingFrequencyPercentCumulative Percent (%)
1271.81%1.81%
2342.28%4.09%
31127.50%11.59%
441928.06%39.65%
590160.35%100.00%
total1493100.00%-
Average score: 4.43
Table 2. Frequency of the top 70 keywords of customers reviews.
RankWordFrequency%RankWordFrequency%
1good3176.43%36fun440.89%
2Disney3146.37%37shuttle430.87%
3place2124.30%38bus420.85%
4room1903.85%39visit420.85%
5service1863.77%40convenient410.83%
6staff1763.57%41view410.83%
7food1583.20%42big390.79%
8nice1302.64%43lobby380.77%
9stay1182.39%44worth370.75%
10great1162.35%45walk370.75%
11park1152.33%46love370.75%
12kids1032.09%47maze360.73%
13characters921.87%48atmosphere360.73%
14time901.83%49excellent350.71%
15experience881.78%50night350.71%
16beautiful881.78%51spacious340.69%
17expensive841.70%52water340.69%
18like841.70%53delicious340.69%
19restaurant801.62%54small330.67%
20buffet781.58%55check330.67%
21pool761.54%56high330.67%
22clean731.48%57sea330.67%
23comfortable731.48%58old320.65%
24family711.44%59style320.65%
25breakfast661.34%60enjoy320.65%
26friendly661.34%61photos300.61%
27environment651.32%62Hollywood300.61%
28people641.30%63free290.59%
29price611.24%64location290.59%
30garden561.14%65area290.59%
31Mickey541.10%66star290.59%
32dinner521.05%67Kingdom280.57%
33facilities460.93%68theme280.57%
34quality450.91%69outdoor270.55%
35happy450.91%70magical260.53%
Table 3. Comparison of words frequency and centrality.
WordsFrequencyFreeman’s Degree
Centrality
Eigenvector Centrality
Freq.RankCoefficientRankCoefficientRank
good317121.33830.3023
Disney314227.90610.3441
place21238.737170.11820
room190424.79220.3212
service186514.83250.2245
staff176618.03940.2614
food158712.42780.1827
nice130811.43090.1719
stay118910.967110.15511
great1161010.957120.15312
park1151113.58870.1808
kids1031211.019100.15810
characters921310.350140.14913
time901414.11260.2116
experience88158.264190.12617
beautiful88165.622310.07733
expensive84176.599240.09726
like84187.822210.11322
restaurant801910.063160.13516
buffet782010.124150.14215
pool762110.607130.14814
clean73225.797290.08730
comfortable73235.191340.07335
family71244.759380.06441
breakfast66258.028200.12018
friendly66266.362260.10125
environment65272.518640.03762
people64286.609230.10323
price61295.941280.08829
garden56308.716180.11819
Mickey54315.756300.08232
dinner52327.565220.11621
facilities46334.286420.06142
quality45343.320550.05450
happy45353.690510.04954
fun44362.693630.03464
shuttle43376.013270.08331
bus42384.965360.07434
visit42393.926460.05447
convenient41404.780370.07237
Table 4. Summarization of words from CONCOR analysis.
ClustersExtracted WordsSignificant Words
Family friendlinessstaff/stay/service/comfortable/
kingdom/big/friendly/worth/
kids/visit/magical/fun/
experience/place/
family/excellent/theme
staff/service/kids/family/
theme/comfortable/
magical/fun/friendly/
worth/fun
Amenitiespool/nice/facilities/park/night/
spacious/maze/clean/room/area/
great/water/walk/outdoor/
shuttle/location/
Pool/facilities/park/
spacious/
outdoor/shuttle//room
Value of Moneyenjoy/star/good/price/time/like/
sea/love/convenient/environment/high/people/check/small/
Hollywood/lobby/free/view/
garden/expensive
enjoy/star/good/
good/price/lobby/free/
expensive/high/check
Diningold/breakfast/restaurant/quality/
Disney/food/delicious/photos/
style/beautiful/dinner/happy/character/bus/atmosphere/mickey/
buffet
breakfast/restaurant/
quality/delicious/dinner/
character/atmosphere/
buffet/Disney
Table 5. Result of factor analysis.
FactorsWordsFactor LoadingEigen ValueCumulative Variance
1Diningbuffet0.6962.72313.617
character0.671
dinner0.590
photos0.558
2Transportationpark0.7081.63421.788
shuttle0.702
free0.595
walk0.590
3Outdoor Poolwater0.7301.53929.483
pool0.724
outdoor0.708
4Employee
Attitude
friendly0.8381.47436.852
staff0.827
5Family
Empathy
location0.7931.21142.905
family0.680
room0.476
6Valueworth0.7241.19348.869
price0.702
7Food Qualityquality0.8071.08454.290
food0.703
Notes: KMO (Kaiser Meyer Olkin): 0.665. Bartlett chi-Square (p): 3126.835 (p < 0.001).
Table 6. Result of linear regression analysis.
ModelUnstandardized CoefficientsStandardized Coefficients
BStd. ErrorBetatSig.
(Constant)4.4340.022 200.8610.000
Dining−0.0150.022−0.017−0.6690.503
Transportation−0.0130.022−0.016−0.6060.545
Outdoor Pool−0.0210.022−0.024−0.9500.342
Employee Attitude0.0280.0220.0331.2780.201
Family Empathy−0.0520.022−0.060−2.3610.018
Value−0.0660.022−0.076−2.9830.003
Food Quality−0.1030.022−0.119−4.6450.000
Notes: Dependent variable: Customer Satisfaction (CS); R2 = 0.026; Adjusted R2 = 0.021; F = 5.630.
Publisher’s Note: MDPI stays neutral with regard to jurisdictional claims in published maps and institutional affiliations.

