Article

Estimating the Spatial Heterogeneity and Seasonal Differences of the Contribution of Tourism Industry Activities to Night Light Index by POI

1
College of Forestry, Central South University of Forestry and Technology, Changsha 410004, China
2
National Dongmen Forest Farm of Guangxi, Chongzuo 532199, China
3
National Forestry and Grassland Administration State Forestry Administration Engineering Research Center for Forest Tourism, Changsha 410004, China
4
College of Marine Culture and Law, Shanghai Ocean University, Shanghai 201306, China
*
Author to whom correspondence should be addressed.
Sustainability 2022, 14(2), 692; https://doi.org/10.3390/su14020692
Submission received: 25 November 2021 / Revised: 25 December 2021 / Accepted: 6 January 2022 / Published: 9 January 2022
(This article belongs to the Special Issue Big Data and Sustainability in the Tourism Industry)

Abstract

:
The spatial distribution of tourism has a profound impact on its operational efficiency and geographical relevance. Point of interest (POI), as a kind of spatial data shared by subject and object, can reflect the spatial distribution form and function of tourism geographical objects under the all-for-one tourism policy. Continuous satellite observation and in-depth study of night lights pave the way to clarify human activities and socio-economic dynamics. The purpose of this paper is to investigate the seasonal changes of night light images and their correlation with tourism in 122 counties (cities, districts) of Hunan Province. We obtained night earth observation data (seasonality) and POI in 2019 and processed them by Geographic Information System and statistical analysis (ordinary least squares (OLS) and geographically weighted regression (GWR)). The results show that the luminous radiation intensity is highly correlated with the POI of tourism activities. The POI of different tourism activities in different regions shows obvious spatial heterogeneity and seasonal differences, which is the result of the comprehensive effect of tourism resource distribution and social environment in Hunan Province. GWR has proved to be a more effective tool. It provides a new method and perspective for tourism research and especially reveals the geographical spatial differences of tourism activities, which is helpful to study the spatial distribution and seasonality of tourism at the county level. In addition, the spatial evaluation of the contribution of tourism and luminous radiation can provide reference and suggestions for relevant departments to formulate tourism night protection measures.

1. Introduction

The tourism sector is a true global force for economic growth and development, driving the creation of more and better jobs and serving as catalyst for innovation and entrepreneurship [1]. All-for-one tourism refers to a new concept and model of regional coordinated development in a certain region, which takes tourism as an advantageous industry, realizes the organic integration of regional resources, industrial integration and development, and social co-construction and sharing, and uses tourism to drive and promote the coordinated development of economy and society [2]. It includes all elements, industries, processes, directions, time and space, society, doors, and tourists [3]. Developing global tourism is one of the most important economic activities in Hunan Province and it is also the scope of this paper. Under the all-for-one policy requirements of living, working, and traveling in the whole region [4], Hunan Province gave full play to the advantages of tourism resources and accelerated the construction of a whole regional tourism base with Splendid Xiaoxiang as the brand in 2018 [5]. The policy also proposes to deeply integrate the elements of all-for-one tourism resources, strive to optimize the layout of tourism space, and make every effort to build a whole region tourism base and a strong tourism province [6].
Generally, we use statistical indicators, such as the number of tourists and tourism income, to evaluate and quantify the impact of tourism activities. These data have limitations, such as long collection time, single indicators, and the inability to describe the spatial characteristics of tourism [7,8]. It is a challenging process to describe human activities, especially tourism activities, and estimate their dynamics on a large scale. Although the characteristics of urban areas can be obtained from high spatial resolution satellite images, tourism and human activities are difficult to reflect from urban satellite images. At the same time, considering data collection and analysis, it is very complex to draw maps every year (or even more seasonally) [9]. It is a challenge to obtain socio-economic information on various spatial scales in an accurate and standardized way. With the wide application of mobile intelligent terminals, a large number of public source data are also being generated, including mobile phone signals, GPS-derived urban traffic trajectories, and points of interest (POI) [10]. Compared with traditional data, these emerging public source data are not only more abundant but also reflect human behavior and activities.
POI is point spatial data extracted after abstracting social entities, such as tourist attractions, stations, shopping centers, and parks. It is easier to obtain and process, with the advantages of low cost, frequent updates, wide-coverage, higher accuracy, and recognition rate, which can make up for the deficiency of population, income, night lighting, and other conventional data [11]. It contains the spatial location and attributes information of geographical entities, such as name, longitude and latitude, address, type, administrative region, and so on. To a certain extent, it can reflect various activities in a certain area. At present, it is widely used in human activities, urban function identification, and point of interest recommendation [12,13]. In the era of all-for-one tourism, POI data, as a spatial data type shared by subject and guest, can well reflect the spatial structure and distribution of tourism, as well as the social and economic functions carried by tourism-related spatial entities [14]. Therefore, in this study, we combine the tourism elements of different industries to classify the POI data as various indicators to quantify tourism activities.
In addition, great progress has been made in earth observation technology using remote sensing and geographic information systems. Earth observation products provide valuable assets for obtaining comparable data for analysis and decision-making of the whole province and even the country. They can explore the development law and trend of geospatial and mine more valuable spatial information in a deeper and wider range [15]. Night light data is a common remote sensing data source. It is found that there is a strong correlation between human activities and night light intensity [16,17]. It is a unique, objective, and valuable data resource, the advantage of which is to provide efficient and accurate spatial data for observing socio-economic and physical phenomena from a multi-scale perspective, which has great potential to monitor human-related socio-economic activities [18]. It has been widely used to detect and monitor urbanization, population, and GDP spatialization and estimate power and energy [19,20,21].
Compared with the light images detected by the sensors mounted on the defense meteorological satellite program operational line scan system (DMSP-OLS) since 1992 [22,23,24], the day and night band (DNB) sensor of Suomi national polar-orbiting partnership’s visible infrared imaging radiometer suite (NPP-VIIRS) has greater advantages in detecting and characterizing artificial light sources [25]. It has higher spatial and radiation resolution, so it can better reflect the intensity of human activities and solves the obstacles existing in the traditional DMSP-OLS data, such as lack of vehicle calibration, excessive luminescence around the city, and a saturation of the geographical location of the urban core and has a higher spatial resolution (750 m) and digital range (14 bits) [26]. Therefore, it produces better results in detecting the temporal changes and spatial trends of various phenomena [27].
In the field of tourism, night light images are also used to evaluate the spatial spillover effect of tourism and as the site selection factor of dark night Park [28,29]. The correlation between tourism economy and night light has been confirmed [9]. However, it must be emphasized that the mechanism for obtaining specific tourism data of large regions involves a lot of costs and energy [7]. In addition, the official tourism statistics of countries usually only provide a simple value, not the distinction between tourism industry types. Moreover, such information is lacking in some regions, especially in a large-scale sample range. Therefore, the question is how to use a simplified modeling framework to quantify the night lights generated by tourism activities of different types of elements in the region.
The research goal of this paper is to investigate the seasonal changes of night satellite image brightness and deeply consider their correlation and spatial heterogeneity with different tourism industry activities. Specifically, the focus is to analyze and investigate whether there are suitable mathematical and spatial models between season changes with the help of POI, remote sensing images, and geographically weighted regression methods to evaluate the contribution of different types of tourism activities to night light radiation. We applied the spatial model to 122 counties in the province (city, district). This study provides a new method and perspective for tourism research. In particular, it reveals the spatial differences of tourism activities geographically, which will help to study the seasonality of tourism activities in the whole region and investigate or reveal the possible seasonal patterns. At the same time, the spatial distribution of different tourism activities and the evaluation of the contribution of different tourism activities to night light radiation can also be used to combine with different data in the future, to discuss the degree and spatial feature of carbon energy consumption and light pollution generated by various tourism activities, so as to provide reference and suggestions for relevant departments to formulate tourism dark night protection measures and promote the sustainable development of tourism.

2. Materials and Methods
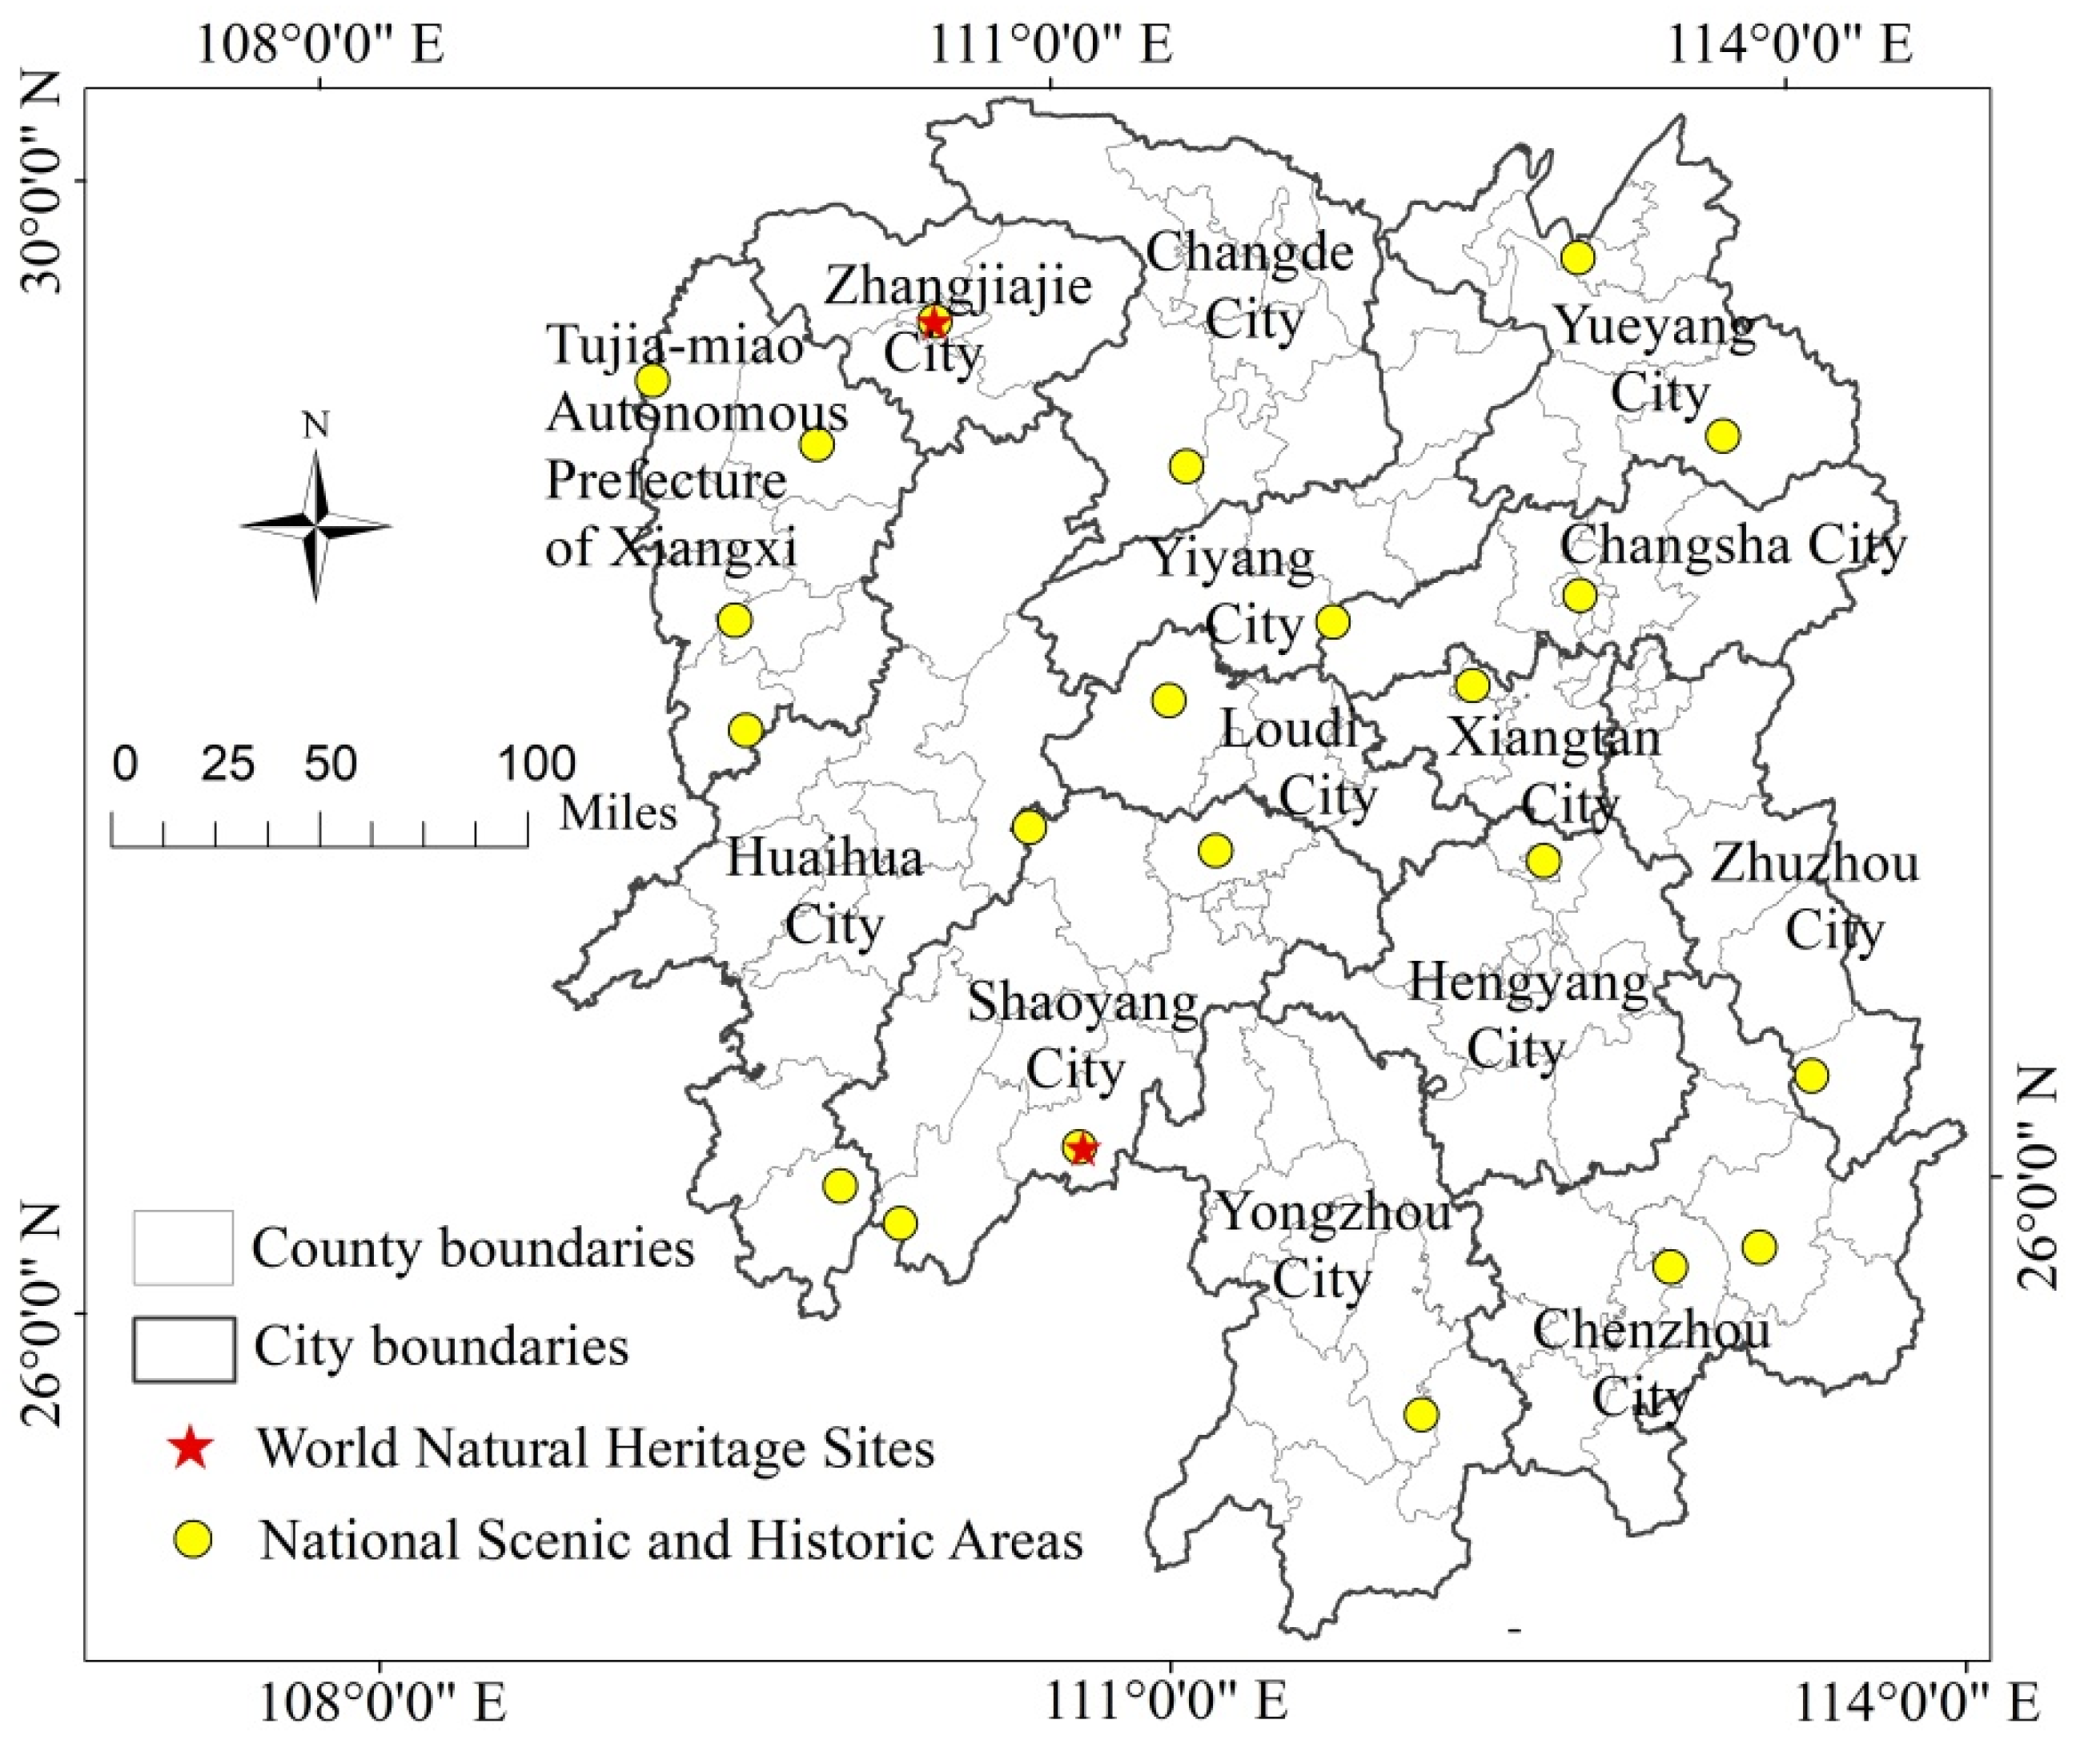
2.1. Study Area

Hunan Province is located in the south-central part of China. It governs 14 cities (prefectures) and 122 counties (cities and districts). It is one of the important birthplaces of the Chinese civilization. It has various geomorphic types and many historical relics. By 2019, as shown in Figure 1, two World Natural Heritage Sites were built, whose natural heritage is second only to Sichuan Province in China, and 22 National Scenic and Historic Areas were built, which rank first in China in Zhejiang Province in terms of quantity. Among them, Wulingyuan in Zhangjiajie was the first natural heritage site listed in China in the World Heritage Sites List by UNESCO. Hengshan Mountains is one of the five most famous mountains in China, and Yueyang Tower is one of the three most famous buildings in south of the Yangtze River. According to China’s national statistical classification of tourism and related industries (2018) and the accounting scheme for the added value of tourism industry in Hunan Province, the added value of the tourism industry in Hunan Province in 2019 was 218. 858 billion yuan, accounting for 5.37% of the national total added value of the tourism industry, and total tourism revenue ranks ninth in China and first in Central China. Divided according to different industries, the added value of tourism transportation is 66.771 billion yuan, accounting for 27.17%, while the added value of tourism accommodation is 22.271 billion yuan (9.06%), tourism catering is 39.894 billion yuan (16.23%), sightseeing is 21.501 billion yuan (8.75%), tourism shopping is 35.944 billion yuan (14.63%), and leisure and entertainment are 19.593 billion yuan, accounting for 7.97% of the total.

2.2. Data Sources

2.2.1. Spatial and Night Lighting Data

NPP-VIIRS data are from the National Oceanic and Atmospheric Administration (NOAA) and the National Centers for Environmental Information (NCEI) Suomi NPP satellite, launched at the end of 2011. The monthly image set was produced by using the night light data obtained from the DNB band of the satellite to provide pixel radiation value to represent the light intensity. DN (digital number) is the brightness value of remote sensing image pixel, the value of which reflects the intensity of the light, and its unit is w·cm−2·sr−1. If the pixel radiation value is 0 or less, it is regarded as no light. In this study, the monthly vcmcfg night light data from 1 to 12 in Hunan in 2019 were collected from the official website of NOAA. The administrative division vector map of the study area was extracted from the national 1:1 million databases of the China National Basic Geographic Information Center.

2.2.2. POI Date

The POI data of this study came from the Baidu map. Baidu map POI data was divided into 22 categories and 182 subcategories. Based on the classification of the tourism industry and tourism elements, we deleted and selected the POI data category of the Baidu map and finally retained 13 categories and 59 subcategories. Through the API interface provided by the Baidu map Developer Platform and with the help of a python tool, all POI data related to the tourism industry in Hunan Province was mined. The data format is point vector data, including category, province, city, district and county, name, detailed address, and longitude and latitude.

2.3. Data and Image Processing

2.3.1. Image Correction

WGS-1984 is the geographical coordinates of the original night light images obtained from NOAA. To get a more accurate area, this paper used the data management tools and spatial analysis tools in ArcGIS software to transform the geographic coordinates of the monthly images into Projection coordinates of Asia Lambert Conformal Conic and resample the raster pixel resolution to 500 m.
The image definition of the VIIRS image has been significantly improved. Therefore, short-term light sources, such as fire, fishing boats, oil and gas wells, and weak reflected light, such as rivers and lakes, easily cause local disturbance to the data [30]. The background noise was represented by some low radiation and negative pixels in the image. For the problem of very few negative and transient light sources, we uniformly assigned the values to 0 according to the principle that the value of the unlighted area is 0 [31]. At the same time, we used the minimum threshold of 0.3 × 10⁻⁹ w·m−2·sr−1 proposed by Ma for background noise cancellation [32]. At the same time, the maximum lighting value of Changsha, the most economically developed city in Hunan Province, was regarded as the maximum threshold. After that, we regarded the area greater than the maximum threshold as the maximum value [33]. In this study, the mean filtering method was used to eliminate the maximum value with the average value of the surrounding 8 pixels as the pixel greater than the threshold range. Finally, we got the monthly light image after image correction.

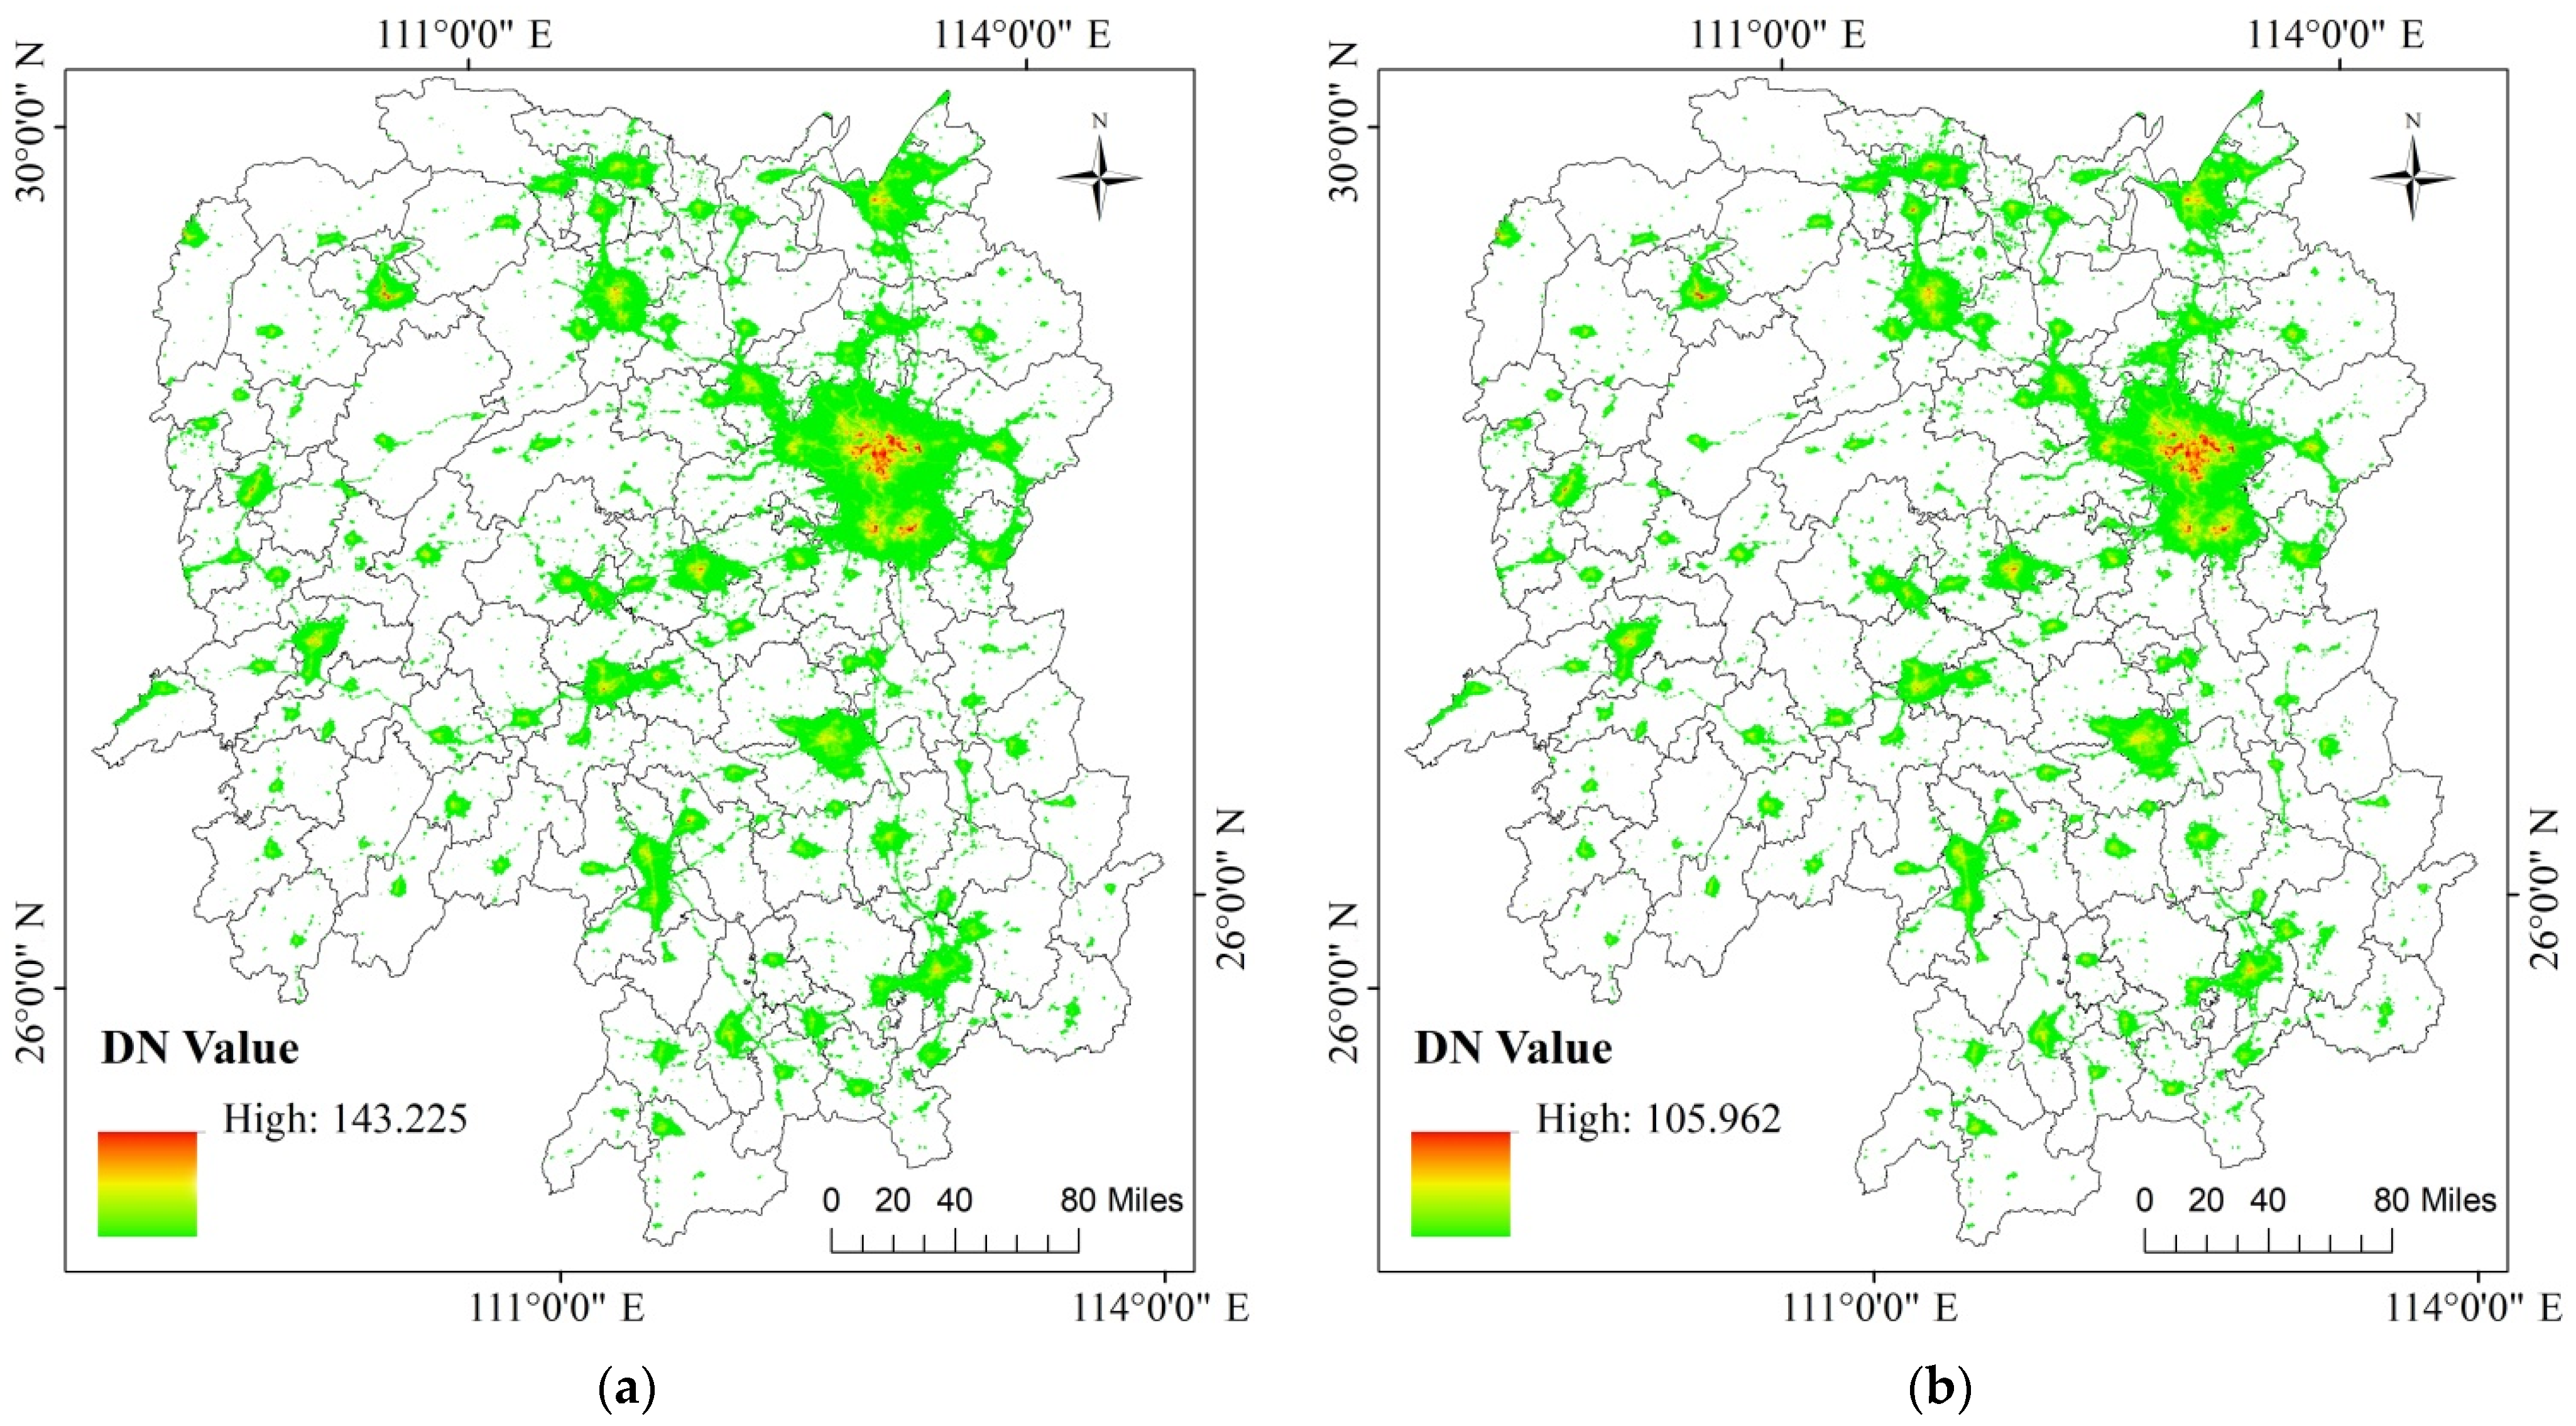
2.3.2. Calculation of Night Light Index

To obtain the light values in different seasons, we extracted the bright value (DN > 0) area affected by light in each month using the spatial analysis tool of ArcGIS software and synthesized the summer composite night light image of 2019 by using the corrected monthly light image from April to September, and the dates from January to March and October to December were used to synthesize the winter composite night light image. Spatial visualization of composite night light values in summer and winter of 2019 are displayed in Figure 2.
The calculation formula of night light value in different seasons is as follows:
DN w = i DN i 6 ( i = 1 , 2 , 3 , 10 , 11 , 12 ) ;
DN s = i DN i 6 ( i = 4 , 5 , , 9 )
DNW is the pixel value of the winter composite night light images in 2019; DNS is the pixel value of the summer composite night light images; DNi is the night light pixel value of each month.
The regional night light values of 122 counties (cities and districts) in Hunan Province were calculated by using the ArcGIS software zoning statistical tool. In order to facilitate the subsequent regression analysis, the log function transformation was used to normalize the regional night light value. Finally, we got the normalized regional night light index (NLI) in summer (NLIs) and winter (NLIw).

2.3.3. Deletion of POI Data

Through the python tool, we obtained 224,319 POI interest points related to the tourism industry. We transformed the original bd09 coordinates of the Baidu map POI data into the geographical coordinates of WGS-1984. After that, we screened and excluded duplicate and irrelevant points in different categories and finally obtained 173,398 POI data. According to the classification of tourism elements, there are 39,421 catering service points, 31,137 accommodation facilities, 877 transportation service points, 13,126 sightseeing points, 52,964 shopping service points, and 35,873 leisure service points (Table 1). ArcGIS tool was used to partition the number of POI in the statistical area. At the same time, in order to ensure the comparability between different types of POI data, we normalized the data by linear function, respectively, and then all the results was placed between the 0–1 interval.
The data normalization formula is as follows:
Xnom = (XXmin)/(XmaxXmin),
where X is the original sample value, Xnom is the normalized value, Xmax is the maximum value of the sample, and Xmin is the minimum value of the sample.

2.4. Applied Method

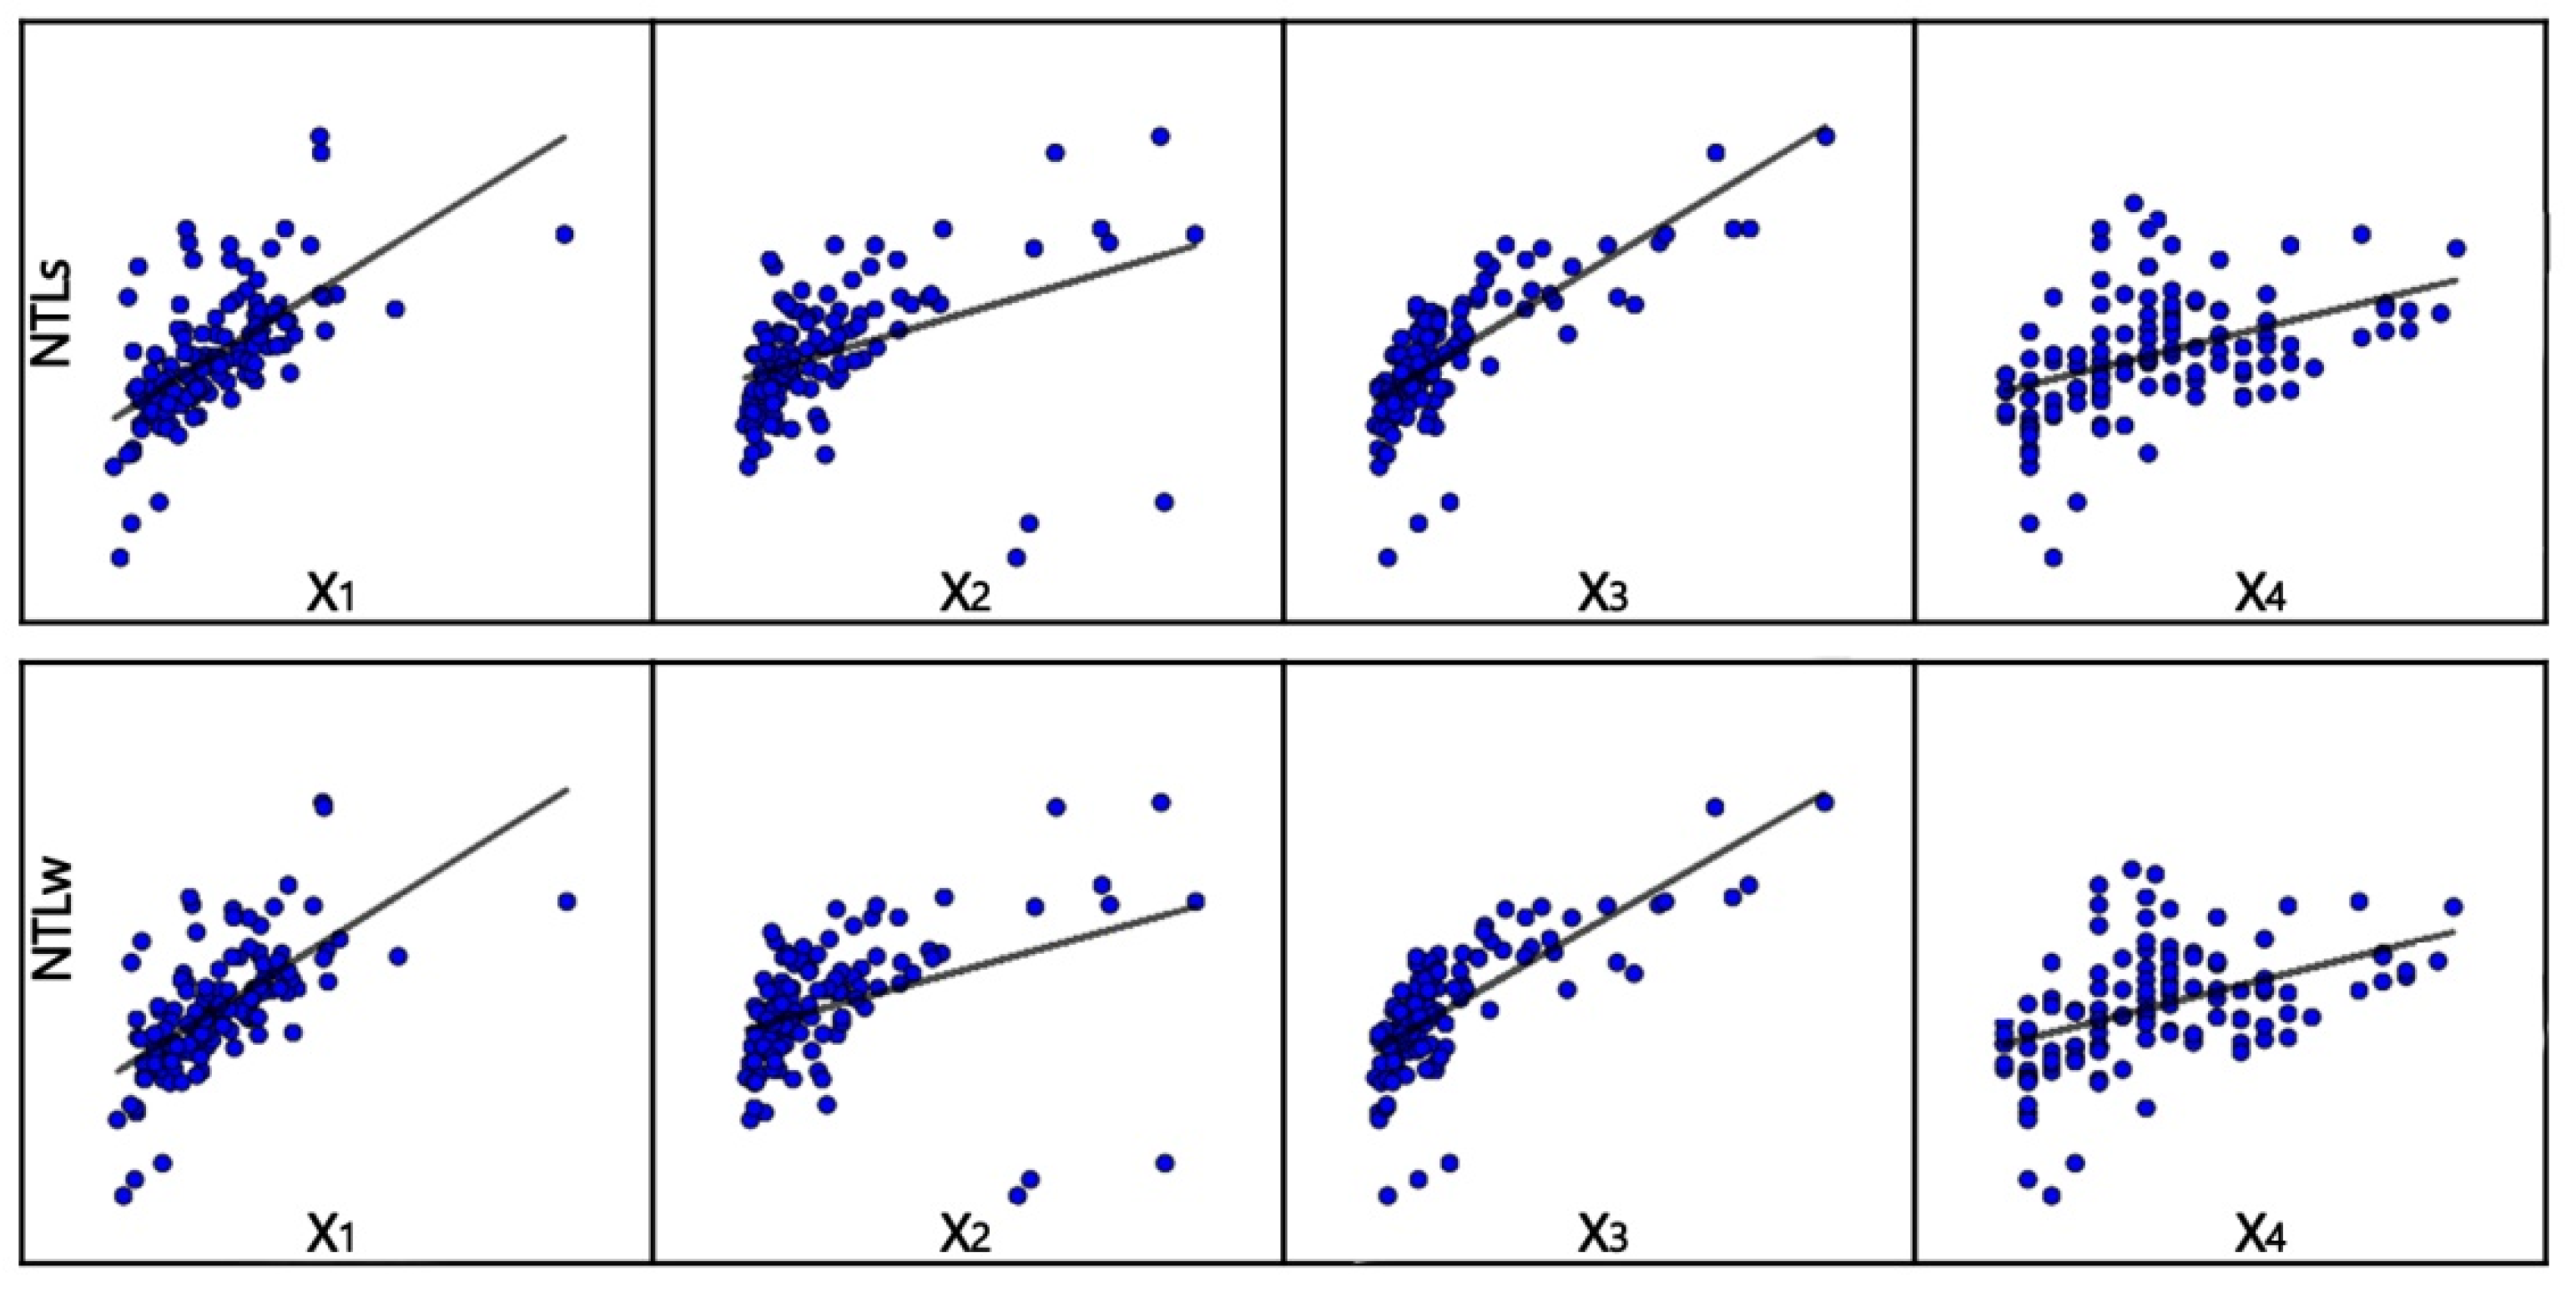
2.4.1. OLS Regression Analysis

The traditional regression model is based on the ordinary least squares (OLS) method for global parameter estimation [34]. The multiple linear regression model based on OLS is as follows:
Y = β0 + β1X1 + ⋯ + β(n−) X(nX) + ε,
where Y is the dependent variable, X = (1, X1,…, Xn−1) is the independent variable, β is the regression coefficient to be estimated, and ε is a random error, which is the column vector of n rows with a mean of 0.
When the dependent variables obey the normal distribution, the OLS model is unbiased. Single sample Kolmogorov Smirnov is used to detect whether the variables comply with the normal distribution. When p > 0.05, it can be judged that the data comply with the normal distribution. As one of the most important parameters in the model, the variance inflation factor (VIF) of the variable should not exceed 5 to ensure that there are no multicollinearity or redundant independent variables in the model. A value greater than 5 for VIF indicates that two or more variables are similar to each other. In the operation, the method of stepwise regression can solve the multicollinearity problem between independent variables. In addition, there are some statistical definitions in the OLS model, such as R2 and adjusted R2, which are measures of model performance, with possible values ranging from 0.0 to 1.0. Joint F statistics is a measure of the significance of the model, and the value of Koenker (BP) statistic (Koenker’s studentized Breusch- Pagan statistic) is used for testing stability and heteroscedasticity. The Jarque Bera statistic is used to check whether the residuals are normally distributed, while Durbin Watson statistics describes the autocorrelation of residuals, and the value should be between 1–3. The closer it is to 2, the better the model performance.

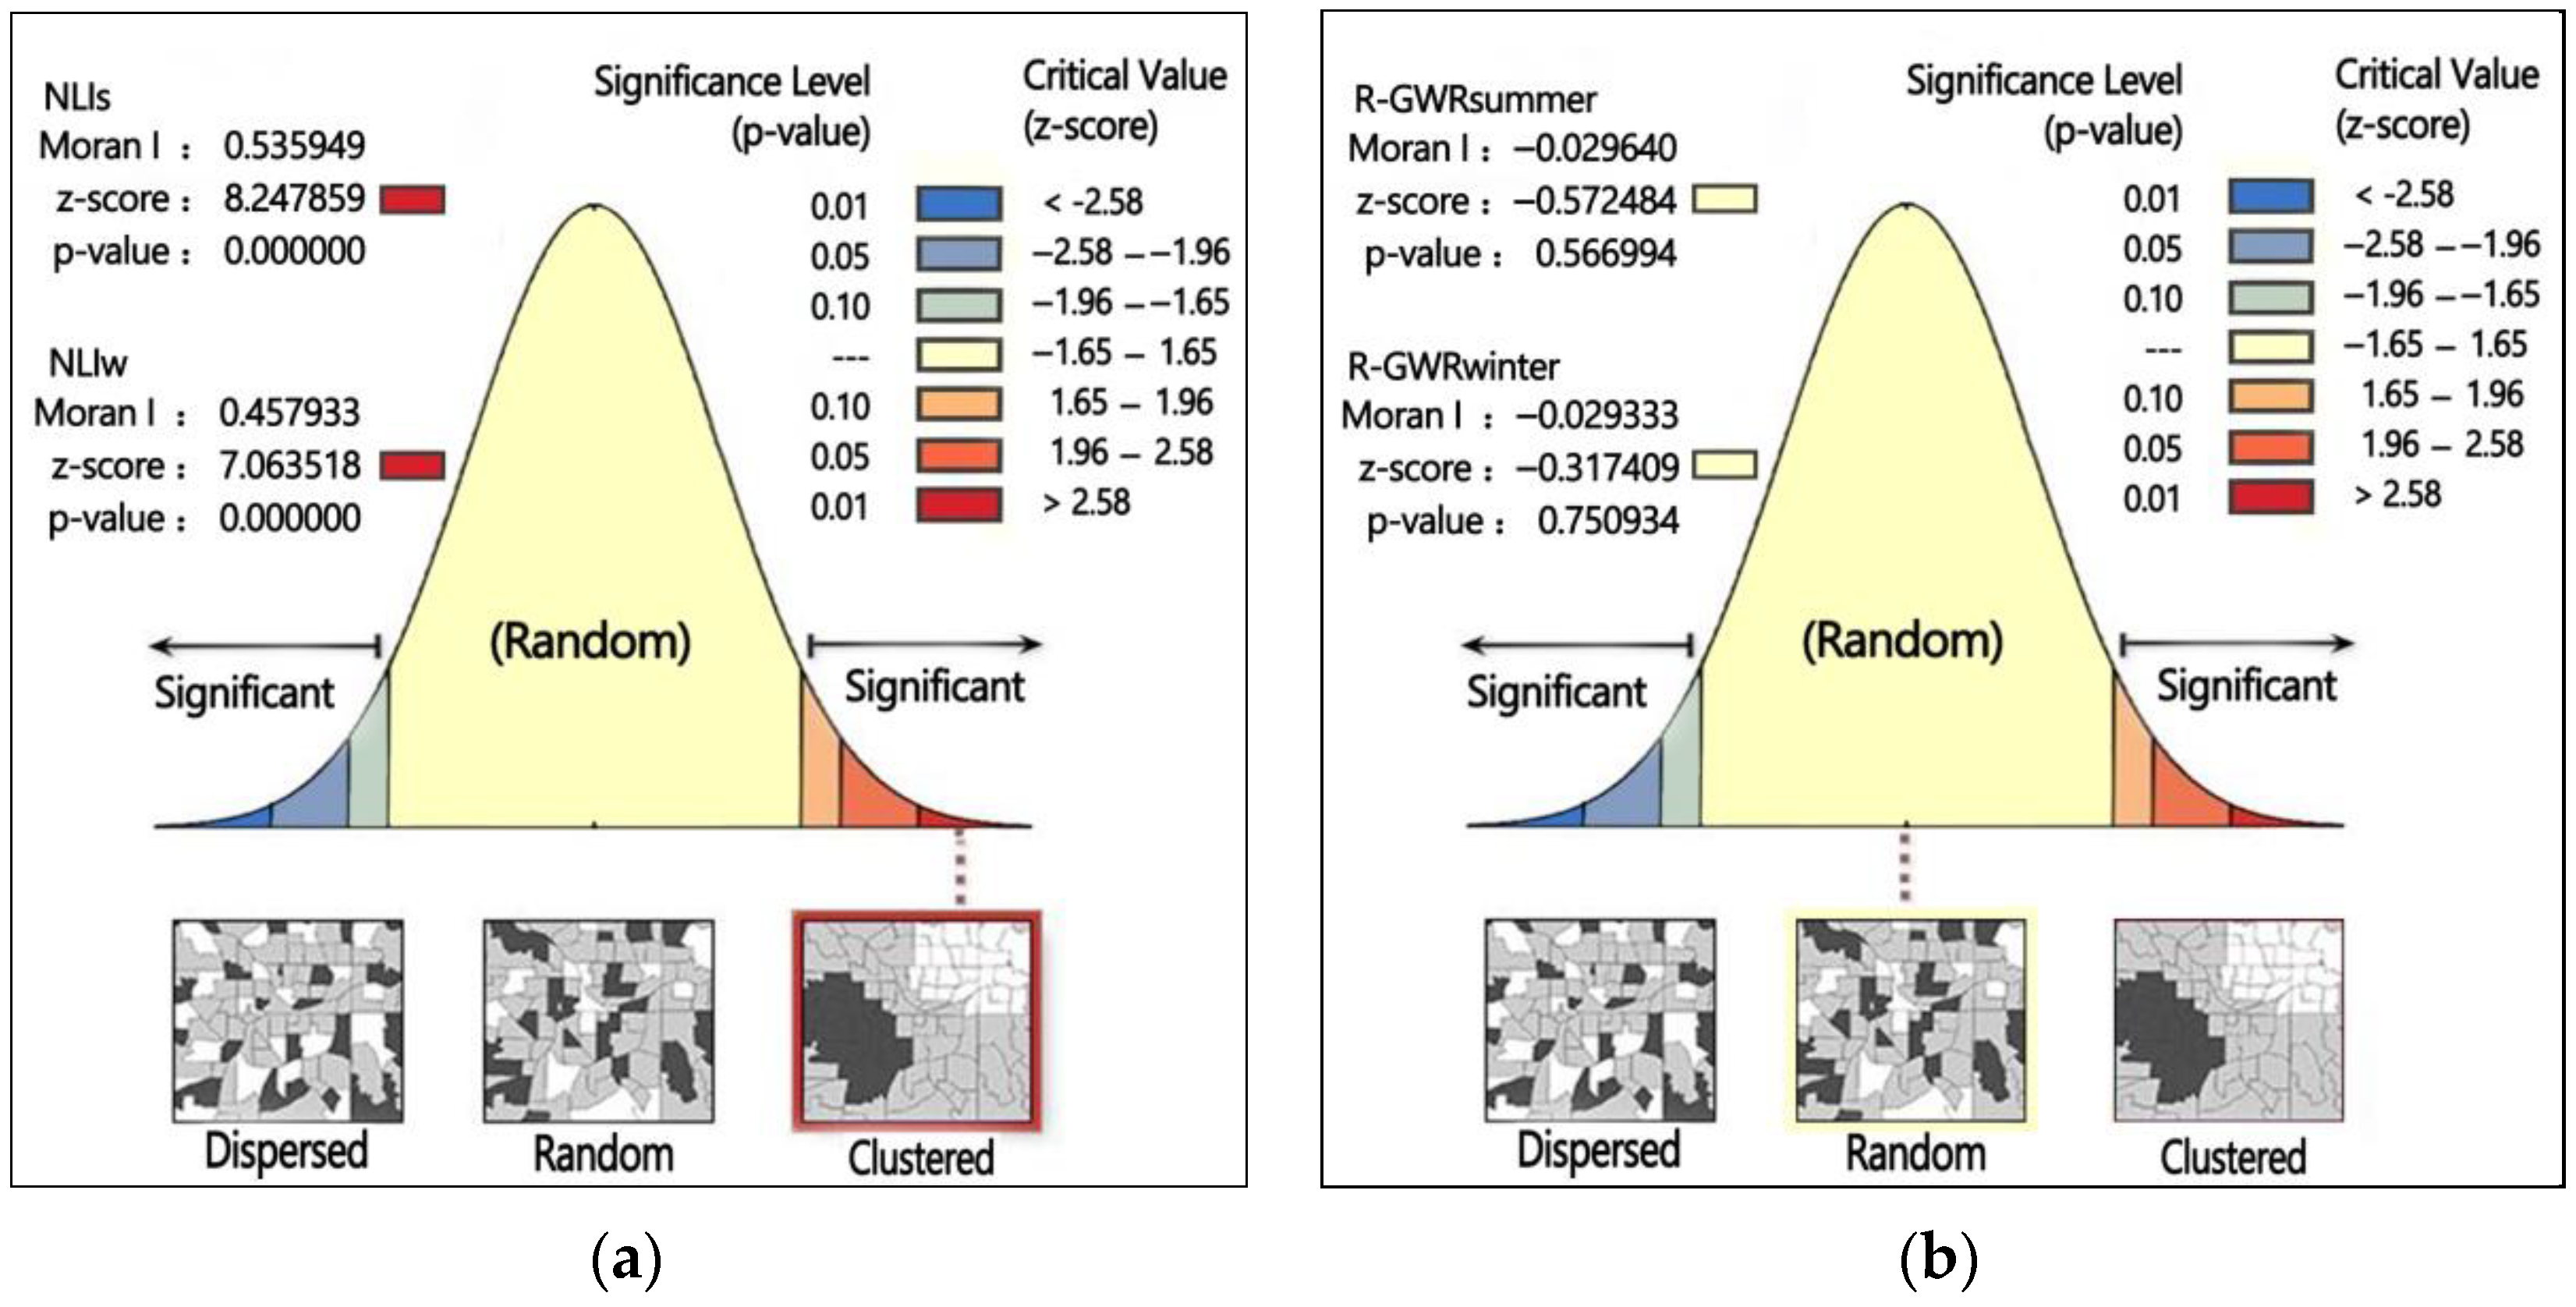
2.4.2. Geographically Weighted Regression Analysis

To limit the spatial variability, the geographically weighted regression (GWR) model proposed by Brunsdon et al. [35] can be used to estimate the parameters of the regression model. The spatial autocorrelation of dependent variables is the prerequisite for constructing the GWR Model [36]. The global Moran’s I index is used to test the spatial autocorrelation of variables, and its statistical significance is determined by the value of p of the value of standardized Z. p is the significance level, that is, the probability that the observed value is created by the random process. The closer it is to the value of 0, the higher the random probability is. Moran’s I is calculated using the following formula:
I = n i = 1 n j = 1 n W ij ( X i X ) ( X j X ) ( i = 1 n j = 1 n W ij ) i = 1 n ( X i X ) 2 ;   z I = I E ( I ) V ( I ) ,
where I is the parameter value of global autocorrelation and the value range is [−1, 1]. The closer the value is to 1, the stronger the correlation is, and the value of 0 indicates random distribution in space. n is the total number of research samples, (XiX) and (XjX) are the deviation between the value of the specific attribute at i and j and its average value, respectively, and Wij is the value of the weight matrix. E(I) is the expected value of Moran I and V(I) is the variance.
GWR is an extension of the traditional standard regression method. Different from the global model, the GWR Model is based on local statistics and considers the spatial variation of variables and its impact on estimation. Thus, this method shows how the relationship between variables changes with space. The equation of GWR is:
Y i   = β 0 ( u i , v i ) + k β k ( u i , v i ) X ik + ε i   ,   i = 1 , 2 , , n ,
where (ui, vi) is the coordinate of element i, βk(ui, vi) is the kth regression parameter of the ith element, and εi is the random error of the ith element.
In this method, the model parameters of each geographical location are estimated by using the weighting function of exponential distance attenuation, and the observed values are weighted by distance. Therefore, the closer the observation is to the research location, the greater the influence on the parameter estimation. Therefore, spatial weight matrix is the core of GWR. The weight calculation can be realized by the subtraction function of spatial distance with any value range of [0, 1], which is called kernel function [37]. The Akaike information criterion (AIC) can optimize the bandwidth value. AICc is the corrected value, and the model will better fit the observed data with a lower AICc [38,39]. In this paper, Gaussian kernel function is used, and the relevant formula is as follows:
W ij = e ( d ij b ) 2 2 ,
AICc = 2n ln(σ) + nln(2π) + n(n + tr(s))/(n − 2 − tr(s)),
where Wij is the spatial weight matrix, Dij is the degree of spatial proximity between position i and position j, and b is the value of bandwidth. n is the sample size, σ is the standard deviation of the error term, and tr(s) is the trace of the S matrix of GWR, which is the function of the bandwidth.

3. Results

3.1. Results of OLS Model

In Table 2, the result of the single sample Kolmogorov Smirnov test is >0.05, so the dependent variable complies with the condition of normal distribution. In the first model estimation of summer and winter, the relationship between some POI variables and light index was not significant. By checking the value of VIF, we found that there is redundancy in catering service variables. Therefore, we used the stepwise regression method for the second model prediction and eliminated the data redundancy and non-significant variables by deleting the variables of accommodation service and catering service. Finally, the results of the model are shown in Table 3 and Table 4. The scatter distribution relationship between explanatory variables and NTL is shown in Figure 3.
In our study, R2 in different seasons is 0.763 (summer) and 0.759 (winter), and the adjusted R2 is 0.755 (summer) and 0.751 (winter), respectively, which means that the two models fit well. The models passed the joint f (Sig = 0.000 < 0.05) test, and Koenker (BP) and Jarque BERA statistics also achieved good results (>0.05). At the same time, Durbin Watson statistics in different seasons were 1.948 (summer) and 1.942 (winter), respectively. This result is close to 2, which means normal distribution. The statistical analysis results show that the model has a good prediction effect on the variables. According to these results, the POI of leisure and entertainment, shopping services, transportation services, and sightseeing in the tourism industry has a significant impact on the night light index of the area, and the performance of the model parameters in summer is better than that in winter.

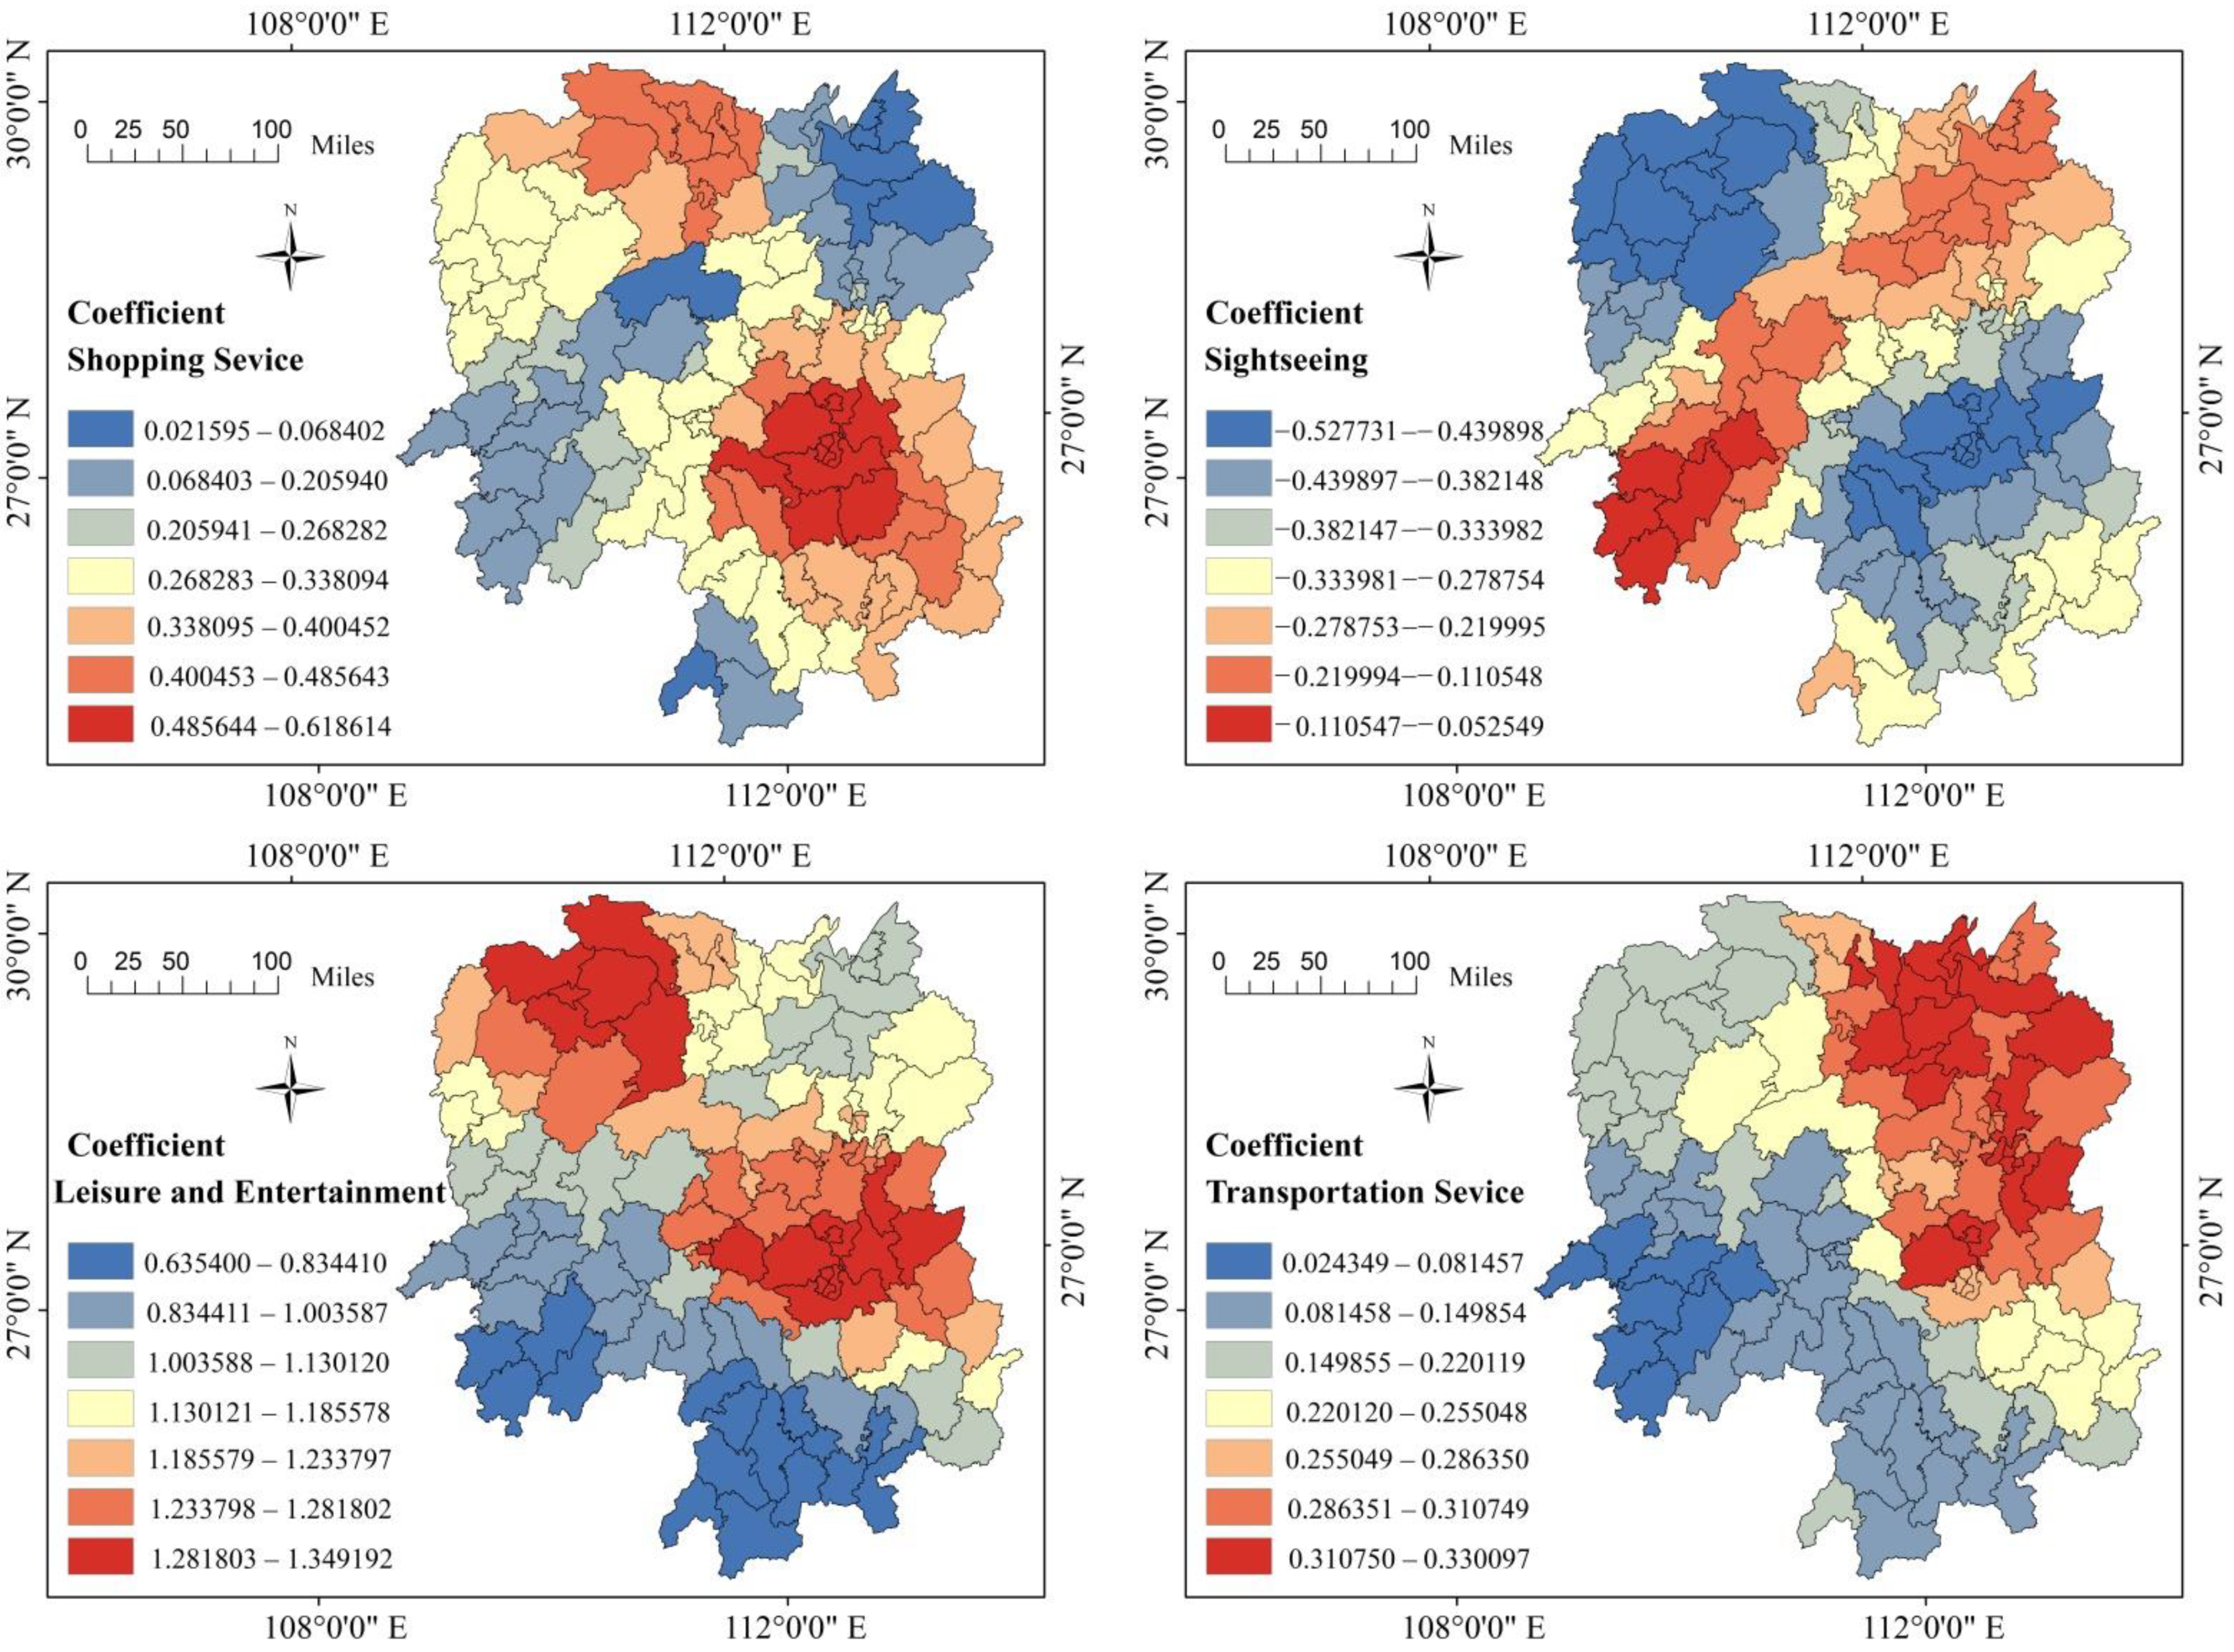
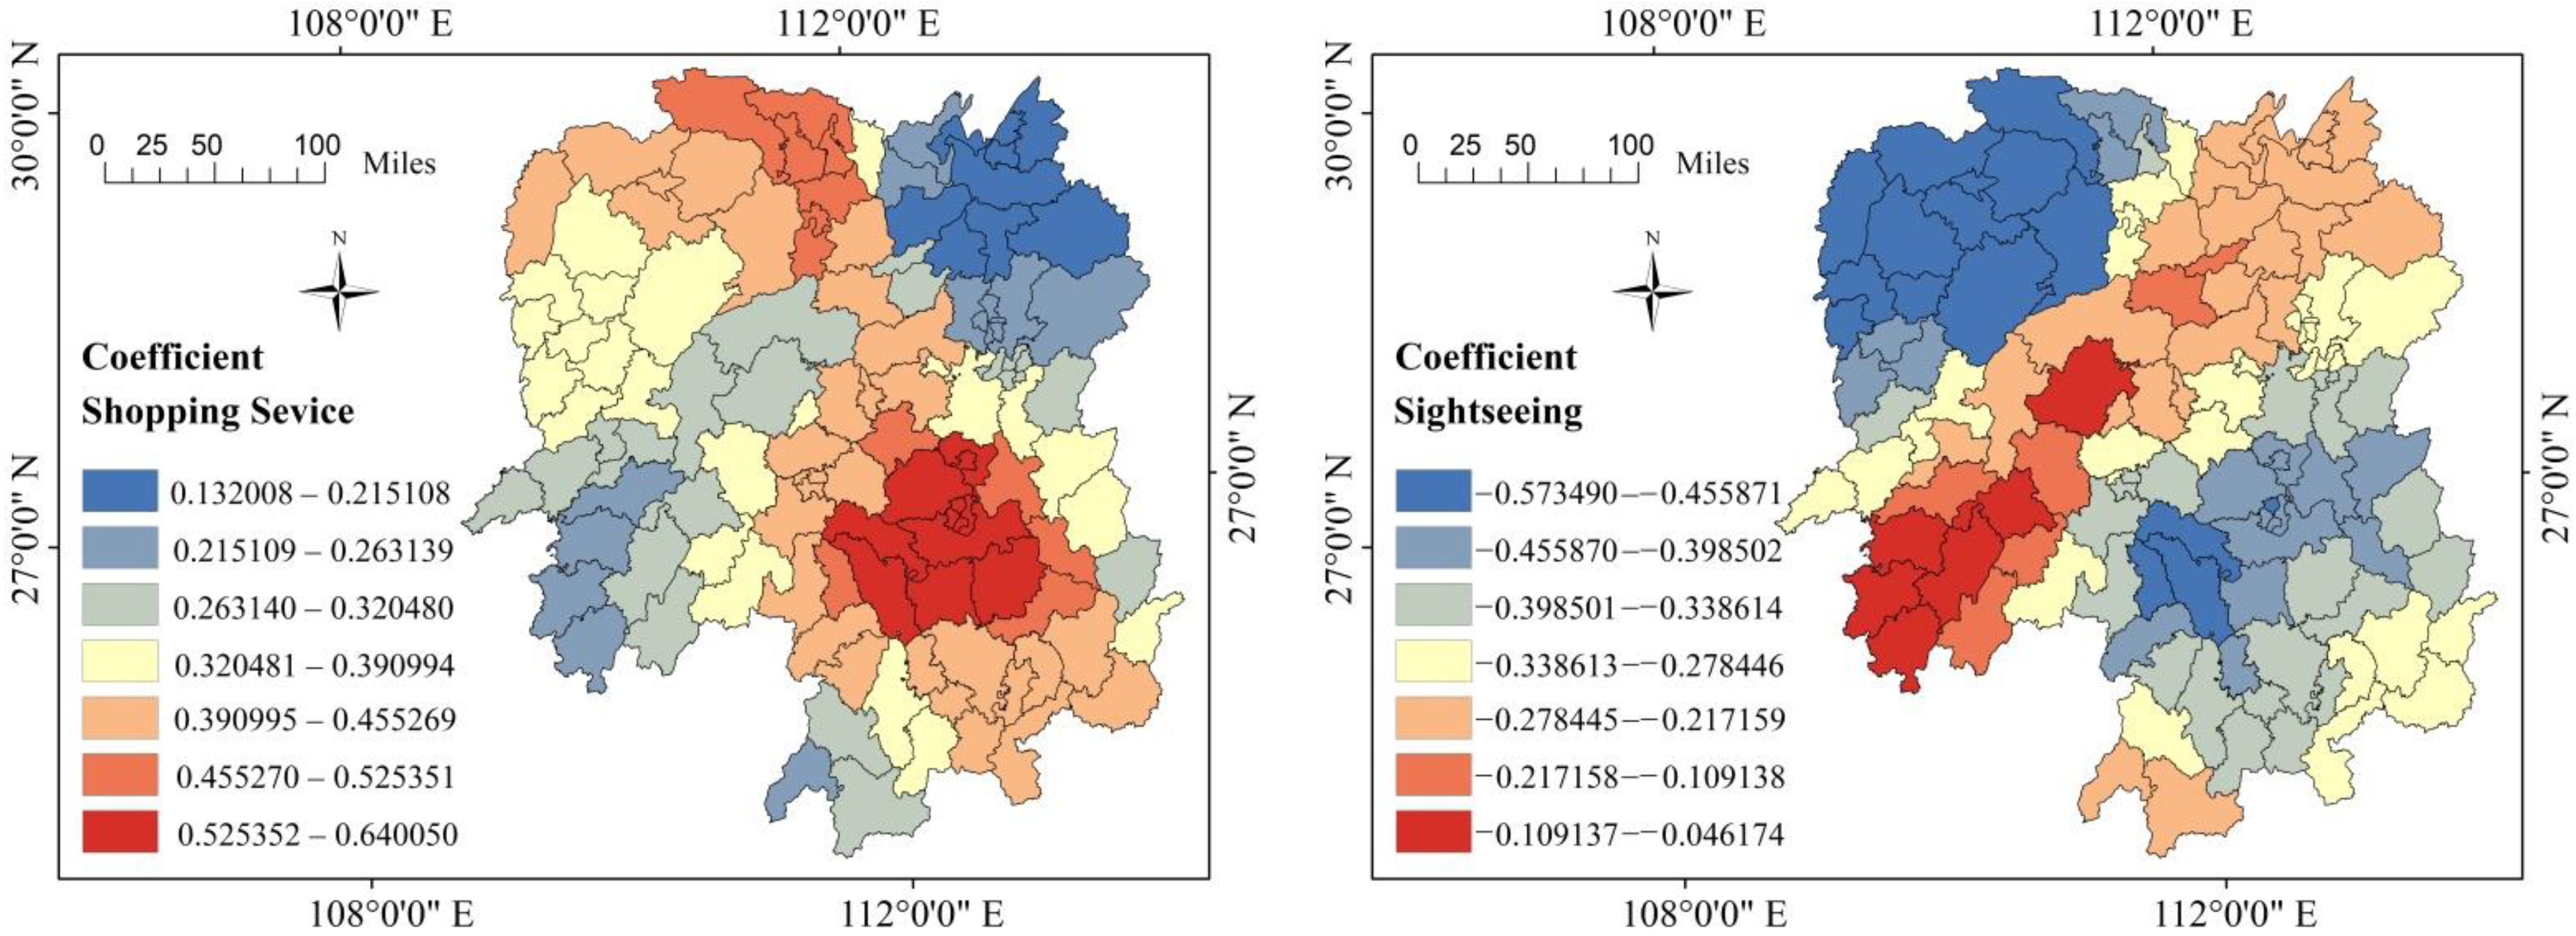
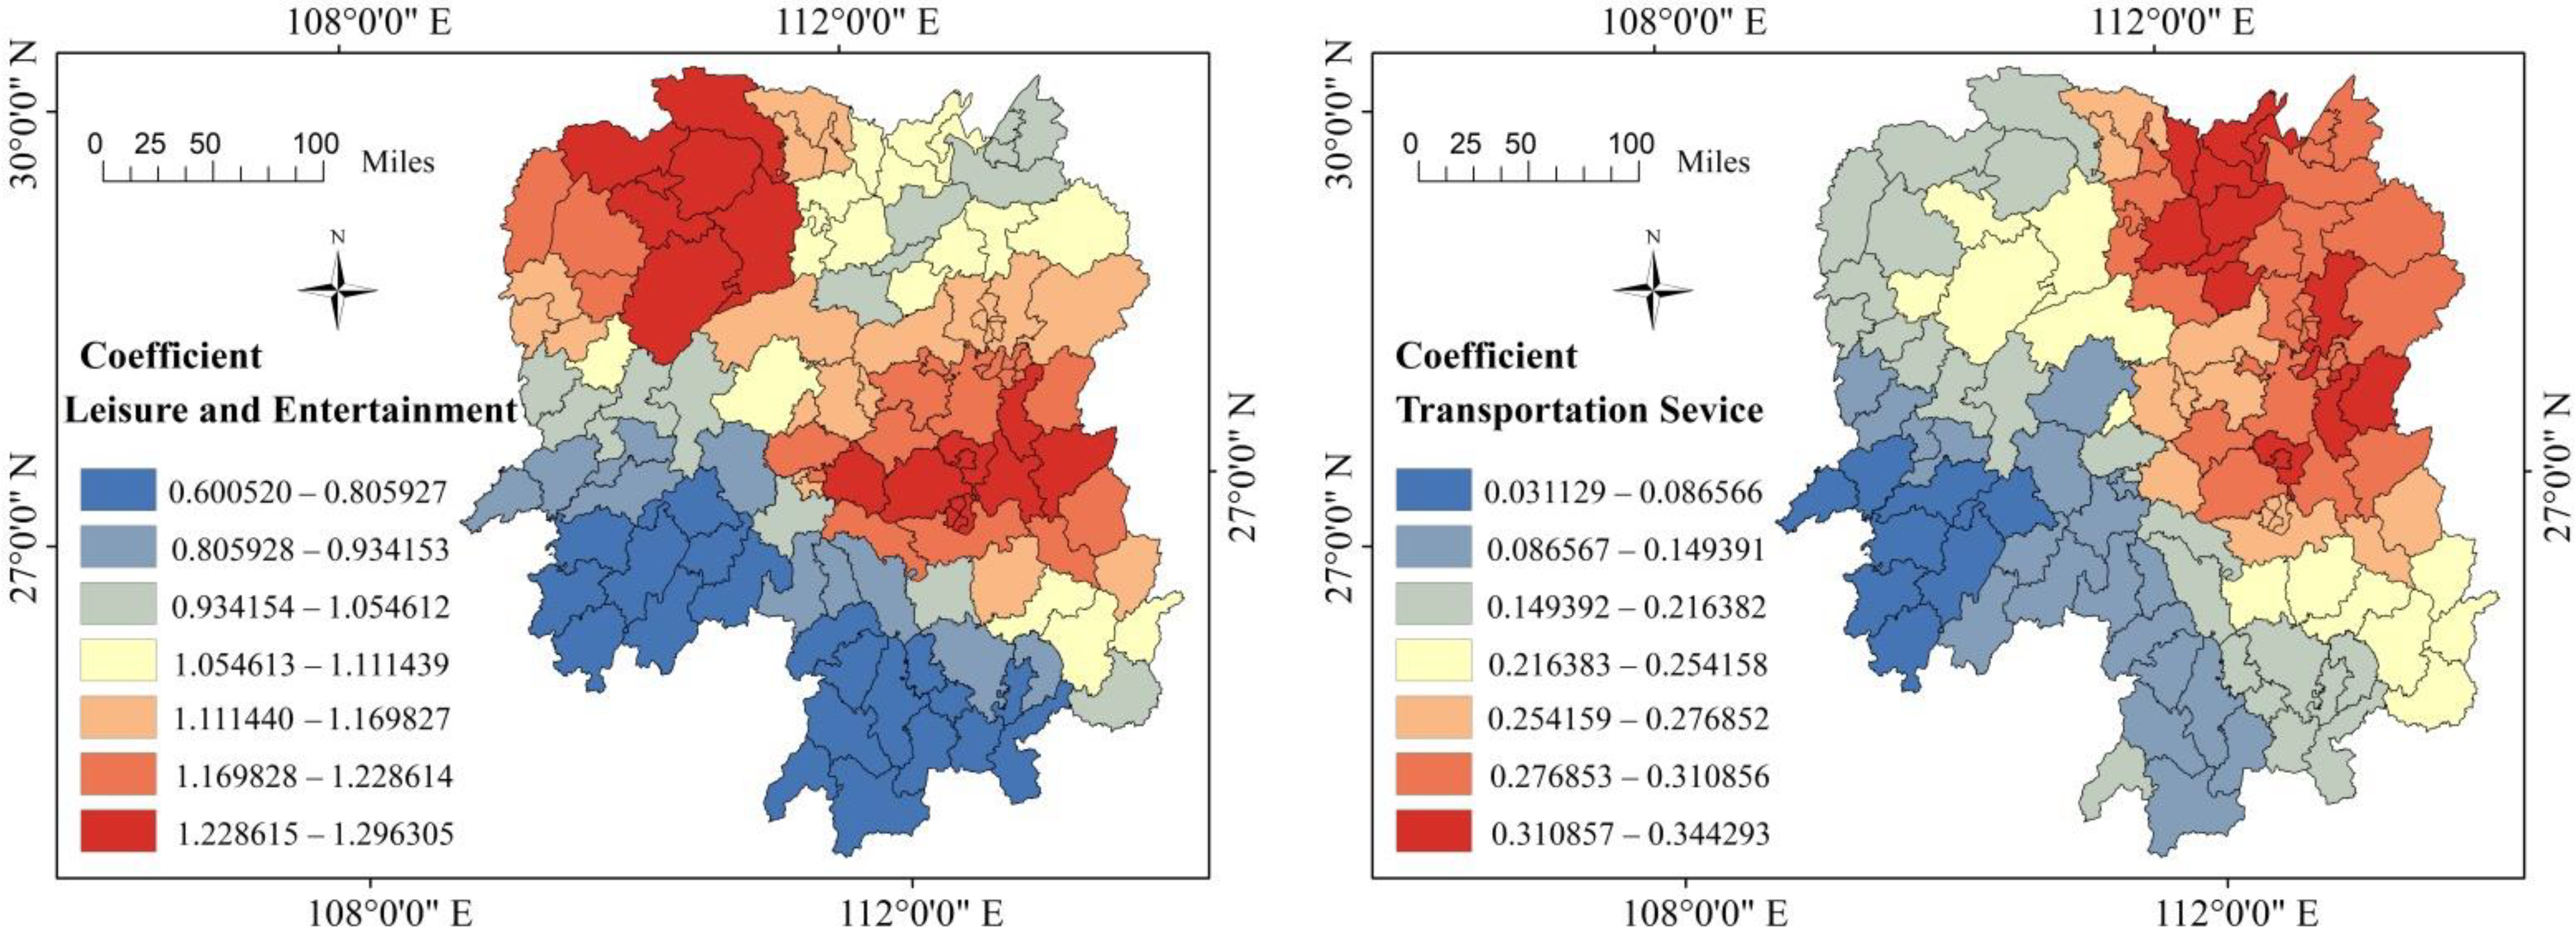
3.2. Results of GWR Model

According to the OLS model, we remove meaningless variables and eliminate data redundancy. Therefore, we included the POI variables related to tourism industry in summer and winter models into the GWR model, including shopping services, sightseeing, leisure and entertainment, and transportation services. Before constructing the GWR model, we verified the spatial autocorrelation of night light index through Moran’s I index. The values of Moran’s I were 0.535949 (summer) and 0.457933 (winter), the values of Z were 8.247859 (summer) and 7.063518 (winter), and the value of p was 0.000. The light distribution shows a strong spatial positive correlation and aggregation. After that, we tested the spatial correlation of the residual of the GWR model. The residual (R) presented random distribution characteristics in space, and the surface model obtained better fitting results. The spatial autocorrelation results are shown in Figure 4.
The comparison of OLS and GWR results is summarized in Table 5. The GWR model is a significant improvement of the OLS model, which is more significant in summer (adjusted R2 = 0.815) than in winter (adjusted R2 = 0.805). In addition, the value of AICc also shows that the results of the local regression model are more significant and significantly smaller than those of the global regression model. Overall, OLS and GWR methods show that there is a significant correlation between tourism POI variables and night light index, and the correlation is stronger in summer than in winter. ArcGIS is used to visualize the spatial distribution of GWR Model parameters, as shown in Figure 5, which are fitting of the tourism POI and night light index in two cold and hot seasons in the model. Figure 6 and Figure 7, respectively, show the spatial distribution results of local model coefficients in different seasons.

4. Discussion

Because the parameters of OLS are fixed in space, there are limitations in solving the spatial correlation and heterogeneity of the model. In contrast, spatial statistical methods are more helpful to evaluate spatial correlation and spatial heterogeneity. The Moran index can be used to quantify spatial autocorrelation, while geographically weighted regression can be used to quantify spatial heterogeneity [40]. In fitting samples, GWR will consider the light index in different seasons and the geospatial location of POI of different element types. It is weighted according to the location attribute of the sample and generates different parameters for each tourism POI variable at each location to better reflect the spatial heterogeneity of its impact on the light index. Thus, the parameters of each factor may be positive in one position but negative in another position, which indicates that the role of the driving factor is to promote or inhibit the growth of light intensity [41,42].
In GWR modeling, the bandwidth of the spatial kernel function essentially affects the regression performance, thus affecting the construction of the regression model. Selecting the optimal bandwidth requires many experimental comparisons. The fixed distance threshold is the most direct bandwidth definition method. However, when the density of data points is uneven, there may be insufficient effective samples participating in the model evaluation [43,44]. By defining the number of nearest neighborhoods, the distance between the analysis location and the nearest neighborhood is taken as the bandwidth value of the corresponding model solution to avoid the disadvantage of fixed type. Therefore, the corresponding bandwidth value at each regression position may be different, that is, the variant bandwidth [45]. We used the Gaussian kernel function to carry out repeated experiments in different seasons, compared the two kernel types respectively, and then found that the accuracy of the adaptive kernel type was higher. At the same time, the advantage of GWR is that it can visualize the spatial distribution of different parameters and clearly show how spatial heterogeneity affects modeling [35]. The comparison of the two models is helpful to select an appropriate method to reflect the spatial heterogeneity in the impact of tourism activities.
In the initial model, we included all the transportation facilities, resulting in the problem of being unable to distinguish between subject and object [46]. Because most short-distance traffic is used by residents, it also leads to some deviation in the results of the model. After excluding all short-distance transportation facilities, from the perspective of all-for-one tourism, we only retained long-distance transportation facilities, such as aircraft, high-speed rail, train, and long-distance bus stations [47,48,49], as tourism transportation POI to participate in the construction of the regression model. After that, our model got better results. We used the same method to verify the composite lighting data and tourism POI data in 2019. The spatial correlation results were consistent with the results in different seasons. At the same time, we used the lighting data of summer and winter in 2018 for comparison and verification. The seasonal difference results were similar to those in 2019. Therefore, this study has good adaptability.
In terms of seasonal differences, although there is little difference between the model results in summer and winter, the model fitting results were generally slightly higher than that in winter. The temporary imbalance caused by the agglomeration of tourists in a short time is the core feature of tourism seasonality [50]. Affected by China’s geographical region and natural characteristics, seasonal differences are particularly obvious [51]. The tourism income and number of tourists in summer are significantly higher than that in winter. Although the policy of all-for-one tourism is of great significance to alleviate the seasonality of tourism, a large number of tourists will still lead to a significant increase in the use of tourism elements and facilities in the peak tourism season [52].
From the perspective of geographical region division, the fitting accuracy of the model presents the distribution characteristics of high in the northeast, low in the southwest, and gradually decreasing from east to west. The regions with high fitting degrees include Yueyang, Changsha, Hengyang, and other cities, and the regions with a relatively low fitting degree are mainly in Yongzhou in southern Hunan. Due to the spatial agglomeration effect of the tourism industry itself [53], the effects of POI on night light in different types of tourism industry show significant spatial heterogeneity. Taking the county of Hunan Province as a case, it has a wide range, and there are great differences in tourist attractions, tourist service facilities, and social environment [54]. According to the results of the independent variable coefficient, the correlation between leisure and entertainment, shopping service, transportation service, and lighting index is positive. Among them, leisure and entertainment have the highest contribution rate to the lighting index, followed by shopping facilities. That is, the more shopping, leisure, and transportation service facilities in the region, the stronger the light intensity, which is consistent with the previous research results on the spatial distribution of POI and light remote sensing [55].
The results also show that the correlation between sightseeing and night light index is negative. We speculate that the characteristics of tourism resources in Hunan Province are an important factor. Most sightseeing POI points are located in vast mountains, lakes, and protected areas [56]. The coupling relationship between nature reserves and China’s light intensity shows that the established national nature reserves, national scenic spots, national forest parks, national parks, and other nature reserves have a high spatial coupling with the darkest areas in China, which are less polluted by light [57]. China wilderness mapping [58] also shows that there is a strong correlation between the dark area of light and the distribution of wilderness in China. The management measures and policies of scenic spots are other important factors. On the one hand, in most natural scenic spots, the business hours are only 17:00–18:00, which greatly reduces the opportunities for tourists to participate in sightseeing activities at night. On the other hand, it reduces the generation of light pollution by reducing unnecessary lighting and low-carbon travel, which means that it is almost impossible to produce large-scale night light.
Some scholars have studied the spatialization of industry and economy based on lighting data, POI, and other multi-source data. Compared with a single tourism eco-nomic aggregate index, using POI data to evaluate the correlation between human nighttime tourism activities and nighttime lighting data will make the research results objective and scientific [59]. In this paper, we use POI data as the basic index, combined with the functional classification of the tourism industry. POI data has little overall change in a short period (months and a year) and has the characteristics of a large amount of information, high positioning accuracy, and strong real-time performance [60]. Night light data show great advantages in the study of urban expansion. As an indicator of human social activities and economic development, it also has guiding significance. Different from GDP and other socio-economic data, the use of luminous data has the advantages of convenient collection, a small amount of data, wide-coverage, fast data updates, and so on [61].
Although the remote sensing image data can well present the spatial distribution characteristics of the social economy, it is still instantaneous data, that is, it can only represent the light intensity and spatial distribution in the satellite transit time. Therefore, there is still a certain timescale problem in the research model [62,63]. To reduce the impact of different scales on the analysis, the observation data corresponding to the satellite transit time is generally used for research. In this study, the mean value of the same period (6 months) is used for analysis. In addition to the time scale, the spatial scale is also an important feature of geographical phenomena. Based on tourism revenue data, the existing research on the relationship between lighting images and tourism activities is generally large-scale in spatial scale, with countries or continents as the smallest research unit. POI is point vector data, and the basic unit of a light image is a grid of about 500 m. The research based on them is mainly based on small-scale grid research, such as a city and multiple streets [64]. To ensure the correspondence of spatial scale and show the characteristics of tourism activities, in this study, based on the social development of Hunan Province, we chose to put all the research data within the scope of the smallest administrative county in Hunan Province. This also means that achieving a higher classification of night remote sensing products and combining and analyzing social spatial data of different industries, such as tourism, are the direction of future research.
It is worth mentioning that, in future research, besides considering the social entity environment (POI) studied, adding more parameter variables (such as population or GDP) may better explain the relationship with the inspected variables and investigate other additional parameters affecting luminous radiation sources The existence of other paramaters (such as albedo, spatial land cover, etc.) can also be increased to determine the ability and accuracy of noctilucent in evaluating the contribution of tourism industry activities.
In addition, future research directions should also consider how to apply the model to the theoretical research of tourism carbon emission and the planning and construction of tourism light pollution prevention and control. According to the spatial distribution of tourism, tourism economy and other results analyzed provide decision-making guidance and reference standards for relevant departments to carry out low-carbon tourism and dark night protection construction.

5. Conclusions

In this study, we investigated the seasonal changes of night satellite image brightness in 2019 and their correlation with the POI of different tourism industries of 122 counties (cities, districts) in Hunan Province. The analysis of the global regression model shows that there is a strong correlation between night light index and survey variables in different seasons. Based on one semester (6 months), there is a positive correlation between night light radiation and leisure and entertainment, shopping services and transportation services, a negative correlation between the light index and sightseeing. The positive impact of leisure and entertainment is the highest, and transportation service is the lowest. The correlation degree between winter and summer is different, so it is inferred that the result of the peak tourist season is better than the off-season. The GWR model reveals the local spatial pattern of the relationship between night light and tourism activities. In terms of model fitting, the local model (GWR) is better than the global model (OLS), since it produced better results, thus confirming that the GWR model can be used to evaluate the impact of night light based on tourism activities. The contribution of Hunan’s tourism industry to night lighting gradually decreases from east to west. In addition, the results further reflect the spatial differences of the impact of different tourism elements POI on night light in different regions, which is the result of the comprehensive effect of tourism resource distribution and social environment in Hunan Province. The research provides a new method and perspective for tourism research and especially reveals the spatial differences of tourism activities in geography, which will help us to study the spatial distribution and seasonality of tourism industry activities in the whole region. However, before assessing the contribution of tourism activities and clarifying the ability and accuracy of lighting, we should further consider additional parameters and more accurate remote sensing data products. At the same time, the spatial distribution of tourism activities and the evaluation of the contribution of night light radiation can also be combined with different data in the future to explore the energy consumption and light pollution degree caused by various tourism activities so as to provide reference and suggestions for relevant departments to formulate tourism dark night protection measures and the sustainable development of tourism.

Author Contributions

Conceptualization, J.W. and Y.Z.; methodology, J.W. and Y.Z.; software, J.W.; project administration, Y.Z.; validation, J.W., Y.Z. and J.F.; visualization, J.W. and J.F.; original draft writing, J.W.; writing review and editing, Y.Z. and J.F.; funding acquisition, Y.Z. supervision, Y.Z. and J.F. All authors have read and agreed to the published version of the manuscript.

Funding

This research was funded by the science and technology innovation Program of Hunan Province: Research and application of expressway landscape and regional culture integration technology based on Huxiang Culture, grant number 2021SK2050. This research was funded by the Postgraduate Scientific Research Innovation Project of Hunan Province: Research on the relationship between dark night temporal and spatial change and tourism economy in Zhangjiajie based on DMSP-OLS and NPP-VIIRS data, grant number CX20200743.

Institutional Review Board Statement

Not applicable.

Informed Consent Statement

Not applicable.

Data Availability Statement

Please contact the authors via email for the data.

Conflicts of Interest

The authors declare no conflict of interest.

References

  1. World Tourism Organization. International Tourism Highlights, 2019th ed.; UNWTO: Madrid, Spain, 2019; p. 2. [Google Scholar] [CrossRef]
  2. Feng, X.; Xia, J. Evaluation of China’s global tourism development level and its spatial characteristics. Econ. Geogr. 2018, 38, 183–192. (In Chinese) [Google Scholar] [CrossRef]
  3. Li, X.; Zhang, L.; Cui, L. Global Tourism: Conceptual Innovation for Building a World-Class Tourist Destination: Taking Beijing as an Example. Human Geogr. 2013, 28, 130–134. (In Chinese) [Google Scholar] [CrossRef]
  4. Guiding Opinions of the General Office of the State Council on Promoting the Development of Tourism in the Whole Region. Available online: http://www.gov.cn/zhengce/content/2018-03/22/content_5276447.htm (accessed on 19 November 2021). (In Chinese)
  5. Notice of the General Office of Hunan Provincial People’s Government on Printing and Distributing the Three-Year Action Plan for Building a Global Tourism Base in Hunan Province (2018–2020). Available online: http://www.hunan.gov.cn/xxgk/wjk/szfbgt/201807/t201807135051854.html. (accessed on 19 November 2021). (In Chinese)
  6. Notice on Printing and Distributing the Action Plan for Promoting the High-Quality Development of Tourism in Hunan Province During the 14th Five Year Plan Period. Available online: http://whhlyt.hunan.gov.cn//whhlyt/xxgk2019/xxgkml/tzgg/202109/t20210902_20456638.html (accessed on 19 November 2021). (In Chinese)
  7. Niccolò, C.; Fernanda, S. Tourism and its economic impact: A literature review using bibliometric tools. Tour. Econ. 2019, 25, 109–131. [Google Scholar] [CrossRef]
  8. Kai, K.; Fuchs, M. Aligning tourism’s socio-economic impact with the United Nations’ sustainable development goals. Tour. Manag. Perspect. 2021, 39, 100831. [Google Scholar] [CrossRef]
  9. Krikigianni; Tsiakos; Chalkias. Estimating the relationship between touristic activities and night light emissions. Eur. J. Remote Sens. 2019, 52 (Supp. S1), 233–246. [Google Scholar] [CrossRef] [Green Version]
  10. Tan, Z.; Guan, Q.; Lin, J.; Yang, L.; Luo, H.; Ma, Y.; Tian, J.; Wang, Q.; Wang, N. Measuring urban compactness based on functional characterization and human activity intensity by integrating multiple geospatial data sources. Ecol. Indic. 2021, 121, 107177. [Google Scholar] [CrossRef]
  11. Zhong, Y.; Su, Y.; Wu, S.; Zheng, Z.; Zhao, J.; Ma, A.; Zhu, Q.; Ye, R.; Li, X.; Pellikka, P.; et al. Open-source data-driven urban land-use mapping integrating point-line-polygon semantic objects: A case study of Chinese cities. Remote Sens. Environ. 2020, 247, 111838. [Google Scholar] [CrossRef]
  12. Yan, S.; Knaap, G.J. Measuring the effects of mixed land uses on housing values. Reg. Sci. Urban Econ. 2004, 34, 663–680. [Google Scholar] [CrossRef]
  13. Santos, F.; Almeida, A.; Martins, C.; Gonçalves, R.; Martins, J. Using POI functionality and accessibility levels for delivering personalized tourism recommendations. Comput. Environ. Urban 2019, 77, 101173. [Google Scholar] [CrossRef]
  14. Lin, L.; Lei, Y. Validity method of public participation point of interest data. Sci. Surv. Mapp. 2015, 40, 98–103. (In Chinese) [Google Scholar] [CrossRef]
  15. Henderson, M.; Yeh, E.; Gong, P.; Elvidge, C.; Baugh, K. Validation of urban boundaries derived from global night-time satellite imagery. Int. J. Remote Sens. 2003, 24, 595–609. [Google Scholar] [CrossRef]
  16. Chen, Z.; Yu, B.; Ta, N.; Shi, K.; Yang, C.; Wang, C.; Zhao, X.; Deng, S.; Wu, J. Delineating Seasonal Relationships Between Suomi NPP-VIIRS Nighttime Light and Human Activity Across Shanghai, China. IEEE J. Stars 2019, 12, 1–9. [Google Scholar] [CrossRef]
  17. Xia, C.; Yeh, G.O.; Zhang, A. Analyzing spatial relationships between urban land use intensity and urban vitality at street block level: A case study of five Chinese megacities. Landsc. Urban Plan 2020, 193, 103669. [Google Scholar] [CrossRef]
  18. Elvidge, C.D.; Baugh, K.E.; Anderson, S.; Sutton, P.; Ghosh, T. The Night Light Development Index (NLDI): A spatially explicit measure of human development from satellite data. Soc. Geogr. Discuss. 2012, 7, 23–35. [Google Scholar] [CrossRef]
  19. Yue, W.; Gao, J.; Yang, X. Estimation of Gross Domestic Product Using Multi-Sensor Remote Sensing Data: A Case Study in Zhejiang Province, East China. Remote Sens. 2014, 6, 7260–7275. [Google Scholar] [CrossRef] [Green Version]
  20. Shi, K.; Huang, C.; Yu, B.; Yin, B.; Huang, Y.; Wu, J. Evaluation of NPP-VIIRS night-time light composite data for extracting built-up urban areas. Remote Sens. Lett. 2014, 5, 358–366. [Google Scholar] [CrossRef]
  21. Lu, D.; Wang, Y.; Yang, Q.; Su, K.; Zhang, H.; Li, Y. Modeling Spatiotemporal Population Changes by Integrating DMSP-OLS and NPP-VIIRS Nighttime Light Data in Chongqing, China. Remote Sens. 2021, 13, 284. [Google Scholar] [CrossRef]
  22. Chalkias, C.; Petrakis, M.; Psiloglou, B.; Lianou, M. Modelling of light pollution in suburban areas using remotely sensed imagery and GIS. J. Environ. Manag. 2006, 79, 57–63. [Google Scholar] [CrossRef] [PubMed]
  23. Falchi, F.; Cinzano, P.; Duriscoe, D.; Kyba, C.C.M.; Elvidge, C.D.; Baugh, K.; Portnov, B.A.; Rybnikova, N.A.; Furgoni, R. The new world atlas of artificial night sky brightness. Sci. Adv. 2016, 2, e1600377. [Google Scholar] [CrossRef] [Green Version]
  24. Small, C.; Pozzi, F.; Elvidge, C.D. Spatial analysis of global urban extent from DMSP-OLS night lights. Remote Sens. Environ. 2005, 96, 277–291. [Google Scholar] [CrossRef]
  25. Elvidge, C.D.; Zhizhin, M.; Baugh, K.; Hsu, F.-C.; Ghosh, T. Methods for Global Survey of Natural Gas Flaring from Visible Infrared Imaging Radiometer Suite Data. Energies 2015, 9, 14. [Google Scholar] [CrossRef]
  26. Elvidge, C.D.; Baugh, K.; Zhizhin, M.; Hsu, F.C.; Ghosh, T. VIIRS night-time lights. Int. J. Remote Sens. 2017, 38, 5860–5879. [Google Scholar] [CrossRef]
  27. Steven, M.; William, S.; Stephen, M.; Miller, S.D.; Straka, W.; Mills, S.P.; Elvidge, C.D.; Lee, T.F.; Solbrig, J.; Walther, A.; et al. Illuminating the Capabilities of the Suomi National Polar-Orbiting Partnership (NPP) Visible Infrared Imaging Radiometer Suite (VIIRS) Day/Night Band. Remote Sens. 2013, 5, 6717–6766. [Google Scholar] [CrossRef] [Green Version]
  28. Khalik, W.; Zhu, Y.; He, C. Viewing the development of China’s tourism economy and its spatial spillover effects from night lights: An empirical study based on the spatial panel measurement model. Ecol. Econ. 2018, 34, 126–131. (In Chinese) [Google Scholar]
  29. Nie, Y.; Lan, T.; Yu, M. Scenic Sites Selection in Dark-Sky Park Based on NPP/VIIRS: A Case Study in Fujian Province. Procedia Comput. Sci. 2019, 154, 798–805. [Google Scholar] [CrossRef]
  30. Li, M.; Cai, W. NPP/VIIRS multi-temporal luminous remote sensing image correction method. Bull. Surv. Mapp. 2019, 7, 122–126. (In Chinese) [Google Scholar] [CrossRef]
  31. Hu, W.; Liu, C.; Zhan, Q. Synthesis method and comparative verification of annual night light data of NPP-VIIRS in China. J. Guilin Univ. Technol. 2021, 41, 141–148. (In Chinese) [Google Scholar]
  32. Ma, T.; Zhou, C.; Pei, T.; Haynie, S.; Fan, J. Responses of Suomi- NPP VIIRS- derived nighttime lights to socioeconomic activity in China’s cities. Remote Sens. Lett. 2014, 5, 165–174. [Google Scholar] [CrossRef]
  33. Zhou, Y.; Chen, Y.; Liu, Y.; Tian, F.; Yi, X. The synthesis method and verification of NPP-VIIRS annual night light data. Remote Sens. Inform. 2019, 34, 62–68. (In Chinese) [Google Scholar]
  34. Stone, M.; Brooks, R.J. Continuum Regression: Cross-Validated Sequentially Constructed Prediction Embracing. J. R. Stat. Soc. B 1990, 52, 237–269. [Google Scholar] [CrossRef]
  35. Brunsdon, C.; Fotheringham, A.S.; Charlton, M.E. Geographically weighted regression: A method for exploring spatial nonstationarity. Geogr. Anal. 1996, 28, 281–298. [Google Scholar] [CrossRef]
  36. Griffith, D.A. Spatial-filtering-based contributions to a critique of geographically weighted regression (GWR). Environ. Plann. A 2008, 40, 2751–2769. [Google Scholar] [CrossRef]
  37. Fotheringham, A.S.; Oshan, T.M. Geographically weighted regression and multicollinearity: Dispelling the myth. J. Geogr. Syst. 2016, 18, 303–329. [Google Scholar] [CrossRef]
  38. Cho, S.H.; Lambert, D.M.; Chen, Z. Geographically weighted regression bandwidth selection and spatial autocorrelation: An empirical example using Chinese agriculture data. Appl. Econ. Lett. 2010, 17, 767–772. [Google Scholar] [CrossRef]
  39. Liu, Z. Akaike information criterion AIC and its significance. J. Math. Prac. Theory 1980, 64–72. (In Chinese) [Google Scholar]
  40. Fotheringham, A.S.; Brunsdon, C. Local Forms of Spatial Analysis. Geogr. Anal. 2010, 31, 340–358. [Google Scholar] [CrossRef]
  41. Feng, Y.; Tong, X. Incorporation of spatial heterogeneity-weighted neighborhood into cellular automata for dynamic urban growth simulation. Gisci. Remote Sens. 2019, 56, 1024–1045. [Google Scholar] [CrossRef]
  42. Moreno, N.; Fang, W.; Marceau, D.J. Implementation of a dynamic neighborhood in a land-use vector-based cellular automata model. Comput. Environ. Urban. 2009, 33, 44–54. [Google Scholar] [CrossRef]
  43. Feng, Y.; Tong, X. Dynamic land use change simulation using cellular automata with spatially nonstationary transition rules. Gisci. Remote Sens. 2018, 55, 678–698. [Google Scholar] [CrossRef]
  44. Huang, B.; Wu, B.; Barry, M. Geographically and temporally weighted regression for modeling spatio-temporal variation in house prices. Int. J. Geogr. Inf. Sci. 2010, 24, 383–401. [Google Scholar] [CrossRef]
  45. Su, S.; Li, D.; Hu, Y.; Xiao, R.; Zhang, Y. Spatially non-stationary response of ecosystem service value changes to urbanization in Shanghai, China. Ecol. Indic. 2014, 45, 332–339. [Google Scholar] [CrossRef]
  46. Lin, Y. Research on the host-guest relationship in ethnic tourism from the perspective of social interaction: Taking Nangang Yaozhai as an example. J. Chengdu. Univ. Technol. 2019, 22, 63–67. (In Chinese) [Google Scholar] [CrossRef]
  47. Dong, K.; Zhang, W. Choice of travel modes for tourists in mountainous scenic spots. Trans. Technol. Econ. 2011, 13, 1–4. (In Chinese) [Google Scholar] [CrossRef]
  48. Shao, C.; Guo, J.; Lv, K.; Li, X. Research on weekend passenger traffic characteristics of cultural and tourism scenic spots. J. Wuhan Univ. Technol. 2020, 42, 91–96. (In Chinese) [Google Scholar]
  49. Yang, W.; Wang, W. Research on the Integrated Development of Transportation and Tourism Industry in Kunshan City. Trans. Enter. Manag. 2019, 34, 10–13. (In Chinese) [Google Scholar]
  50. Lin, C.H. Transactional versus relational patronizing intentions. Ann. Tour. Res. 2009, 36, 726–730. [Google Scholar] [CrossRef]
  51. Chu, E.; Liu, A.; Wang, R.; Cheng, W. Rethinking Tourism Seasonality under the Background of Global Tourism. J. Cap. Norm. Univ. Nat. Sci. Ed. 2021, 42, 84–90. (In Chinese) [Google Scholar] [CrossRef]
  52. Tom, B.; Laura, H. Responses to seasonality: The experiences of peripheral destinations. Int. J. Tour. Res. 1999, 1, 299–312. [Google Scholar] [CrossRef]
  53. Liu, J.; Zhao, J.; Zhang, G. A spatial econometric analysis of the relationship between China’s tourism industry agglomeration and tourism economic growth. Econ. Geogr. 2013, 33, 186–192. (In Chinese) [Google Scholar]
  54. Hu, W.; Chen, P. An Empirical Analysis of the Competitiveness of Urban Tourism in Hunan Province Based on Factor Analysis. Mark. Forum 2018, 9, 16–23. (In Chinese) [Google Scholar]
  55. Cheng, P.; Han, J.; Wu, J.; Guo, M. Spatial and temporal evolution analysis of urban leisure tourism based on multi-source data——Taking Nanchang as an example. J. Guilin Univ. Technol. 2021, 41, 362–369. (In Chinese) [Google Scholar]
  56. Wu, Z.; Wu, C. Study on tourism resources and their development and utilization in Hunan. J. Cent. South Univ. For. Sci. Technol. 2003, 23, 1–5. (In Chinese) [Google Scholar] [CrossRef]
  57. Zhong, L.; Yang, R.; Zhao, Z. Half of the National Park is Dark Night: The American Experience and Chinese Path of Dark Night Starry Sky Research. Landsc. Archit. 2019, 26, 85–90. (In Chinese) [Google Scholar] [CrossRef]
  58. Yue, C.; Ying, L.; Rui, Y. Research on the Identification and Spatial Distribution of Wilderness at the Land Scale of Mainland China. Chin. Gard. 2017, 33, 26–33. [Google Scholar]
  59. Krause, C.; Zhang, L. Short-term travel behavior prediction with GPS, land use, and point of interest data. Transpot. Resb. Meth. 2019, 123, 349–361. [Google Scholar] [CrossRef]
  60. Wei, Z.Y.; Su, H.M.; Huang, R.J. Analysis of Xi’an Commercial agglomeration characteristics based on POI data. J. Southwest Univ. Nat. Sci. 2020, 42, 97–104. (In Chinese) [Google Scholar] [CrossRef]
  61. Yang, Y.; Li, Y.J.; Huang, Q.X. Spatial temporal dynamic comparison of urban land use and population size distribution in China: A case study of Bohai Rim region. Geogr. Res. 2016, 35, 1672–1686. (In Chinese) [Google Scholar] [CrossRef]
  62. Wang, Y.; Hu, D.; Yu, C.; Di, Y.; Wang, S.; Liu, M. Appraising regional anthropogenic heat flux using high spatial resolution NTL and POI data: A case study in the Beijing-Tianjin-Hebei region, China. Environ. Pollut. 2022, 292, 118359. [Google Scholar] [CrossRef] [PubMed]
  63. Zheng, Q.; Weng, Q.; Wang, K. Developing a new cross-sensor calibration model for DMSP-OLS and Suomi- NPP VIIRS night-light imageries. ISPRS J. Photogramm. 2019, 153, 36–47. [Google Scholar] [CrossRef]
  64. Wang, J.J.; Ye, Y.Q.; Fang, F. Research on urban functional zoning based on kernel density and fusion data. Geogr. Geo-Inf. Sci. 2019, 35, 66–71. (In Chinese) [Google Scholar]
Figure 1. Map of county-level administrative divisions of Hunan Province.
Sustainability 14 00692 g001
Figure 2. Map of composite night light images in summer (a) and winter (b) of 2019.
Sustainability 14 00692 g002
Figure 3. Scatter diagrams of explanatory variable and NTL.
Sustainability 14 00692 g003
Figure 4. Spatial autocorrelation test results of TL (a) and Residual (b) of the GWR model.
Sustainability 14 00692 g004
Figure 5. Local R2 of GWR in summer (a) and winter (b).
Sustainability 14 00692 g005
Figure 6. Distribution of local coefficient variation of the GWR Model (summer).
Sustainability 14 00692 g006
Figure 7. Distribution of local coefficient variation of the GWR Model (winter).
Sustainability 14 00692 g007aSustainability 14 00692 g007b
Table 1. POI classification of tourism elements based on Baidu map.
Category Quantity Baidu POI Subcategory
1Catering
service
39,421 Chinese restaurants, foreign restaurants, snack bars, cake dessert shops, coffee shops, teahouses, bars, other food shops
2Accommodation service31,137 Star hotels, express hotels, apartment hotels, home stay hotels, other hotels
3Transportation service877Airports, train stations, coach stations
4Sightseeing
service
13,126 Sightseeing parks, zoos, botanical gardens, amusement parks, museums, aquariums, cultural relics, churches, scenic spots, temples
5Shopping
service
52,964 Shopping centers, department stores, supermarkets, convenience stores, small shops, markets, digital stores
6leisure and
Entertainment
35,873 Stadiums and gymnasiums, extreme sports venues, fitness centers, resorts, farmhouses, cinemas, KTV, theatres, song and dance halls, Internet cafes, game venues, leisure squares, bath massage shops, nursing homes, public toilets, special roads and post stations for cycling, ticket offices, some leisure parks, travel agencies, art galleries, exhibition halls, cultural palaces, libraries, science and technology museums, other leisure places
Table 2. Results of the KS test.
VariablenKolmogorov
Smirnov Z
Sig. (Bilateral)
NLIS1220.7800.577
NLIW1220.7100.695
Table 3. Results of the OLS model.
ModelR2R2 AdjustedJoint F TestSigKoenker (BP)Jarque-BeraDurbin Watson
OLS summer0.7630.75594.3410.00010.5751.3411.948
OLS winter0.7590.75192.0670.00018.2482.6161.942
Table 4. Results of the OLS model coefficients.
ModelVariableCoefficientSig.VIF
OLS summerconstant3.2970.000
X10.5070.0001.894
X2−0.4900.0002.133
X31.3000.0002.246
X40.1960.0011.435
OLS winterconstant3.2370.000
X10.5660.0001.894
X2−0.4940.0002.133
X30.2330.0002.246
X40.1990.0011.435
The prediction variables are shopping service (X1), sightseeing(X2), leisure and entertainment (X3), and transportation service (X4).
Table 5. Comparison of OLS and GWR.
ModelAICcR2R2 Adjusted
OLS summer−139.1850.7630.755
GWR summer−306.8420.8460.815
OLS winter−142.8160.7590.751
GWR winter−308.9150.8370.805
Publisher’s Note: MDPI stays neutral with regard to jurisdictional claims in published maps and institutional affiliations.

