
Identification of Factors Affecting Road Traffic Injuries Incidence and Severity in Southern Thailand Based on Accident Investigation Reports


Abstract
:1. Introduction
2. Literature Reviews
2.1. Human Error Related to Road Traffic Accidents and Road Traffic Injuries
2.2. Vehicle Risks Related to Road Traffic Accidents and Road Traffic Injuries
2.3. Environment Risks Related to Road Traffic Accidents and Road Traffic Injuries
3. Materials and Methods
3.1. Study Design
3.2. Data Extraction and Filtering Criteria
- Event characteristics: vehicle-related crash and/or other parties involved in incident (such as pedestrians), involvement of roadside object hazards, collision types, and type of vehicle;
- Road user information: sex, age-groups, road user type (driver, passenger, pedestrian), characteristics of those injured (driver, passenger, pedestrian), number of victims, number of injured, and number of deaths;
- Injury details: region of body injured consisted of head and neck, face, chest, abdomen and pelvis, extremities and pelvic girdle, and external and skin injuries [39];
- Prehospital trauma care: type of assistance provided and mode of delivery to hospitals as reported by eyewitnesses, police officers, or rescue terms (First response unit: FR., Basic life support unit: BLS, Advanced life support unit: ALS);
3.3. Data Analysis
4. Results
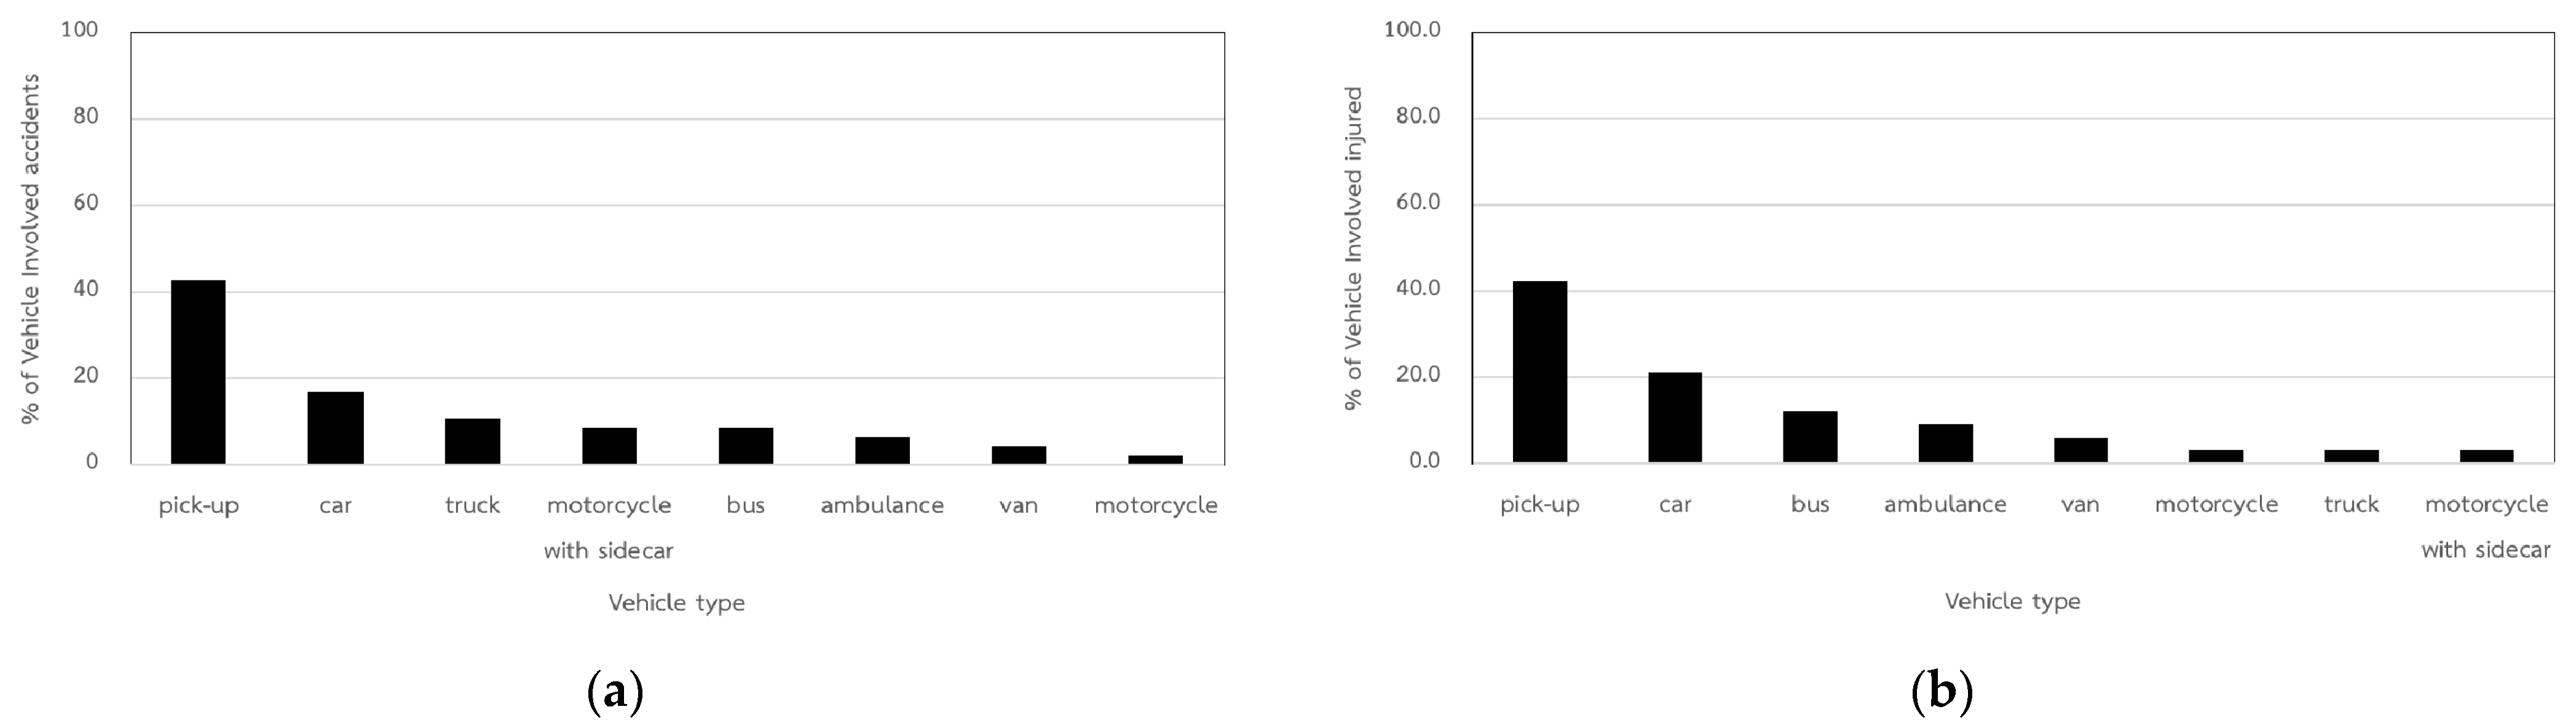
4.1. Overview of Event Characteristics
4.2. Demographic Data of Road Users
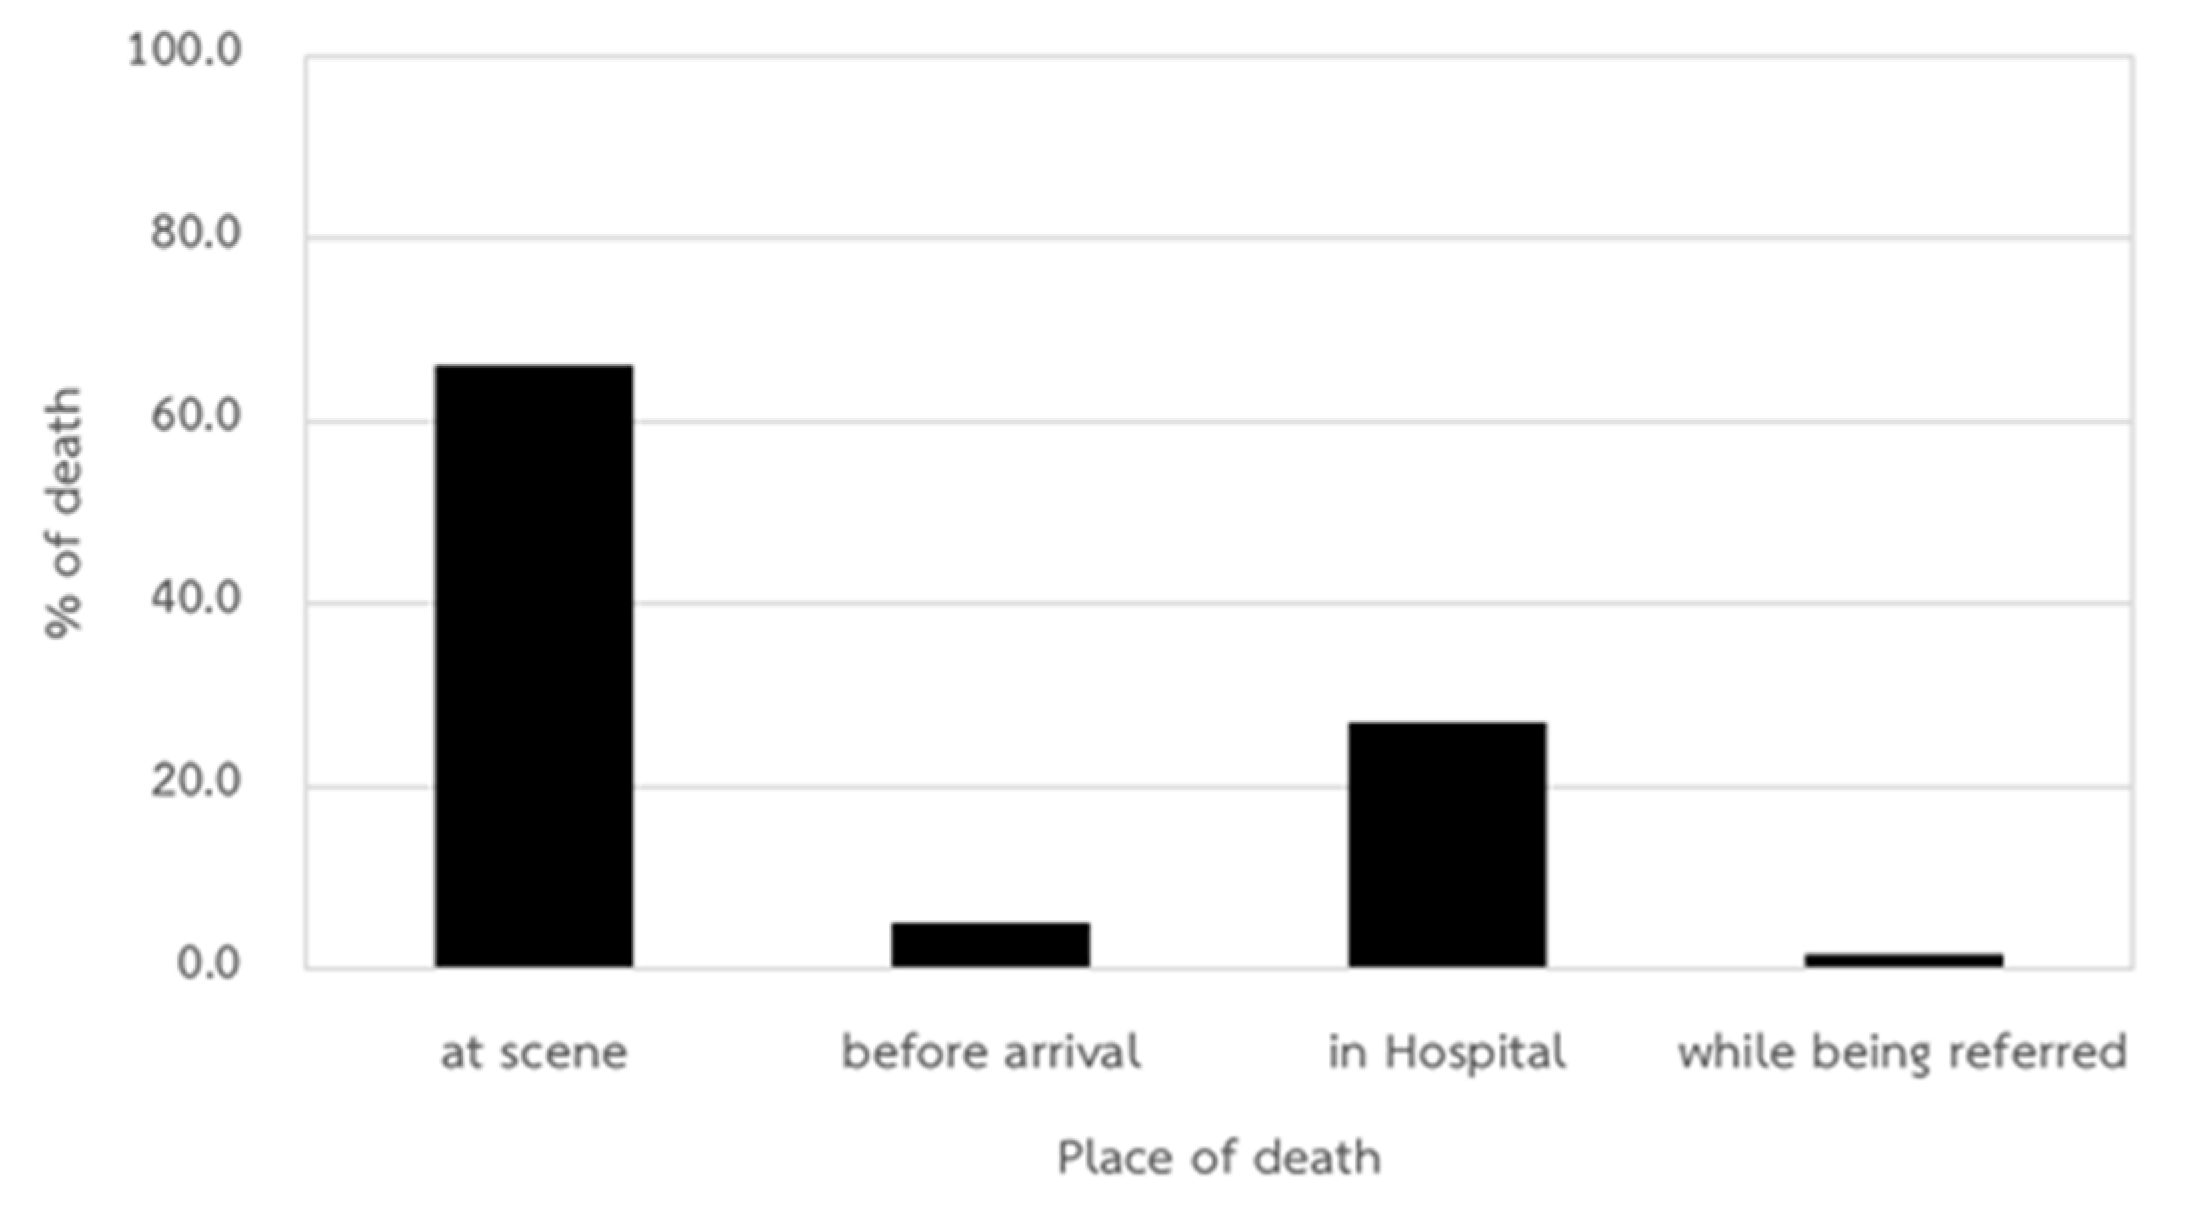
Place of Deaths
4.3. Prehospital Care System
4.4. Prehospital Care System
5. Discussion
Author Contributions
Funding
Institutional Review Board Statement
Informed Consent Statement
Data Availability Statement
Acknowledgments
Conflicts of Interest
References
- World Health Organization. Global Status Report on Road Safety 2015; World Health Organization: Geneva, Switzerland, 2015; Available online: https://www.afro.who.int/sites/default/files/2017-06/9789241565066_eng.pdf (accessed on 19 June 2021).
- World Health Organization. Global Status Report on Road Safety 2018; World Health Organization: Geneva, Switzerland, 2018; Available online: https://www.who.int/publications/i/item/9789241565684 (accessed on 19 June 2021).
- World Health Organization. Road Safety in the South-East Asia Region 2015; World Health Organization: New Delhi, India, 2016; Available online: https://apps.who.int/iris/handle/10665/249151 (accessed on 19 June 2021).
- Suphanchaimat, R.; Sornsrivichai, V.; Limwattananon, S.; Thammawijaya, P. Economic development and road traffic injuries and fatalities in Thailand: An application of spatial panel data analysis, 2012–2016. BMC Public Health 2019, 1449, 1–15. [Google Scholar] [CrossRef]
- Digital Government Development Agency (Public Organization) (DGA). Road Accident Death Information [Internet]; Department of Disease Control, Ministry of Public Health (MOPH): Nonthaburi, Thailand, C2020 Thai; Available online: https://data.go.th/dataset/rtddi (accessed on 19 June 2021).
- Bureau of Epidemiology, Department of Disease Control, Ministry of Public Health. Severe injury due to transport accident. In BOE. Annual Epidemiological Surveillance Report 2018; European Centre for Disease Prevention and Control: Bangkok, Thailand, 2018; Available online: https://apps-doe.moph.go.th/boeeng/download/AW_Annual_Mix%206212_14_r1.pdf (accessed on 19 June 2021).
- Vallibhakara, S.A.; Plitponkarnpim, A.; Suriyawongpaisal, P.; Thakkinstian, A. The Nationwide Surveillance of Seat Belt Usage and Encouraging Factors of Increasing the Seat Belt Rate in Thailand: A Road Safety Survey. J. Med. Assoc. Thail. 2018, 101, 809–819. [Google Scholar]
- Suriyawongpaisa, P.; Thakkinstian, A.; Rangpueng, A.; Jiwattanakulpaisarn, P.; Techakamolsuk, P. Disparity in motorcycle helmet use in Thailand. Int. J. Equity Health 2013, 12, 1–6. Available online: https://equityhealthj.biomedcentral.com/track/pdf/10.1186/1475-9276-12-74.pdf (accessed on 19 June 2021). [CrossRef] [Green Version]
- Zhang, Y.; Lu, H.; Qu, W. Geographical detection of traffic accidents spatial stratified heterogeneity and influence factors. Int. J. Environ. Res. Public Health 2020, 17, 572. Available online: https://www.mdpi.com/1660-4601/17/2/572 (accessed on 1 November 2021). [CrossRef] [PubMed] [Green Version]
- Zou, Y.; Zhang, Y.; Cheng, K. Exploring the impact of climate and extreme weather on fatal traffic accidents. Sustainability 2021, 13, 390. Available online: https://www.mdpi.com/2071-1050/13/1/390 (accessed on 23 October 2021). [CrossRef]
- Ulak, M.B.; Ozguven, E.E.; Vanli, O.A.; Dulebenets, M.A. Multivariate random parameter Tobit modeling of crashes involving aging drivers, passengers, bicyclists, and pedestrians: Spatiotemporal variations. Accid. Anal. Prev. 2018, 121, 1–13. Available online: https://www.sciencedirect.com/science/article/pii/S0001457518305566?casa_token=yAOa-9f9-X0AAAAA:kcwt2AP19LwNisslO7Wrd0CcZmXPh60i6_fc2NVqLexwgzArkqaqLOoG1MLc5aAQoafC0crMu9iB (accessed on 1 November 2021). [CrossRef] [PubMed]
- Pasha, J.; Dulebenets, M.A.; Singh, P.; Moses, R.; Sobanjo, J.; Ozguven, E.E. Towards improving sustainability of rail transport by reducing traffic delays at level crossings: A case study for the State of Florida. Clean. Logist. Supply Chain. 2021, 1, 100001. Available online: https://www.sciencedirect.com/science/article/pii/S2772390921000019 (accessed on 1 November 2021). [CrossRef]
- Lin, Y.; Li, R. Real-time traffic accidents post-impact prediction: Based on crowdsourcing data. Accid. Anal. Prev. 2020, 145, 105696. [Google Scholar] [CrossRef]
- Haddon, W. The changing approach to the epidemiology, prevention, and amelioration of trauma: The transition to approaches etiologically rather than descriptively based. Inj. Prev. 1999, 5, 231–235. Available online: https://www.ncbi.nlm.nih.gov/pmc/articles/PMC1730511/pdf/v005p00231.pdf (accessed on 19 June 2021). [CrossRef]
- Mohan, D.; Khayesi, M.; Tiwari, G.; Nafukho, F.M. Road Traffic Injury Prevention Training Manual; World Health Organization: Geneva, Switzerland, 2006; Available online: https://apps.who.int/iris/bitstream/handle/10665/43271/9241546751_eng.pdf (accessed on 19 June 2021).
- Williams, A.F. The Haddon matrix: Its contribution to injury prevention and control. In Proceedings of the 3rd National Conference on Injury Pre-Vention and Control, Brisbane, Queensland, Australia, 9–12 May 1999; Volume 10081, pp. 15–16. Available online: https://eprints.qut.edu.au/10081/1/10081.pdf (accessed on 19 June 2021).
- Road Safety Facts.EU. Available online: https://roadsafetyfacts.eu/what-role-do-road-users-and-infrastructure-play-in-improving-safety/ (accessed on 25 October 2021).
- Somchainuck, O.; Taneerananon, P.; Jaritngam, S. An in-depth investigation of roadside crashes on Thai National Highways. Eng. J. 2013, 17, 63–74. Available online: https://www.engj.org/index.php/ej/article/view/336 (accessed on 26 October 2020). [CrossRef] [Green Version]
- Copsey, N.; Drupsteen, L.; Kampen, J.V.; Kuijt-Evers, L.; Schmitz-Felten, E.; Verjans, M. A Review of Accidents and Injuries to Road Transport Drivers; Publications Office of the European Union: Luxembourg, 2010; pp. 5–16. Available online: https://op.europa.eu/en/publication-detail/-/publication/5b80ae34-5acc-425d-a9d5-48c3e34c2ad6/language-en (accessed on 26 October 2020).
- Treat, J.R.; Tumbas, N.S.; McDonald, S.T.; Shinar, D.; Hume, R.D.; Mayer, R.E.; Stansifer, R.L.; Castellan, N.J. Tri-Level Study of the Causes of Traffic Accidents: Final Report; Executive Summary; Indiana University, Bloomington, Institute for Research in Public Safety: Bloomington, Indiana, 1979; pp. 155–214. Available online: https://deepblue.lib.umich.edu/handle/2027.42/64993 (accessed on 11 November 2021).
- Connor, J.; Norton, R.; Ameratunga, S.; Robinson, E.; Civil, I.; Dunn, R.; Bailey, J.; Jackson, R. Driver sleepiness and risk of serious injury to car occupants: Population based case control study. BMJ 2002, 324, 1–5. Available online: https://www.bmj.com/content/324/7346/1125.1.short (accessed on 26 October 2020). [CrossRef] [PubMed] [Green Version]
- Nabi, H.; Guéguen, A.; Chiron, M.; Lafont, S.; Zins, M.; Lagarde, E. Awareness of driving while sleepy and road traffic accidents: Prospective study in GAZEL cohort. BMJ 2006, 333, 1–5. Available online: https://www.bmj.com/content/333/7558/75.short (accessed on 26 October 2020). [CrossRef] [PubMed] [Green Version]
- German, J.W.; Klugh, A.; Stephen, L.S. Cargo areas of pickup trucks: An avoidable mechanism for neurological injuries in children. J. Neurosurg. Pediatrics 2007, 106, 368–371. [Google Scholar] [CrossRef] [PubMed]
- Agran, P.; Winn, D.; Anderson, C. Injuries to occupants in cargo areas of pickup trucks. West. J. Med. 1994, 161, 479–482. Available online: https://www.ncbi.nlm.nih.gov/pmc/articles/PMC1022675/ (accessed on 19 June 2021).
- Anderson, C.L.; Agran, P.F.; Winn, D.G.; Greenland, S. Fatalities to occupants of cargo areas of pickup trucks. Accid. Anal. Prev. 2000, 32, 533–540. Available online: https://www.sciencedirect.com/science/article/abs/pii/S0001457599000755 (accessed on 19 June 2021). [CrossRef]
- Howlett, J.B.; Colleen, A.; Damian, L.C. Injuries sustained by passengers travelling in the cargo area of light delivery vehicles. S. Afr. J. Surg. 2014, 52, 49–52. Available online: http://www.scielo.org.za/scielo.php?script=sci_arttext&pid=S0038-23612014000200005 (accessed on 26 October 2021). [CrossRef]
- Winston, F.K.; Kallan, M.J.; Elliott, M.R.; Menon, R.A.; Durbin, D.R. Risk of injury to child passengers in compact extend-ed-cab pickup trucks. JAMA 2002, 287, 1147–1152. Available online: https://jamanetwork.com/journals/jama/fullarticle/194701 (accessed on 26 October 2021). [CrossRef] [Green Version]
- Bachani, A.M.; Peden, M.; Gururaj, G.; Norton, R.; Hyder, A.A. Road traffic injuries. In Injury Prevention and Environmental Health, 3rd ed.; Charles, N.M., Rachel, N., Olive, K., Kirk, R.S., Eds.; The World Bank: Washington, DC, USA, 2017; Volume 3, pp. 35–54. [Google Scholar]
- Chandrasekharan, A.; Nanavati, A.J.; Prabhakar, S.; Prabhakar, S. Factors impacting mortality in the pre-hospital period after road traffic accidents in urban India. Trauma Mon. 2016, 21, e22456. Available online: https://www.ncbi.nlm.nih.gov/pmc/articles/PMC5124107/ (accessed on 2 November 2021). [CrossRef] [Green Version]
- Moodley, S.; Allopi, D.R. An analytical study of vehicle defects and their contribution to road accidents. In Proceedings of the 27th Southern African Transport Conference (SATC 2008), Pretoria, South African, 7–11 July 2008; Available online: https://repository.up.ac.za/bitstream/handle/2263/6384/Moodley.pdf (accessed on 26 October 2021).
- Boontob, N.; Ponboon, S.; Aniwattakulchai, P.; Anurakamolkul, C.; Kanitpong, K. In-Depth Accident Aanalysis due to Road-side Hazard: Thailand Case Study. In Proceedings of the Eastern Asia Society for Transportation Studies Volume 7 (The 8th International Conference of Eastern Asia Society for Transportation Studies), Surabaya, Indonesia, 16–19 November 2009; p. 414. Available online: https://www.jstage.jst.go.jp/article/eastpro/2009/0/2009_0_414/_pdf/-char/ja (accessed on 19 June 2021).
- Lerspalungsanti, S.; Pitaksapsin, N.; Viriyarattanasak, P.; Srisurangkul, C.; Olarnrithinun, S. Study on the strength of con-verted school pick-up truck’s roof in case of rollover accidents. Proc. Inst. Mech. Eng. Part D J. Automob. Eng. 2020, 234, 2228–2238. [Google Scholar] [CrossRef]
- Zhang, G.; Yau, K.K.; Chen, G. Risk factors associated with traffic violations and accident severity in China. Accid. Anal. Prev. 2013, 59, 18–25. Available online: https://www.sciencedirect.com/science/article/pii/S0001457513001942?casa_token=Tw-LLno5XmYAAAAA:lXQjqWM2dubOFpDlkIgEOQyJovKaTj6wzgHI3tkURfkuZHIeZQgKyRizh3WxAs24PVN7wO8inQ (accessed on 26 October 2020). [CrossRef]
- Koushki, P.; Al-Kandari, F. Road safety: Prioritization of roadside hazard improvement. Kuwait J. Sci. Eng. 2006, 33, 147–163. Available online: http://pubcouncil.kuniv.edu.kw/jer/files/08Nov2012121757Road%20safety;%20Prioritization%20of%20roadside%20hazard%20improvement.pdf (accessed on 19 June 2021).
- Solah, M.S.; Ariffin, A.H.; Isa, M.H.; Wong, S.V. In-depth crash investigation on bus accidents in Malaysia. J. Soc. Transp. Traffic Stud. 2013, 3, 22–31. Available online: https://www.researchgate.net/profile/Mohd-Syazwan-Solah/publication/284173645_IN-DEPTH_CRASH_INVESTIGATION_ON_BUS_ACCIDENTS_IN_MALAYSIA/links/564dd89308aeafc2aab02bce/IN-DEPTH-CRASH-INVESTIGATION-ON-BUS-ACCIDENTS-IN-MALAYSIA.pdf (accessed on 19 June 2021).
- Sangkharat, K.; Thornes, J.E.; Wachiraadilok, P.; Pope, F.D. Determination of the impact of rainfall on road accidents in Thailand. Heliyon 2021, 7, e06061. Available online: https://www.sciencedirect.com/science/article/pii/S2405844021001663 (accessed on 23 October 2021). [CrossRef] [PubMed]
- Waiyanate, N. Road Traffic Injury Investigation; Bureau of Epidemiology, Department of Disease Control, Ministry of Public Health: Nonthaburi, Thailand, 2006. (In Thai) [Google Scholar]
- Klinjun, N.; Chinwong, D.; Sleigh, A. Epidemiology of Multiple Casualty Incidents from Road Accidents in Thailand, 2006–2011. OSIR J. 2017, 10, 1–8. Available online: http://osirjournal.net/index.php/osir/article/view/109 (accessed on 19 June 2021).
- Ministry of Public Health, Epidemiology division. Condense Chart (AIS 85); MOPH: Bangkok, Thailand, 1995. (In Thai) [Google Scholar]
- Barnett, D.J.; Balicer, R.D.; Blodgett, D.; Fews, A.L.; Parker, C.L.; Links, J.M. The application of the Haddon matrix to public health readiness and response planning. Environ. Health Perspect. 2005, 113, 561–566. Available online: https://www.ncbi.nlm.nih.gov/pmc/articles/PMC1257548/pdf/ehp0113-000561.pdf (accessed on 19 June 2021). [CrossRef] [Green Version]
- Runyan, C.W. Introduction: Back to the future—Revisiting Haddon’s conceptualization of injury epidemiology and prevention. Epidemiol. Rev. 2003, 25, 60–64. Available online: https://academic.oup.com/epirev/article/25/1/60/718691?login=true (accessed on 19 June 2021). [CrossRef] [Green Version]
- Masoumi, K.; Forouzan, A.; Barzegari, H.; Darian, A.A.; Rahim, F.; Zohrevandi, B.; Nabi, S. Effective factors in severity of traffic accident-related traumas; an epidemiologic study based on the Haddon matrix. Emergency 2016, 4, 78–82. Available online: https://www.ncbi.nlm.nih.gov/pmc/articles/PMC4893755/ (accessed on 19 June 2021).
- Kloeden, C.N.; McLean, A.J.; Baldock, M.R.; Cockington, A.J. Severe and Fatal Car Crashes due to Roadside Hazards: A Report to the Motor Accident Commission; NHMRC Road Accident Research Unit, The University of Adelaide: Adelaide, SW, Australia, 1999; pp. 34–61. Available online: https://www.researchgate.net/profile/Matthew-Baldock/publication/237376918_Severe_and_Fatal_Car_Crashes_Due_to_Roadside_Hazards/links/02e7e533de32c6895d000000/Severe-and-Fatal-Car-Crashes-Due-to-Roadside-Hazards.pdf (accessed on 26 October 2020).
- Chang, L.Y.; Mannering, F. Analysis of injury severity and vehicle occupancy in truck-and non-truck-involved accidents. Accid. Anal. Prev. 1999, 31, 579–592. Available online: https://www.sciencedirect.com/science/article/abs/pii/S0001457599000147 (accessed on 19 June 2021). [CrossRef]
- Luathep, P.; Taneerananon, S.; Thongchim, P.; Mama, S.; Somchainuek, O. Roadside Crash: A Tragic Lesson from Thailand. In Proceedings of the Eastern Asia Society for Transportation Studies Volume 7 (The 8th International Conference of Eastern Asia Society for Transportation Studies, 2009), Surabaya, Indonesia, 16–19 November 2009; pp. 413–427. Available online: https://www.jstage.jst.go.jp/article/eastpro/2009/0/2009_0_413/_article/-char/ja/ (accessed on 26 October 2020).
- Hoque, M.S.; Hasan, M.R. Involvement of vehicle factors in road accidents. J. Civ. Eng. (IEB) 2007, 35, 17–27. Available online: http://mail.jce-ieb.org/doc_file/3402008.pdf (accessed on 26 October 2020).
- Birgani, A.G.; Hakim, A.; Zare, K. Epidemiologic study of fatal traffic accidents in Khuzestan province in 2010. Sci. J. Rescue Relief 2012, 4, 28–35. Available online: https://www.sid.ir/en/journal/ViewPaper.aspx?id=276273 (accessed on 19 June 2021).
- Sadeghi-Bazargani, H.; Samadirad, B.; Shahedifar, N.; Golestani, M. Epidemiology of road traffic injury fatalities among car users; a study based on forensic medicine data in East Azerbaijan of Iran. Bull. Emerg. Trauma 2018, 6, 146–154. Available online: https://www.ncbi.nlm.nih.gov/pmc/articles/PMC5928272/ (accessed on 19 June 2021). [CrossRef] [PubMed]
- Wilks, J.; Watson, B. Road safety and international visitors in Australia: Looking beyond the tip of the iceberg. Travel Med. Int. 1998, 16, 194–198. Available online: https://www.researchgate.net/profile/Jeff-Wilks/publication/27469500_Road_safety_and_international_visitors_in_Australia_Looking_beyond_the_tip_of_the_iceberg/links/551148700cf20352196dc699/Road-safety-and-international-visitors-in-Australia-Looking-beyond-the-tip-of-the-iceberg.pdf (accessed on 26 October 2020).
- Jacobs, G.; Aeron-Thomas, A.; Astrop, A. Estimating Global Road Fatalities; Transport Research Laboratory: Crowthorne, UK, 2000; pp. 3–26. Available online: https://citeseerx.ist.psu.edu/viewdoc/download?doi=10.1.1.174.5207&rep=rep1&type=pdf (accessed on 26 October 2020).
- Castro, C.; García-Fernández, P.; Ventsislavova, P.; Esiman, E.; Crundall, D. 887 Analysing the offender driver behaviour: Recidivism, just the tip of the Iceberg? Inj. Prev. 2016, 22, A316. Available online: https://injuryprevention.bmj.com/content/22/Suppl_2/A316.2.abstract (accessed on 26 October 2020). [CrossRef] [Green Version]


| Events | Roadside Objects | Victims | Total Injured (%) | Death (%) * |
|---|---|---|---|---|
| Single-vehicle crashes (13 events, 52.0% of 25 events) | ||||
| (Event 1) An excursion bus overturned | - | 66 | 24 (36.4) | 0 (0.0) |
| (Event 2) A car burning after hitting a tree | 1 tree | 4 | 4 (100.0) | 4 (100.0) |
| (Event 3) A school pickup running off a road and crashing into a tree | 1 tree | 12 | 12 (100.0) | 10 (83.3) |
| (Event 4) A car burning after hitting a tree | 1 tree | 3 | 3 (100.0) | 2 (66.7) |
| (Event 5) A car hitting a tree | 1 tree | 2 | 2 (100.0) | 1 (50.0) |
| (Event 6) A saloon car crashing into an electricity pole | 1 utility pole | 9 | 9 (100.0) | 6 (66.7) |
| (Event 7) A pickup public transport pickup running off a road and crashing into a utility pole | 1 utility pole | 5 | 5 (100.0) | 1 (20.0) |
| (Event 8) A prime mover truck crashing into a pedestrian bridge | 1 concrete pillar | 1 | 1 (100.0) | 1 (100.0) |
| (Event 9) An overturned bus crashed into trees after hitting a pedestrian | 2 trees | 26 | 17 (64.5) | 2 (7.7) |
| (Event 10) A chartered van crashing into trees and overturning | 2 trees | 15 | 12 (80.0) | 6 (40.0) |
| (Event 11) An excursion pickup public transport running off a road and crashing into trees | 2 trees | 21 | 21 (100.0) | 2 (9.5) |
| (Event 12) A pickup truck running off a road and crashing into a tree and a utility pole | 1 tree and 1 utility pole | 4 | 4 (100.0) | 3 (75.0) |
| (Event 13) An armored pickup running off a road crashing into trees and overturning | 3 trees | 2 | 2 (100.0) | 2 (100.0) |
| Two-vehicle crashes (7 events, 28.0% of 25 events) | ||||
| (Event 14) An ambulance crashing into a car, which then collided with pedestrians | - | 13 | 10 (76.9) | 1 (7.7) |
| (Event 15) A car u-turned crossed into the opposite lane and crashing a worker pickup truck, overturning and ran off the road | - | 18 | 18 (100.0) | 0 (0.0) |
| (Event 16) An ambulance crashing into the back of a prime mover truck | - | 4 | 3 (75.0) | 1 (25.0) |
| (Event 17) A school pickup crashing into a tree and overturning after a car crashed into the pickup | 1 tree | 20 | 18 (90.0) | 1 (5.0) |
| (Event 18) A pickup crashing into a motorcycle | 1 tree | 2 | 1 (50.0) | 1 (50.0) |
| (Event 19) A pickup truck crashing a public van, running off a road and hitting trees | 2 trees | 15 | 14 (93.3) | 1 (6.7) |
| (Event 20) A truck crashing a worker pickup truck, running off a road and hitting two trees and a utility pole | 2 trees and 1 utility pole | 11 | 10 (90.9) | 7 (63.6) |
| Multi-vehicle crashes (5 events, 20.0% of 25 events) | ||||
| (Event 21) A pickup crashed into other pickups with the second pickup rolling and flipping over a passenger (3 vehicles) | - | 18 | 18 (100.0) | 2 (11.1) |
| (Event 22) A car crashing into an ambulance, which then crashed into a pickup (3 vehicles) | - | 7 | 2 (28.6) | 0 (0.0) |
| (Event 23) An excursion bus crashing into the back of another excursion bus, crashing into the back of a pickup (3 vehicles) | - | 81 | 18 (22.2) | 0 (0.0) |
| (Event 24) A car crashing into a pickup and running off the road, colliding with a prime mover truck (3 vehicles) | 1 tree | 8 | 6 (75.0) | 5 (62.5) |
| (Event 25) A multiple-vehicle crash in front of a school zone (8 vehicles) | 1 tree | 40 | 34 (85.0) | 0 (0.0) |
| Total | 27 | 407 | 268 (65.8) | 59 (14.5) |
| Time of Day | Number (25 Events) | % | Total Injured (n = 268) | % | Death (n = 59) | % |
|---|---|---|---|---|---|---|
| Midnight to 3.00 a.m. | 0 | 0.0 | 0 | 0.0 | 0 | 0.0 |
| 3.01 a.m. to 6.00 a.m. | 4 | 16.0 | 34 | 12.7 | 13 | 22.0 |
| 6.01 a.m. to 9.00 a.m. | 3 | 12.0 | 31 | 11.6 | 10 | 16.9 |
| 9.01 a.m. to Midday | 3 | 12.0 | 31 | 11.6 | 3 | 5.1 |
| Midday to 3.00 p.m. | 7 | 28.0 | 68 | 25.4 | 15 | 25.4 |
| 3.01 p.m. to 6.00 p.m. | 6 | 24.0 | 99 | 36.9 | 16 | 27.1 |
| 6.01 p.m. t0 9.00 p.m. | 0 | 0.0 | 0 | 0.0 | 0 | 0.0 |
| 9.01 p.m. to Midnight | 2 | 8.0 | 5 | 1.9 | 2 | 3.4 |
| Demographic Data of Road Users | Total Injured | Death | CFR * (%) | ||
|---|---|---|---|---|---|
| Number (n = 268) | % | Number (n = 59) | % | ||
| Sex | |||||
| Female | 165 | 61.6 | 32 | 54.2 | 19.4 |
| Male | 103 | 38.4 | 27 | 45.8 | 26.2 |
| Male:Female | 1:1.6 | 1:1.2 | |||
| Age-groups (year) | |||||
| <15 | 63 | 24.9 | 10 | 16.9 | 15.9 |
| 15–19 | 27 | 10.7 | 8 | 13.6 | 29.6 |
| 20–24 | 22 | 8.7 | 3 | 5.1 | 13.6 |
| 25–29 | 25 | 9.9 | 9 | 15.3 | 36.0 |
| 30–34 | 16 | 6.3 | 3 | 5.1 | 18.8 |
| 35–39 | 9 | 3.6 | 3 | 5.1 | 33.3 |
| 40–44 | 21 | 8.3 | 8 | 13.6 | 38.1 |
| 45–49 | 18 | 7.1 | 5 | 8.5 | 27.8 |
| 50–54 | 18 | 7.1 | 4 | 6.8 | 22.2 |
| 55–59 | 11 | 4.3 | 3 | 5.1 | 27.3 |
| ≥60 | 23 | 9.1 | 3 | 5.1 | 13.0 |
| Total | 253 | 100.0 | 59 | 100.0 | 23.3 |
| Mean age (year) | 31.1 | 32.0 | |||
| Minimum age (year) | 3 months | 3 months | |||
| Maximum age (year) | 88 | 82 | |||
| Vehicle used by casualties | |||||
| Motorcycle | 1 | 0.4 | 1 | 1.7 | 100.0 |
| Motorcycle with sidecar | 2 | 0.8 | 0 | 0.0 | 0.0 |
| Car | 28 | 10.8 | 18 | 31.6 | 64.3 |
| Pickup | 133 | 51.6 | 28 | 49.1 | 21.1 |
| Van | 26 | 10.1 | 7 | 17.5 | 26.9 |
| Ambulance | 8 | 3.1 | 1 | 12.3 | 12.5 |
| Bus | 58 | 22.5 | 1 | 1.7 | 1.7 |
| Truck | 2 | 0.4 | 1 | 1.7 | 50.0 |
| Total | 258 | 100.0 | 57 | 100.0 | 22.1 |
| Types of injured | |||||
| Driver | 29 | 10.8 | 11 | 18.6 | 37.9 |
| Passenger | 229 | 85.5 | 46 | 78.0 | 20.1 |
| Pedestrian | 10 | 3.7 | 2 | 3.4 | 20.0 |
| Total | 268 | 100.0 | 59 | 100.0 | 22.0 |
| Body region of injuries (multiple response) | |||||
| Head/neck (include middle inner ear) | 111 | 41.4 | 45 | 76.3 | 40.5 |
| Face (include eye balls) | 51 | 19.0 | 10 | 16.9 | 19.6 |
| Thorax (Chest) | 58 | 21.6 | 21 | 35.6 | 36.2 |
| Abdominal or pelvic contents | 46 | 17.1 | 11 | 18.6 | 23.9 |
| Extremities or pelvic girdle | 118 | 44.0 | 29 | 49.1 | 24.6 |
| External and body surface | 95 | 35.4 | 19 | 32.2 | 20.0 |
| The Transportation from Scene (Multiple Transportations) | Bystander | Police Officer | First Response Unit (FR) | Hospital EMS (BLS/ALS) | Total |
|---|---|---|---|---|---|
| (Event 1) An excursion bus overturned | ✓ | ✓ | ✓ | 3 | |
| (Event 2) A car burning after hitting a tree | ✓ | 1 | |||
| (Event 3) A school pickup running off a road and crashing into a tree | ✓ | ✓ | ✓ | 3 | |
| (Event 4) A car burning after hitting a tree | ✓ | ✓ | 2 | ||
| (Event 5) A car hitting a tree | ✓ | ||||
| (Event 6) A saloon car crashing into a utility pole | ✓ | ✓ | 2 | ||
| (Event 7) A public transport pickup running off a road and crashing into a utility pole | ✓ | ✓ | 2 | ||
| (Event 8) A prime mover truck crashing into a pedestrian bridge | ✓ | 11 | |||
| (Event 9) An overturned bus crashed into trees after hitting a pedestrian | ✓ | ✓ | 2 | ||
| (Event 10) A chartered van crashing trees and overturning | ✓ | ✓ | ✓ | 3 | |
| (Event 11) An excursion pickup public transport running off a road and crashing into trees | ✓ | ✓ | ✓ | ✓ | 4 |
| (Event 12) A pickup truck running off a road and crashing into a tree and a utility pole | ✓ | 1 | |||
| (Event 13) An armored pickup running off a road, crashing into trees, and overturning | ✓ | ✓ | 2 | ||
| (Event 14) An ambulance crashing a car, crashing into six pedestrians | ✓ | ✓ | 2 | ||
| (Event 15) A car u-turned, crossed into the opposite lane, and crashed into a worker pickup truck, overturning and running off the road | ✓ | ✓ | 2 | ||
| (Event 16) An ambulance crashing into the back of a prime mover truck | ✓ | ✓ | 2 | ||
| (Event 17) A school pickup crashing into a tree and overturning after a car crashed into the pickup | ✓ | ✓ | ✓ | 3 | |
| (Event 18) A pickup crashing into a motorcycle | ✓ | 1 | |||
| (Event 19) A pickup truck crashing a public van, running off the road, and hitting trees | ✓ | ✓ | 2 | ||
| (Event 20) A truck crashing into a worker pickup truck, running off the road, and hitting two trees and a utility pole | ✓ | ✓ | 2 | ||
| (Event 21) A pickup crashed into other pickups before the second pickup rolling and flipping over a passenger | ✓ | ✓ | ✓ | 3 | |
| (Event 22) A car crashing into an ambulance then crashing into a pickup | ✓ | 1 | |||
| (Event 23) An excursion bus crashing into the back of another excursion bus, crashing into the back of a pickup | ✓ | ✓ | 2 | ||
| (Event 24) A car crashing into a pickup and running off the road, colliding with a prime mover truck | ✓ | ✓ | 2 | ||
| (Event 25) A multiple-vehicle crash in front of a school zone | ✓ | ✓ | ✓ | 3 | |
| Total | 4 (16.0%) | 8 (32.0%) | 21 (84.0%) | 19 (76.0%) | 52 (100.0%) |
| Event Phases | Influencing Factors of Injuries | |||
|---|---|---|---|---|
| Human | Vehicle | Environment | ||
| Physical | Social-Economic | |||
| Pre-event | Driver -Speeding (Event 2, 3, 4, 5, 6, 8, 9, 10, 12, 13, 14, 16, 17, 18, 19, 20, 23, 24) -Drowsy (fatigue, usually from long driving time, night driving, long-distance driving) (Event 2, 6, 7, 8, 10, 12, 13, 16, 21, 24) -Decision (try to avoid pedestrian suddenly, sudden change of lane, suddenly braking) (Event 1, 9, 14, 18, 22, 23, 25) -Inexperience (not regular vehicle), Lack of ambulance driving training, unlicensed driving, more frequent accidents, downhill braking, brake immediately) (Event 1, 4, 11, 13, 14, 15, 16, 22, 23, 24, 25) -Driver’s health (type 2 diabetes) (Event 7) -Used alcohol/drug (Event 7, 12) -Distracted driving (two small children sat next to the driver, impaired shoes, bent down to pick up things) (Event 6, 15, 16) -Traffic behavior/skill (not enough distance between vehicle, drive on the right of way, driving with one hand, slow down a car with gears when speeding) (Event 2, 3, 18, 20, 23) Pedestrian -Elder walking on road (Event 9) | Car -Overloaded (Event 6, 21, 24) -Mismatches tires (tires age) (Event 6) -Second hand car/no car insurance, no car tax (Event 2) Pick up -Overloaded (Event 3, 11, 15, 17, 20, 21, 25) -Modifications (for public songthaew, school songthaew, private transportation, platform at rear pickup) (Event 3, 7, 11, 12, 13, 20) -Mismatched tires (tires age) (Event 3, 11, 13) -Vehicles older than 20 years (Event 12) - No car insurance, no car tax (Event 3, 12) Ambulance -Modifications (the radio wire leaned across the drink holder in front of the console) (Event 16) Bus -Overloaded (Event 1) -Not available (in repair) (Event 1) -Tire no tread (Event 9) -Out of control (Event 9) Truck -Overloaded (Event 8) -Out of control (Event 25) | -Drenched road/Slippery road (Event 17, 18, 19, 25) -Two-lane road (Event 9, 21) -Four-lane, no road medians (Event 6) -Road surface (Event 19) -Dim lighting conditions, no traffic lights (Event 2, 5, 8, 9, 10, 16) -No guard rails (Event 2, 4, 6, 8, 24, 25) -Different road curb (Event 9, 11, 21) -Fixed objects in safety zone (trees, cement drainage pipe, utility poles) (Event 2, 3, 4, 5, 6, 9, 10, 11, 12, 13, 16, 17, 19, 20, 25) -No shoulder line demarcations (Event 21) -Traffic mix (entrance school, U-turn, end of curve road,) (Event 14, 25) -Mixed horizontal and vertical curves (Event 17) -Downhill (Event 1) -The branches obscured the vision (Event 14, 22) | -Accident black spot in this area (Event 2, 3, 10, 12, 13, 14, 16, 17, 18, 19, 20, 23) -Lack of pedestrian facilities (footpath, pedestrian crossing, overpass) (Event 9, 14, 25) -No traffic signs (Event 1, 3, 6, 9, 13, 16, 20, 23, 25) -a community (house, buying food, funeral on the roadside) (Event 9, 18) -School zone (Street food vendors, students, vehicle parking) (Event 25) -Roadside market (Event 14) -Main road to Malaysia (Event 25) -Many heavy vehicles pass (Event 25) -Road under construction (Event 23) -Renting a bus for excursions (Event 1, 23) |
| Event | Driver -Non use of seat belt (hit other objects in vehicle, ejected from vehicle) (Event 3, 10, 11, 12, 13, 15, 21, 23, 25) -Used seat belt wrong position (Event 21) -No warning sign (Event 25) - Hit other objects in vehicle (Event 4, 5, 8, 18, 19) Passenger - No use of seat belt (dislodged from seat, hit other objects in vehicle, ejected from vehicle) (Event 1, 2, 3, 4, 5, 6, 9, 10, 12, 13, 14, 16, 17, 19, 20, 21, 22, 23, 24, 25) - Sat in the spec-cab and rear of pickup (Event 3, 7, 11, 12, 15, 17, 20, 21, 25) - Sat in a third bench in the middle of seating area (Event 25) - Stood on rear platform (Event 25) - No self-defense (dislodged from seat, ejected from vehicle) (Event 1, 2, 3, 4, 5, 6, 7, 9, 10, 11, 12, 14, 15, 16, 20, 21, 22, 23, 24, 25) -Ejected from cargo (Event 3, 6, 8, 9, 10, 12, 13, 15, 16, 17, 19, 20, 21, 25) -Jump from vehicle (Event 25) -Children sat near side winder and sat in front of vehicle (Event 6, 24) -Many passengers (Event 1, 3, 6, 11, 15, 17, 20, 21, 24, 25) -The helmet slips from the head (Event 18) Pedestrian -Elder walking on road (Event 9) -People walking on the median strip on the road (include children) (Event 14) -Walking and standing on shoulder of road (Event 25) | -Vehicles without occupant restraints (seat belts, child restraint, air bag) (Event 1, 3, 6, 7, 10, 11, 12, 15, 17, 20, 21, 24, 25) Motorcycle -Head-on crash (Event 18) Car -Head-on crash (Event 2, 24) -Sideswipe accident (Event 6, 15) -Structural damage (Event 2, 4, 5, 6, 15, 24) -No child seat belts (Event 6, 24) -No air bag (Event 5) Pick up -Head-on crash (Event 3, 7, 11, 12, 21) -Fell down and rolled over (Event 21) -Rolled over and overturned (Event 13, 15, 20, 21) -Rear impact (Event 25) -Structural damage (Event 3, 7, 11, 12, 13, 15, 18, 20) -No occupants safety (airbags, seat belts, cargo safety) (Event 3, 7, 11, 12, 13, 15, 17, 20, 21, 25) -Non-working seat belt in the front seat (Event 21) -Seat not fixed (bench seats) (Event 3, 11, 20, 25) Ambulance -Rear impact with car, truck (Event 14, 16) -Sideswipe accident (Event 22) -Structural damage (Event 16) -Rolled over (Event 16) Van -No child seat belts (Event 10) -Overturned (Event 10) -Structural damage (Event 10, 19) -Seat belt not fixed (Event 19) Bus -Rear impact with bus (Event 23) -Overturned (Event 1, 9) -Seats dropped (Event 1, 9) -Frame damage (Incident 1, 9) -No seat belt (Event 1) Truck -Structural damage (Event 8) | -The body impacted ground (Event 6, 9, 10, 12, 13, 14, 17, 20, 21, 25) -The body impacted the fixed objects (Event 20) -Crashed into trees (Event 2, 3, 4, 5, 9, 11, 12, 13, 14, 16, 17, 19, 20, 24, 25) -Crashed into other fixed objects (utility pole, kilometer pillar, pedestrian bridge (Event 4, 6, 7, 8, 12, 20) -Flipped over to the floor (Event 21) -Median barrier could not stop vehicle (Event 15, 24) -Dusty road (Event 23) | -No light sign on roadside (Event 9) -During school closing times: (Event 25) -School zone (Event 8, 25) -Community zone (Event 9, 18, 23) -Market zone (Event 14) |
| Post-event | -No one trained in first aid on scene/first aids on scene bystander (Event 1, 2, 3, 4, 5, 6, 10, 11, 13, 15, 16, 17, 18, 21, 23) -Delayed call to EMS/unavailable/no contact (Event 2, 3, 4, 5, 6, 11, 13, 15, 16, 18, 21, 24, 25) -Delayed first aids of paramedics (Event 3, 6, 10) -No emergency response plan/delay in emergency response plan (Event 1, 11, 15, 17) | Sidecar -Over the body (Event 21) Car -Burn in car (Event 2, 4, 24) -Stuck in vehicle (Event 4, 6, 24) -Over the body’s pedestrian (Event 14) Pick up -Over the body (Event 17, 21) -Stuck in vehicle (Event 3, 8, 13, 20) -Burn in car (Event 13) Ambulance -Burn in car (Event 16) -Stuck in vehicle (Event 16) Van -Stuck in vehicle (Event 10, 12, 19) -Seat over the body (Event 10) Bus -Stuck in vehicle (Event 9, 23) -Door obstructed (Event 1) Truck -Stuck in vehicle (Event 8) | Ease of access -Difficult to access and evacuate victims (traffic jam, crowd) (Event 6, 7, 8, 11, 12, 14, 15, 19, 20, 23, 25) -Accident redundant (Event 19) | -lack of slitting equipment (Event 8, 9) -No coordination between EMS center and local team (Event 3, 6, 7, 8, 17, 21, 25) -EMS team not registered (Event 25) -Unclear notification to EMS center and local team (Event 15, 17) -Confused information between EMS center and local team (Event 17) -Poor coordination between hospital and ambulance (Event 1, 11, 17, 22, 23) -Lack of communication device in ambulance (Event 17, 22, 23) -No incident commander on scene (Event 1, 15) |
Publisher’s Note: MDPI stays neutral with regard to jurisdictional claims in published maps and institutional affiliations. |
© 2021 by the authors. Licensee MDPI, Basel, Switzerland. This article is an open access article distributed under the terms and conditions of the Creative Commons Attribution (CC BY) license (https://creativecommons.org/licenses/by/4.0/).
Share and Cite
Klinjun, N.; Kelly, M.; Praditsathaporn, C.; Petsirasan, R. Identification of Factors Affecting Road Traffic Injuries Incidence and Severity in Southern Thailand Based on Accident Investigation Reports. Sustainability 2021, 13, 12467. https://doi.org/10.3390/su132212467
Klinjun N, Kelly M, Praditsathaporn C, Petsirasan R. Identification of Factors Affecting Road Traffic Injuries Incidence and Severity in Southern Thailand Based on Accident Investigation Reports. Sustainability. 2021; 13(22):12467. https://doi.org/10.3390/su132212467
Chicago/Turabian StyleKlinjun, Nuntaporn, Matthew Kelly, Chanita Praditsathaporn, and Rewwadee Petsirasan. 2021. "Identification of Factors Affecting Road Traffic Injuries Incidence and Severity in Southern Thailand Based on Accident Investigation Reports" Sustainability 13, no. 22: 12467. https://doi.org/10.3390/su132212467
APA StyleKlinjun, N., Kelly, M., Praditsathaporn, C., & Petsirasan, R. (2021). Identification of Factors Affecting Road Traffic Injuries Incidence and Severity in Southern Thailand Based on Accident Investigation Reports. Sustainability, 13(22), 12467. https://doi.org/10.3390/su132212467