Article

Analysis of the Causes of Traffic Accidents and Identification of Accident-Prone Points in Long Downhill Tunnel of Mountain Expressways Based on Data Mining

1
School of Civil Engineering and Architecture, Wuhan Institute of Technology, Wuhan 430074, China
2
Wuhan Transportation Planning & Design Co., Ltd., Wuhan 430010, China
*
Author to whom correspondence should be addressed.
Sustainability 2022, 14(14), 8460; https://doi.org/10.3390/su14148460
Submission received: 16 June 2022 / Revised: 6 July 2022 / Accepted: 8 July 2022 / Published: 11 July 2022
(This article belongs to the Special Issue Sustainable Transportation and Road Safety)

Abstract

:
China has a large vehicle base, uneven road conditions, and the highest rate of traffic accidents in the world. Particularly on the long downhill sections of expressway tunnels in mountainous areas with harsh geographical conditions, traffic accidents are densely distributed, and once a traffic accident occurs, the consequences are serious, which poses a large threat to people’s lives and property. This paper mined and analyzed the traffic accident data collected by the project on the Baoding section of Zhangshi Expressway. SPSS software was used to analyze the traffic accident data characteristics of the long downhill tunnel of the mountain expressways. The time, space, accident form, vehicle type, and road alignment distribution characteristics of the traffic accident in the long downhill tunnel section of mountain expressways were obtained. The decision tree algorithm was used to construct the cause analysis model of traffic accidents in the long downhill tunnel of mountain expressways, and the five primary influencing factors were obtained: horizontal curve radius, week, slope length, time, and cart ratio. The improved cumulative frequency curve method was used to study the accident-prone points of mountain expressways, and the accident-prone points and potential accident-prone points were obtained.

1. Introduction

With the rapid development of China’s economy, expressway construction has begun to expand to remote mountainous areas, and construction mileage will increase accordingly [1,2]. Due to the limitations of geographical conditions and the influence of environmental conditions in mountainous areas, the alignment of expressways in mountainous areas is complex, which is very unfavorable to traffic safety [3], as mountain expressways are prone to traffic accidents [4]. Compared with ordinary sections, the long downhill sections of mountain expressway tunnels have serious accident consequences, long accident impact time, difficult evacuation and rescue, and easily cause a chain reaction to the surrounding environment [5]. The long downhill sections of mountain expressway tunnels have become a large concern with scholars of transportation safety at home and abroad.
The accident probability of the long downhill sections of mountain expressway tunnels is closely related to the busyness of the tunnels [6], particularly in the long downhill tunnel sections of the mountain expressway with heavy traffic. If the treatment method and time are not correct, even less serious minor accidents will cause road congestion and potential regional traffic paralysis, resulting in the loss of personnel and public property [7,8]. The frequency distribution of traffic accidents in the long downhill tunnel sections of the mountain expressway is very dense [9]. With the rapid development of expressway infrastructure construction in China’s mountain areas, ensuring driving safety has aroused intense discussions [10]. Traffic safety researchers highlight that traffic accidents must be based on prevention. Performing data mining and characteristic analysis of traffic accidents in long downhill tunnels on highways in mountainous areas can reveal the accident distribution law and determine the accident-prone points and key hidden danger points of traffic safety in long downhill tunnels [11]. Ma [12] took the long downhill section of Fuyin Expressway as an example, analyzed the traffic accident characteristics of the long downhill tunnel section, revealed the changing characteristics of the accident under different traffic conditions, and suggested preventive countermeasures to strengthen the traffic safety management of the long downhill tunnel section of the mountain expressway, attempting to keep it in a stable and safe status. Therefore, by arranging active and passive facilities and emergency measures in advance, the frequency of traffic accidents in long downhill tunnels can be reduced, the intensity of accidents can be reduced, and the resulting casualties and public property losses can be reduced.
Traffic industry researchers often use data mining to analyze the information hidden behind traffic accident data [13]. So far, there have been many related studies. The road traffic accident database provides the basis for road traffic accident analysis [14]. Martin [15] cleaned and reduced the dimension of the original data on traffic accidents in France in 2011, then performed the research. The research indicated that the number of traffic accidents caused by driving vehicles after taking drugs was 1.65 times that caused by drivers not taking drugs. Shanthi [16] emphasized the importance of data mining classification algorithm in predicting the factors affecting the injury severity of road traffic accidents, and compared the performance of classification algorithms such as C4.5, CR-T, ID3, CS-CRT, CS-MC4, Naive Bayes, and Random Tree, which have good applicability for simulating road traffic accidents and reducing the severity of injuries. Feng [17] counted the distribution and shape of expressway tunnel groups in mountain areas of Yunnan Province in 2014, and analyzed the cause of the accident. The results indicated that collisions were the primary form of traffic accidents in tunnel groups, entrances and exits were the main parts of tunnel-group accidents, and the primary causes of traffic accidents were the rapid changes in light brightness and the excessive speed of vehicles when entering and leaving the tunnel. Based on a brief introduction of data mining, association rules, and traffic accident early warning algorithms, Fang [18] used association-data mining technology to analyze highway traffic accident data. The traffic accident data obtained by using the linked data mining technology were in good agreement with the actual situation, therefore, it was feasible to apply the linked data mining method to the early warning of highway traffic accidents. Hao [19] proposed the definition of “the nature of road traffic accident” based on the association rule technology, and proposed a new road traffic accident data mining model to discover potentially valuable rules from the database of recorded traffic accident data. The results indicated that it played an important role in traffic management decision-making, potential accident prevention, and reduction of life and property safety losses. Yang [20] proposed a traffic accident rate-prediction model based on the classification and regression analysis of Shanghai traffic accident statistics, and established a traffic accident index system including month, week, weather, and wind speed. The index system can more accurately determine the primary factors leading to traffic collisions and predict their severity. Zhang [21] proposed a data mining model using ID3 and C4.5 decision tree algorithms to analyze traffic collision data; the model had good accuracy in classifying the main influencing factors of traffic accidents and their collision severity.
Some domestic and foreign research scholars have focused on the analysis of the distribution law and influencing factors of various tunnel traffic accidents. Li [22] used the Shanghai Yangtze River Tunnel Bridge as the research object, and analyzed the traffic accident characteristics of long-span bridges in the estuary area from the aspects of the hourly, weekly, seasonal, and spatial distribution. The analysis indicated that accidents were prone to occur near the main bridge and the exit area of long-span bridges in the estuary area. Wang [23] analyzed tunnel accidents from multiple perspectives such as time distribution, accident forms, vehicle types, and weather distribution characteristics; it provided a scientific theoretical basis for improving the highway tunnel environment and vehicle operating conditions. Ding [9] calculated the accident distribution under different working conditions based on the traffic accident data of Yuxiang Expressway, and discussed the relationship between the road anti-skid performance and the incidence of traffic accidents, the results indicated the road alignment, weather conditions, and road slip-resistance as factors that affected traffic accidents. For the traffic accident data of the tunnel crossing the river, Zhou [24] used the Logit model to statistically analyze and test the time, space, vehicle type, and modal distribution characteristics of traffic accidents, and concluded that the correlation between potential factors and the severity of accident injuries was high. The study by Takahiro [25] aimed to investigate the relationship between accident risk and various factors such as traffic conditions, road geometry, and weather conditions. The results indicated that under mixed traffic conditions, the risk of side-slip accidents on multi-vehicle road sections was higher. The study also indicated a higher risk of collisions at tunnel entrances. To study the influence of traffic characteristics on traffic accidents in extra-long tunnels, Ma [26] matched the primary traffic volume measurement indicators at the time of traffic accidents with accident information to form the number of traffic accidents and traffic accident datasets. Concurrently, he discovered that the form of traffic accidents in super-long tunnels was dominated by rear-end collisions. Improper handling and illegal lane changes are the primary causes of accidents. Zheng [27] studied the influencing factors of traffic accidents in the undersea tunnel and established a prediction model for traffic accidents in the undersea tunnel. The occurrence of the undersea tunnel accident was related to the length of the tunnel and the volume of traffic. The driver’s illegal behavior and the driver’s negligence are the main factors causing traffic accidents in the undersea tunnel. Zhang [5] developed a natural driving data collection system designed to identify safety-critical events associated with road accidents in mountains to understand the causes of accidents, improve traffic safety, and protect the environment. Some researchers highlighted that the drastic changes in the space environment at the entrance of the tunnel will lead to frequent accidents and high accident levels [28]. Xie [3] discovered that the accident rate on curved sections was higher than on straight sections, and there was a significant difference from other types of highways. The collisions are the predominant form of accident, with accidents involving unprotected vehicles or trucks being the most serious. Table 1 provides an overview of relevant data mining methods.
Based on the data mining work of the above researchers on traffic accidents, the theoretical research results on the causes of traffic accidents are relatively fruitful in China, but most of them are aimed at data on urban roads and highway accidents. The data mining of traffic accidents in other countries is mainly reflected in the establishment of a traffic analysis system and the cause analysis of road traffic accidents, and the data mining of traffic accidents in specific sections is less prominent. However, there is little research on traffic accident data based on the complex structure of the long downhill tunnel section of the mountain expressway. The road environment of the long downhill tunnel section of the mountain expressway is complex and the driver’s psychophysiological state is unstable, so it is necessary to perform a separate traffic accident data mining and characteristic analysis.
This paper will analyze the characteristics of road traffic accident data and expound on the problems of existing road traffic accident data in addition to the feasibility of road traffic accident data mining. According to the traffic accident data of the Baoding Section of Zhangshi Expressway collected by the project, the time, space, accident form, vehicle type, and road linear distribution characteristics of traffic accidents in the long downhill tunnel section of the mountain expressway will be obtained. Based on the decision tree model, the causes of traffic accidents in long downhill tunnels on mountain expressways will be studied, and the factors that are significantly related to the occurrence of traffic accidents in long downhill tunnels on mountain expressways will be obtained. Using the improved cumulative frequency curve method, the cumulative frequency scattergram and fitting equation of the equivalent accident number will be obtained. The equivalent accident numbers N 80 and N 95 are specified as critical values, and the accident-prone points and potential accident-prone points are obtained.

2. Data Characteristics and Test Methods

2.1. Traffic Accident Data Characteristics and Data Mining of Long Downhill Tunnels of Mountain Expressways

The data used to record and describe traffic accident information is road traffic accident data. The different methods of data acquisition can be divided into two aspects: field record and post-investigation. The field record can retrieve the relevant records of the monitoring equipment when the traffic accident occurs, and obtain the corresponding data when the accident occurs, generally the traffic volume, driving speed, etc. When analyzing and researching a car accident, it is necessary to re-investigate the scene of the car accident to obtain data such as damage, road surface markings, records, and other data, in addition to other information obtained by retrieving relevant materials after the car accident occurs. The post-investigation mainly includes preliminary identification of the cause of the accident and the severity of the accident [29].
The negligence of manual operation will inevitably lead to the incompleteness of accident information records, resulting in the omission and lack of some data information, affecting its use value. Random missing and associated missing are the main types of missing data on road traffic accidents. There is no obvious connection between the missing data of the former, and it is difficult to recover the missing value by technical means. The latter is the lack of related accident data. Scientific methods can be used to analyze and mine the correlation between the data, and the approximate value of this type of data can be calculated to supplement the integrity of the overall data. To improve the rationality and authenticity of accident data, it is necessary to analyze and evaluate the objectivity of the data in combination with various factors.
Due to its strong advantages in data analysis and processing, data mining technology is very suitable for supplementary restoration of missing information and refinement of accident laws for road traffic accident data. With the help of the computing advantages of the computer, the laws existing in the traffic accident data can be obtained by using the data mining method, which provides strong technical support for the exploration of road traffic safety.

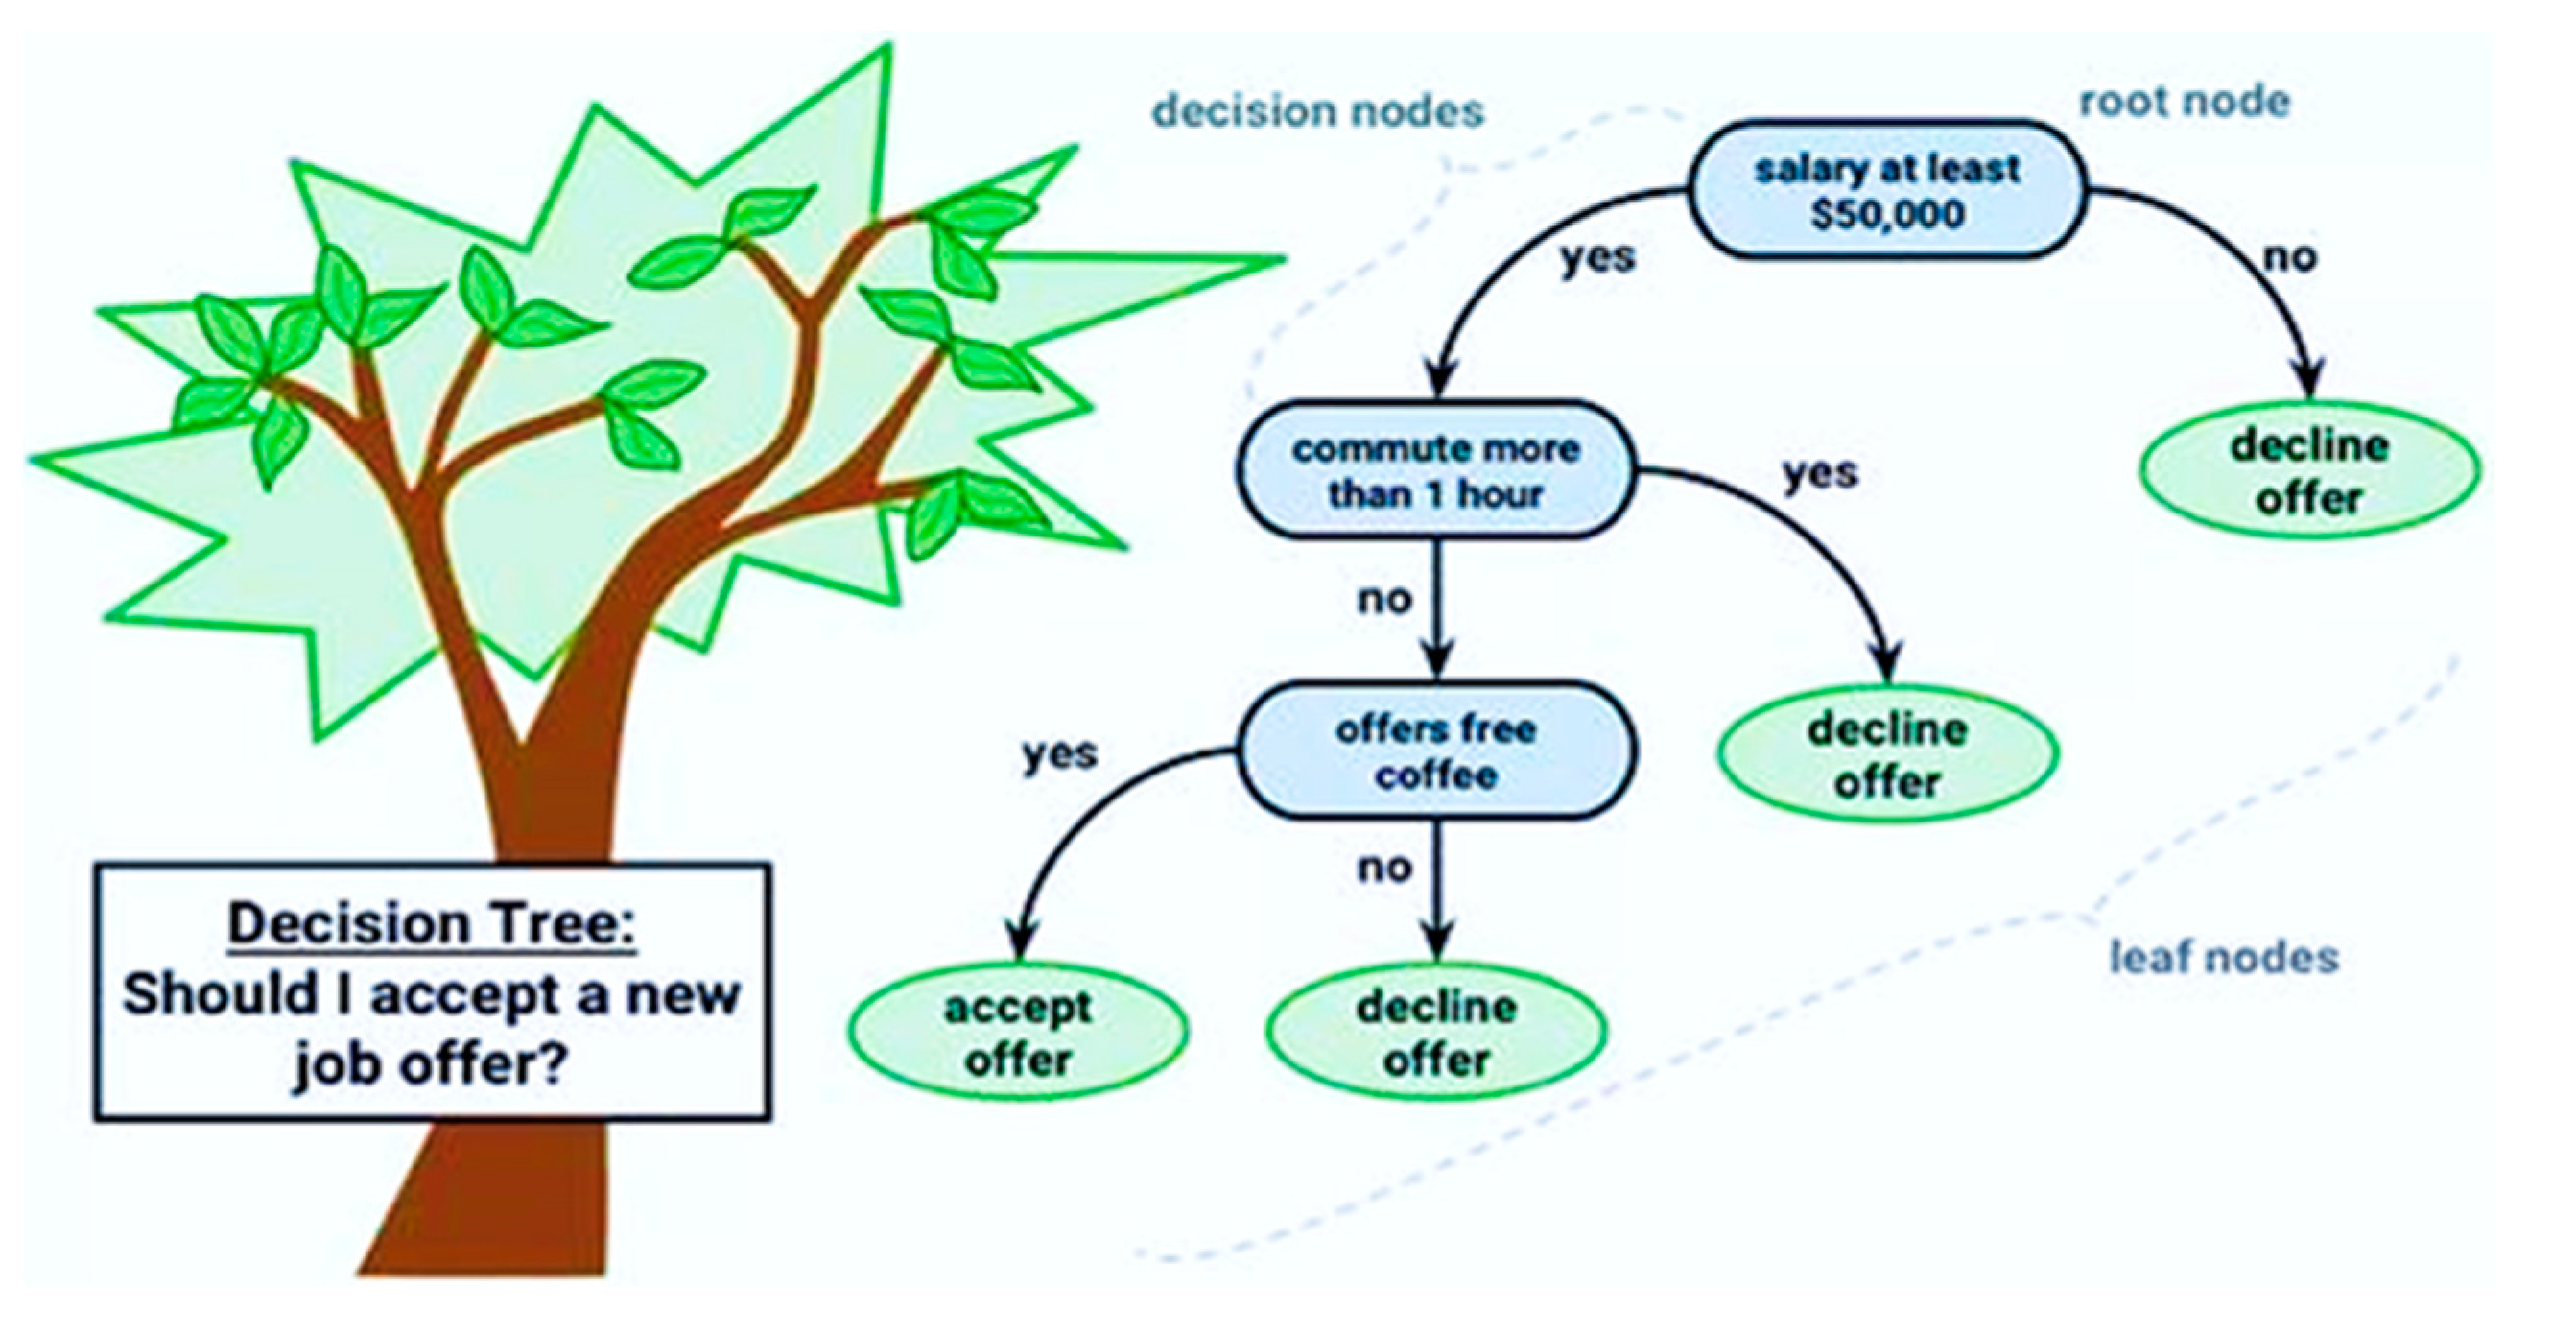
2.2. Accident Cause Analysis Method Based on the Decision Tree Model

The focus of traffic accident data mining in this paper is to analyze the relationship between each influencing factor variable in the accident data and the traffic accident. By comparing the advantages and disadvantages of data mining methods [30], the decision tree algorithm is simple in calculation and strong in interpretability, and is suitable for this data mining. The decision tree model is a case-based learning method. Through the tendentious research on large-scale existing data, we can obtain the value and availability of information contained in the existing data. The decision tree model has strong computing power, the speed of establishing the model is very fast, and the conclusions are automatically analyzed by software, which has strong comprehensibility, so it is widely used in the field of transportation [31,32]. Therefore, the cause analysis of road traffic accidents based on the decision tree model is performed. Through the processing and analysis of the data information in the existing accident database, various variable factors and detailed causes in the accident are clarified, to achieve the identification and analysis of various accidents.
The training process of the decision tree model is a top-down recursive method based on a data-driven principle, in which the nodes in each layer are classified into sub-nodes according to specific attributes, and the target to be classified is at each node. After comparing its attribute characteristics, it will be spread to the next layer and echoed by others by relying on the comparison conclusion. Once the operation is at the leaf end of the model, the operation will be stopped immediately. The operation principle is indicated in Figure 1.
According to the different goals, the decision tree model can be roughly divided into classification tree and regression tree, among which the most frequently used algorithms are the C4.5 algorithm, classification algorithm and chi-square algorithm. In the analysis of the factors influencing the significance of traffic accidents, because the data in the database generally has multiple attributes, the chi-square algorithm, which is good at multi-attribute data analysis, is selected as the basic algorithm of data mining for analysis and research. The model construction based on the chi-square algorithm can obtain a model with more branches. In the process of data correlation analysis, the division process relies on the analysis of target attributes, to classify and grade many input targets. Moreover, the chi-square algorithm has a very fast operation speed, and it has the best effect in the data mining research of category analysis. Therefore, the chi-square algorithm is used to establish the decision tree model in the accident cause analysis in this paper.

2.3. Identification of Traffic Accident-Prone Points Based on Improved Cumulative Frequency Curve Method
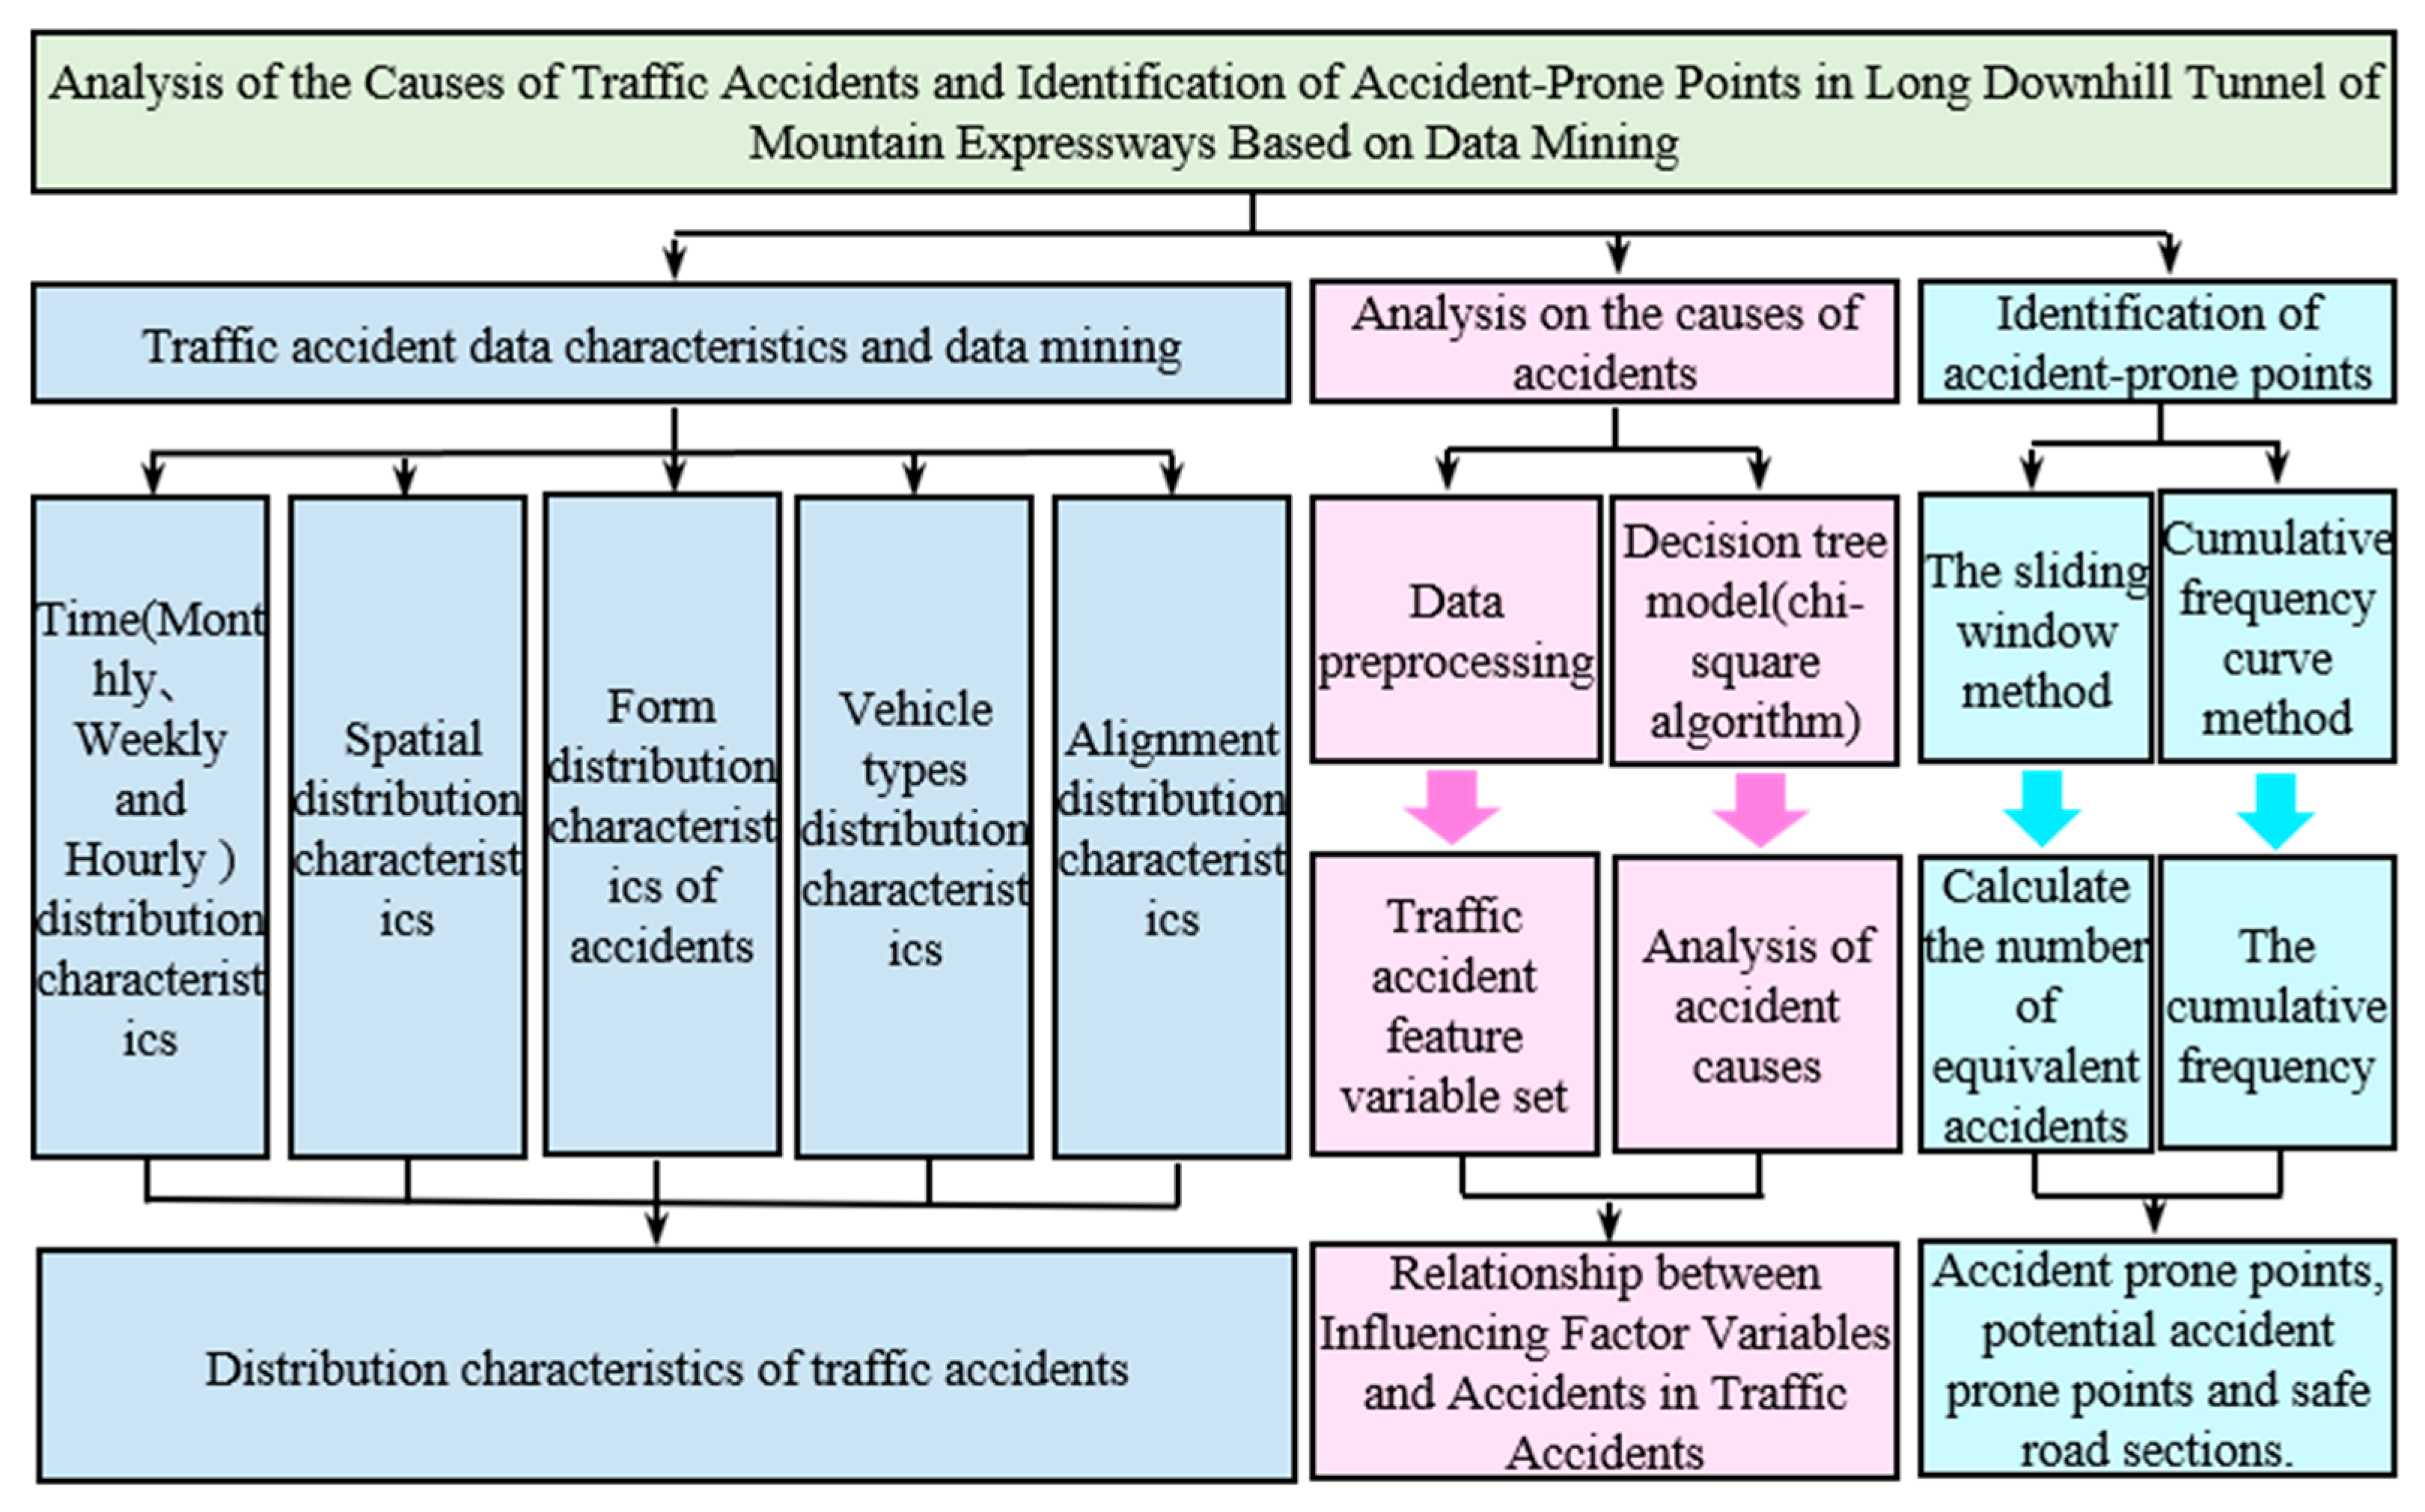
The sliding window method in the fixed-length division (as shown in Figure 2) was used to demonstrate the traffic accident-prone section of the long downhill tunnel of the expressway in the mountainous area. In the process of dividing road sections, the distance of the sliding step was 500 m and the distance of window length was 1 km.
The formula for calculating the number of equivalent accidents in each sliding window is as follows:
E R i = K 1 F i + K 2 J i + R i
where E R i is the equivalent number of accidents in the ith road segment; K 1 is the weight of death; K 2 is the weight of injury; F i is the number of deaths in Section i ; J i is the number of injured persons in Section i ; R i is the number of accident statistics of the ith road segment in the year.
The improved cumulative frequency curve method was evolved according to the horizontal and vertical axes. In this method, the abscissa axis represents the number of equivalent accidents per kilometer, and the ordinate axis represents the cumulative frequency of less than or equal to a certain equivalent number of accidents. The researchers describe the cumulative frequency scatter curve of traffic accidents on a certain road section by changing the horizontal and vertical axes. Concurrently, they used the fitting function of the Origin software to calculate the improved cumulative frequency curve. In this paper, by obtaining the cumulative frequency of the long downhill tunnel section of the mountain expressways, and using the equivalent accident numbers N 80 and N 95 equal to 80% and 95% as the critical values, the accident-prone points and potential accident-prone points of this section were calculated and obtained. Within the range of N N 95 , the corresponding road segment was determined to be an accident-prone point. Within the range of N 95 > N N 80 , the corresponding road section was determined as a potential accident-prone point. Within the range of N < N 80 , the corresponding road segment was determined as a safe road segment.

2.4. Technical Map

Figure 3 is the technical map of this paper.

3. Results

3.1. Distribution Characteristics of Traffic Accidents in the Long Downhill Tunnel of Mountain Expressways

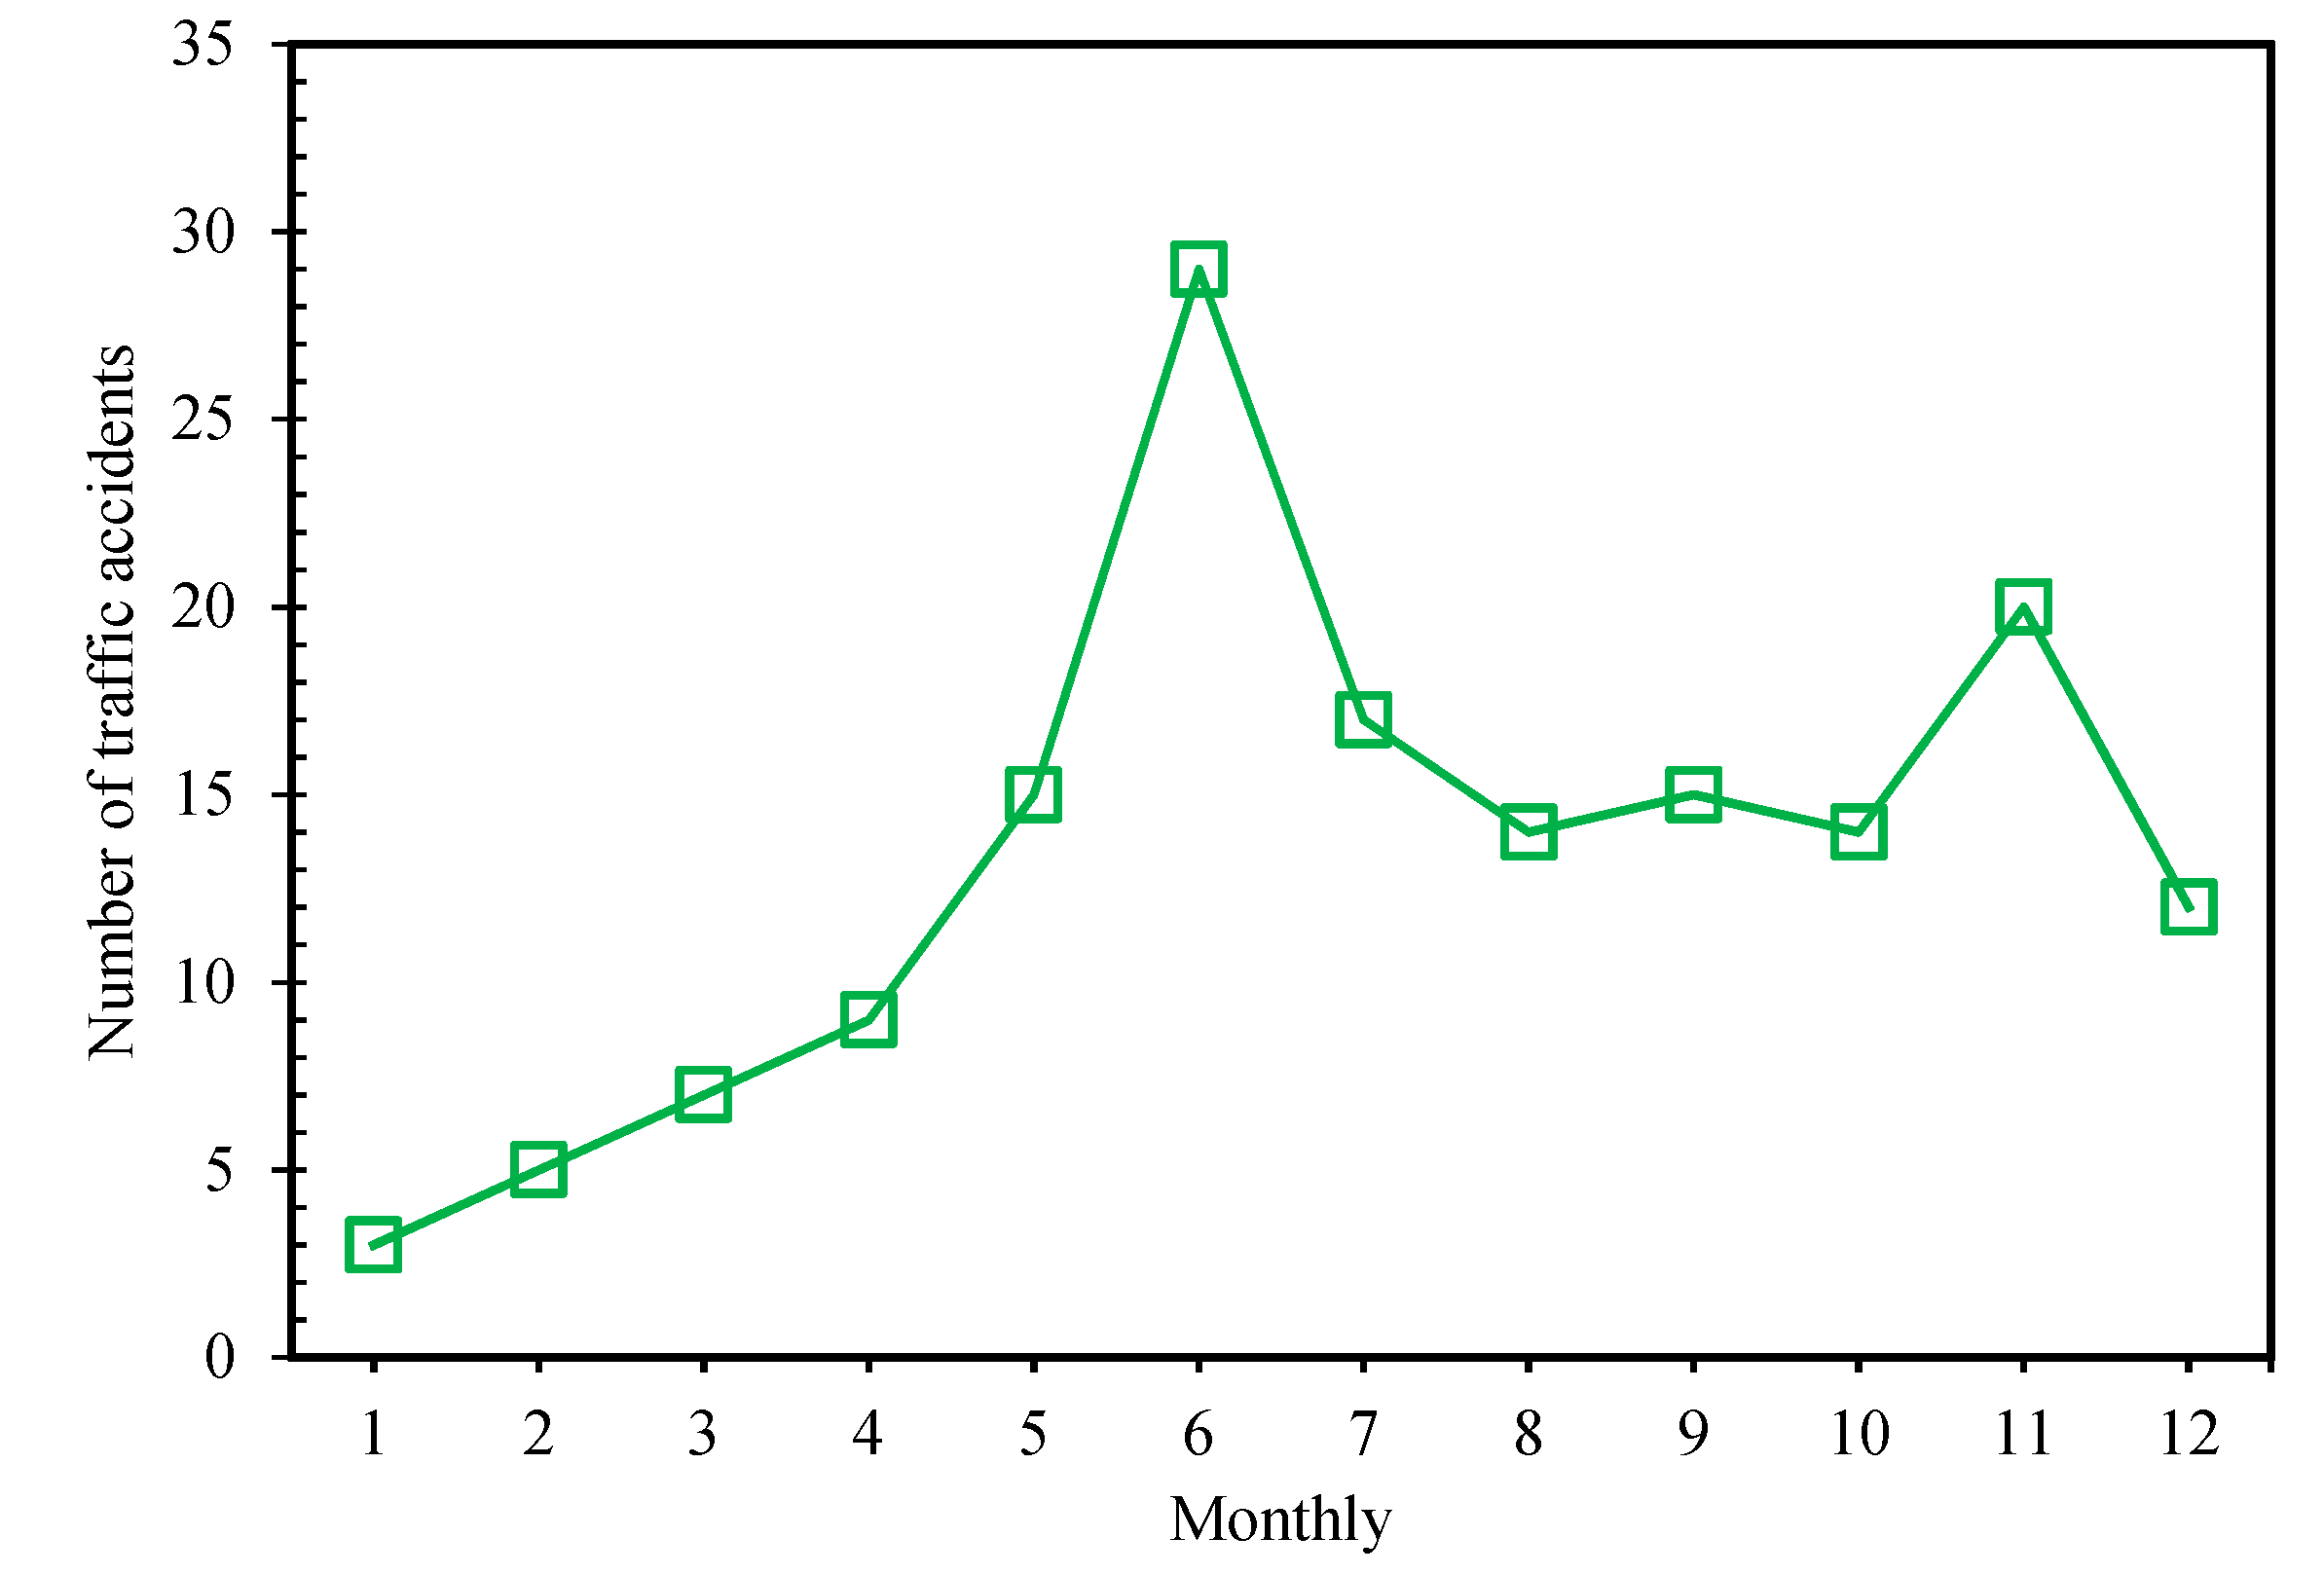
3.1.1. Time Distribution Characteristics of Traffic Accidents

The time distribution characteristics of traffic accidents primarily reflect the relationship between traffic accidents and time changes. The analysis and research on the time distribution characteristics of traffic accidents can clarify the changing rules of accidents and provide data assistance for more in-depth accident data mining and cause analysis and research.
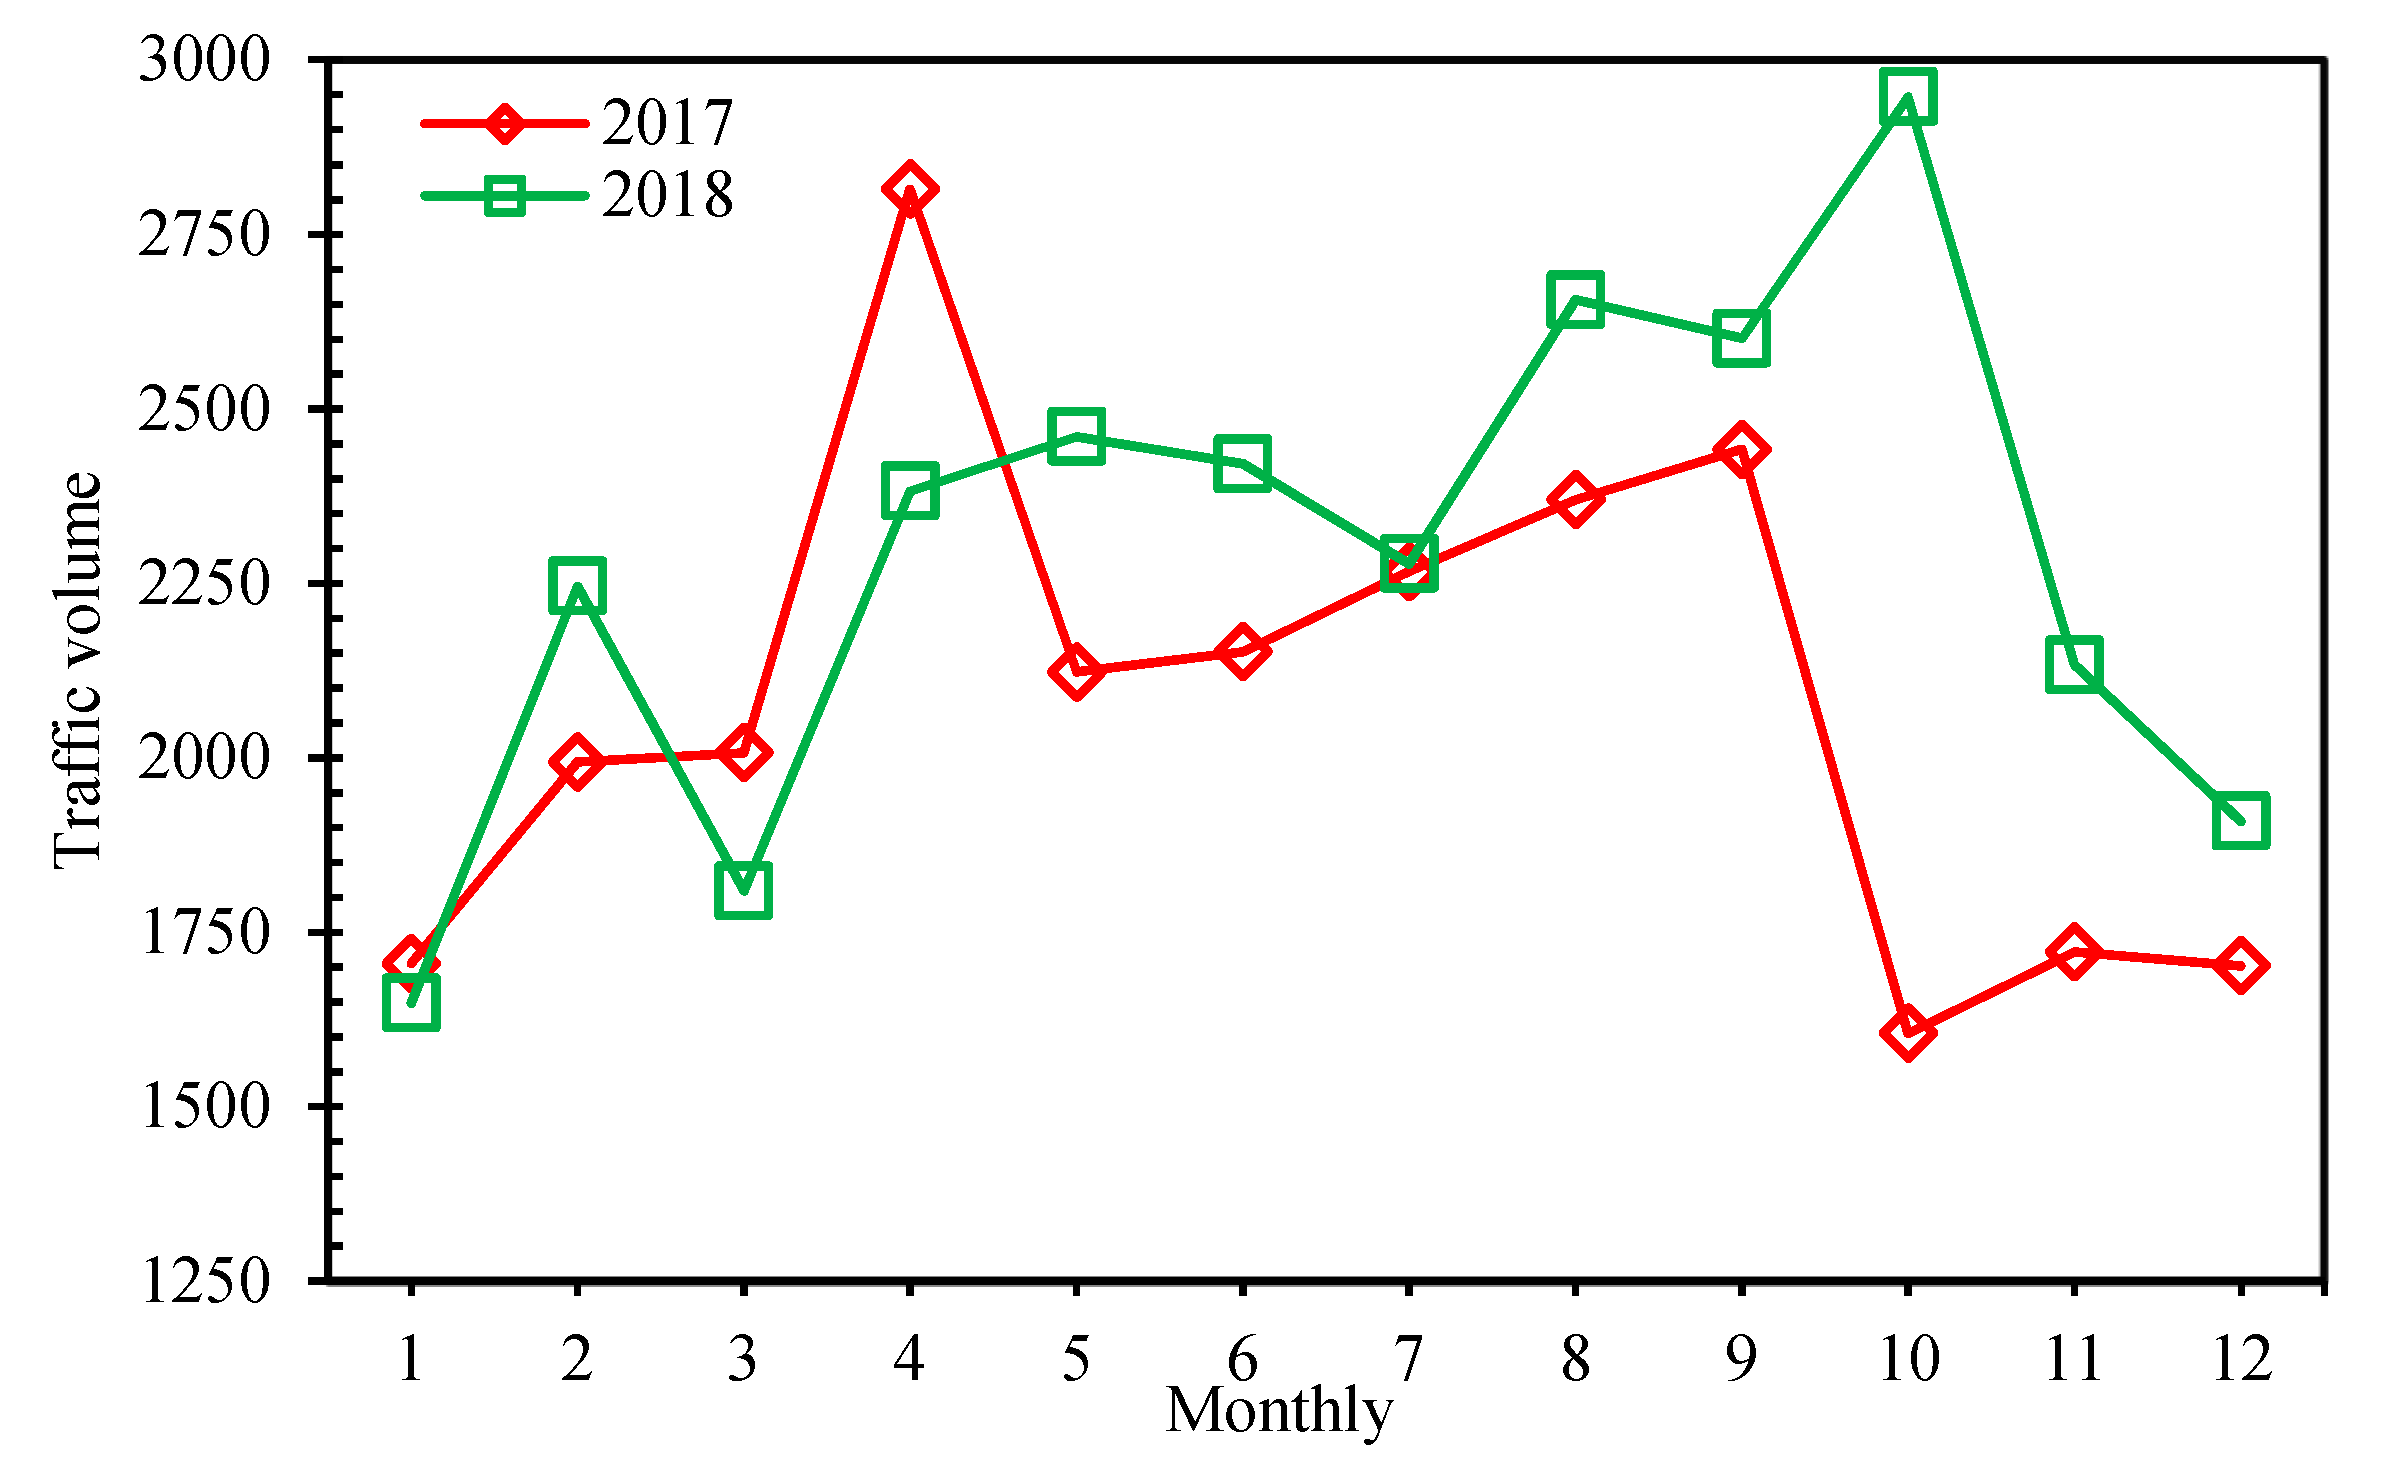
  • Monthly distribution characteristics of accidents.
According to the statistics of general accident data in the Baoding section of Zhangshi Expressway from 2013 to 2018, the monthly distribution of traffic volume and the monthly distribution of traffic accidents are drawn.
As can be observed from Figure 4, the annual traffic volume was concentrated in April to September, the traffic volume remained between 15,000 and 25,000, and the traffic volume in 2017 and 2018 was the same. The monthly average daily traffic volume dropped sharply from November to April. It can be observed from Figure 5 that the accident distribution frequency was the largest in June, which was a high peak value, and the distribution frequency in January was the smallest, which was a trough value. The accident frequency from January to June demonstrated an upward trend. From June to August, the accident frequency demonstrated a downward trend. From August to October, the accident frequency trend was flat. There was a certain correlation between the occurrence of monthly traffic accidents. The primary reasons are:
➀ Traffic volume factor. It can be observed from Figure 4 that the traffic volume was large in June, the number of vehicles driving on the road increased, and the probability of accidents increased significantly.
➁ Visual factors. From April to June, the Baoding section of Zhangshi Expressway was in the rainy season. The influence of weather conditions reduced the visibility of the ground and reduced the driving line of sight. In addition, the “black hole” and “white hole” effects were formed at the entrance and exit of the tunnel, which have a serious impact on the driver’s driving vision and increase the probability of car accidents.
➂ Climatic factors. The Baoding section of Zhangshi Expressway began to heat up significantly in May, and the monthly average maximum temperature in June could reach above 35 °C. When the temperature was too high, the asphalt pavement became soft, and oil flooding may have occurred. At this time, the load-bearing capacity of the pavement was greatly reduced, and the cohesion of the pavement was insufficient, which easily caused deformation. When it was in a high-temperature environment for a long time, the internal pressure of the tire increased, and the car was more likely to have a tire blowout, which was very likely to cause serious traffic accidents. The monthly average minimum temperature of the Baoding section of Zhangshi Expressway reached below 0 °C in November, which caused cracking of the road surface and damage to the continuity of the road surface. This made it easier for water to enter the lower part of the road surface and cause road damage. When the temperature rose, the road surface was puddled, increasing the humidity of the road surface, reducing the grip of the tires, and causing the vehicle to slip easily and cause traffic accidents.
2.
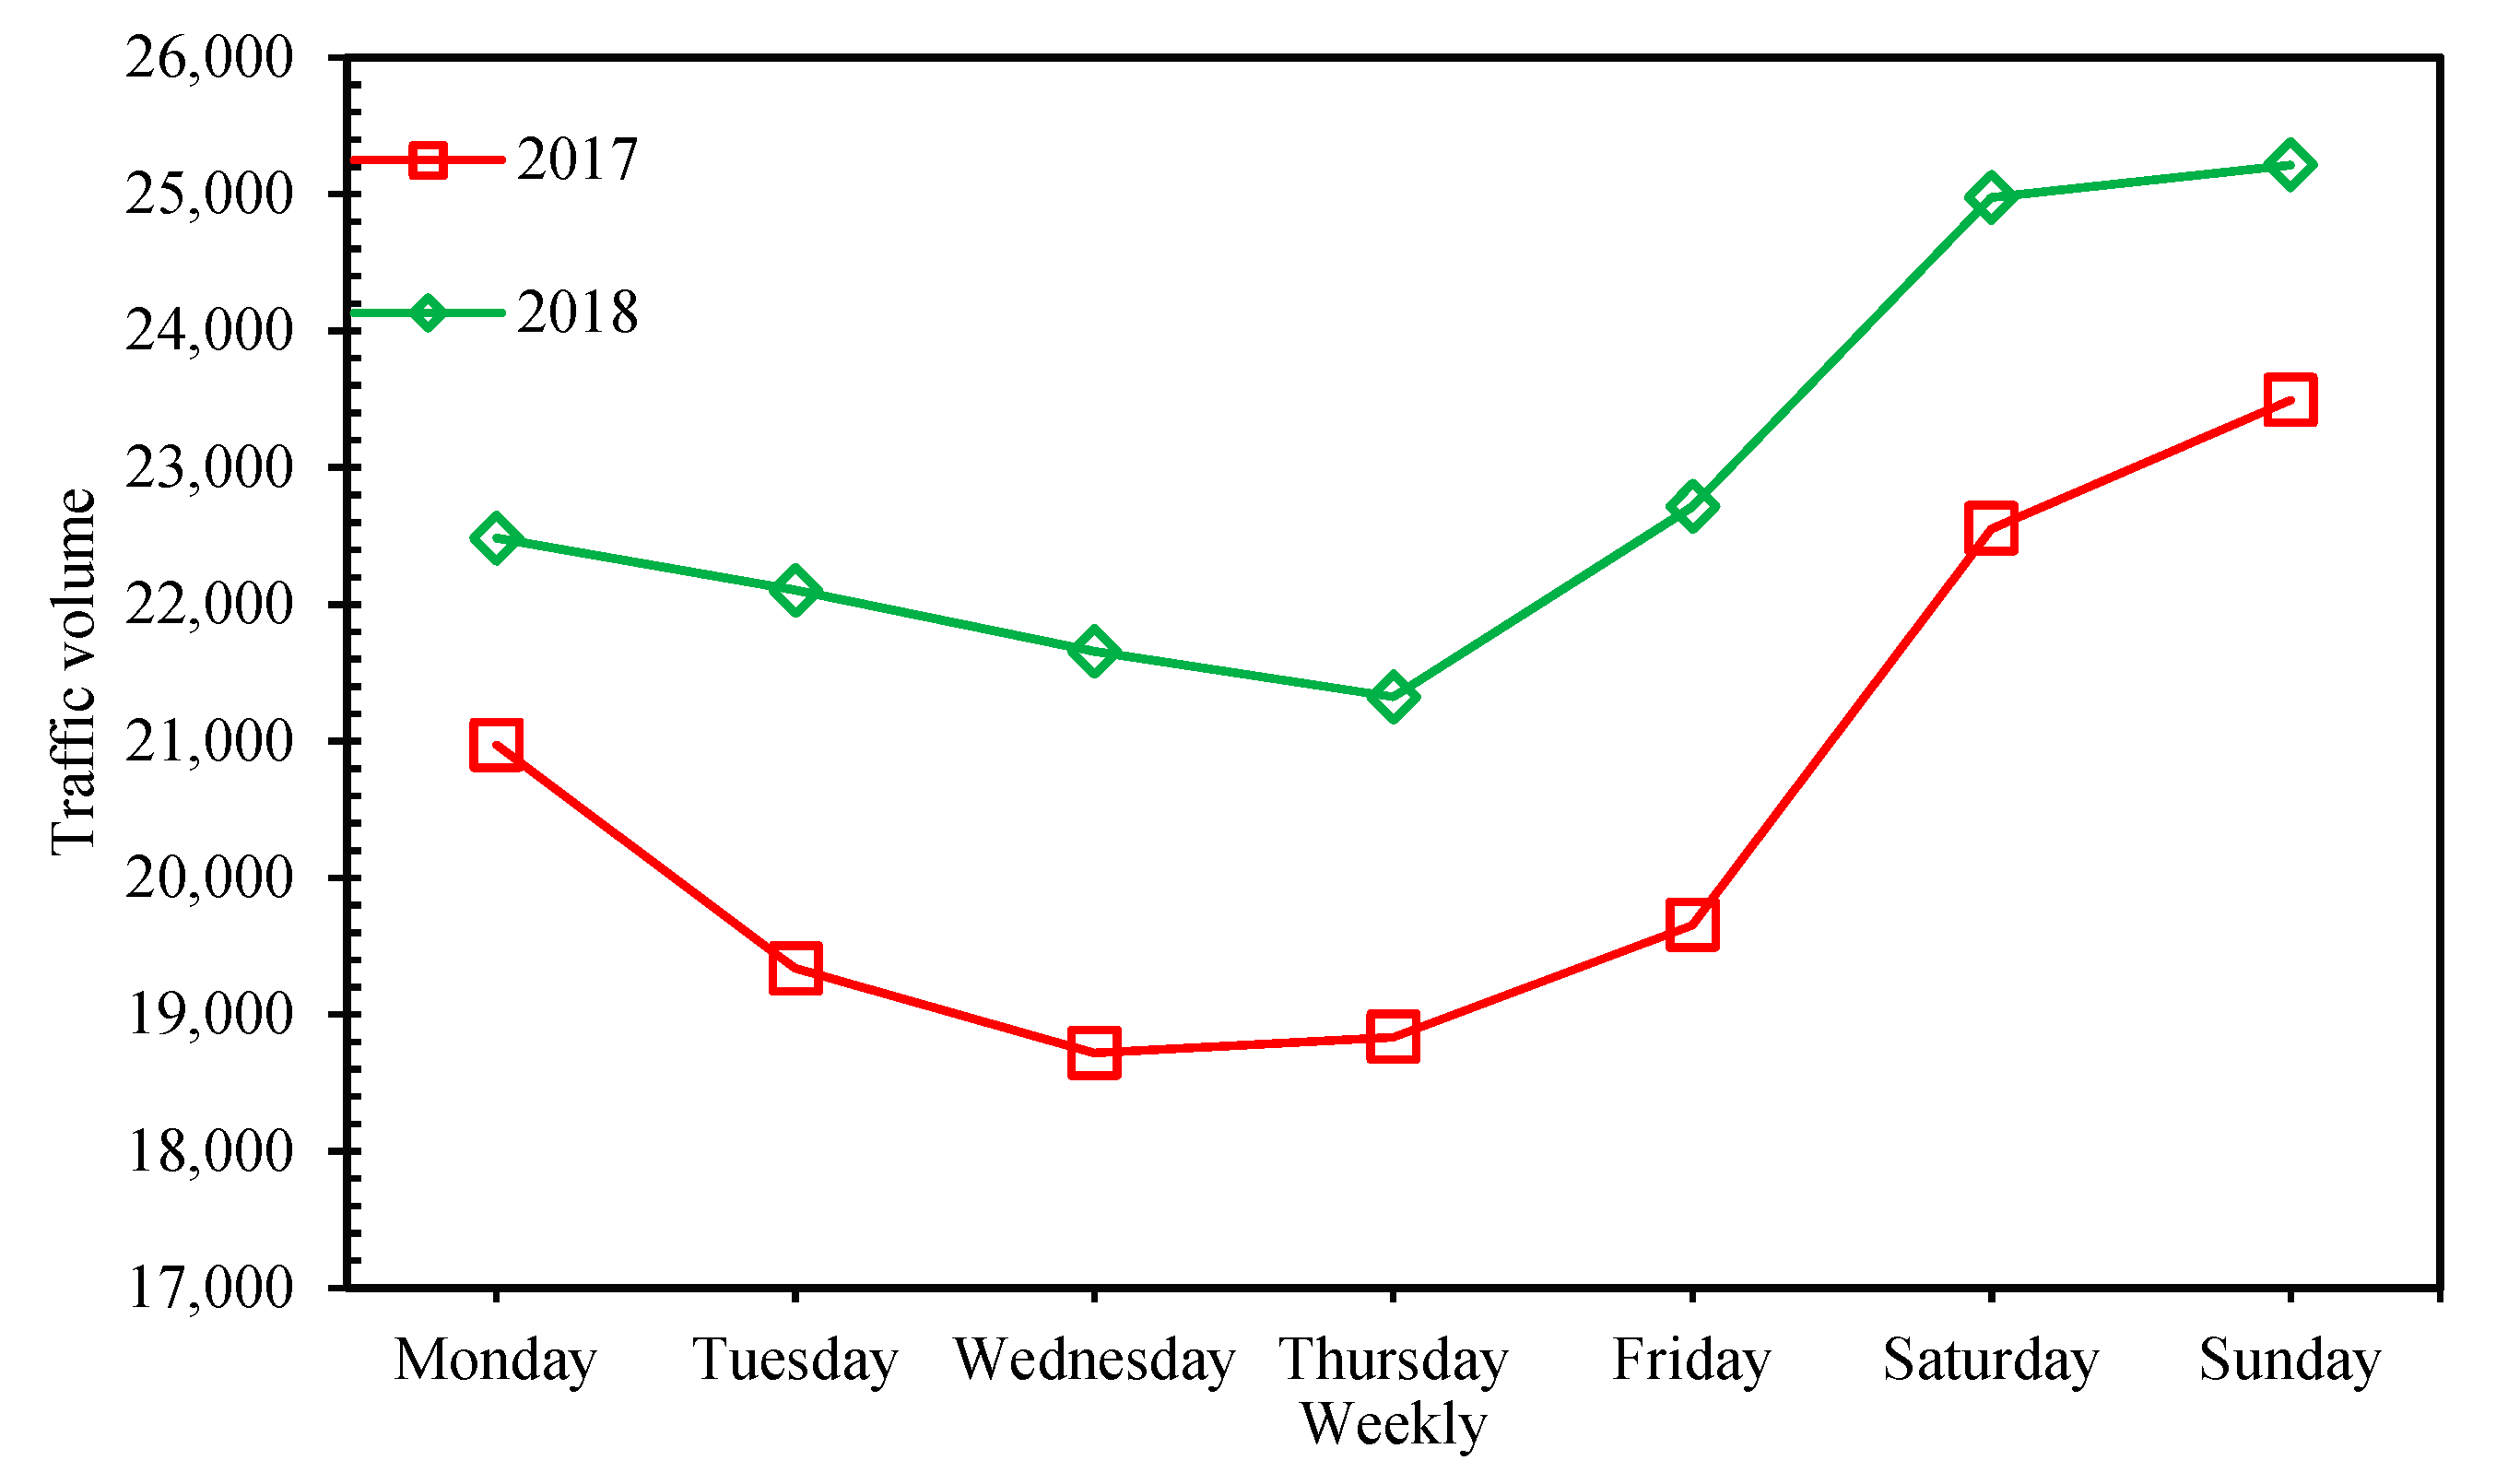
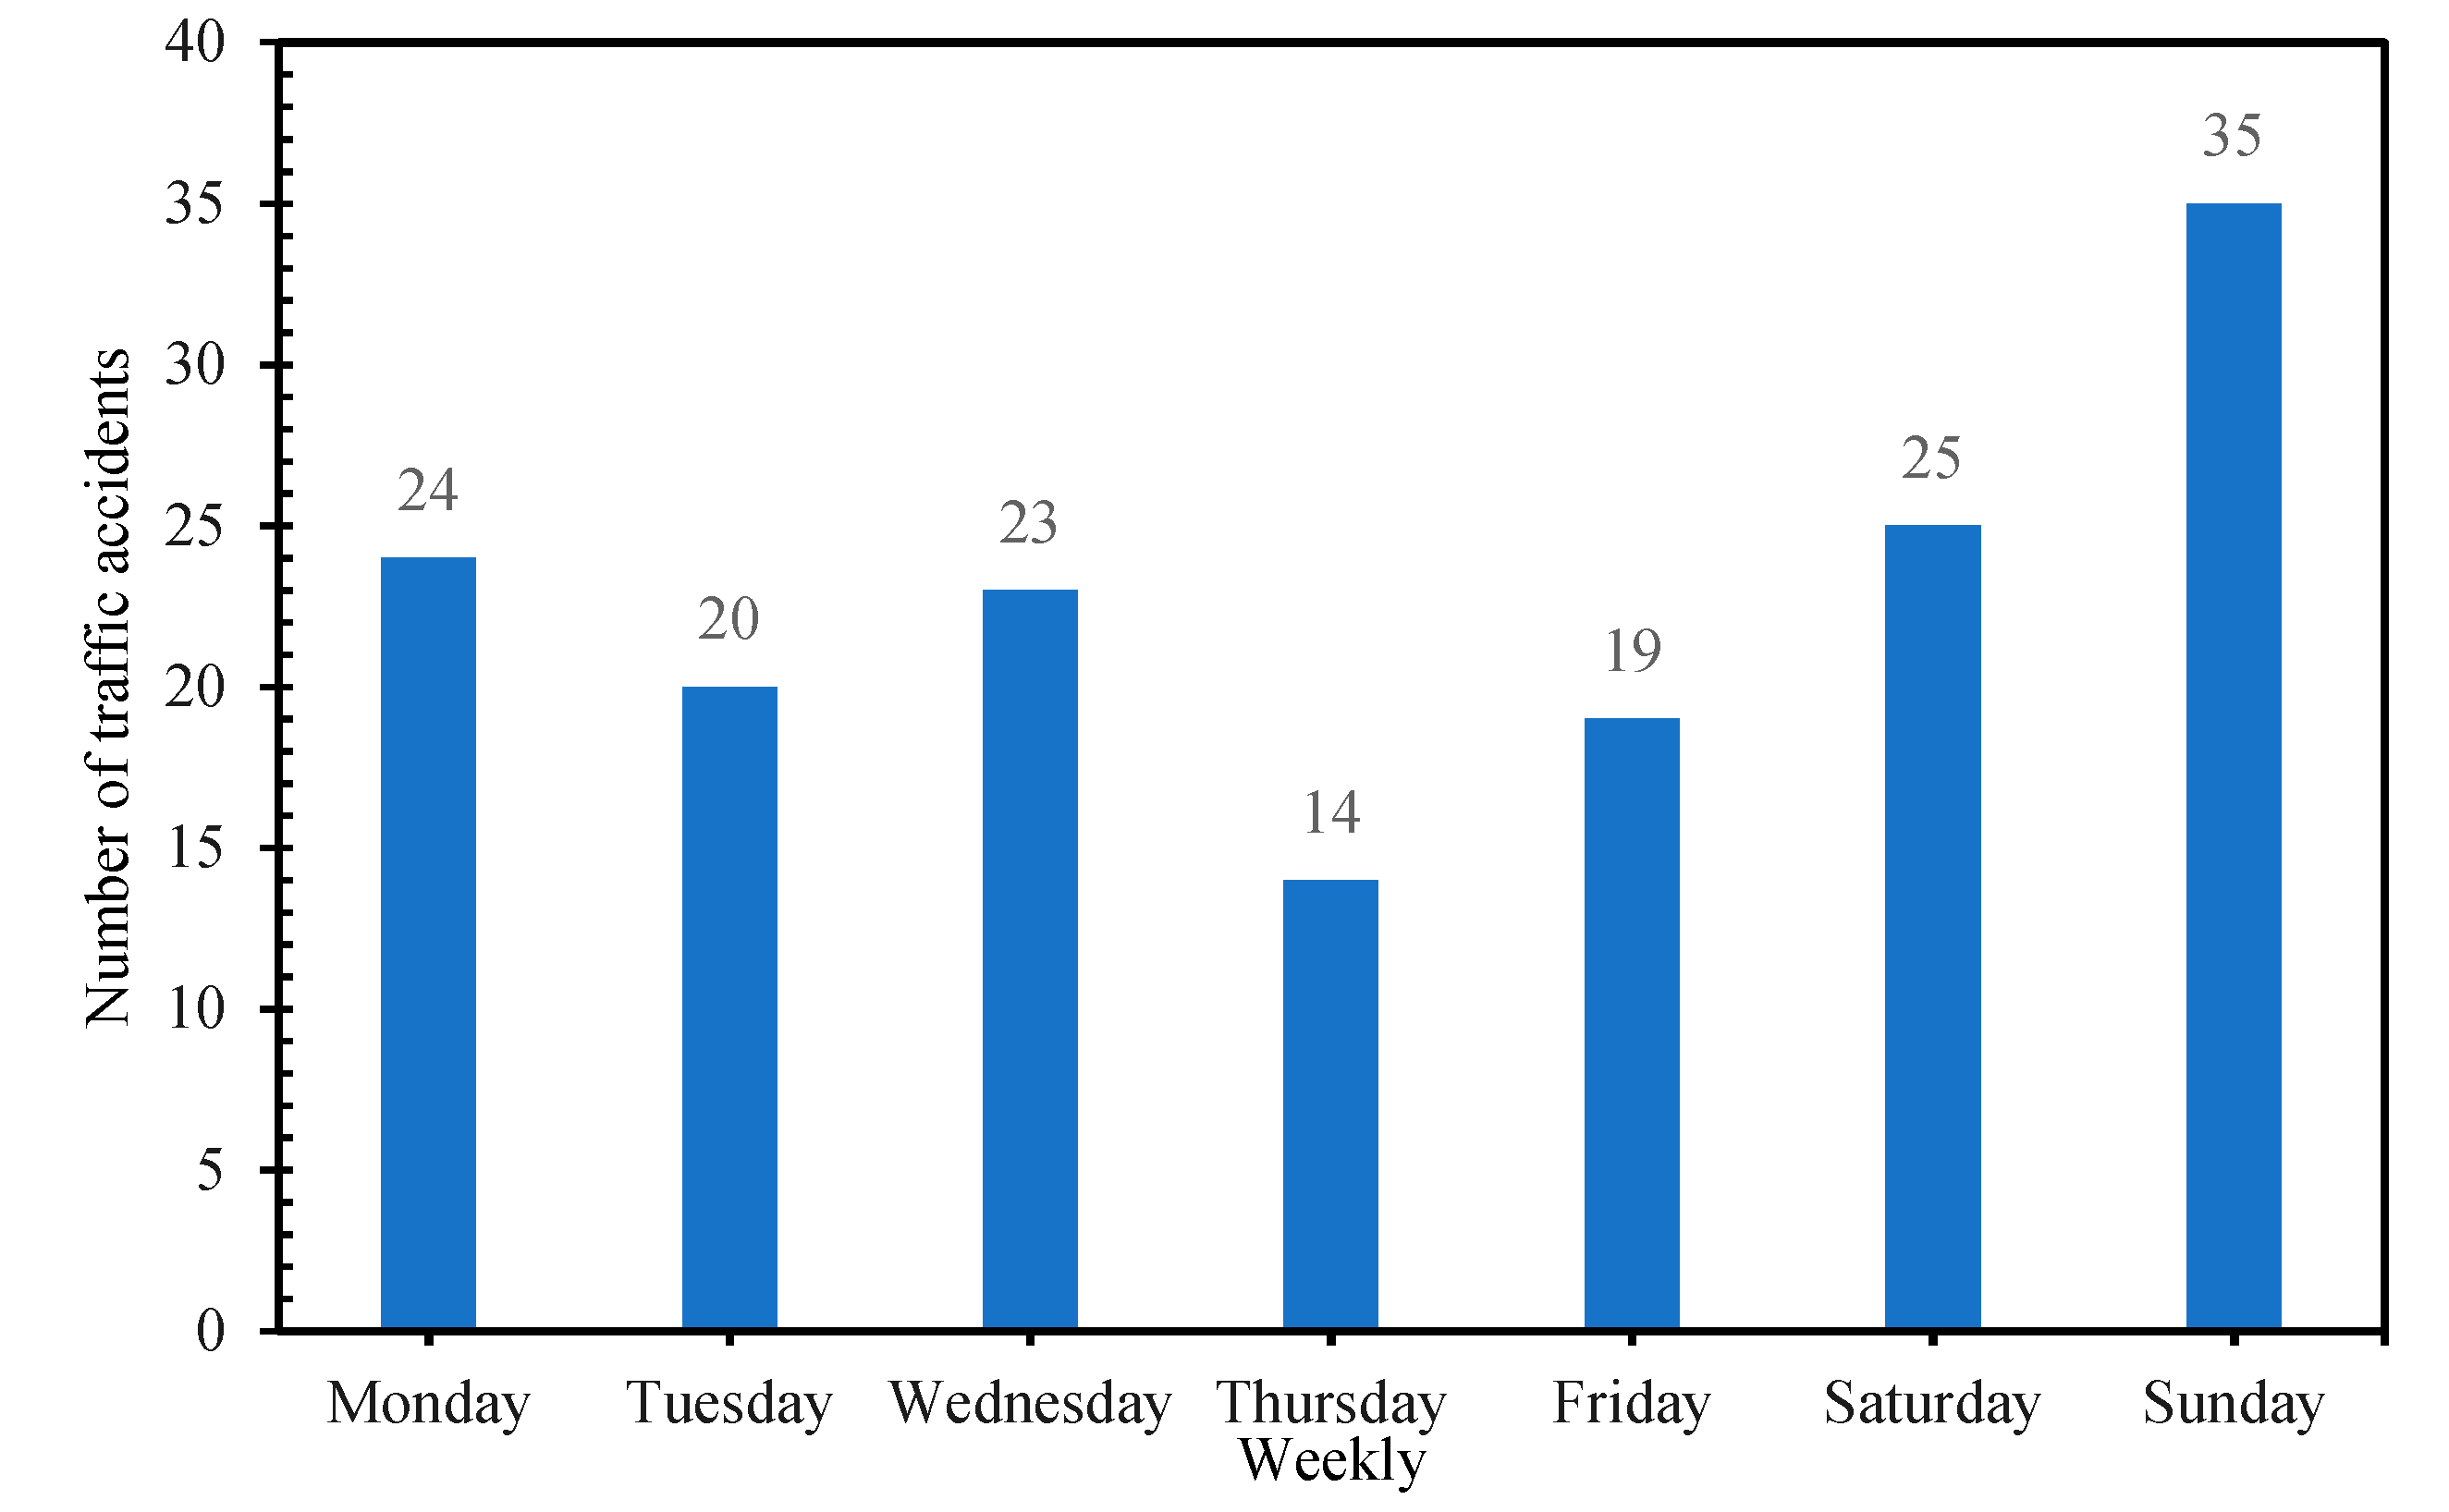
Weekly average daily distribution characteristics of accidents.
According to the traffic accident data of the Baoding Section of Zhangshi Expressway collected by the project, the distribution of weekly average daily traffic volume (WADT) and weekly average daily distribution of traffic accidents are drawn.
As can be observed from Figure 6, In 2017 and 2018, on a Sunday, the traffic volume has certain distribution characteristics. The traffic volume on weekdays was less than that on weekends, and the traffic volume rose sharply every Friday. From Monday to Thursday, the traffic volume was declining. As can be observed from Figure 7, the distribution characteristics of traffic accidents are obvious in a complete week, with the largest accident rate on Saturday and Sunday. This is primarily because Zhangshi Expressway, as the second passage of Jingshi Expressway, is responsible for sharing the traffic volume for Jingshi Expressway. Traffic volume is not much different from Monday to Thursday, but on Saturdays and Sundays, many families leave Beijing on this road. As travel activities increase, the total traffic volume becomes larger on weekends, and the probability of traffic accidents increases accordingly. Conversely, the main vehicles on this expressway were small and medium-sized passenger cars and extra-large trucks. The speed difference between the two was large, and the speed distribution was more discrete, so the incidence of traffic accidents was greatly increased.
3.
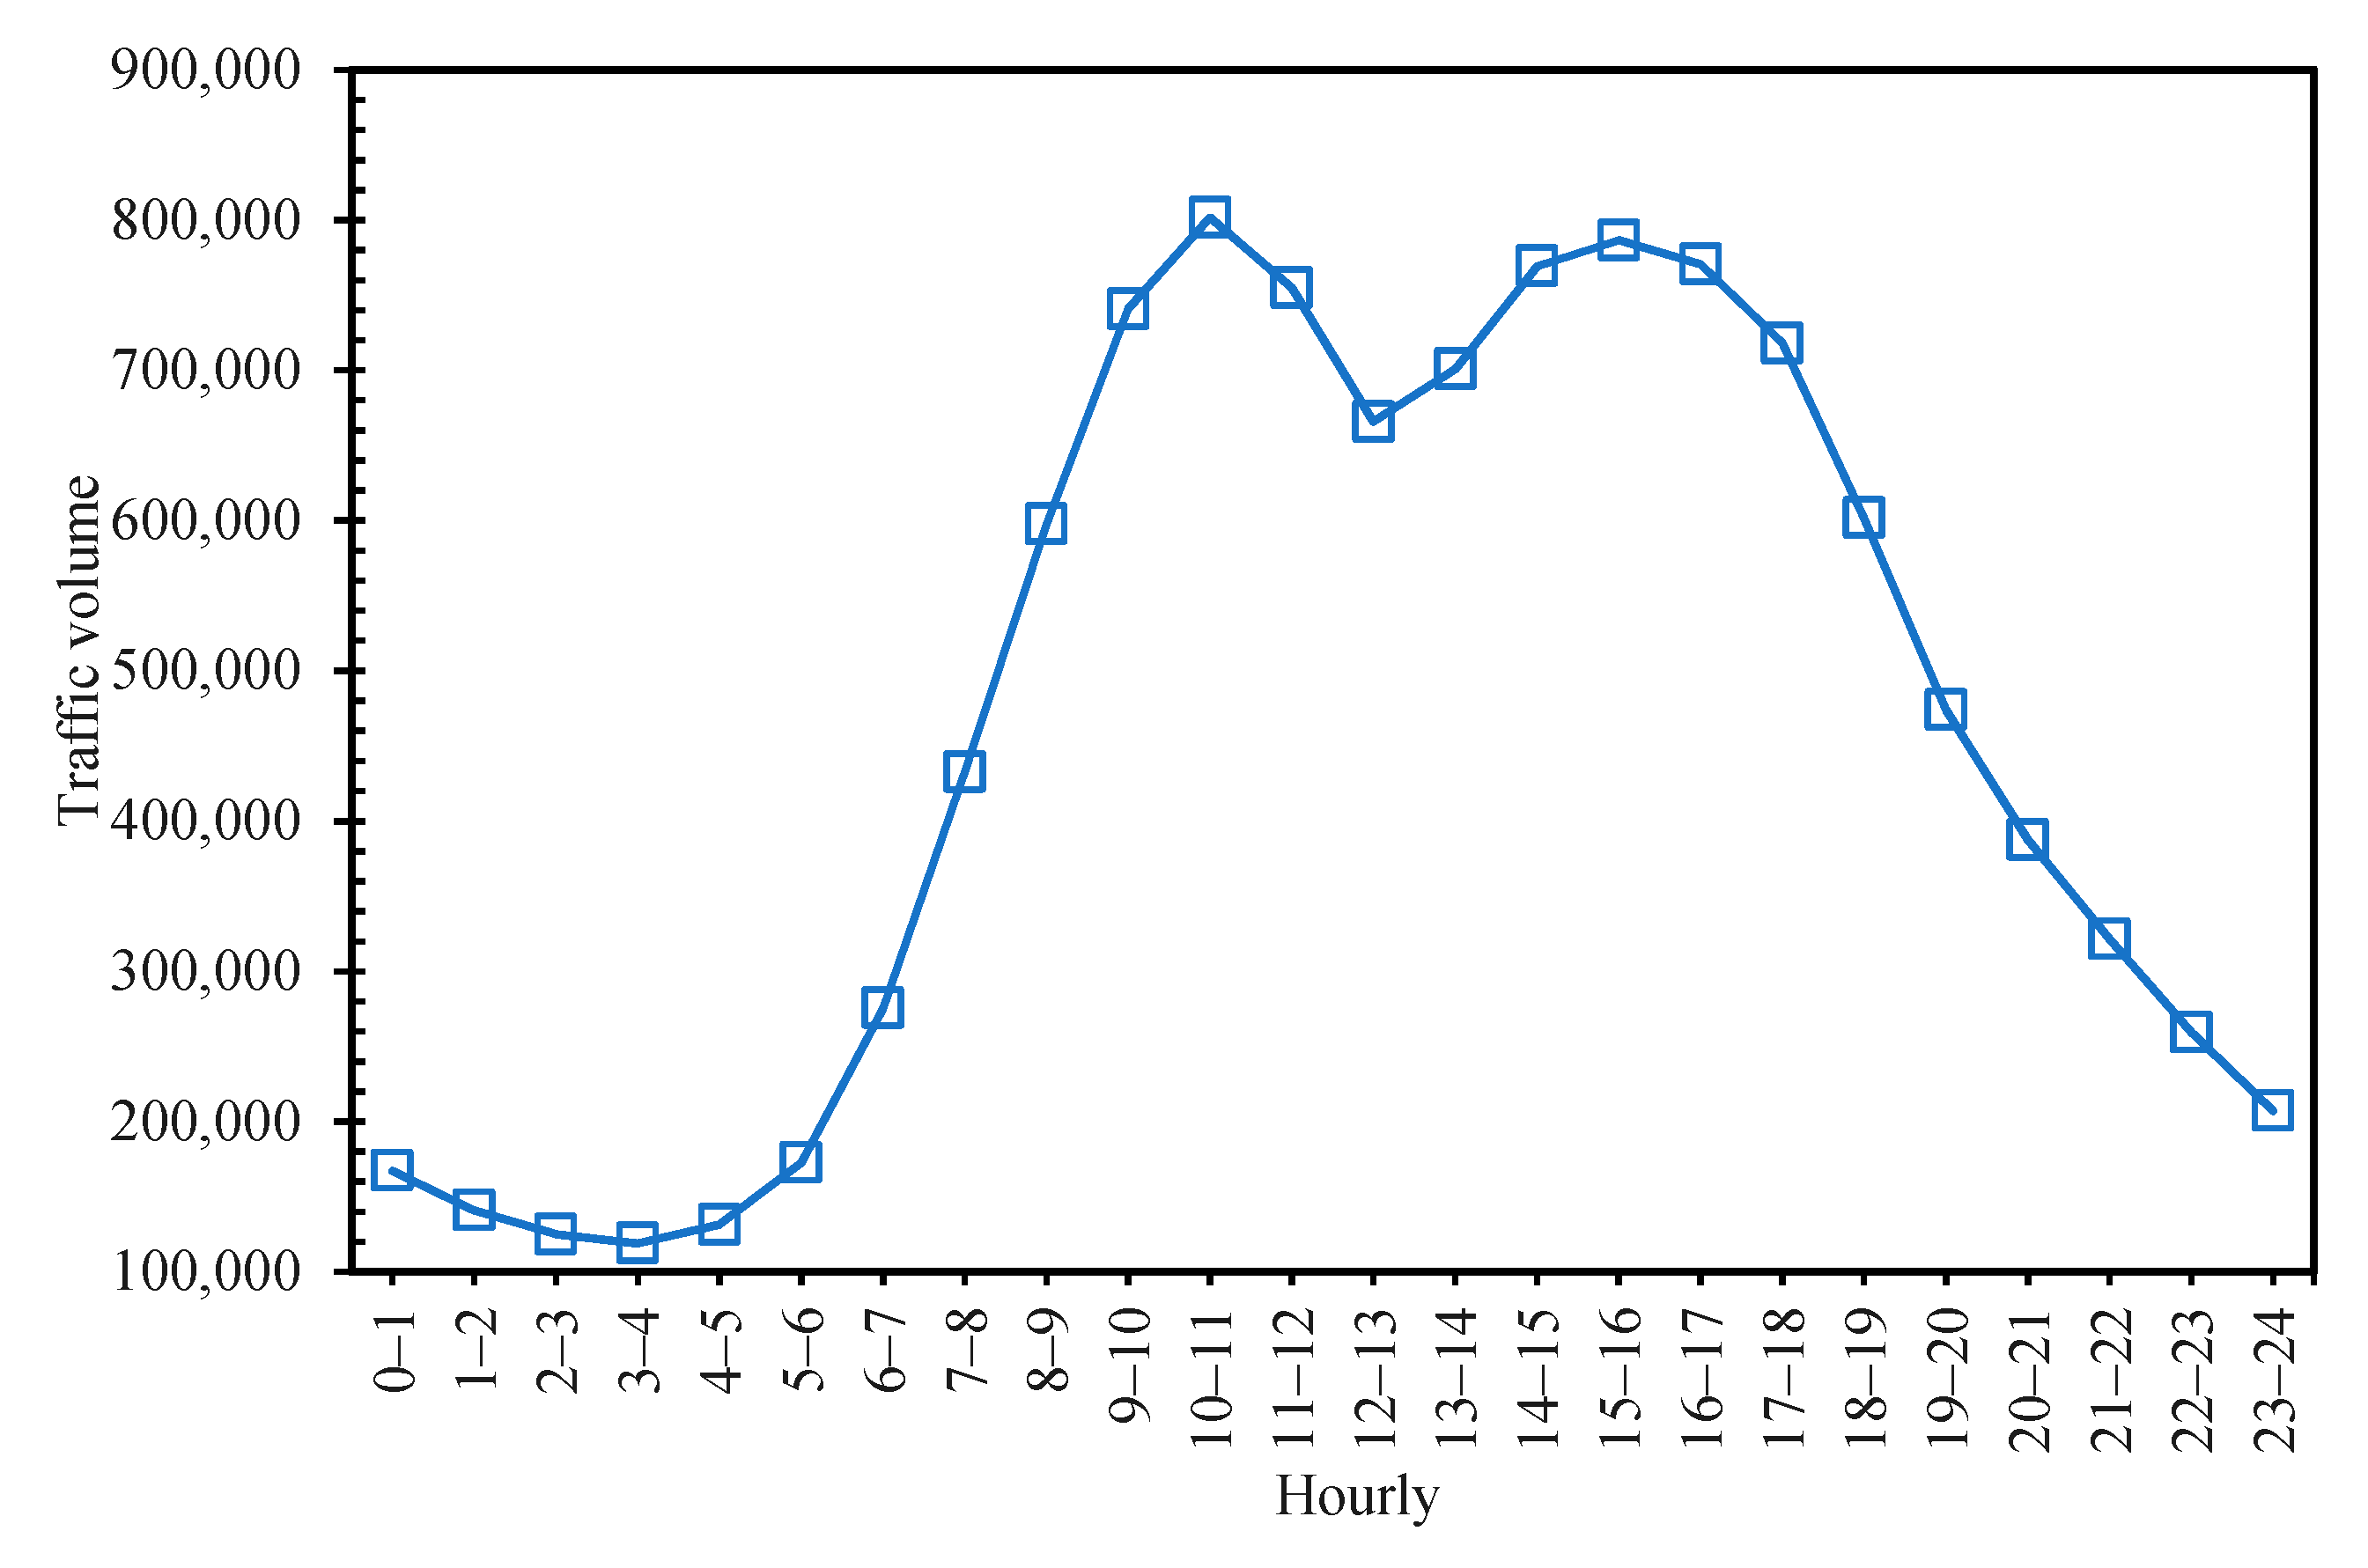
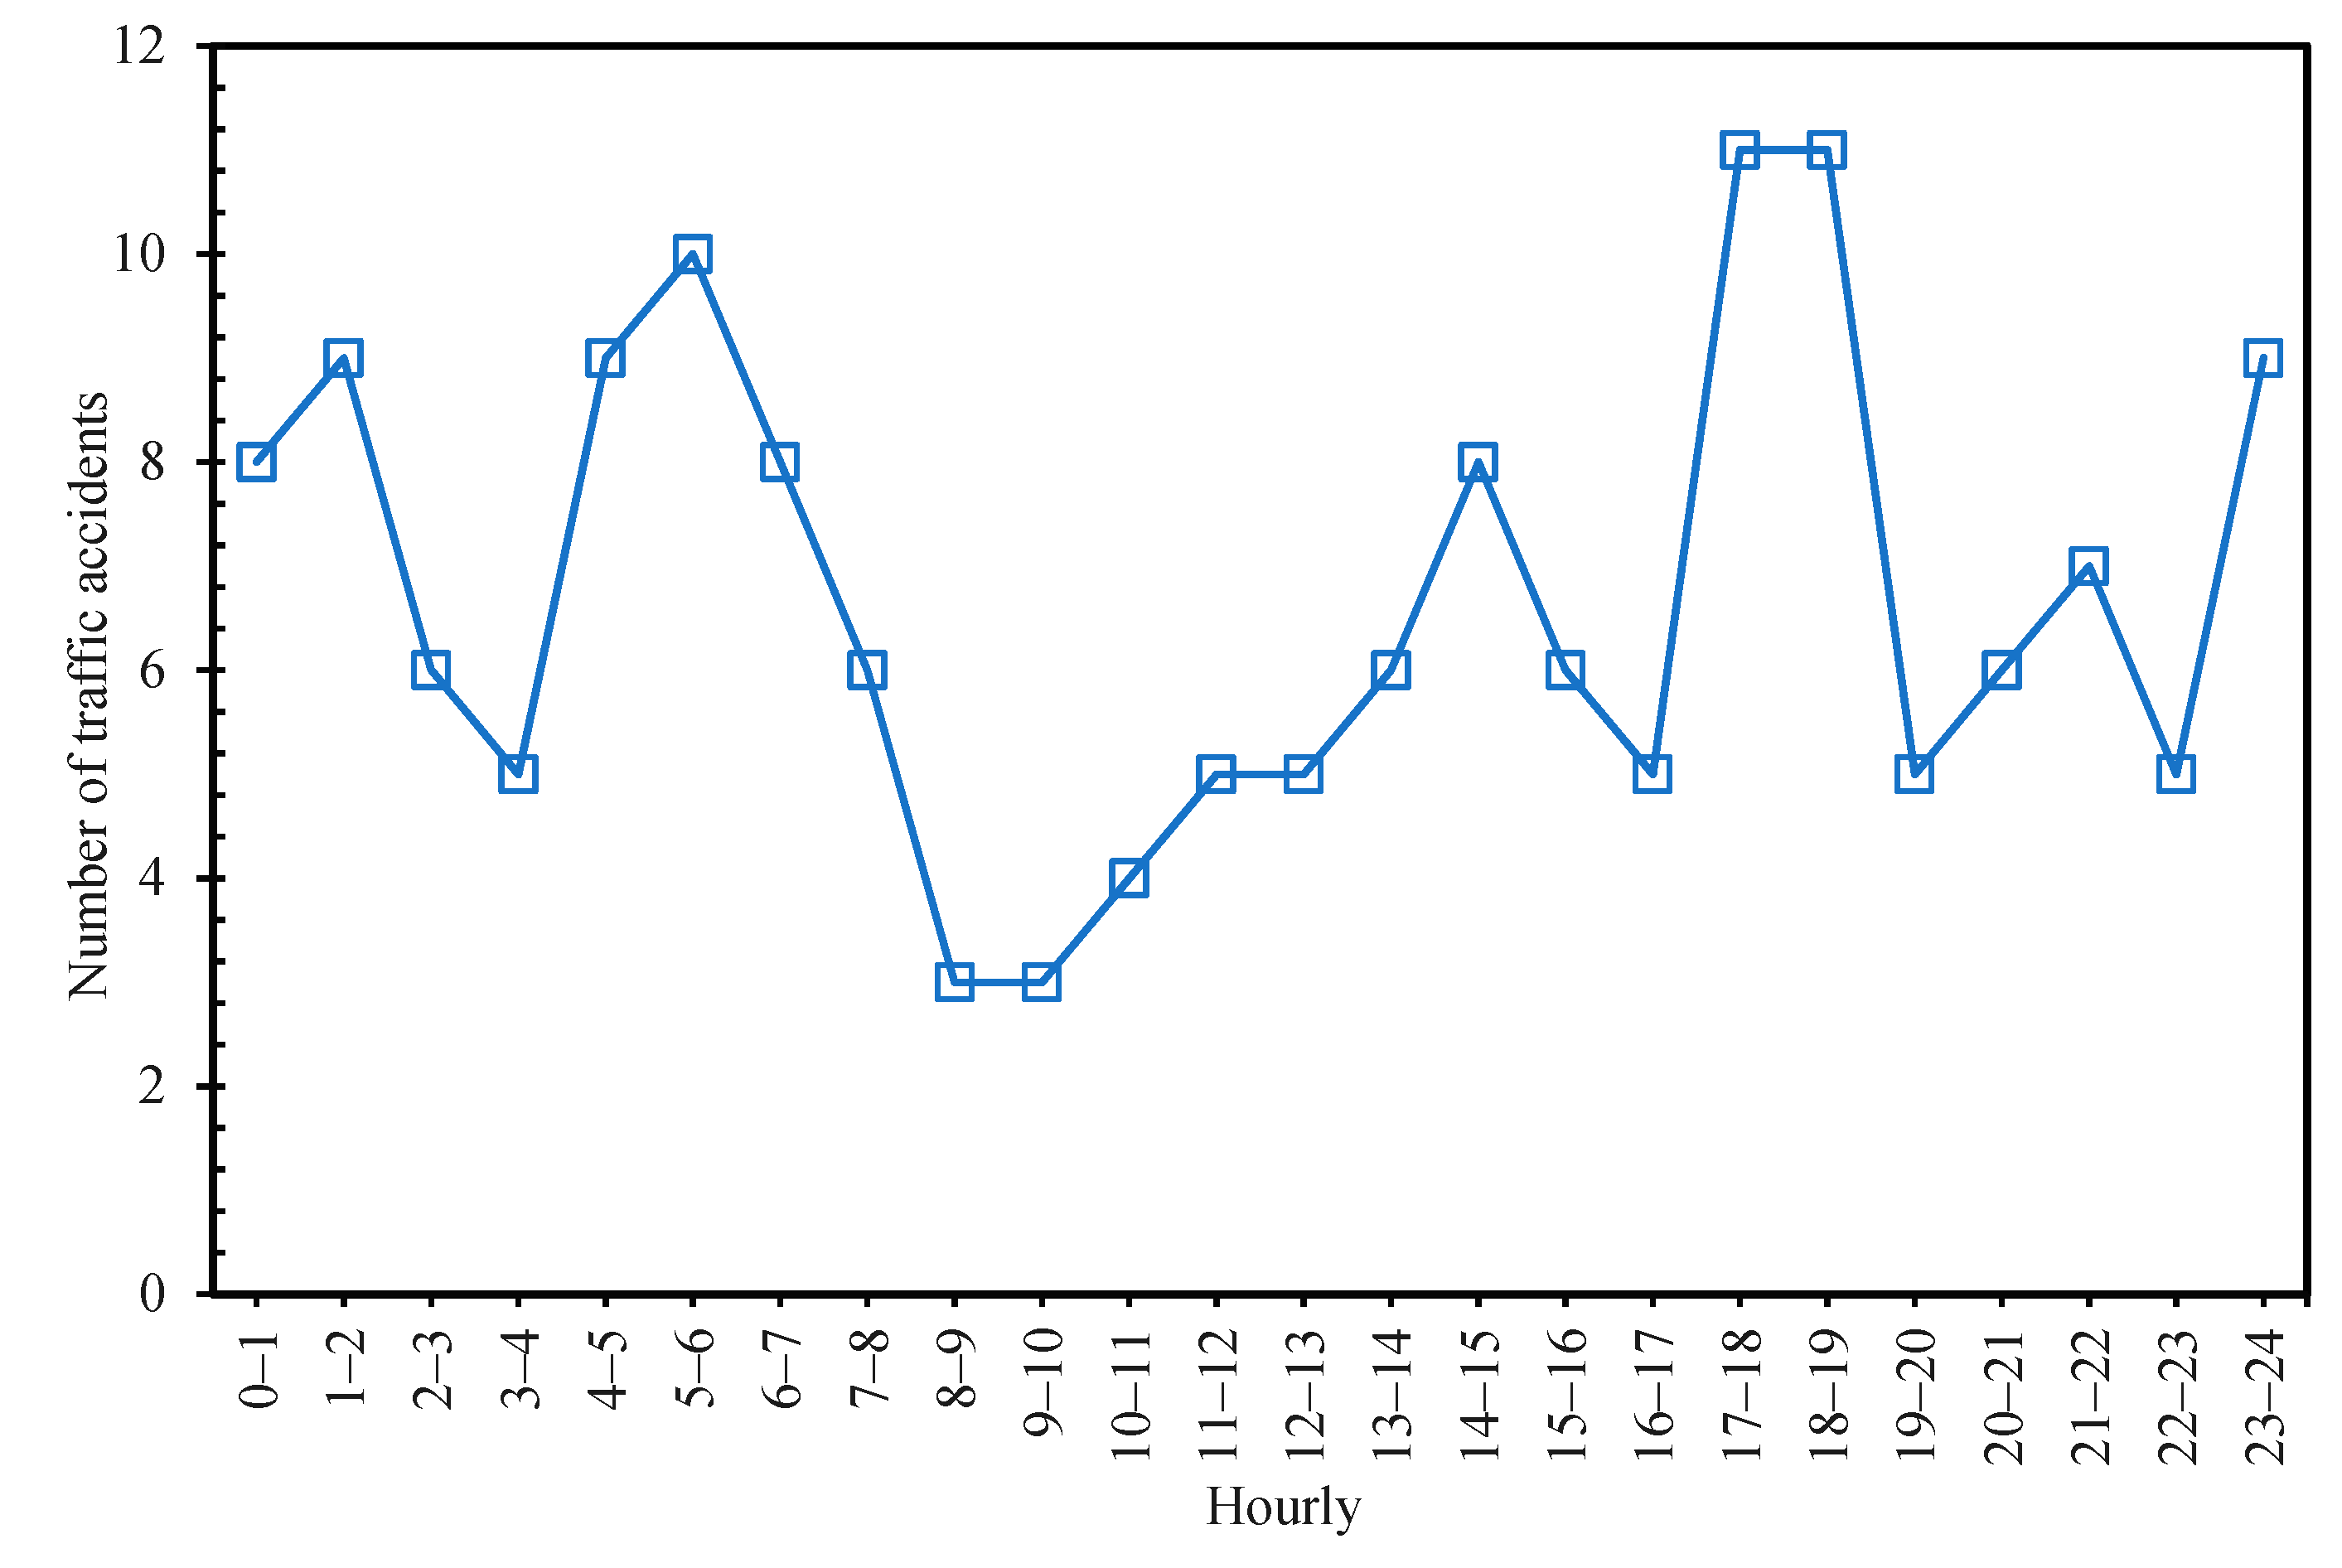
Hourly distribution characteristics of accidents.
According to the collected 24-h traffic volume data in 2018, the time-varying diagram of 24-h traffic volume is drawn, as portrayed in Figure 8. According to the traffic accident data of Baoding Section of Zhangjiakou Shijiazhuang Expressway collected by the project, the hourly traffic accident distribution of Zhangjiakou Shijiazhuang expressway is drawn, as portrayed in Figure 9.
As can be observed from Figure 8, during the day, the traffic volume varies with the time of day, with the primary trend being an upward and then a downward trend. The traffic volume was low during the early morning hours. Between 6:00 to 11:00, the traffic volume rises sharply and which is the peak travel time. It was relatively flat from 11:00 to 18:00. As can be observed from Figure 9, the hourly distribution of traffic accidents has obvious peak periods, which were 4:00 to 6:00, 13:00 to 16:00, 17:00 to 19:00, and 23:00 to 1:00. These four time periods accounted for 54.38% of total traffic accidents in the whole day. The primary reasons are as follows:
➀ During the period from 23:00 to 1:00, drivers are prone to drowsiness, lack of concentration, and unclear vision caused by the external environment, which is likely to cause road traffic accidents.
➁ During the period from 4:00 to 6:00 was the time when the driver was most fatigued. Coupled with the poor lighting conditions, the driver’s physical and psychological conditions were in the most unfavorable state driving, and traffic accidents were very likely to occur.
➂ During the period from 13:00 to 16:00, the traffic volume accounts for a large proportion, and the sunlight intensity was the largest during this period, and the illuminance inside and outside the tunnel varies greatly. The driver’s ability to adapt to the light and darkness of tunnel entrances and exits was reduced, and the “white hole” and “black hole” effects were very strong, which can easily lead to traffic accidents.
➃ The period from 17:00 to 19:00 was the peak period of traffic volume, and this traffic volume accounts for 12% of the traffic volume of the entire day. The large traffic volume leads to a high probability of traffic accidents.

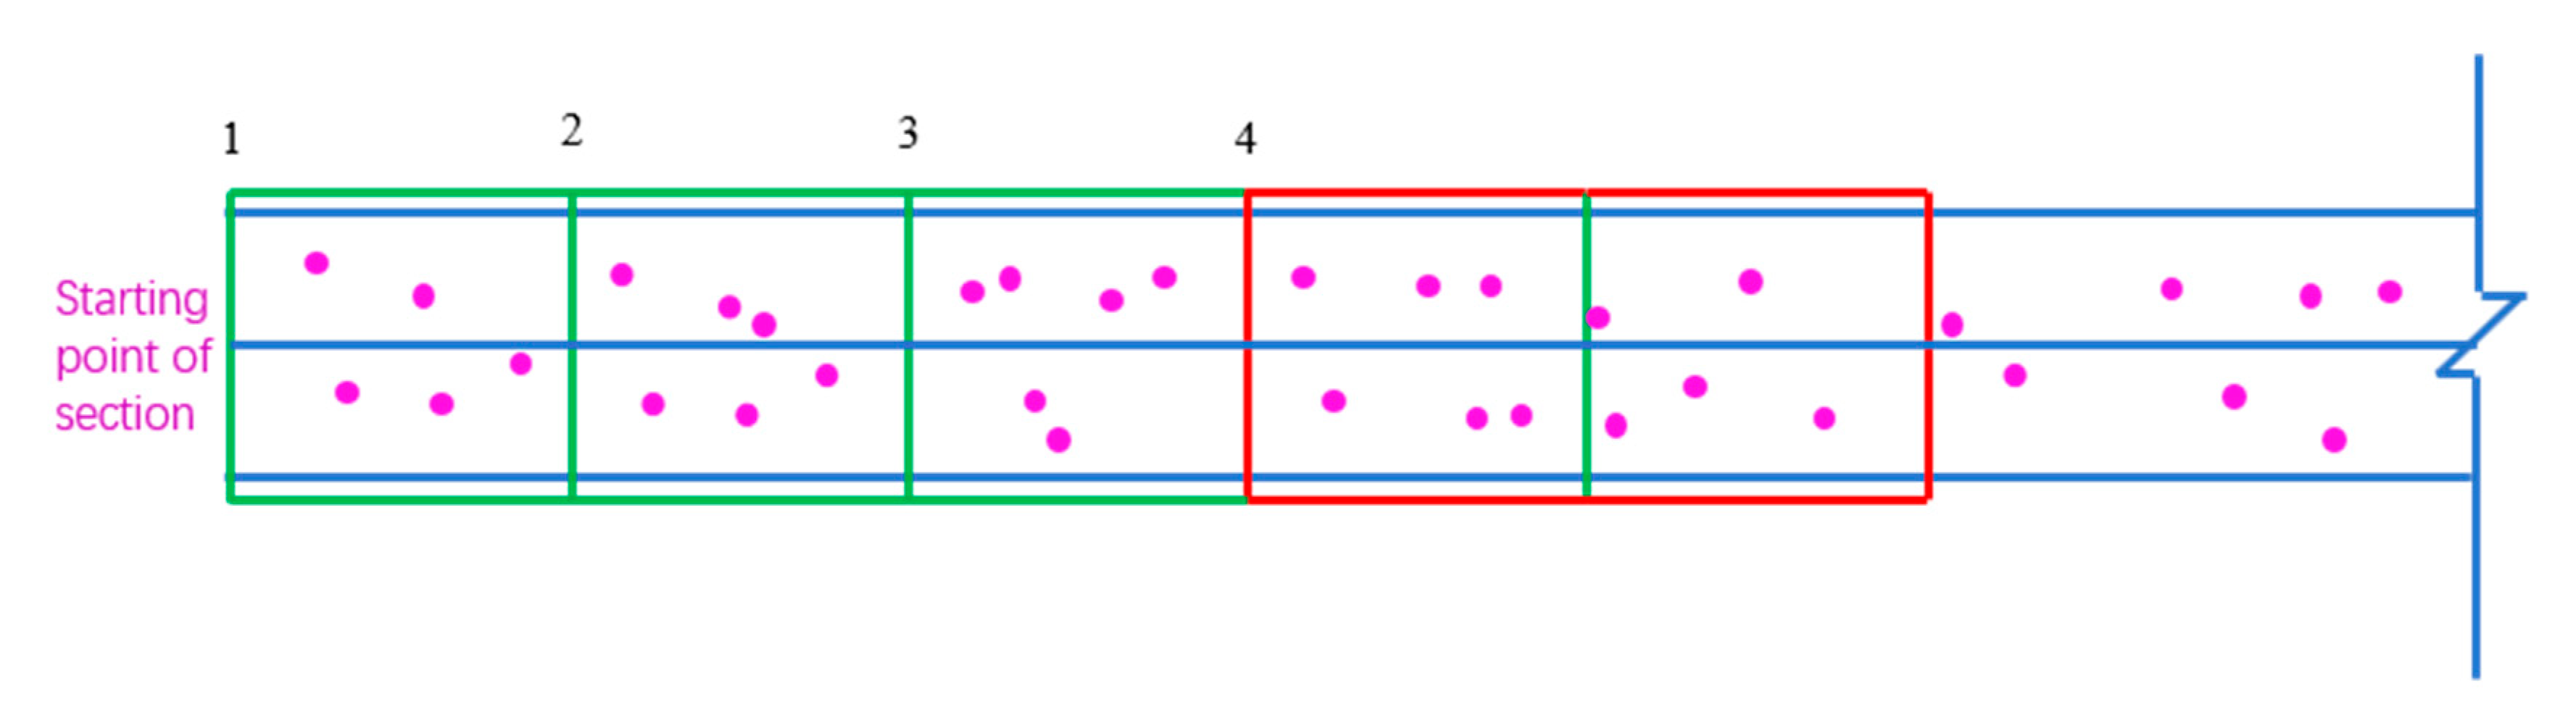
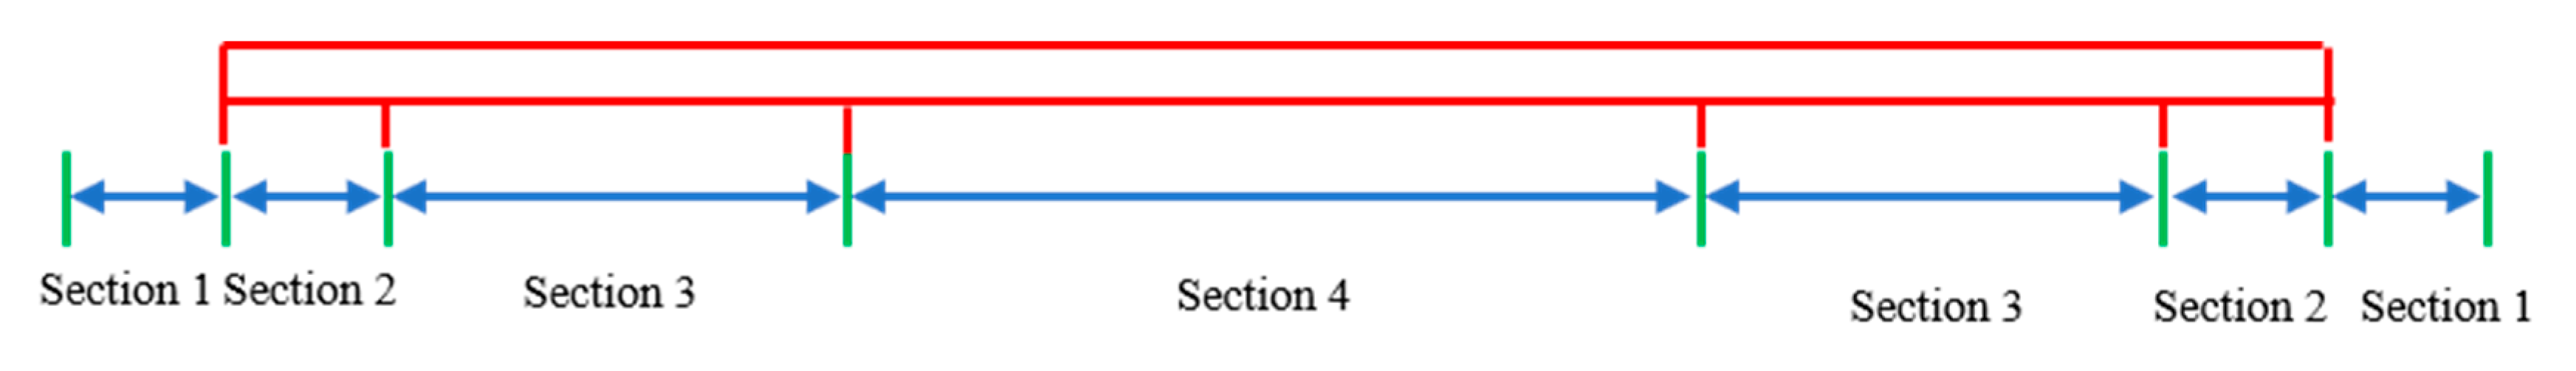
3.1.2. Spatial Distribution Characteristics of Accidents

The spatial distribution characteristics of accidents mainly reflect the distribution of accidents in various spatial forms. By analyzing the spatial distribution characteristics of traffic accidents in long downhill tunnels of mountain expressways, the specific distribution of accident characteristics in space is clarified, to prevent the occurrence of traffic accidents and avoid the loss of people’s lives and property.
It was assumed that the drivers’ driving behavior was symmetrical in the tunnel section. The highway tunnel was divided into four sections according to the drivers’ driving characteristics, as portrayed in Figure 10.
In Figure 10, Section 1 was the area 100 m ahead of the tunnel entrance; Section 2 was the area from the tunnel entrance to 100 m inside the tunnel; Section 3 was the transition section with a length of 300 m, and the rest of the road sections composed Section 4.
According to the data of traffic accidents in the Baoding section of Zhangshi Expressway collected by the project, the spatial distribution of traffic accidents in the long downhill tunnel section of Zhangshi Expressway was obtained as portrayed in Table 2.
According to Table 2, the following conclusions can be drawn:
(1)
Accidents in the Baoding section of Zhangshi Expressway were densely distributed in Section 4, accounting for 46.67% of the entire section. The primary reason was that the length of the tunnel in this section was too long, causing the driver to drive in an extremely monotonous driving environment for a long time, which can easily affect the driver’s vision and psychological state, resulting in traffic accidents.
(2)
From the overall analysis results, it may be concluded that the accident frequency in Section 1 and Section 3 was much higher than the overall average level, particularly in Section 1; the accident frequency was 2 to 4 times that of other sections. As there was a large difference in illuminance inside and outside the tunnel when the vehicle passed through the entrance and exit area of the tunnel, the driver was affected by the “black hole” and “white hole” effect, and there was a short exclusion stage for the sudden change of illuminance, resulting in the loss of line of sight and the inability to receive external environmental information in a short time. Concurrently, due to the influence of the environment, there was a sudden change in the pavement properties at the tunnel entrance and exit, and there was a large difference in the adhesion coefficient between adjacent pavements. The driver may have lost control of the vehicle due to the sudden change of pavement properties, resulting in the phenomenon of a vehicle skidding.
(3)
From the data of Zijingguan tunnel 1, Yunmengshan tunnel 1 and other sections, it can be observed that with the increase of the length of the tunnel itself, the number of accidents demonstrates a slight downward trend, but when the length of the tunnel increases to more than 2000 m, the number of accidents demonstrates a significant upward trend.

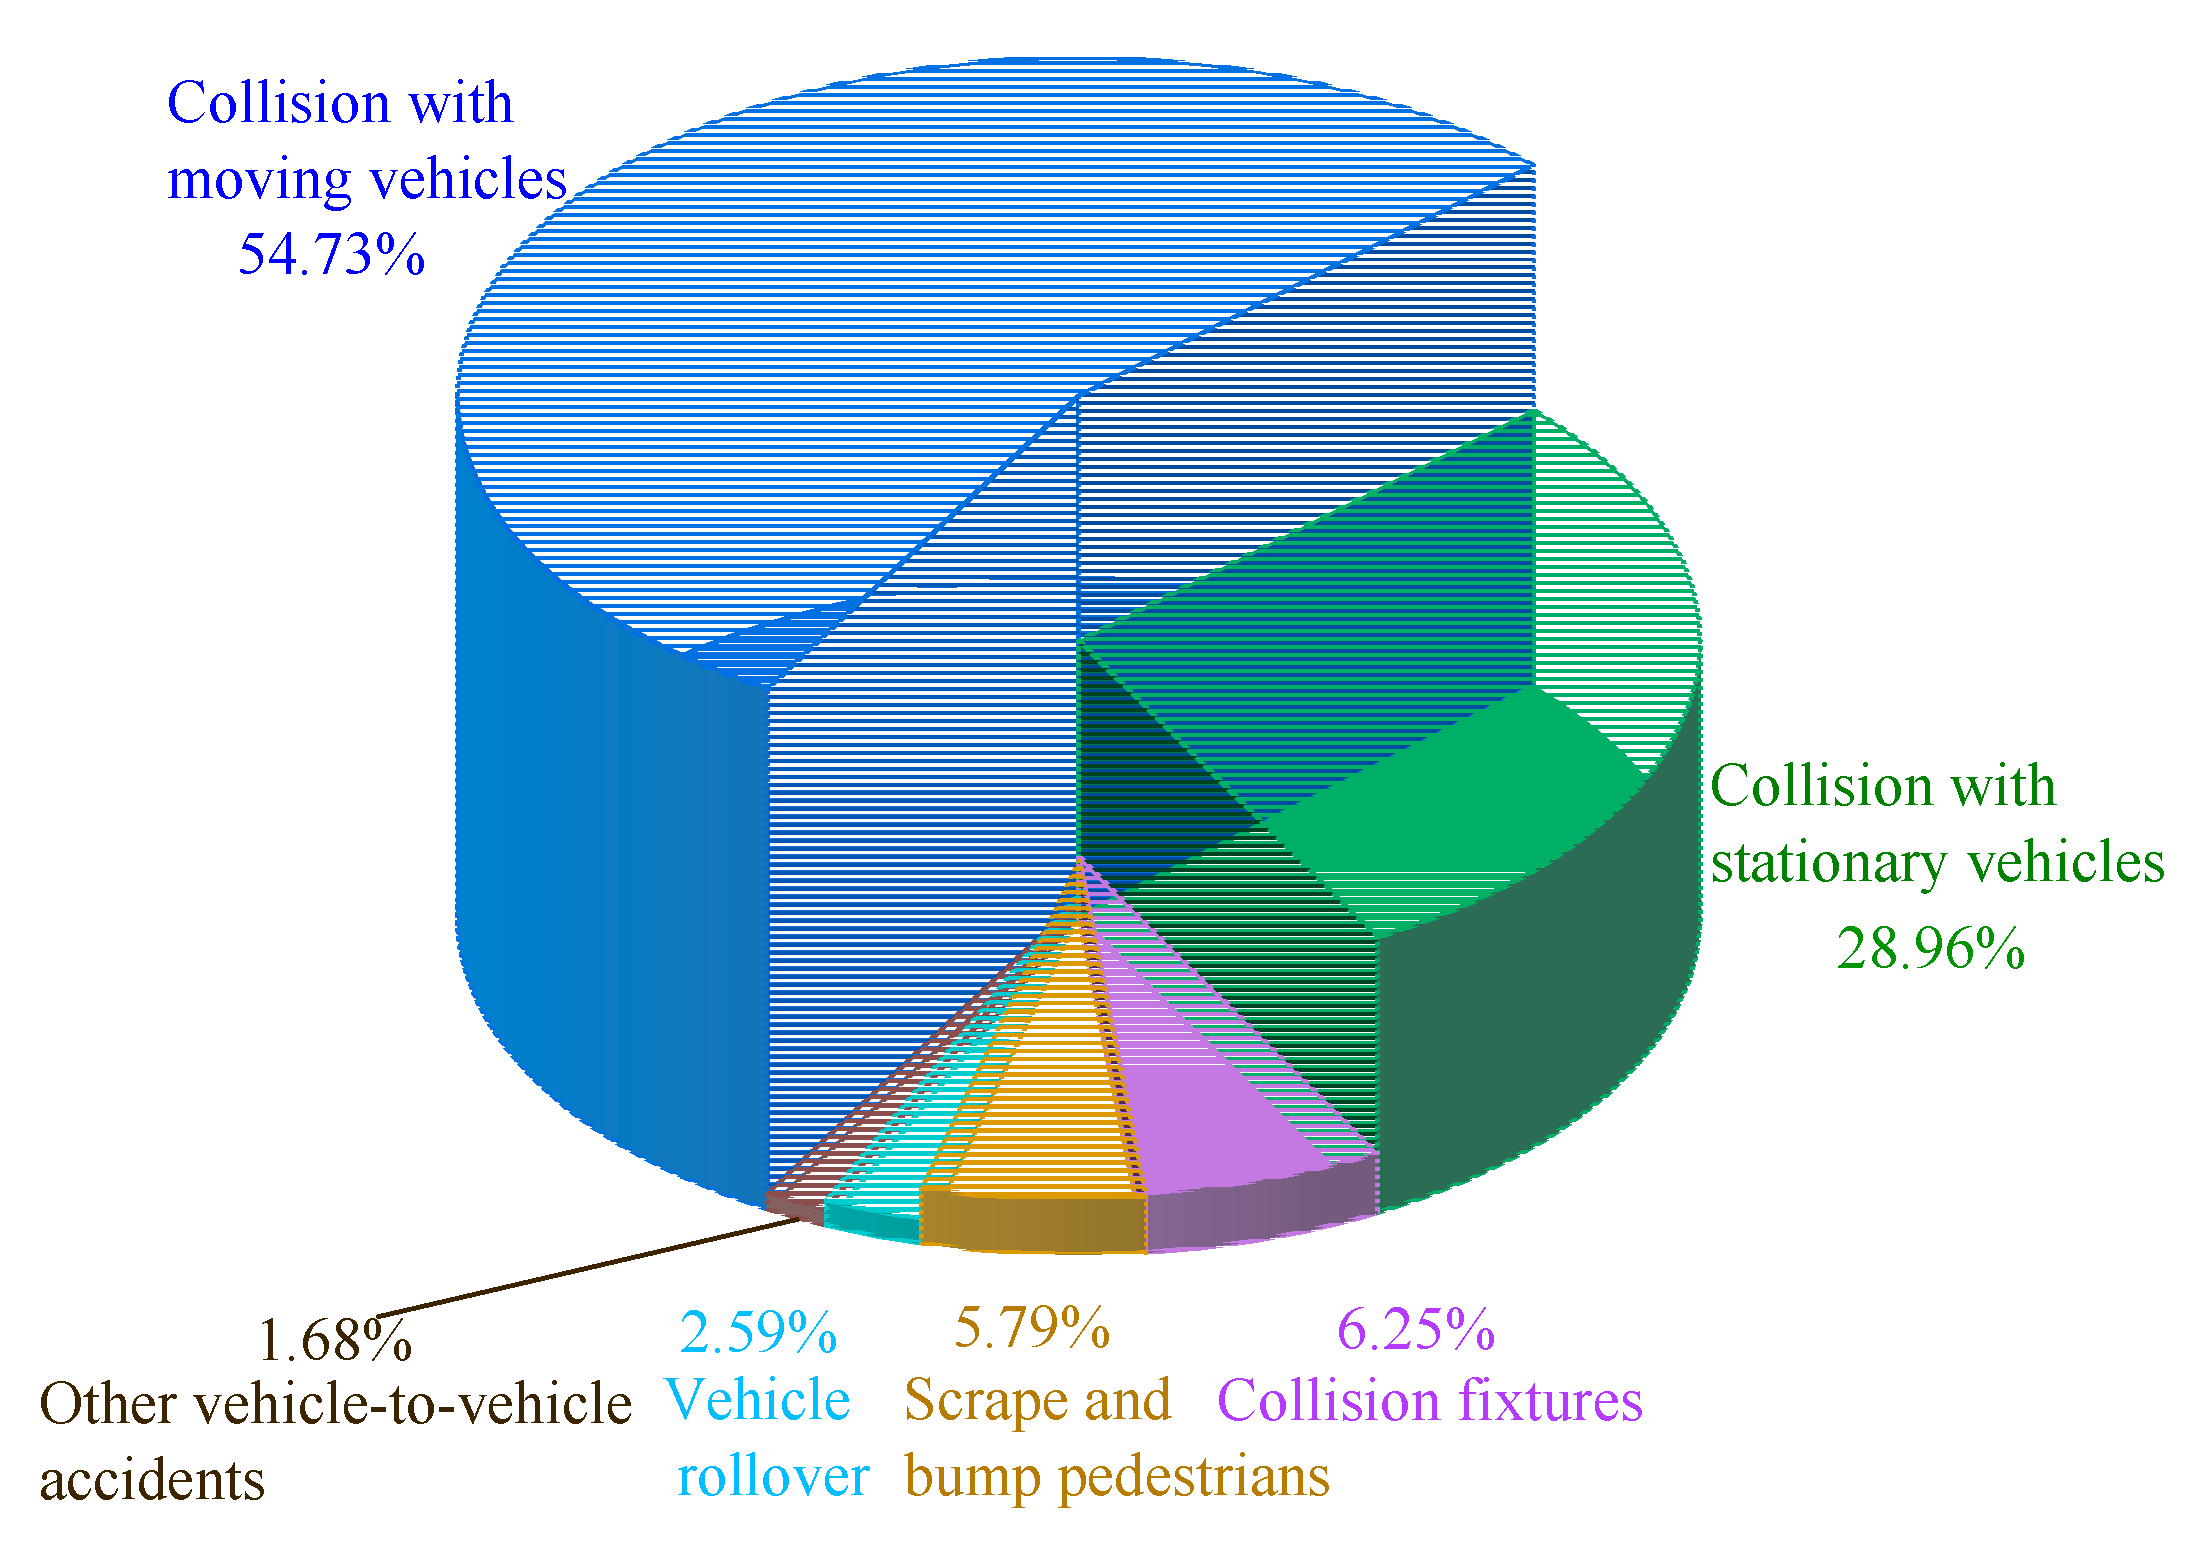
3.1.3. Form Distribution Characteristics of Accidents

According to the statistical data of traffic accidents in the Baoding section of Zhangshi Expressway from 2013 to 2018, the distribution of traffic accidents formed in the long downhill tunnel section of Zhangshi Expressway is drawn in Figure 11.
As can be observed from Figure 11, traffic accidents were primarily caused by collision with moving vehicles, followed by collision with stationary vehicles, accounting for 54.73% and 28.96%, respectively. Generally, the light in the tunnel was dark and the field of vision was narrow. Coupled with the single driving environment in the tunnel, the driver’s sensitivity to the speed of the vehicle was reduced, and it was likely to continue to accelerate and overspeed. If the driver found that there was an emergency in the vehicle ahead and temporarily braked or stopped, the vehicle would be too fast to complete the complete braking process in a short time and distance, so as to collide with the vehicle ahead and cause accidents.

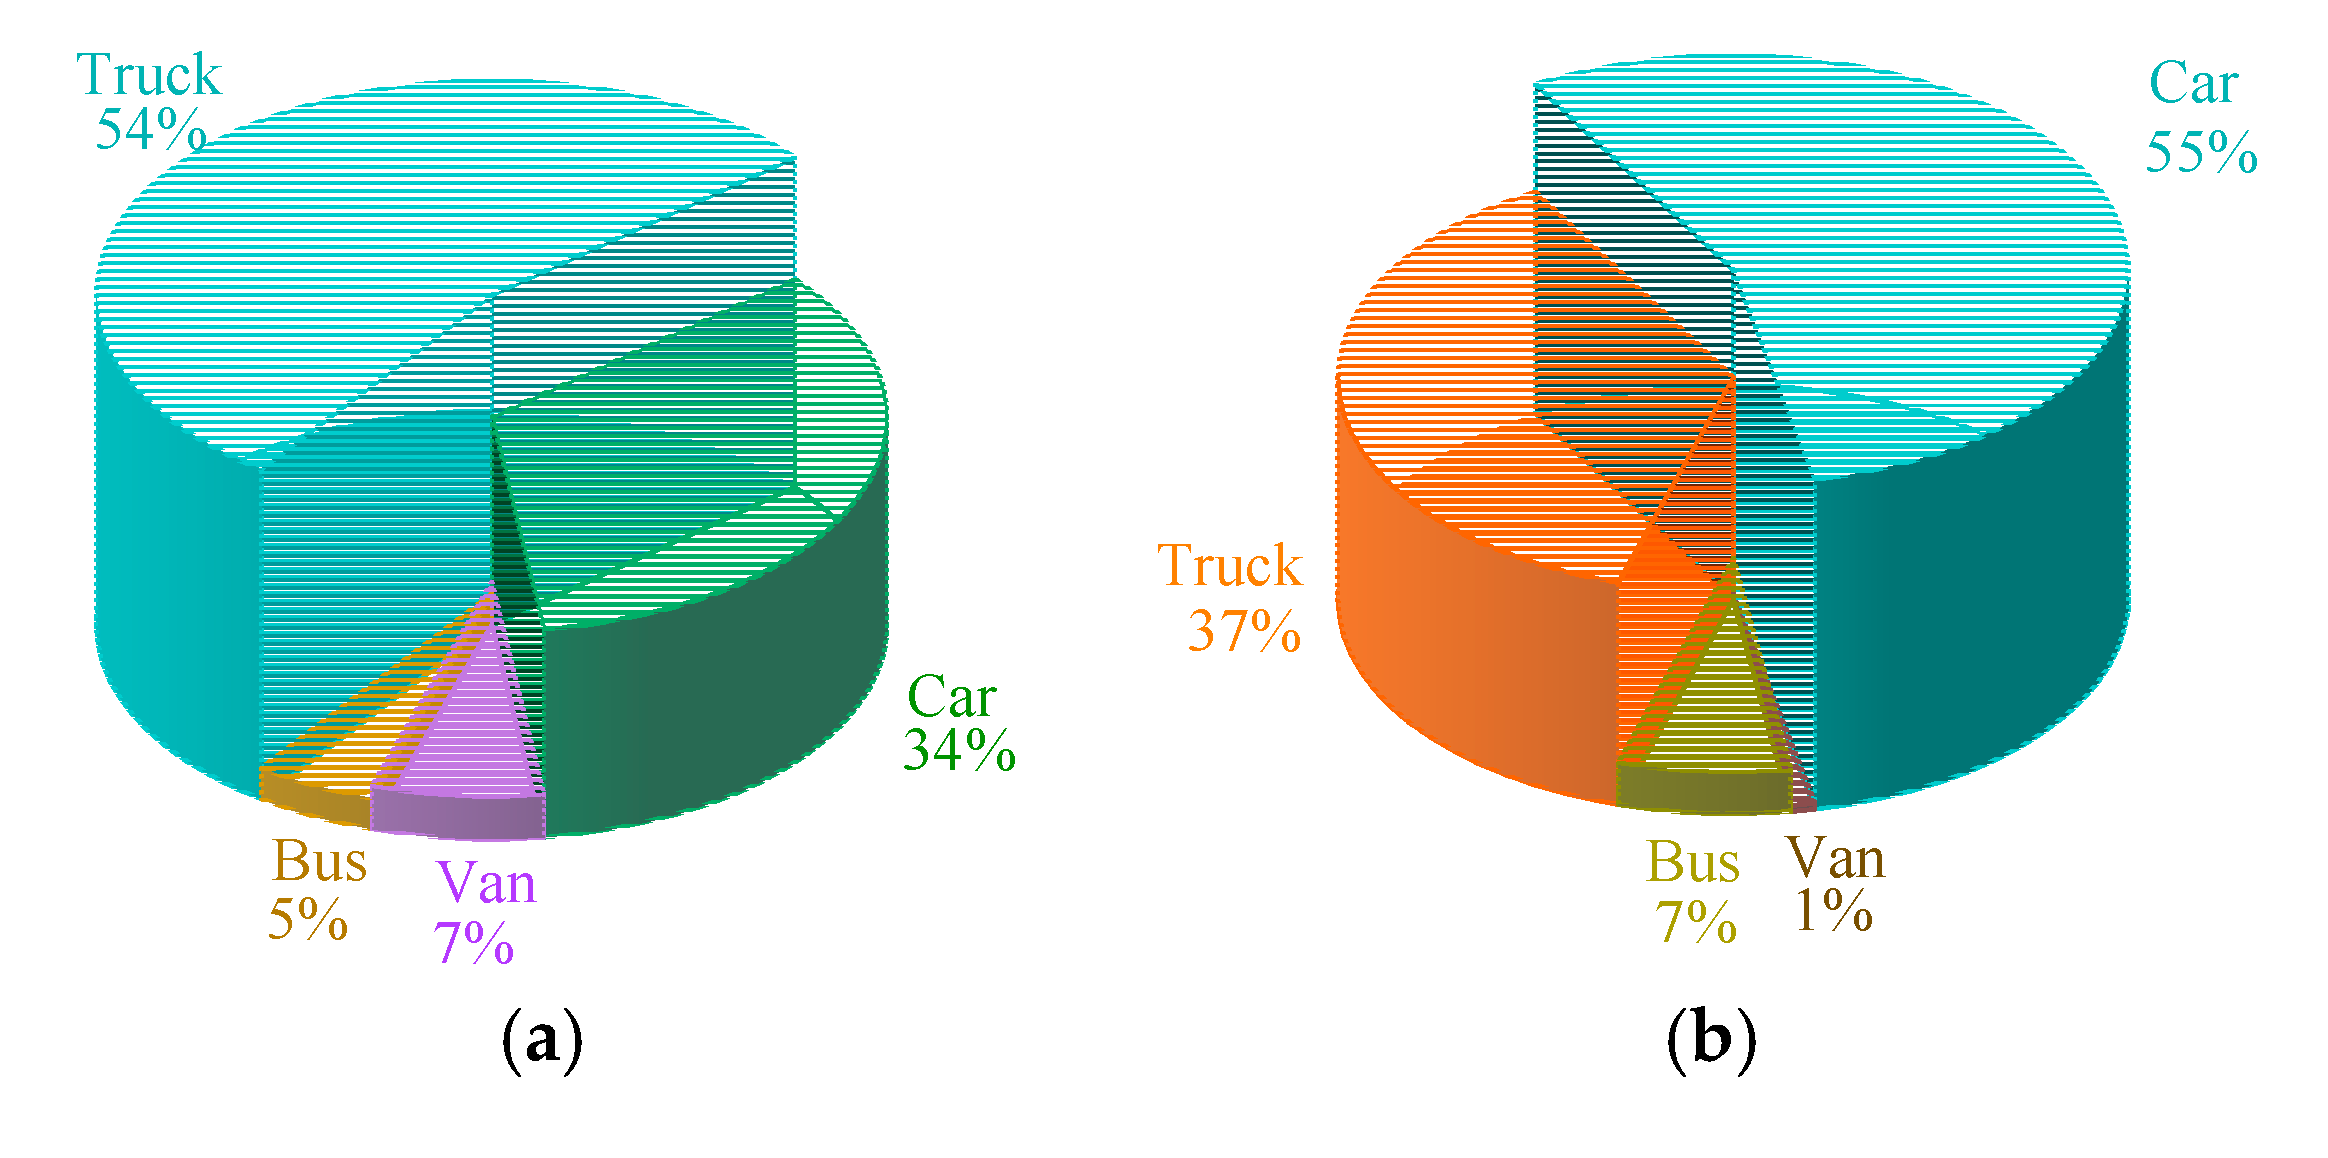
3.1.4. Vehicle Types Distribution Characteristics of Accident

By studying the traffic accident data of Baoding Section of Zhangshi Expressway collected by the project, the distribution proportion of accident vehicle types and traffic volume vehicle types were obtained, as indicated in Figure 12.
As can be observed from Figure 12, cars and trucks account for the highest proportion of accident vehicles, accounting for 34% and 54%, respectively. Cars and trucks also account for the highest proportion of traffic volume models, at 37% and 55%, respectively. The primary reasons are as follows:
(1)
Cars and trucks accounted for the largest proportion of vehicle types in the overall traffic volume;
(2)
The speed difference between cars and trucks was obvious, and the speed distribution was relatively discrete, which further leads to an increase in the number of traffic accidents;
(3)
Large trucks, particularly extra-large trucks, were mostly overloaded and were prone to traffic accidents.

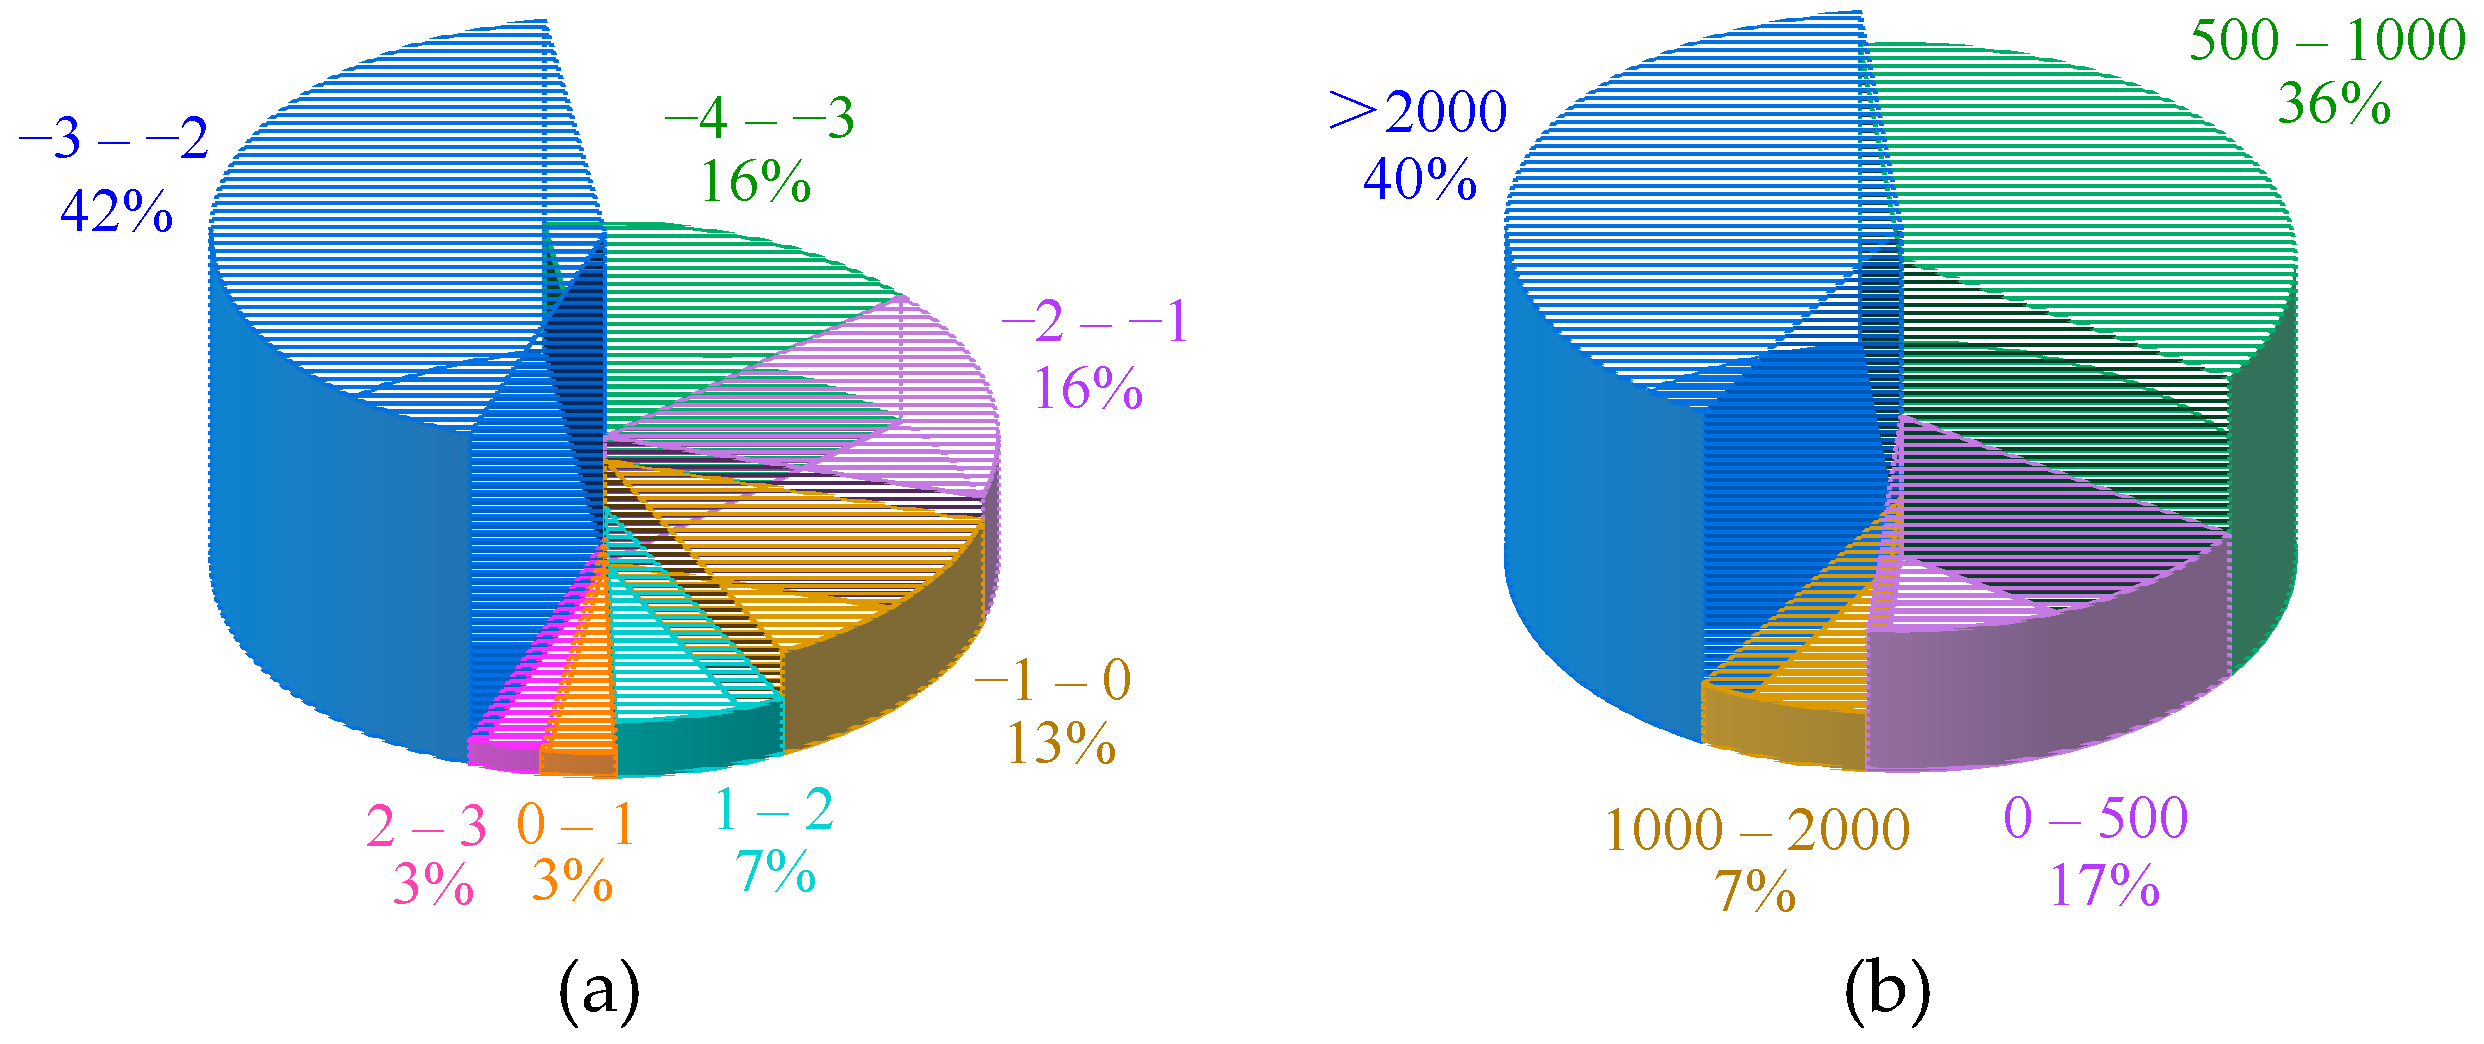
3.1.5. Alignment Distribution Characteristics of Accident Roads

  • Longitudinal alignment distribution characteristics of the traffic accident in the long downhill tunnel of mountain expressways
The survey indicates that in plains, hills, and mountainous areas, most traffic accidents occur on the uphill and downhill sections of roads, accounting for 17%, 18%, and 25%, respectively. Therefore, by exploring the relationship between road profile and road traffic accidents, we can propose corresponding measures to reduce the incidence of road traffic accidents.
According to the traffic accident data of the Baoding section of Zhangshi Expressway collected by the project, the longitudinal alignment distribution of accidents was obtained, as portrayed in Figure 13.
As can be observed from Figure 13, when the slope was −3% to −2%, the accident rate was the largest, accounting for 42% of all accidents, followed by −2% to 1% and −4% to −3%, accounting for 16% respectively. When the slope length was greater than 2000 m, the accident rate was the largest, accounting for 40% of all accidents. The primary reasons are as follows:
When the car was in the downhill section, the car had gravity acceleration, resulting in a continuous increase of vehicle speed. Some drivers turn off the engine to slide down the slope to save gasoline. Once they encountered an accident, it was difficult to take corresponding measures in a short time, and the car would lose control and cause traffic accidents. To maintain the safe driving speed, the driver must have continuously taken braking measures when the car was driving on the long downhill section of the mountain expressways. Due to the frequent use of the service brake, the temperature of the brake hub would rise rapidly, resulting in the “heat recession” effect. In serious cases, the braking capacity would be completely lost, resulting in traffic accidents. Therefore, when the slope is negative, the accident rate is large, and the accident rate increases with the increase of the slope. As the section with the slope of −3% to −2% accounts for a large proportion in the Baoding Section of Zhangshi Expressway, the accident rate was the highest when the slope was −3% to −2%. When driving inside a tunnel with a large length, due to the single internal structure of the tunnel, driving for a long time will cause visual fatigue and reduce the driver’s sensitivity to speed. It was difficult for the driver to detect the continuous downhill, which could have easily caused the vehicle to increase its speed. Therefore, when the tunnel slope was more than 2000 m long, once an emergency occurred in front, the vehicle could not complete the complete braking process in a short distance and time, resulting in an accident.
2.
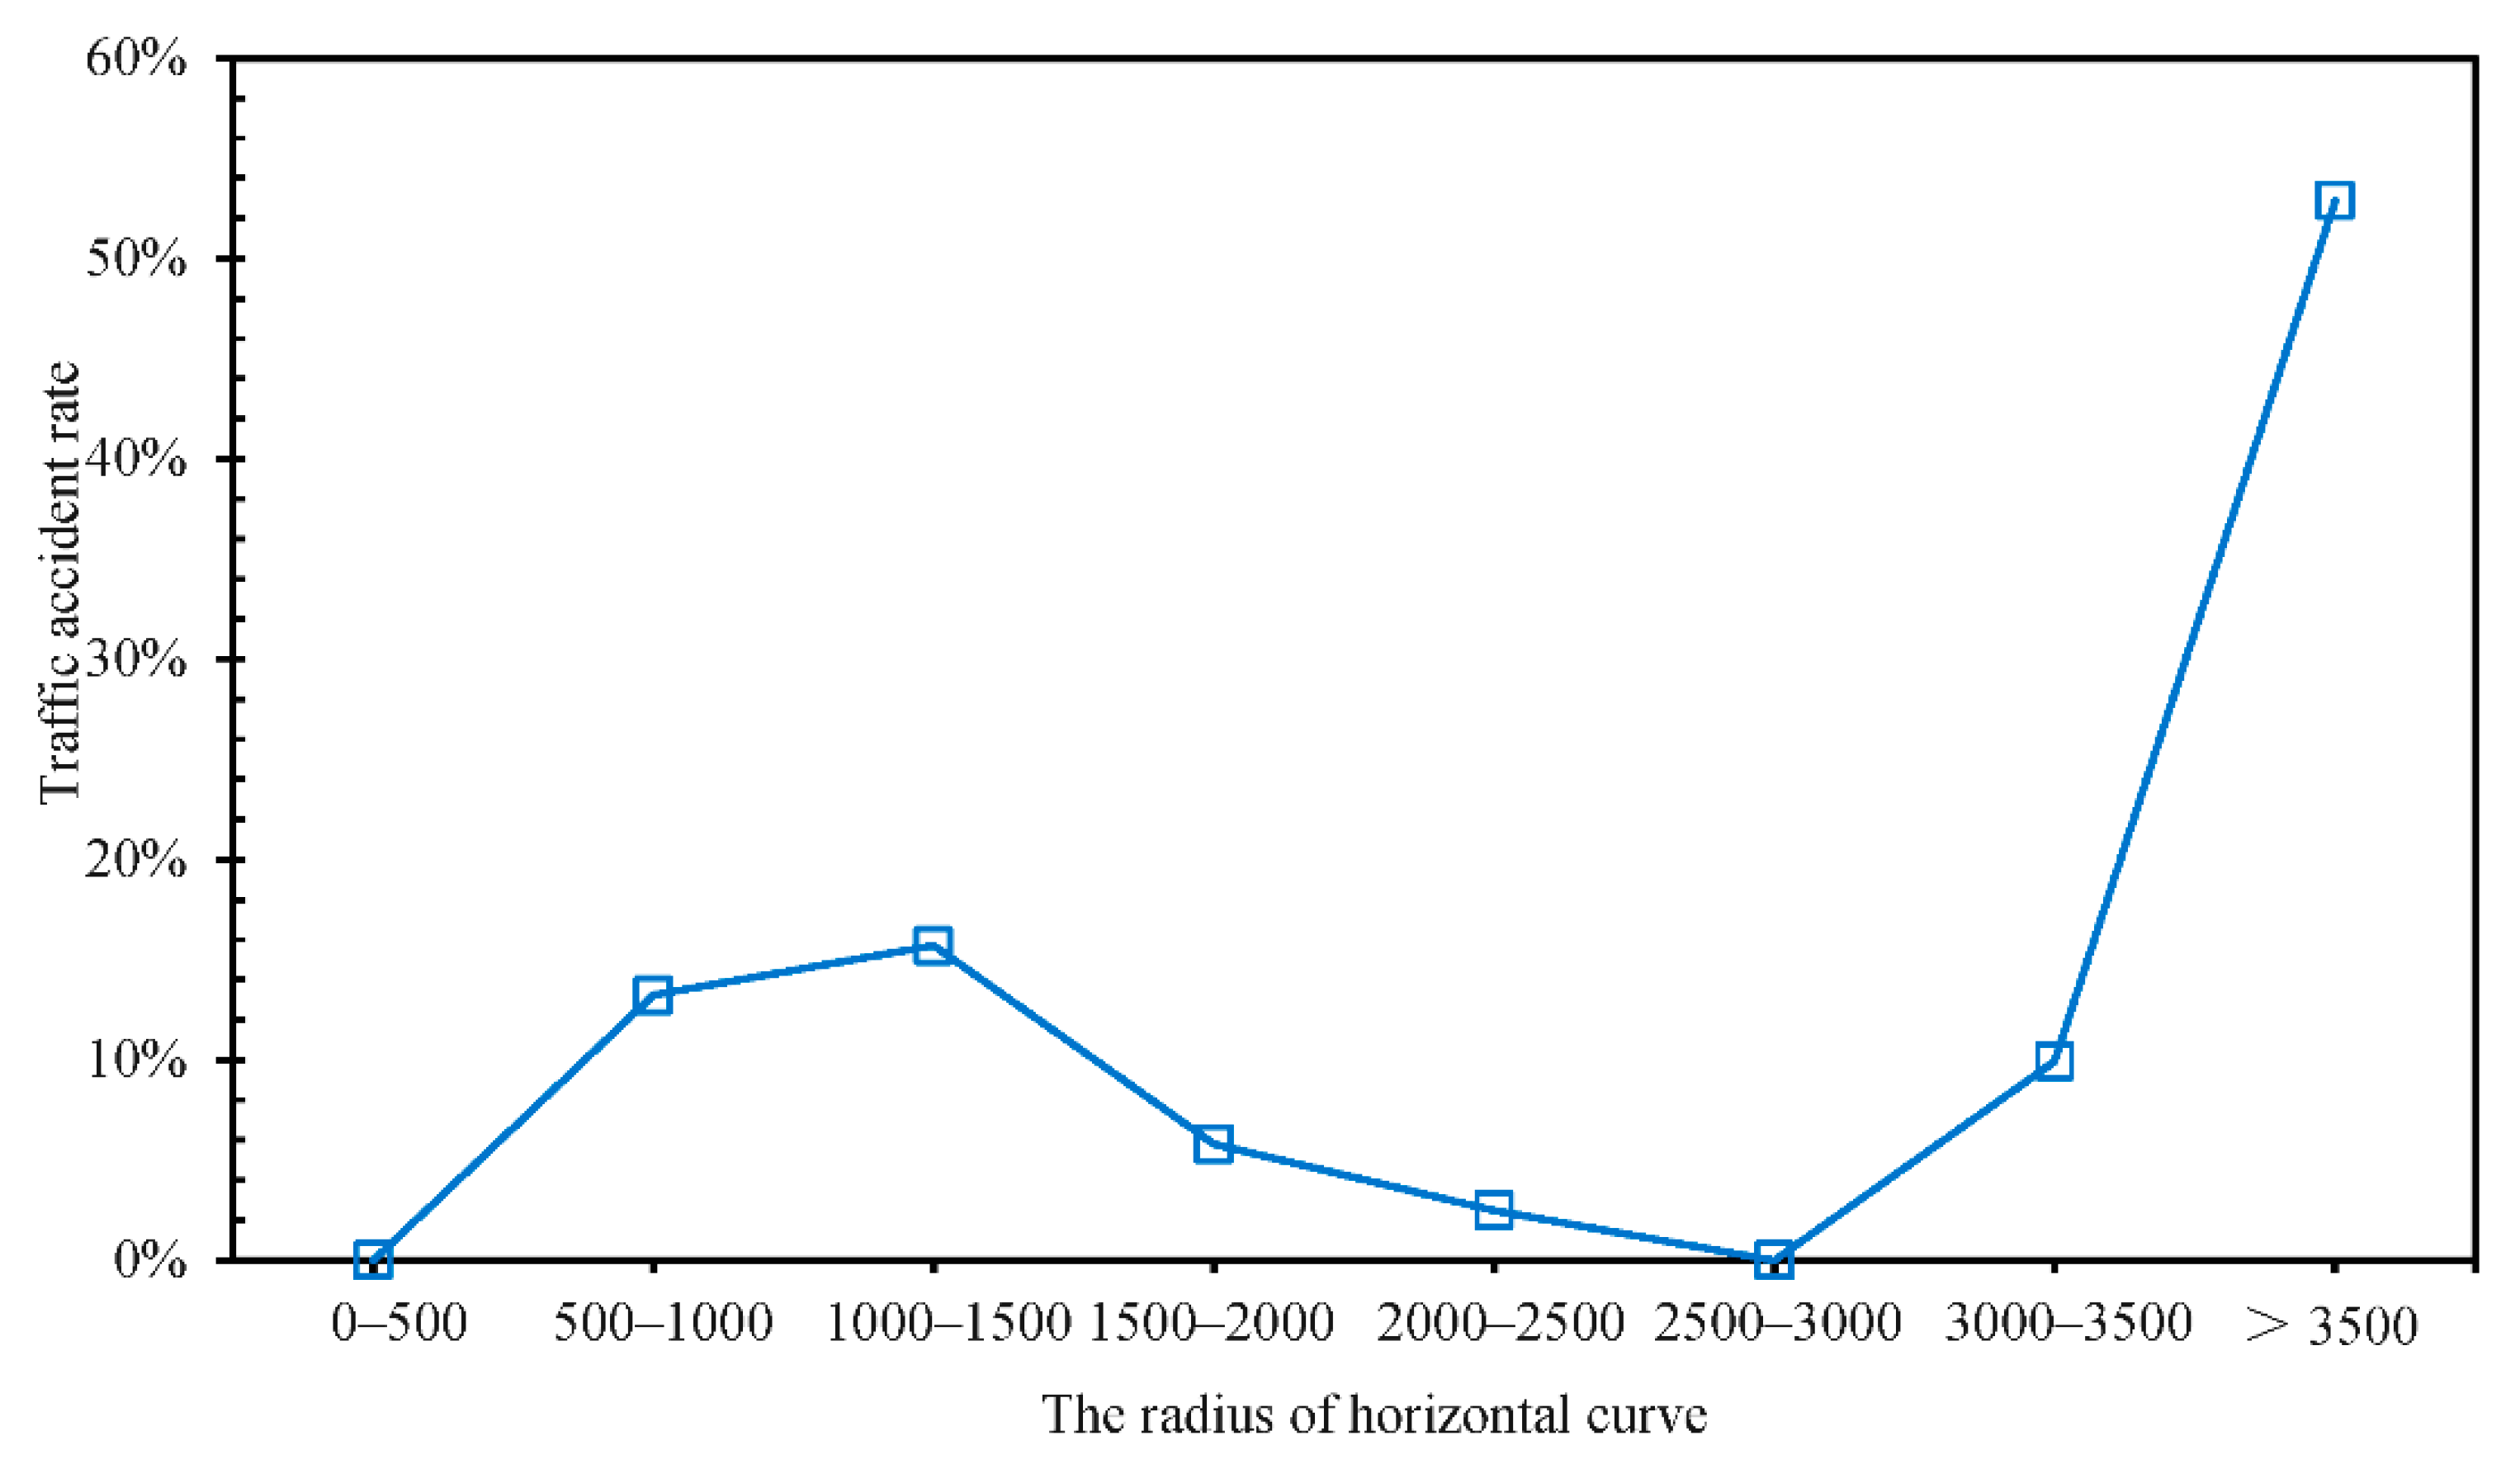
Plane linear distribution characteristics of the traffic accidents in the long downhill tunnels of mountain expressways
According to the analysis of the traffic accident data of the Baoding Section of Zhangjiakou Shijiazhuang Expressway collected by the project, the accidents are classified according to the horizontal curve radius of the accident location. It was concluded that the accidents were primarily distributed in the area of the road curve, accounting for 57% of the total accident frequency. The primary reason was that when the tunnel was curved, there would be a wall effect, and the driver’s driving sight distance would be reduced. Moreover, because the tunnel exists in the mountain, the air humidity in the tunnel was significantly higher than that in other sections, resulting in a very small friction coefficient of the road surface. When the vehicle ran on the road with too small a curve radius, it was easy to lose stability due to insufficient friction.
The accident statistics of the Baoding Section of Zhangshi Expressway were analyzed, and the traffic accident location was counted according to the curve radius. As can be observed from Figure 14, when the radius of the horizontal curve was 1000 m, the accident rate increased slowly, and the accident rate decreased at a radius of 1500 to 3000 m. When the radius was greater than 3000 m, the probability of traffic accidents increased rapidly, so the radius of the horizontal curve should not exceed 3000 m.
The horizontal curve often exists on daily roads, which can guide the driver’s line of sight. When the driver drives on the horizontal curve road, due to the guidance of the sight line, the driver’s concentration is very high and the driving state is good, so the frequency of traffic accidents in the horizontal curve line section is low. However, when the horizontal curve radius was less than 1000 m, the value of the horizontal curve radius was too low, resulting in the relative decline of the driver’s control over the vehicle during driving, and the vehicle may lose control due to fast speed and insufficient centrifugal force. When the radius of the horizontal curve was greater than 3000 m, the driver would try to overtake the curve because the radius was too large and the curve was too long, which easily led to traffic accidents.

3.2. Analysis on the Causes of Accidents in Long Downhill Tunnels of Mountain Expressways

3.2.1. Data Preprocessing

Data preprocessing is an essential step in data mining. Data preprocessing is to process the original data into an operable form, including data cleaning, conversion, and dimensionality reduction [22]. The data on traffic accidents in the Baoding section of Zhangshi Expressway from 2013 to 2018 was used for the research. Since the traffic accident data collected by the project is missing, and the missing data is that of related road traffic accidents, data mining methods will be used to fill in the collected traffic accident data and to enhance the integrity of the data.
For missing values, we used data such as mean, median, and mode to supplement them. If missing values could be obtained by analogy, we deleted records or filled in default values. For obviously abnormal data, we used the mean, median, mode, and other data to correct it, treated it as a missing value, or deleted the record. Then, through data transformation and dimensionality reduction, the characteristic variable set of traffic accidents on mountain expressways as portrayed in Table 3 is constructed, and each variable is coded.

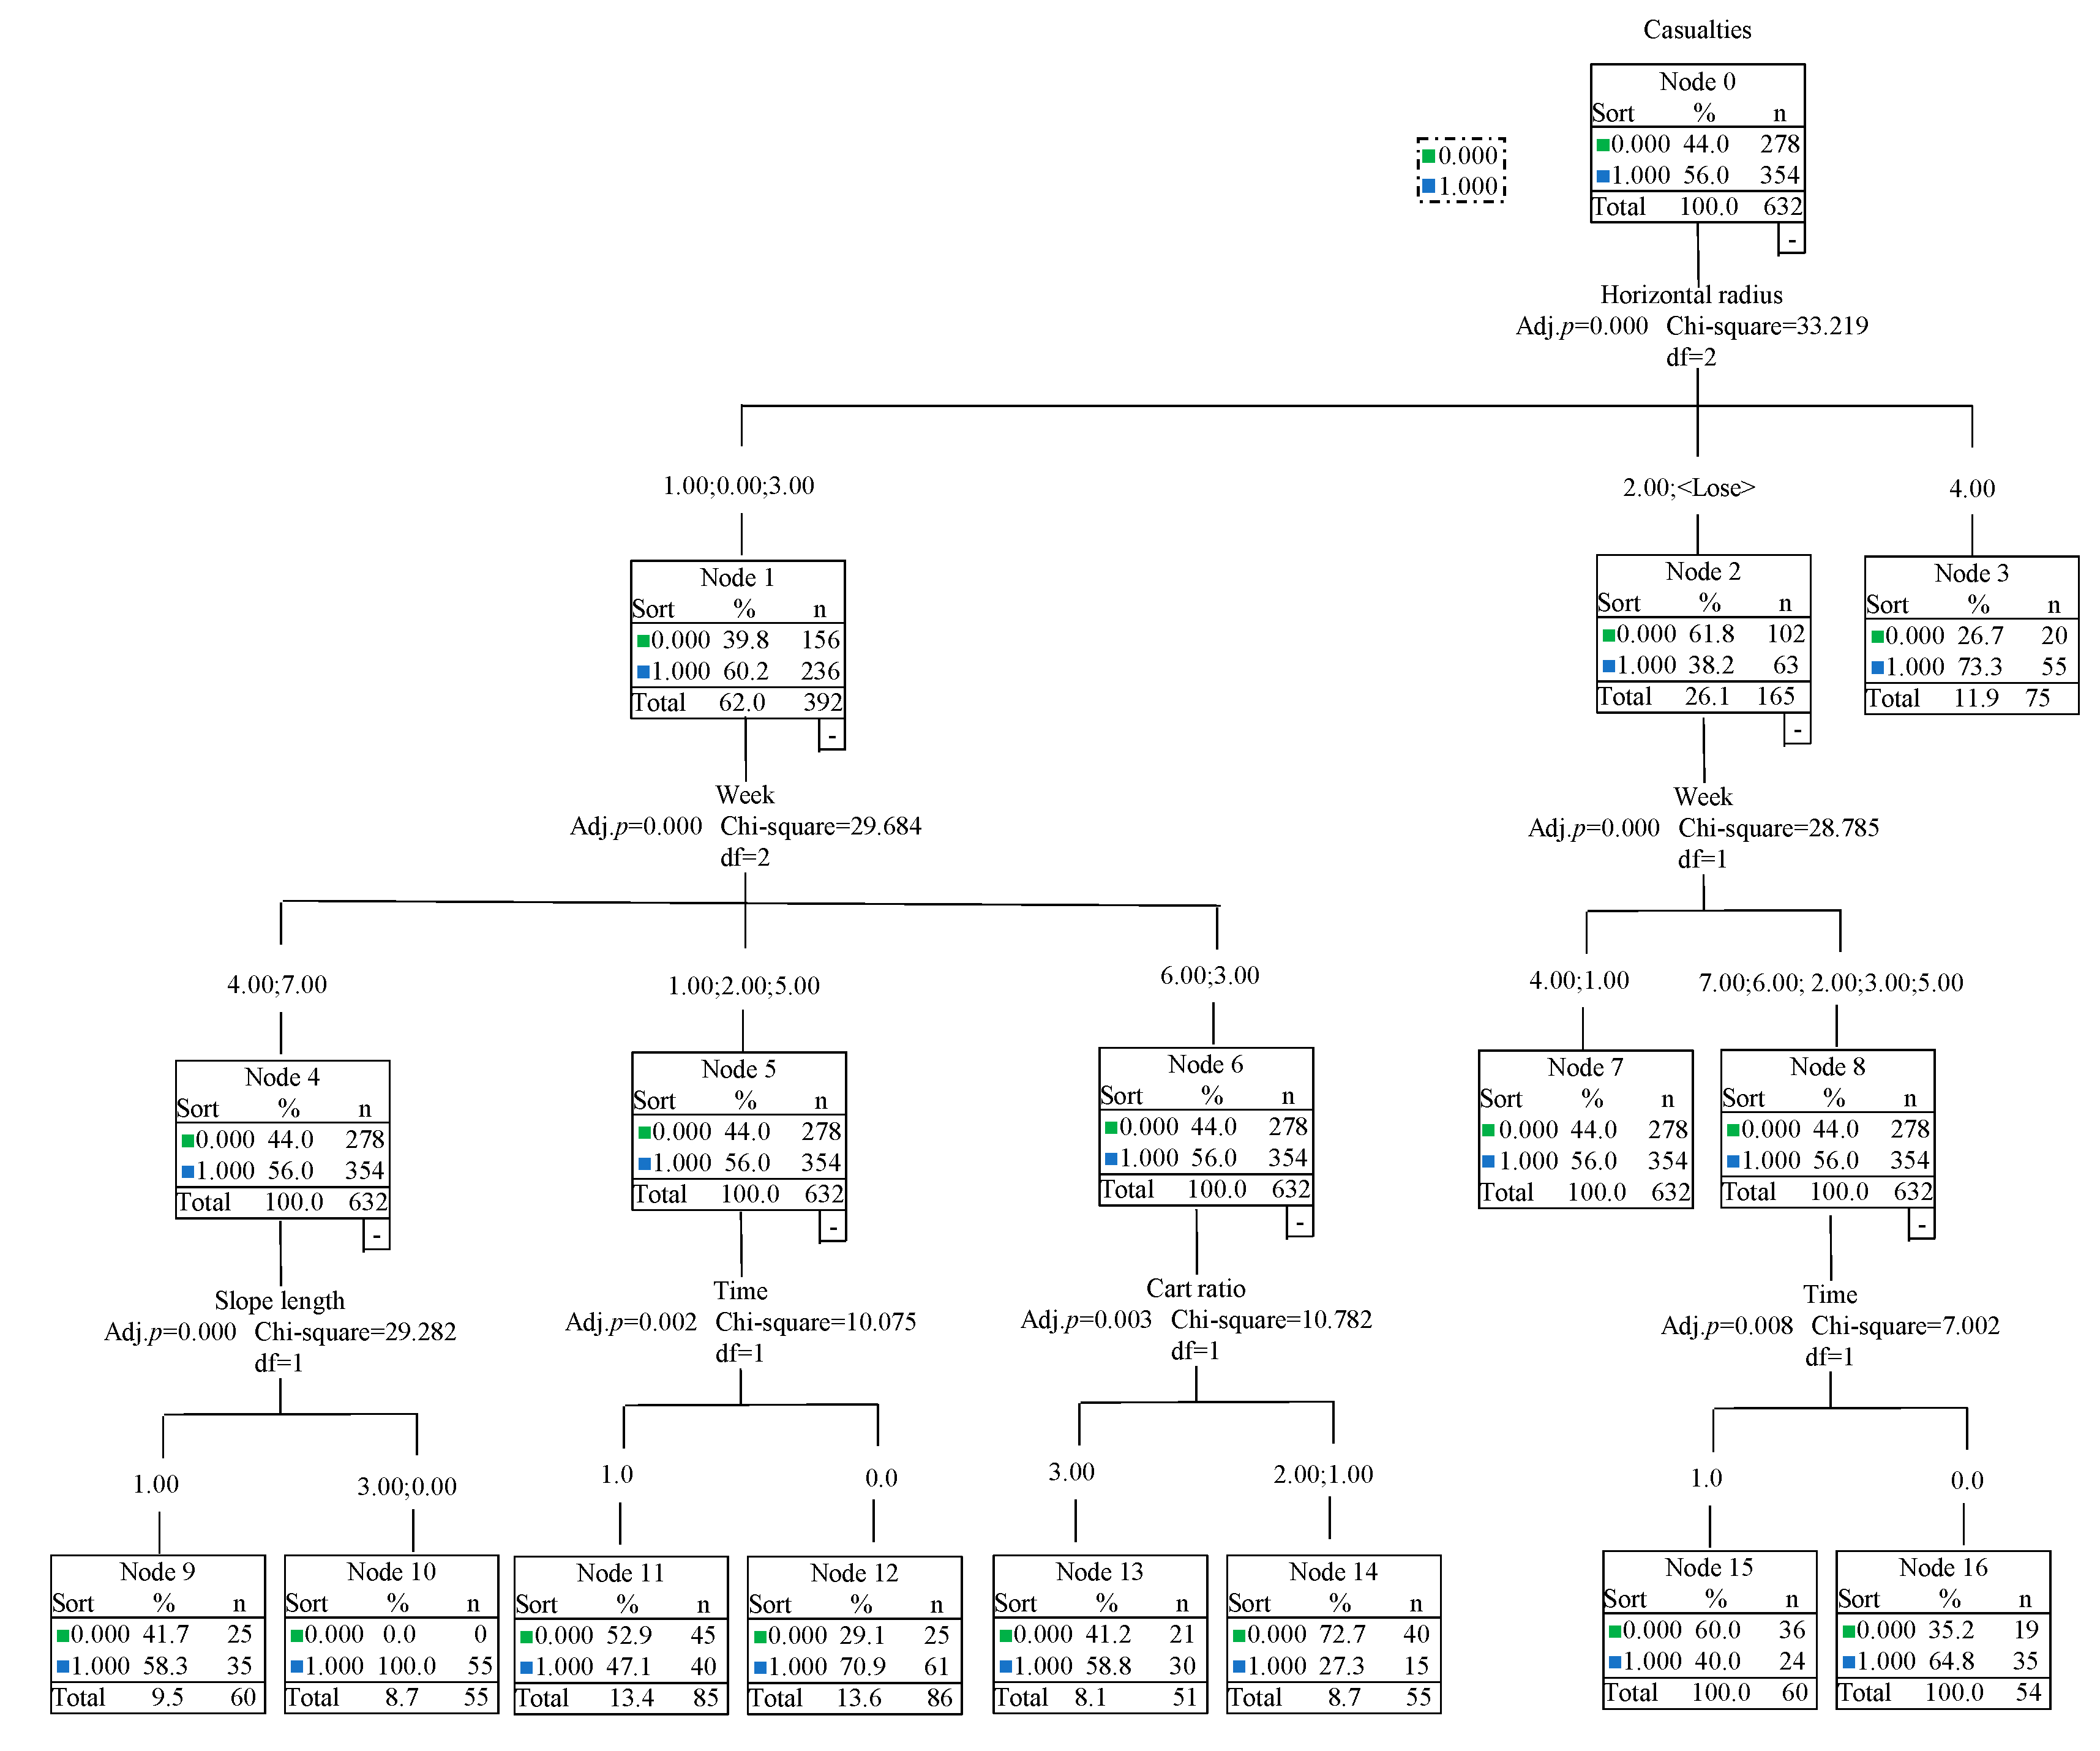
3.2.2. Analysis of Accident Causes Based on Decision Tree Model

The maximum injury level was used as the attribute representing the severity of the accident. The database data was analyzed and processed using the chi-square algorithm, and the target attribute was the maximum injury degree. To reduce the model height and avoid the waste of computing resources, the height of the decision tree model was selected as 3 in advance. Of the dataset, 80% of the data was randomly selected as training data, and 20% of the data was used as inspection data. In the branching process of the decision tree model, the minimum case value of the parent node was 1000, and the minimum case value of the child node was 200. SPSS 22.0 version software was selected to construct the decision tree model, and the resulting decision tree diagram is shown in Figure 15.
After the decision tree model was constructed, a set of relevant rules for accident cause analysis could be obtained. From the rule set, we selected rules that contained more than 15 sample data and whose confidence level were above 70%:
Rule (1): If the radius of the flat curve is (0), (1), (3), the week is (4), (7), the slope length is (0), (3), then the maximum injury degree is (1); Rule (1) contains 55 samples with 100% confidence;
Rule (2): If the radius of the flat curve is (0), (1), (3), the week is (1), then the maximum injury degree is (1); Rule (2) contains 86 samples with 70.93% confidence;
Rule (3): If the radius of the flat curve is (0), (1), (3), the week is (6), (3), the truck ratio is (0), (3), then the maximum injury degree is (0); Rule (3) contains 55 samples with 72.73% confidence;
Rule (4): If the radius of the flat curve is (0), (1), (3), the week is (4), (3), then the maximum injury degree is (0); Rule (4) contains 51 samples with 92.16% confidence;
Rule (5): If the radius of the flat curve is (4), then the maximum injury degree is (1); Rule (5) contains 75 samples with 73.33% confidence.
The overall confidence level of the generated model was 70.7%, indicating that the obtained decision tree model had strong absorption of database data, and could effectively draw the significant correlation factors that affect the severity of the accident. The rules obtained by the model indicate that the five factors of the radius of the flat curve, the week, the length of the slope, the time, and the ratio of large vehicles were all introduced into the classification rules. Among them, the radius of the flat curve had the greatest influence on the severity of the accident, and the factor of week ranked second. The primary reasons are:
(1)
Since the Zhangshi Expressway is located in a mountainous area, and most of it is a long downhill tunnel section, with a unique structure and special curvature. Two factors, the radius of the horizontal curve and the length of the slope, will have a very important impact on the accident.
(2)
The object of this data mining was the Baoding section of the Zhangshi Expressway. As the second passage of the Jingshi Expressway, the Zhangshi Expressway bears the great responsibility of diverting the Jingshi Expressway. According to the survey data, the difference in passenger and cargo flow from Monday to Thursday was small, but with the holiday of Saturday, Sunday and other holidays, many passenger and cargo vehicles had to leave Beijing through this road, so the activity of people and vehicles had increased, the overall traffic volume and the frequency of traffic accidents also increased accordingly. Therefore, the day of the week had a great influence on the probability of traffic accidents;
(3)
As the Zhangshi Expressway is located in a long downhill section in the mountainous area, the road is often downhill and the distance is long, and the road conditions are undulating and changing. For the driver of the vehicle, frequent braking arrangements were required to prevent the danger of an accident due to excessive speed. However, due to the large volume and gravity of the large vehicle itself, frequent use of the braking device would cause the temperature of the brake hub to increase rapidly. In a short period, it may sometimes rise to 400 to 500 °C, which would cause the temperature of the brake hub to be too high and the braking measures would fail, resulting in traffic accidents. Therefore, the frequency of accidents of large vehicles had a large impact on the increase in the number of traffic accidents on the entire Zhangshi Expressway.

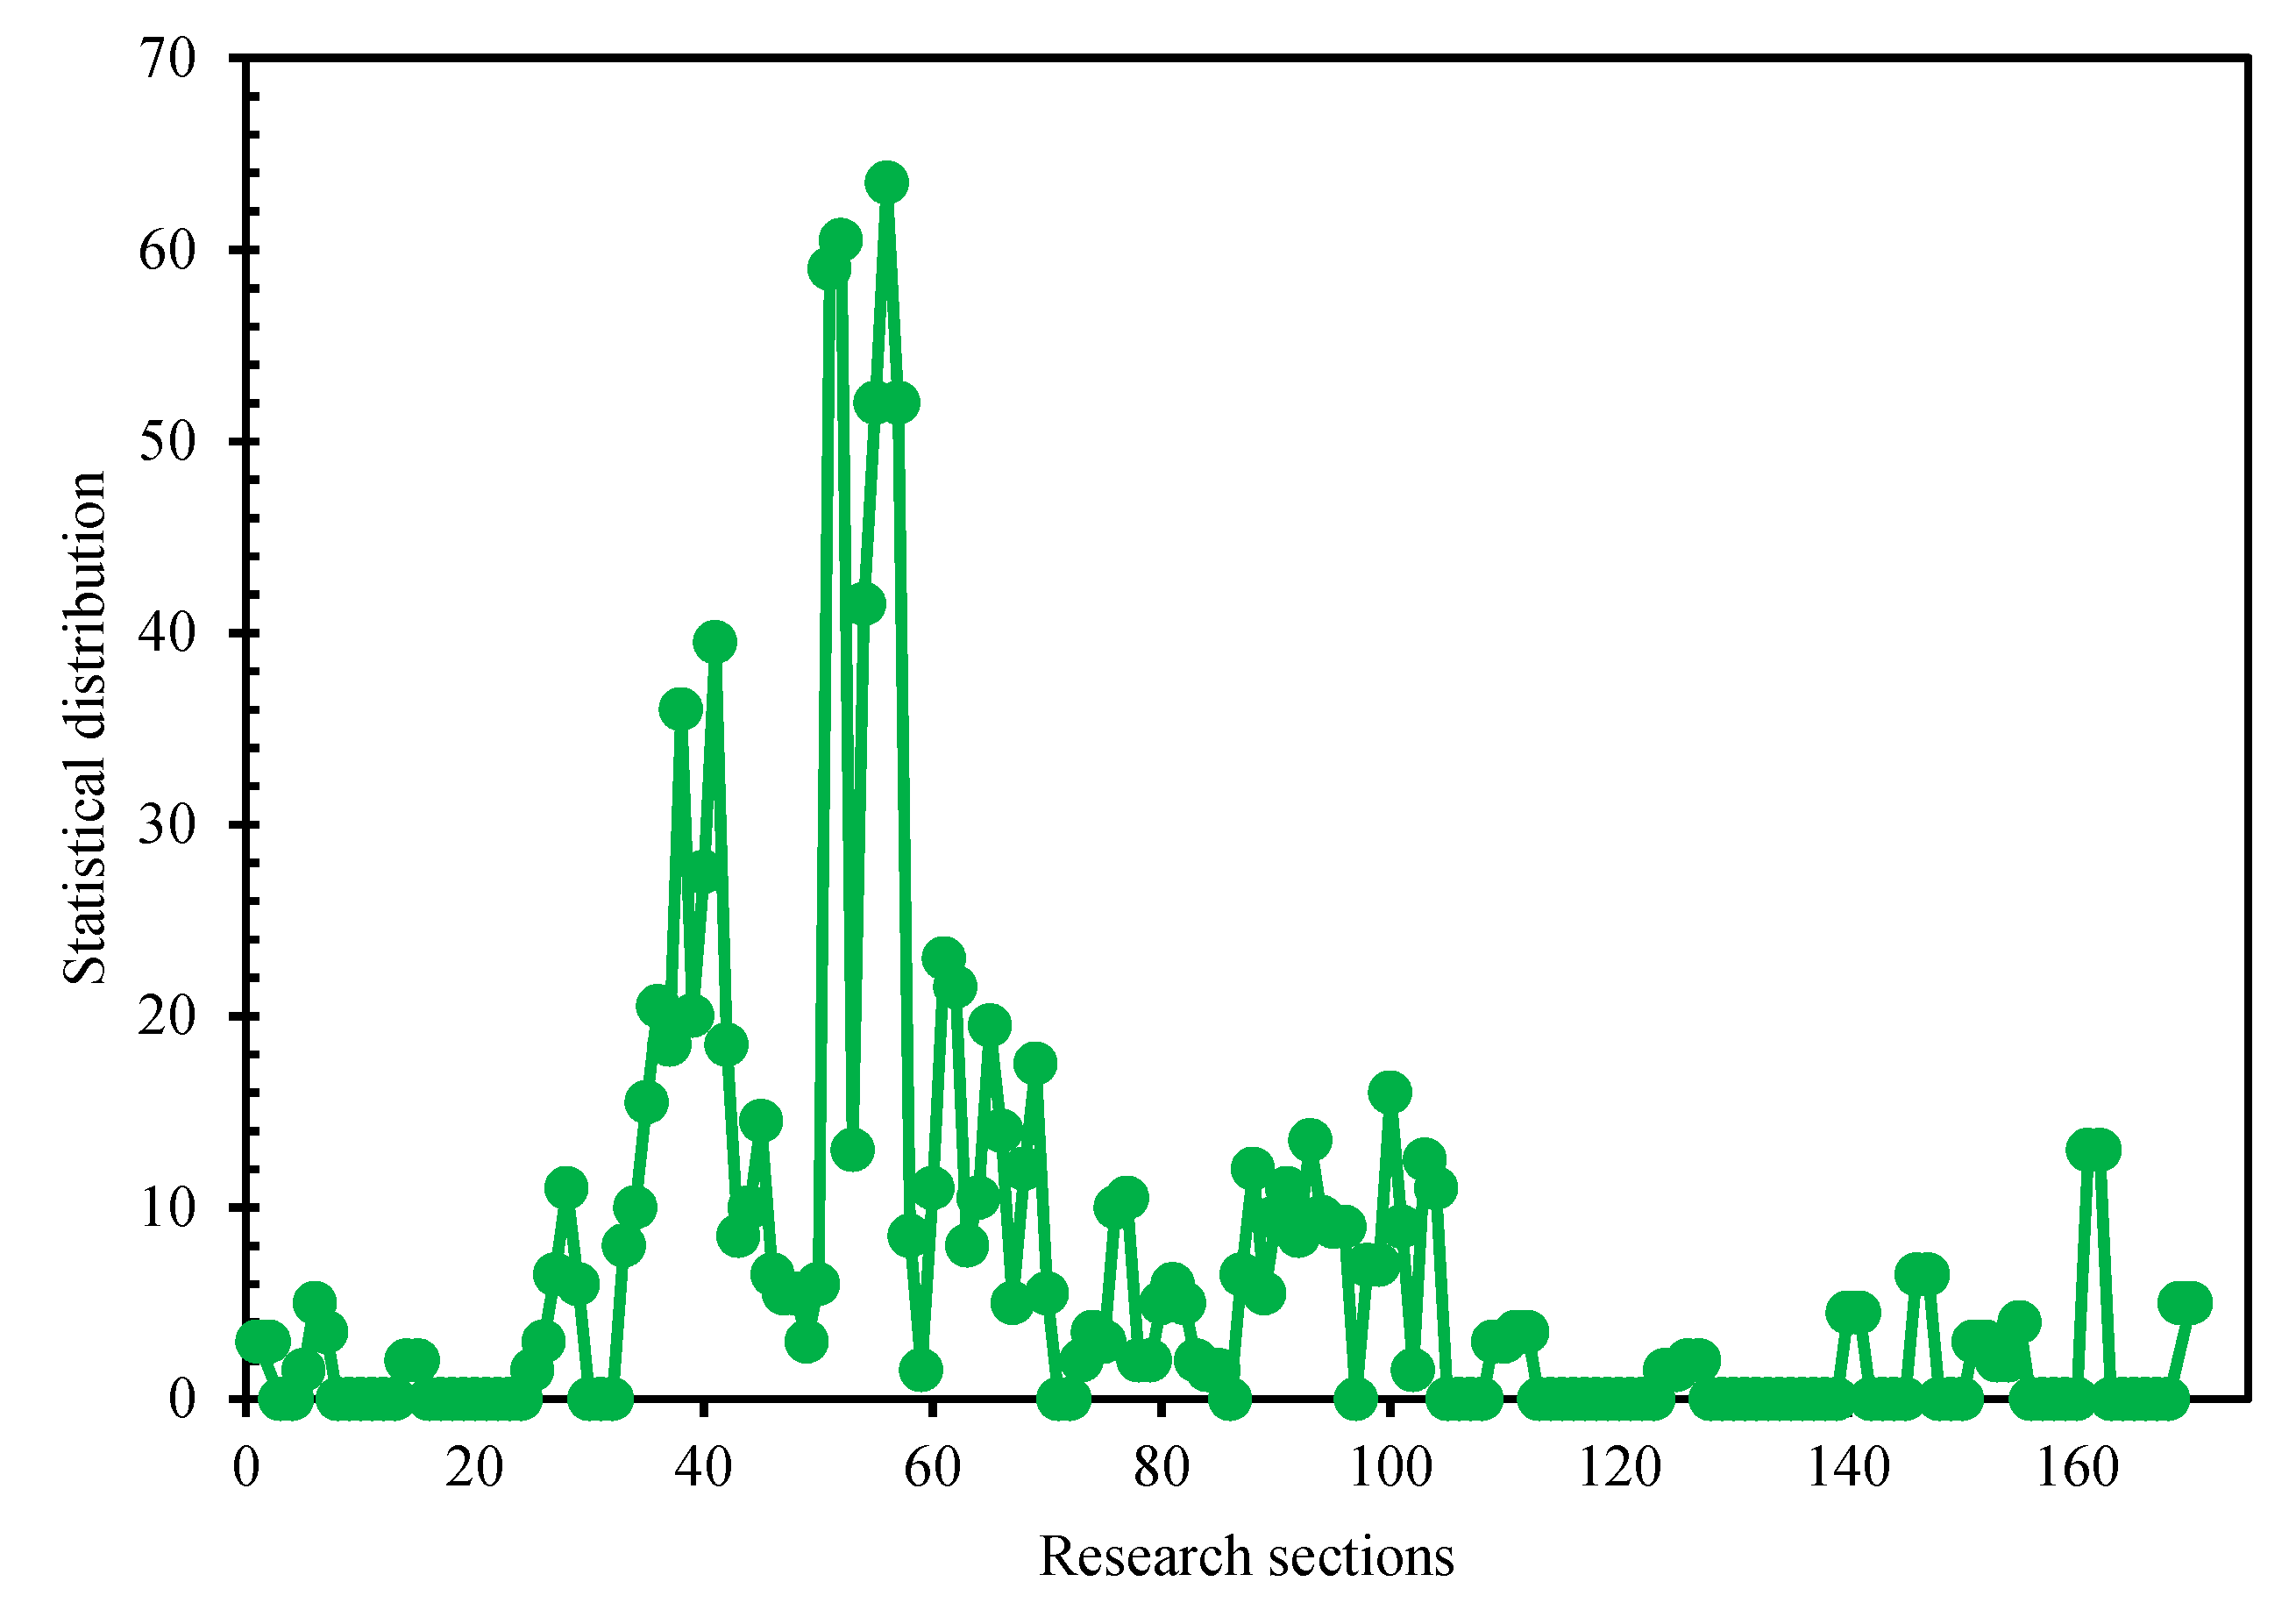
3.3. Identification of Accident-Prone Points in Long Downhill Tunnels of Mountain Expressways

1.
Take the death weight K 1 as 2.0 and the injury weight K 2 as 1.5.
2.
Using 1 km as the length standard, and using the traffic accident data of Zhangshi Expressway from 2013 to 2018, the number of equivalent accidents and the equivalent accident rate of the Baoding section of Zhangshi Expressway were calculated.
The sliding window method was selected as the technical support to perform the identification process of accident-prone points, and the number of accidents was weighted to obtain the data of the equivalent number of accidents. Then we divided the overall road of the Baoding Section of Zhangjiakou Shijiazhuang Expressway with the window section length of one kilometer and the pane length of 500 m, obtained 171 research sections, and sorted and numbered them. Finally, the collected traffic accident data were statistically filled according to the accident location to obtain the accident distribution in the Baoding Section of Zhangshi Expressway. As indicated in Figure 16, the number of equivalent accidents was primarily concentrated in the research sections of 30 to 100, with the largest number of equivalent accidents in the research sections of 50 to 60. The other study segments had a smaller and less concentrated number of equivalent accidents.
Using the number of equivalent accidents as the reference index, the accident frequency of each section of the Baoding Section of Zhangshi Expressway and cumulative frequency were obtained. The distribution of equivalent accidents in the Baoding Section of Zhangshi Expressway was obtained using the sliding window method, and the frequency distribution diagram was drawn according to the obtained data, as portrayed in Figure 17.
We drew the cumulative frequency scatter plot of the equivalent accident number in the Baoding section of Zhangshi Expressway, as indicated in Figure 18.
We imported Figure 18 into the Origin software, and performed the curve fitting process. When the parameters in the software did not change, the fitting process ended, and the best fitting effect was obtained and generated. The fitting equation derived from the software is as follows:
y = 0.0000002 x 4 + 0.00004 x 3 0.024 x 2 + 0.0605 x + 0.395
With the correlation coefficient R 2 = 0.9971 , the fit is very good. Solving the above equations can provide the equivalent accident number N 80 = 10, N 95 = 25.25. Through the relevant definitions of traffic safety, in the Baoding section of Zhangshi Expressway, there were a total of 9 sections with equivalent accident numbers of 27.5, 36, 39.5, 41.5, 52, 59, 60.5, and 63.5 were determined as accident-prone points. A total of 28 intervals with equivalent accident numbers of 10, 10.5, 11, 12, 12.5, 13, 13.5, 14, 14.5, 15.5, 16, 17.5, 18.5, 19.5, 20, 20.5, 21.5, and 23 were determined as potential accident-prone points. Other road sections were determined as traffic safety areas. The total length of accident-prone points in the Baoding section of Zhangshi Expressway obtained by the improved sliding window method is 6 km, and the total length of potential accident-prone points is 22 km, accounting for 6.98% and 25.58% of the entire Baoding section, respectively.

4. Conclusions

Using the tunnel traffic accident in the Baoding Section of Zhangshi Expressway in Hebei Province as the research object, using the method of data mining in traffic accidents, this paper carefully analyzed the distribution characteristics of traffic accidents in the long downhill tunnel of Expressway in mountainous areas, analyzed the causes of traffic accidents, and identified the accident-prone sections. The research results are as follows:
  • In the time distribution characteristics of traffic accidents, the frequency of accident distribution was the largest in June, which was the peak value, and the frequency of distribution was the smallest in January, which was the trough value, and the frequency of accidents from January to June indicated an increasing trend. The accident frequency was the highest on Saturdays and Sundays. The times of 4:00 to 6:00, 13:00 to 16:00, 17:00 to 19:00, and 23:00 to 1:00 were the accident peaks, and these four time periods accounted for 54.38% of the total number of traffic accidents. In the spatial distribution characteristics of accidents, the length of the tunnel had a significant influence on the occurrence of traffic accidents. In the form distribution characteristics of accidents, the traffic accident patterns mainly indicated collisions with moving vehicles and collisions with stationary vehicles, accounting for 54.73% and 28.96%, respectively. In the vehicle-type distribution characteristics of the accident, small passenger cars and large trucks accounted for the highest proportion of accident models, which were 34.37% and 54.37%, respectively. In the alignment distribution characteristics of accident roads, when the slope was −3% to −2%, the accident rate was the largest, accounting for 42% of all accidents. When the radius of the flat curve was greater than 3000 m, the chance of traffic accidents increased rapidly, therefore, the radius of the horizontal curve should not exceed 3000 m.
  • Using the accident attribute in the characteristic variable set of expressway traffic accidents as the independent variable and the maximum injury degree as the target attribute, a decision tree model was constructed to analyze the cause of traffic accidents. The overall confidence level of the decision tree model was 70.7%, which was a good assimilation of the database data and can well derive the significant correlation factors affecting the severity of the accident. The research indicates that the radius of the horizontal curve, week, slope length, time, and truck ratio was significantly related to the occurrence of traffic accidents in the long downhill tunnel of the expressway in the mountainous area.
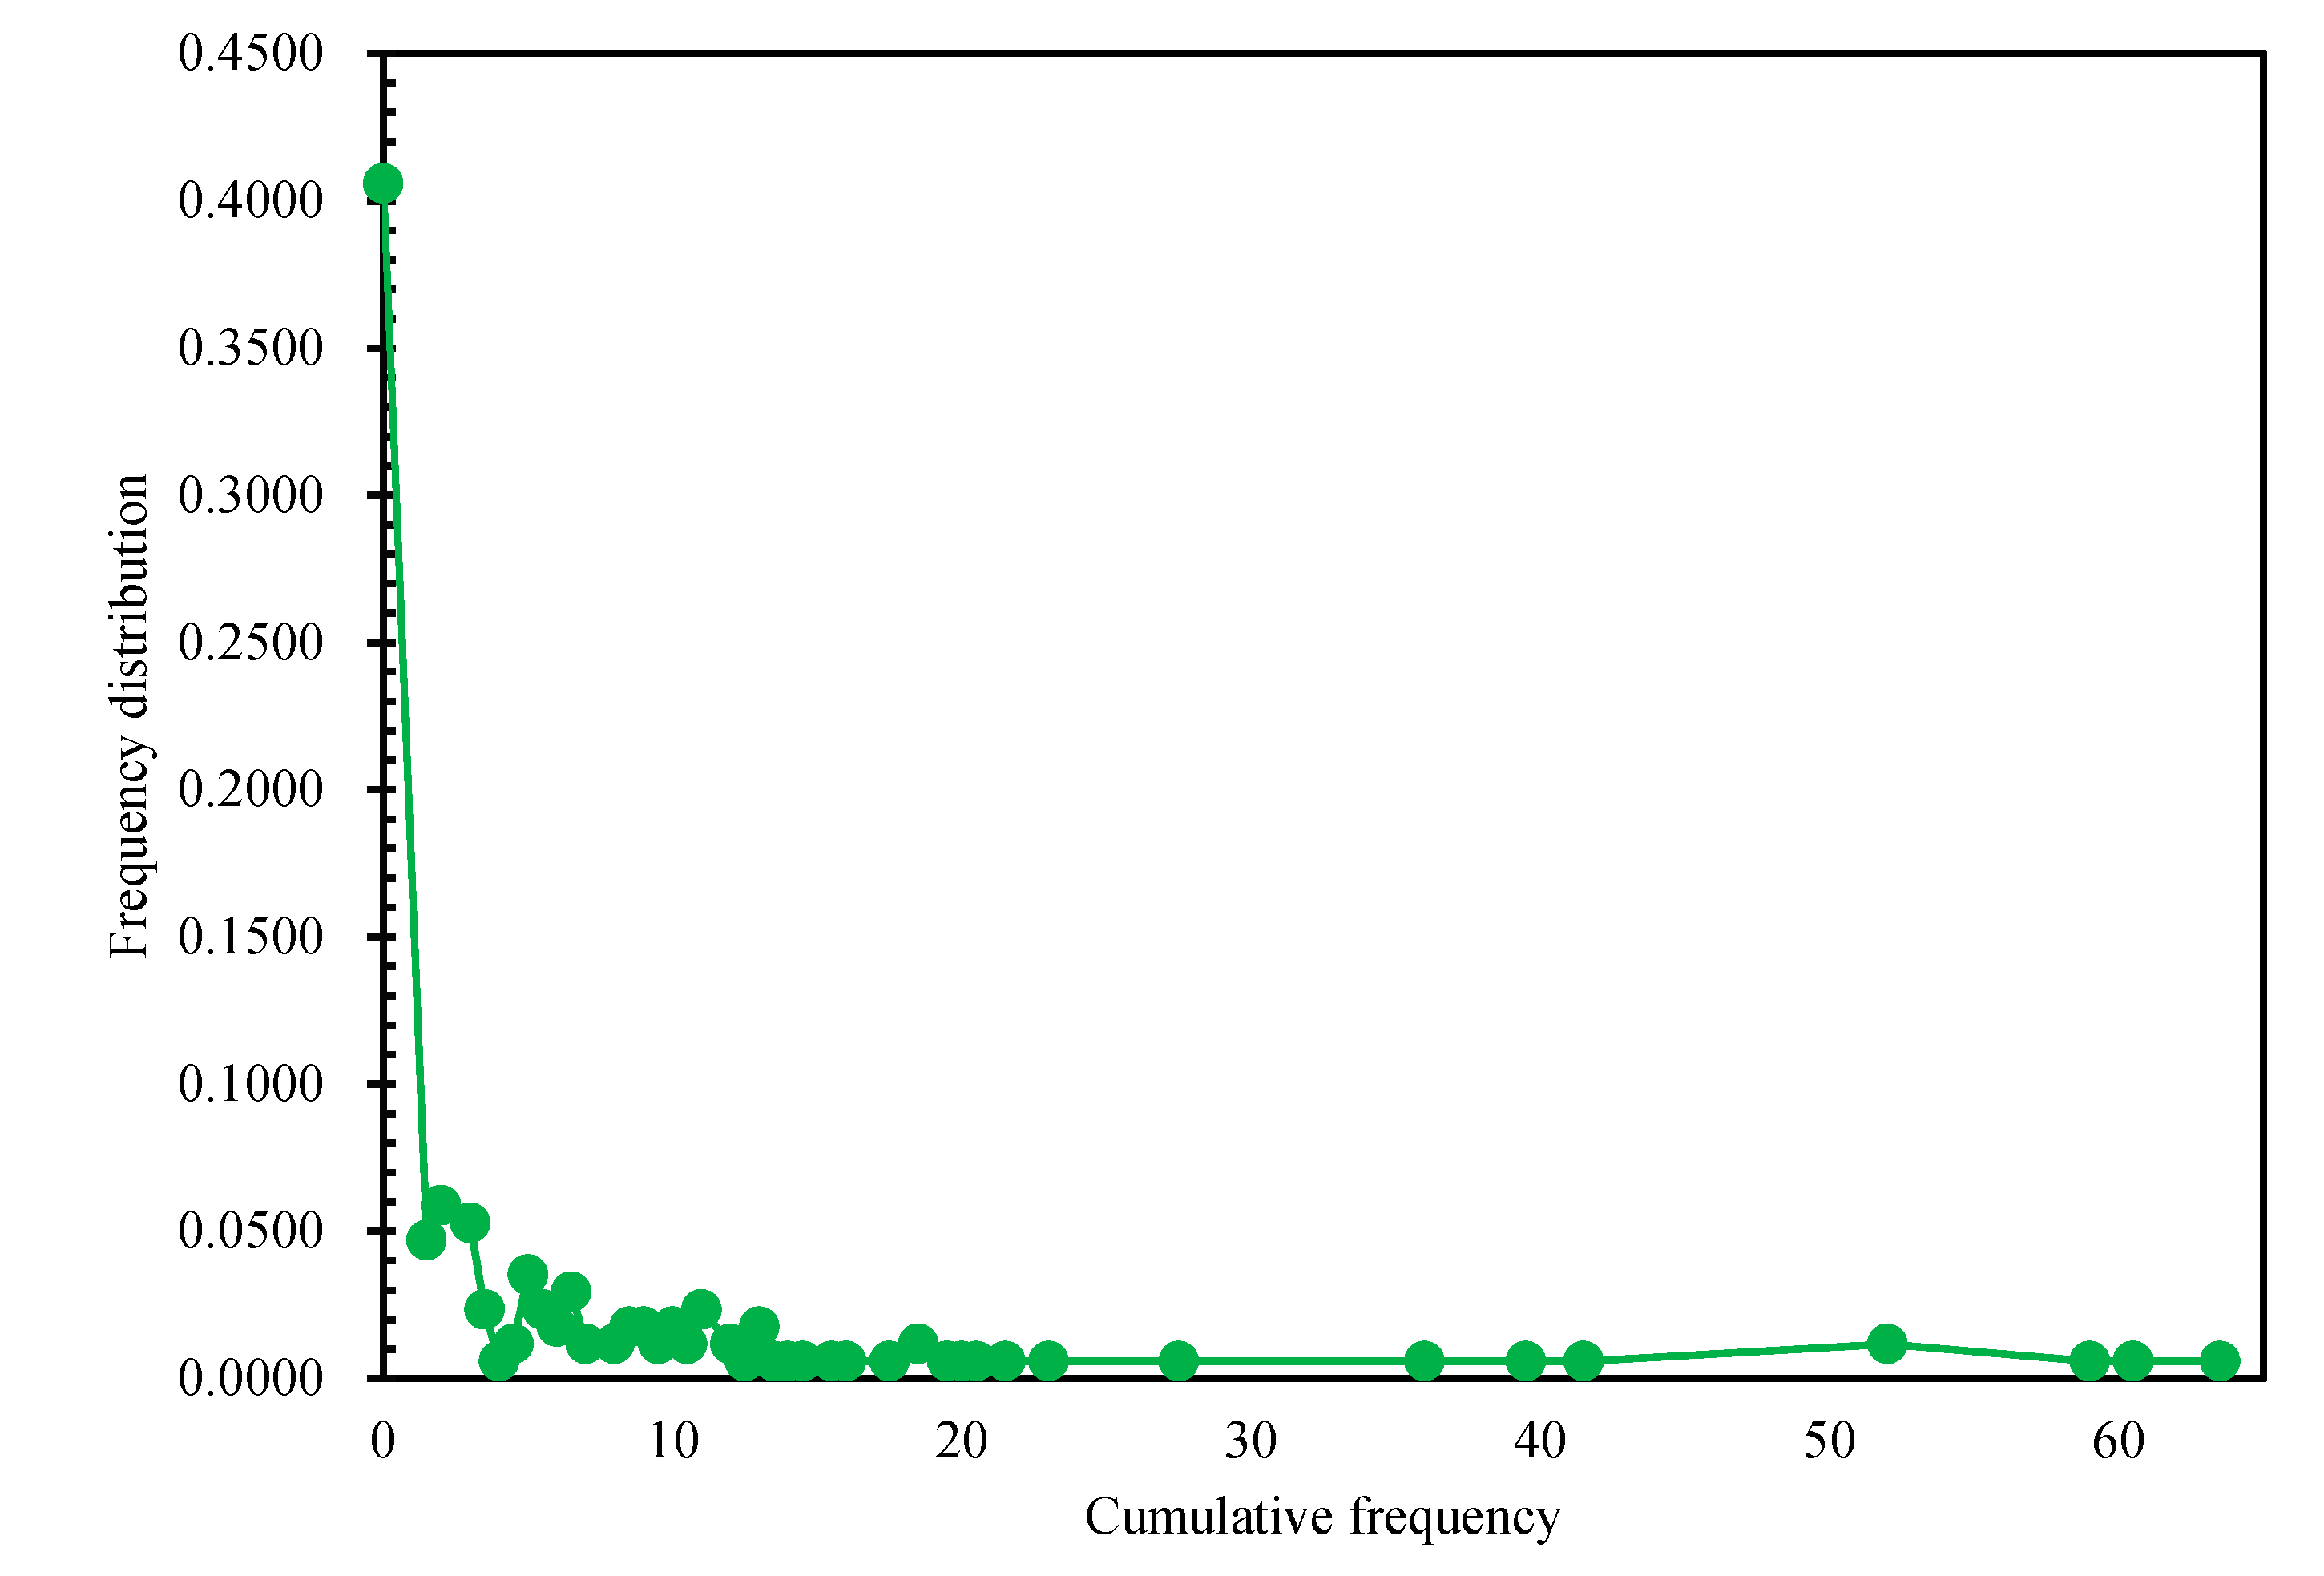
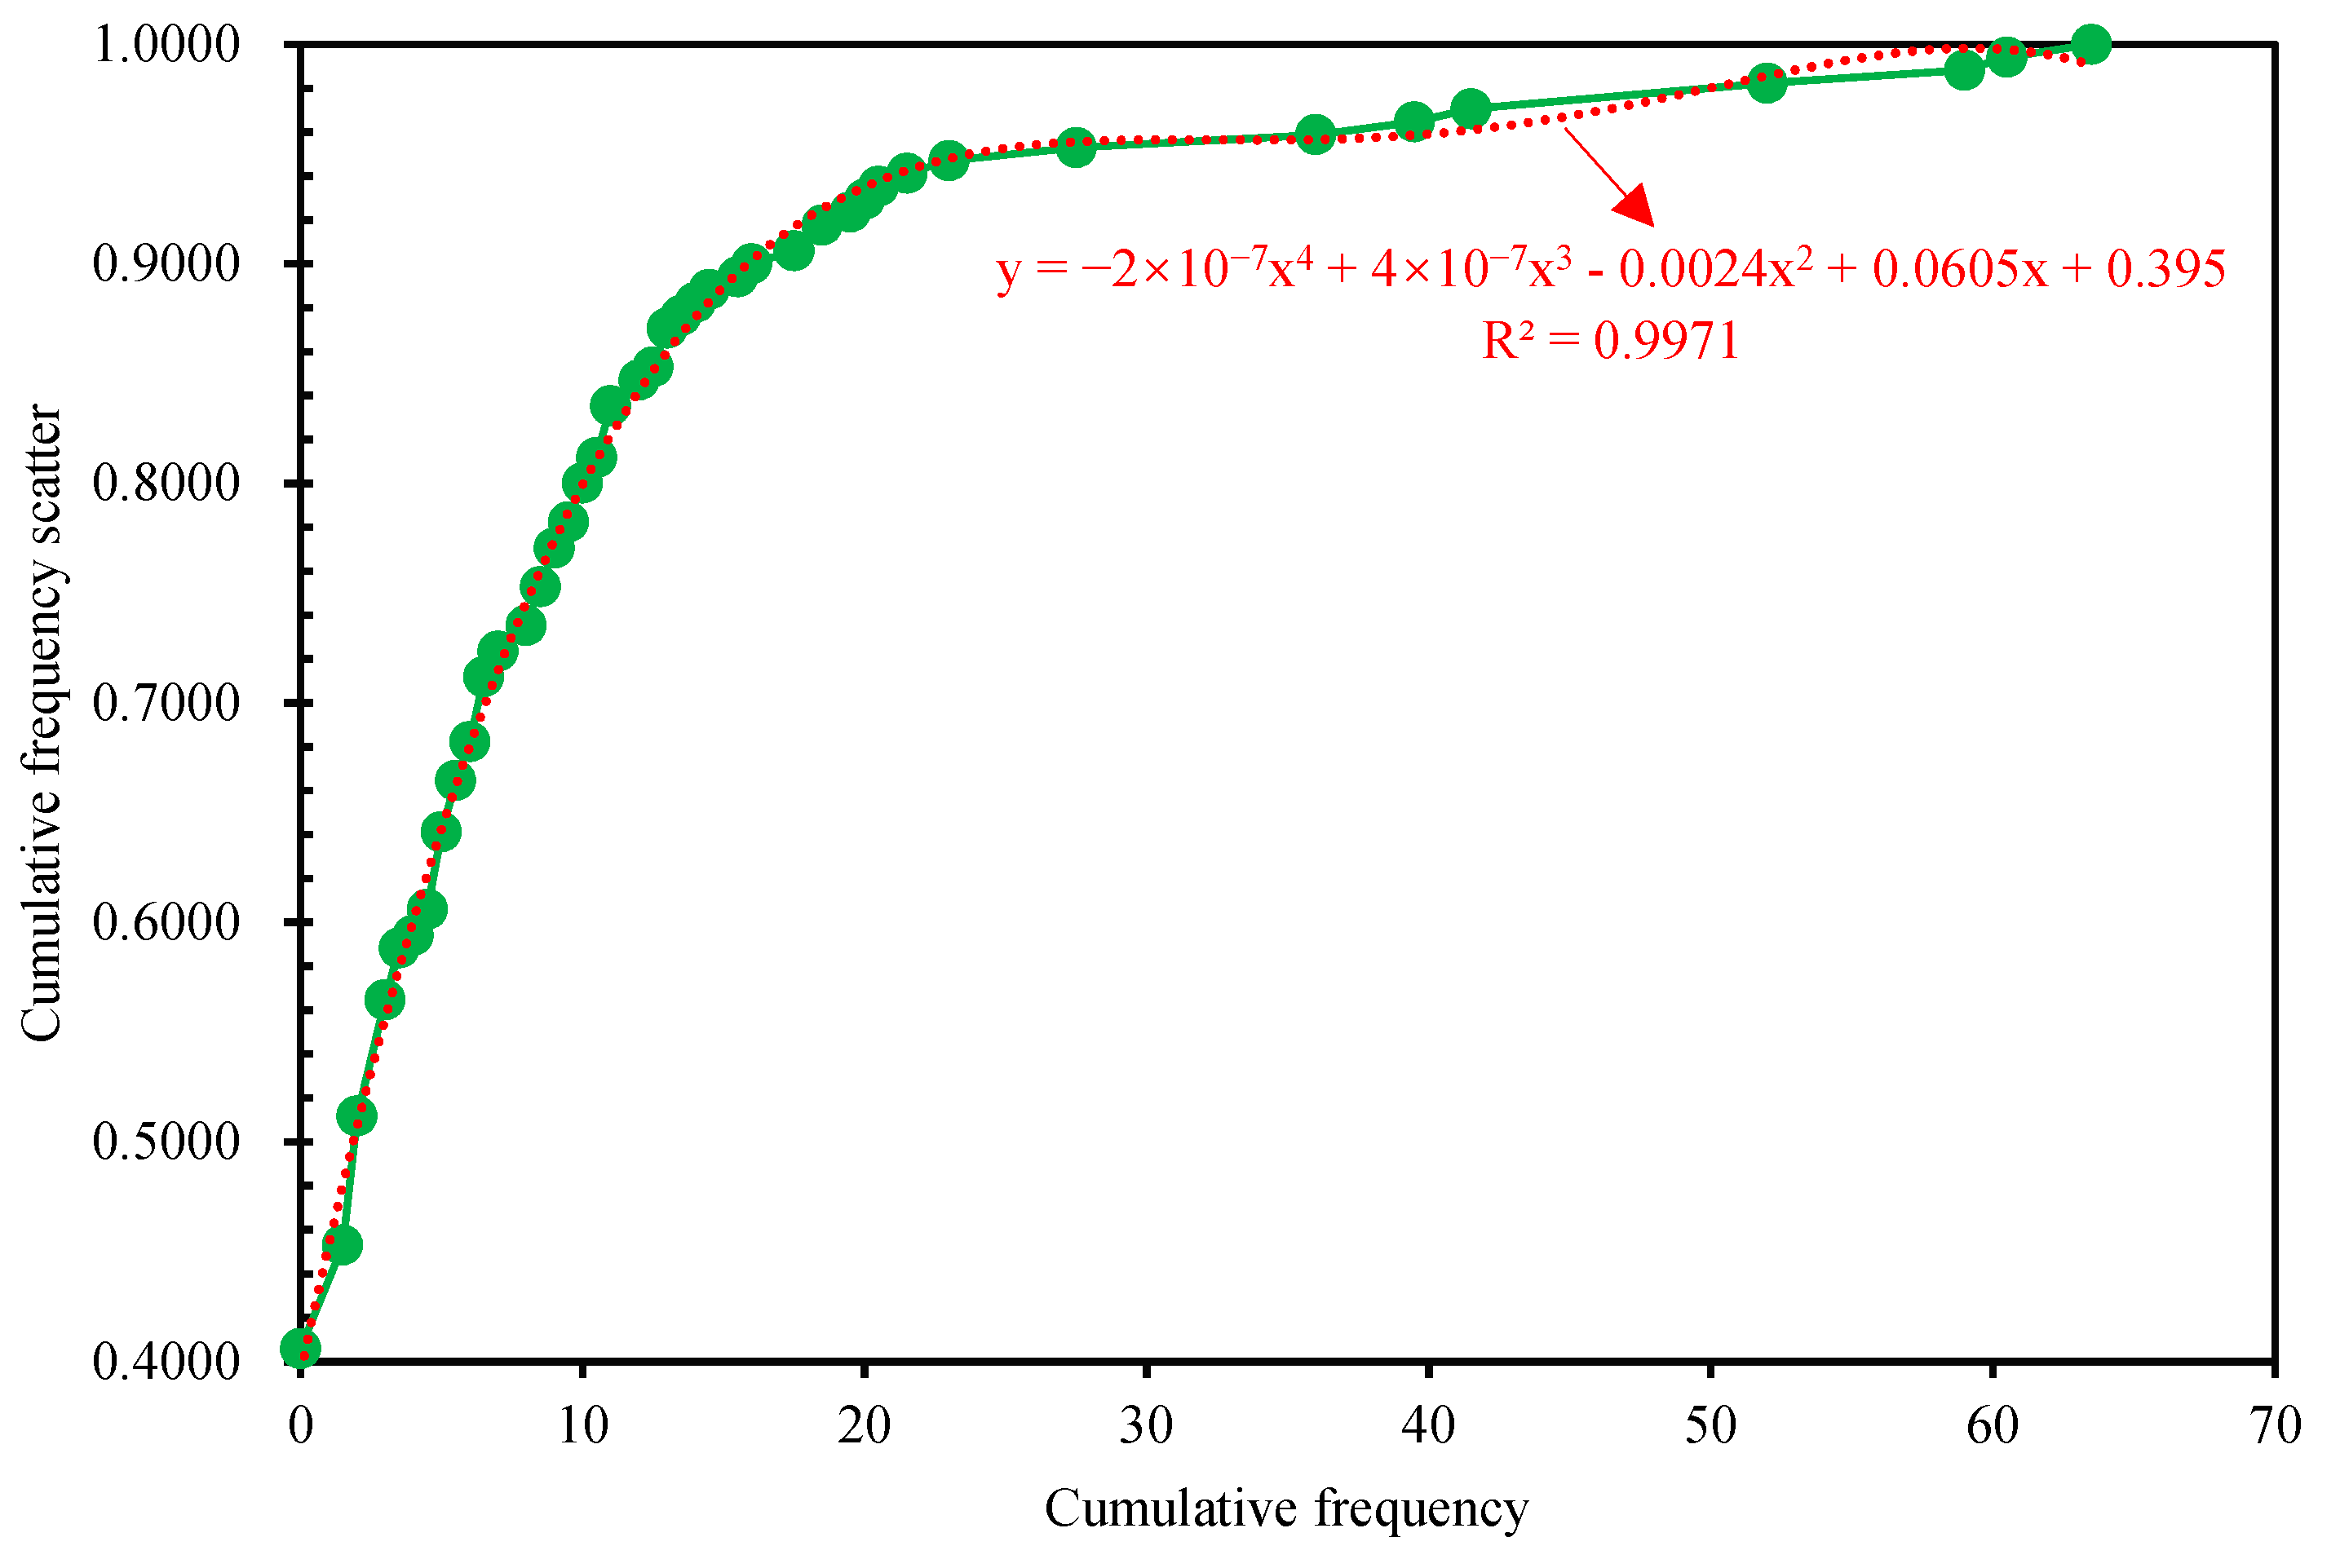
  • The identification of accident-prone points was performed using the improved cumulative frequency curve method. Based on the accident investigation data of the Baoding section of the Zhangshi Expressway, the cumulative frequency of the long downhill tunnel section of the mountain expressways was obtained. Using the equivalent accident numbers N 80 and N 95 equal to 80% and 95% as critical values, the accident-prone points and the potential accident-prone points of this road section were calculated and obtained. The total length of accident-prone points and potential accident-prone points in the Baoding section of Zhangshi Expressway were 6 km and 22 km, respectively, and accounted for 6.98% and 25.58% of the total length, respectively.
Using the Baoding section of Zhangshi Expressway as an example, the data mining was performed to analyze the characteristics of traffic accidents occurring on long downhill tunnels of mountain highways. In the future, the research of this paper could also be applied to traffic accident data mining and characteristic analysis of long downhill tunnels in other sections to arrange active and passive facilities and emergency measures in advance to improve traffic safety. It can also provide some scientific guidance for the planned highway sections of long downhill tunnels to reduce the accident-prone points as much as possible.

Author Contributions

Conceptualization, F.W.; data curation, J.W.; formal analysis, D.G.; methodology, Y.Y. and H.Z.; project administration, F.W.; software, H.Z.; visualization, D.G.; writing—original draft, X.Z. and H.Z.; writing—review and editing, F.W. and H.Z. All authors have read and agreed to the published version of the manuscript.

Funding

The authors acknowledge the financial support received from the Hebei Provincial Department of Transportation, China (No. (2018)409#201816).

Data Availability Statement

If necessary, the data covered in this article are available from the corresponding author.

Conflicts of Interest

The authors declare no conflict of interest.

References

  1. Costa, A.; Figueira, A.; Larocca, A. An eye-tracking study of the effects of dimensions of speed limit traffic signs on a mountain highway on driver perception. Transp. Res. Part F Traffic Psychol. Behav. 2022, 87, 42–53. [Google Scholar] [CrossRef]
  2. Tang, Y.; Peng, X.; Xu, S.; Bai, M.; Lin, L.; Sun, H. Study on Driver Gaze Characteristics in Sight Distance Limited Section of Mountain Highway Based on Visual Information. J. Math. 2022, 2022, 9482875. [Google Scholar] [CrossRef]
  3. Xie, S.; Ji, X.; Yang, W.; Hu, C. Analysis of Traffic Accident Characteristic and Difference in Two-Lane Plateau Mountain Highways. In Proceedings of the 20th COTA International Conference of Transportation Professionals, Xi’an, China, 14–16 August 2020. [Google Scholar]
  4. Men, Y.Z.; Yu, H.B.; Wang, H.; Xu, L. Study on Driving Deceleration Model on Horizontal Curve Sections of Mountain Highways. Adv. Mater. Res. 2012, 479–481, 1660–1664. [Google Scholar] [CrossRef]
  5. Wen, Z.; Zhang, H.; Zhang, R. Safety-Critical Event Identification on Mountain Roads for Traffic Safety and Environmental Protection Using Support Vector Machine with Information Entropy. Sustainability 2021, 13, 4426. [Google Scholar] [CrossRef]
  6. Zhou, H. Research on Prevention and Control Countermeasures to Traffic Accident in Long and Deep Downhill Section of Mountainous Highways. Munic. Eng. Technol. 2011, 29, 22–25. [Google Scholar]
  7. Wang, F.; Gu, D.; Li, Y.; Liu, W.; Wang, G.; Ding, N. Effects of Visual Active Deceleration Devices on Controlling Vehicle Speeds in a Long Downhill Tunnel of an Expressway. Appl. Sci. 2021, 11, 6753. [Google Scholar] [CrossRef]
  8. Ying, L.; Qin, W.; Liu, X. Safety Evaluation and Remediation Measures Research for Continuous Long Downhill Segment in Expressway. West. China Commun. Sci. Technol. 2013, 6, 8–13. [Google Scholar]
  9. Ding, Y.; Li, D.; Huang, M.; Cao, X.; Tang, B. Study on the influence of skid resistance on traffic safety of highway with a high ratio of bridges and tunnels. Transp. Saf. Environ. 2021, 3, tdab025. [Google Scholar] [CrossRef]
  10. Zhou, R.; Wang, Y. Modeling Fire Site Location Considering Traffic Accident Characteristics in Mountainous Expressway. In Proceedings of the 2018 International Conference on Transportation & Logistics, Information & Communication, Smart City (TLICSC 2018), Chengdu, China, 30–31 October 2018. [Google Scholar]
  11. Zou, Y.; Zhang, Y.; Cheng, K. Exploring the Impact of Climate and Extreme Weather on Fatal Traffic Accidents. Sustainability 2021, 13, 390. [Google Scholar] [CrossRef]
  12. Gang, M.; Yan, D. Traffic Accident Analysis and Prevention Measures for Long Downhill Stretch of Highway. Highway 2017, 62, 143–146. [Google Scholar]
  13. Hasegawa, H.; Arimura, M.; Fujii, M.; Tamura, T. A basic study on traffic accident data analysis using support vector machine. In Proceedings of the Eastern Asia Society For Transportation Studies; Eastern Asia Society for Transportation Studies: Tokyo, Japan, 2007; p. 369. [Google Scholar]
  14. Xi, J.; Gao, Z.; Niu, S.; Ding, T.; Ning, G. A Hybrid Algorithm of Traffic Accident Data Mining on Cause Analysis. Math. Probl. Eng. 2013, 2013, 130–137. [Google Scholar] [CrossRef]
  15. Martin, J.L.; Gadegbeku, B.; Wu, D.; Viallon, V.; Laumon, B. Cannabis, alcohol and fatal road accidents. PLoS ONE 2017, 12, e0187320. [Google Scholar] [CrossRef] [PubMed]
  16. Selvaraj, S. Feature Relevance Analysis and Classification of Road Traffic Accident Data through Data Mining Techniques. In Proceedings of the IAENG-World Congress on Engineering and Computer Science, San Francisco, CA, USA, 24–26 October 2012. [Google Scholar]
  17. Feng, H. Traffic Accident Characteristics and Mechanism Analysis of Mountain Highway Tunnel Group. Highway 2016, 61, 134–138. [Google Scholar]
  18. Fang, Q.; Pan, X.; Wen, Y. Study on Early-warning Algorithm of Freeway Traffic Accident Based on Associative Data Mining. Highw. Eng. 2012, 37, 113–115+121. [Google Scholar]
  19. Wu, H.; Guo, L. Data mining model of the road traffic accident based on association rules. Appl. Electron. Tech. 2009, 2, 135–138,142. [Google Scholar]
  20. Yanbin, Y.; Lijuan, Z.; Mengjun, L.; Ling, S. Early Warning of Traffic Accident in Shanghai Based on Large Data Set Mining. In Proceedings of the 2016 International Conference on Intelligent Transportation, Big Data & Smart City (ICITBS), Changsha, China, 17–18 December 2016. [Google Scholar]
  21. Zhang, X.; Fan, L. A decision tree approach for traffic accident analysis of saskatchewan highways. In Proceedings of the 26th IEEE Canadian Conference on Electrical and Computer Engineering (CCECE), Regina, SK, Canada, 5–8 May 2013. [Google Scholar]
  22. Li, J.; Zhang, G.; Ren, H.; Dong, B.; Chen, F. Traffic Accident Characteristics of Long-span Estuary Bridges:an Analysis of Shanghai Yangtze River Tunnel-Bridge. China Transp. Rev. 2019, 41, 18–23+70. [Google Scholar]
  23. Wang, B. The Traffic Accident Characteristics Analysis of Highway Tunnel. Traffic Transp. 2012, 7, 164–167. [Google Scholar]
  24. Zhou, J.; Wang, J.; Lu, L. Research on Statistical Analysis of Traffic Accident Characteristics in the Urban River-crossing Tunnel. Commun. Shipp. 2019, 6, 75–79. [Google Scholar]
  25. Takahiro, T.; Toshio, Y.; Jian, X. Study on Accident Risk considering Traffic States and Road Geometry in Intercity Expressways. Jste J. Traffic Eng. 2019, 5, A-199–A-207. [Google Scholar]
  26. Ma, Z.; Fang, S.; Liu, S.; Cai, B. Analysis of the Relationship between the Number of Traffic Accidents and the Traffic Flow & Section Location in Extra Long Tunnel. Engineering 2020, 12, 71. [Google Scholar]
  27. Zheng, Y.Y.; Mei, Y. Analysis of Influencing Factors of Traffic Accidents in Undersea Tunnel. J. Eng. Res. Rep. 2020, 15, 37–49. [Google Scholar] [CrossRef]
  28. Li, Z.; Xing, G.; Zhao, X.; Li, H. Impact of the connected vehicle environment on tunnel entrance zone. Accid. Anal. Prev. 2021, 157, 106145. [Google Scholar] [CrossRef] [PubMed]
  29. Hassan, A.; Sturgess, C. Road Traffic Accident Data Collection and Analysis for Road Safety Research. In Proceedings of the 4th International Forum of Traffic Safety, Changsha, China, 25 November 2005. [Google Scholar]
  30. Rogalewicz, M.; Sika, R. Methodologies of Knowledge Discovery from Data and Data Mining Methods in Mechanical Engineering. Manag. Prod. Eng. Rev. 2016, 7, 97–108. [Google Scholar] [CrossRef] [Green Version]
  31. Shiran, G.; Imaninasab, R.; Khayamim, R. Crash Severity Analysis of Highways Based on Multinomial Logistic Regression Model, Decision Tree Techniques, and Artificial Neural Network: A Modeling Comparison. Sustainability 2021, 13, 5670. [Google Scholar] [CrossRef]
  32. Santos, V.B.; Pires, C.E.S.; Nascimento, D.C.; de Queiroz, A.R.M. A Decision Tree Ensemble Model for Predicting Bus Bunching. Comput. J. 2021. [Google Scholar] [CrossRef]
Figure 1. Decision tree branching process.
Sustainability 14 08460 g001
Figure 2. Sliding window method.
Sustainability 14 08460 g002
Figure 3. Technical map.
Sustainability 14 08460 g003
Figure 4. Monthly distribution of traffic volume in Baoding section of Zhangshi Expressway.
Sustainability 14 08460 g004
Figure 5. Monthly average distribution of traffic accidents in the Baoding section of Zhangshi Expressway.
Sustainability 14 08460 g005
Figure 6. Weekly average daily traffic volume in the Baoding section of Zhangshi Expressway.
Sustainability 14 08460 g006
Figure 7. Weekly Average Daily Traffic Accident Distribution on Baoding Section of Zhangshi Expressway.
Sustainability 14 08460 g007
Figure 8. Time-varying diagram of 24-h traffic volume in Baoding section of Zhangshi Expressway.
Sustainability 14 08460 g008
Figure 9. Hourly distribution of traffic accidents in the Baoding section of Zhangshi Expressway.
Sustainability 14 08460 g009
Figure 10. Space division of highway tunnel.
Sustainability 14 08460 g010
Figure 11. Traffic accident form distribution of long downhill tunnel section of Zhangshi Expressway.
Sustainability 14 08460 g011
Figure 12. Vehicle types distribution proportion ((a) accident vehicle types; (b) traffic volume vehicle types).
Sustainability 14 08460 g012
Figure 13. Longitudinal alignment distribution of accidents ((a) Slope distribution of traffic accidents; (b) Slope length of traffic accidents).
Sustainability 14 08460 g013
Figure 14. Horizontal curve radius distribution of traffic accidents.
Sustainability 14 08460 g014
Figure 15. Accidents cause classification decision tree.
Sustainability 14 08460 g015
Figure 16. Statistical distribution of equivalent accidents in the Baoding Section of Zhangshi Expressway.
Sustainability 14 08460 g016
Figure 17. Frequency distribution of equivalent accidents in Baoding Section of Zhangshi Expressway.
Sustainability 14 08460 g017
Figure 18. Cumulative frequency scatters plot of the equivalent accident number in the Baoding section of Zhangshi Expressway.
Sustainability 14 08460 g018
Table 1. Summary of data mining methods.
ControlsThe Parameters and Variables Directly RelatedResults Reference
Improved support vector machine approachDriver’s operating behavior, vehicle driving status, and road traffic environment informationBetter classification in specific scenarios on mountain roads[5]
Accident count model and logarithmic change modelSocial development and climatic factorsAnalysis of factors influencing the frequency of fatal traffic accidents[11]
Support vector machine approach to data miningThe driving environment, road structure, and usage characteristicsAreas where serious accidents are predicted to occur.[13]
Random treeAge range and drug involvementA random tree classifier is better in the road accident model based on injury severity.[16]
Association rule mining methodsWeather and accident causesAccurate warning to improve traffic safety[18]
Multidimensional multi-data type Apriori algorithm for association analysisDriver, vehicle, road, gas, and timeAnalyze road traffic accident history data and realize system decision analysis module.[19]
Decision tree algorithmAge, season, and genderThe decision tree approach for accident analysis has advantages[21]
Descriptive statistics and cross-tabulation methodsHourly, weekly, seasonal, and spatial distributionPrecise analysis of the distribution of accident reporting periods[22]
Table 2. Spatial distribution of traffic accidents in the long downhill tunnel section of Zhangshi Expressway.
Name Section 1Section 2Section 3Section 4Entire Study Area
Taipingliang tunnelLength0.200.200.601.122.12
Accident number6410
Accident frequency (times/km)0.000.0010.003.5813.58
Tayayi tunnelLength0.200.200.420.82
Accident number246
Accident frequency10.0020.000.0030.00
Hanzhang tunnelLength0.200.200.601.652.65
Accident number224
Accident frequency0.000.003.331.214.55
Baijiazhuang tunnelLength0.200.200.600.501.50
Accident number426
Accident frequency0.000.006.674.0010.67
Yuejiagou tunnelLength0.200.200.603.314.31
Accident number1212
Accident frequency0.000.000.003.633.63
Zijingguan tunnel ILength0.200.200.603.344.34
Accident number642434
Accident frequency30.000.006.677.1943.86
Zijingguan tunnel IILength0.200.180.38
Accident number628
Accident frequency30.0011.0541.05
Yunmengshan tunnel ILength0.200.200.600.971.97
Accident number8141840
Accident frequency40.000.0023.3318.5281.85
Yunmengshan tunnel ⅡLength0.200.200.350.75
Accident number66
Accident frequency0.000.0017.0517.05
Yunmengshan tunnel ⅢLength0.200.200.601.222.22
Accident number104822
Accident frequency50.0020.000.006.5676.56
Xiling tunnelLength0.200.200.140.54
Accident number22
Accident frequency10.0010.00
SummaryLength2.202.185.1112.1121.59
Accident number34103670150
Accident frequency15.454.597.055.786.95
Table 3. Characteristic variable set of a traffic accident on mountain expressways.
Variable Set PropertiesVariable Description
Time of accidentDay = 0, Night = 1
WeatherSunny = 0, Non sunny = 1
Temperature−10–0 °C = 0, 0–10 °C = 1,
10–20 °C = 2, 20–30 °C = 3
30–40 °C = 4
Wind directionNorth wind = 0, Northeast wind = 1, East wind = 2, Southeast wind = 3, South wind = 4, Northwest wind = 5, West wind = 6, Southwest wind = 7
Wind power≤3 level = 0, 3–4 level = 1, 4–5 level = 2
Slope length0–500 m = 0, 500–1000 m = 1, 1000–2000 m = 2, >2000 m = 3
Slope−4–−3% = 0,−3–−2% = 1, −2–−1% = 2, −1–0% = 3, 0–1% = 4, 1–2% = 5, 2–3% = 6
Super elevation2% = 0,3% = 1, 4% = 2, 5% = 3
Horizontal curve radiusR is ∞ = 0, 500–1000 = 1, 1000–2000 = 2, 2000–3000 = 3, >3000 = 4
Rate of heavy vehicle0.1–0.2 = 0, 0.2–0.3 = 1, 0.3–0.4 = 2, 0.4–0.5 = 3, >0.5 = 4
Publisher’s Note: MDPI stays neutral with regard to jurisdictional claims in published maps and institutional affiliations.

