Abstract
Quantifying the characteristics of urban expansion as well as influencing factors is essential for the simulation and prediction of urban expansion. In this study, we extracted the built-up regions of 14 central cities in the Hunan province using the DMSP-OLS night light remote sensing datasets from 1992 to 2018, and evaluated the spatial and temporal characteristics of the built-up regions in terms of the area, expansion speed, and main expansion direction. The backpropagation (BP) neural network and autoregressive integrated moving average (ARIMA) model were used to predict the area of the built-up regions from 2019 to 2026. The model predictions were based on the GDP, ratio of the secondary industry output to the GDP, ratio of the tertiary industry output to the GDP, year-end urban population, and urban road area. The results demonstrated that the built-up area and expansion speed of the central cities in the eastern part of the Hunan province were significantly higher than those in the western part. The main expansion directions of the 14 central cities were east and south. The urban road area, year-end urban population, and GDP were the main driving factors of the expansion. The urban expansion model based on the BP neural network provided a high prediction accuracy (R = 0.966). It was estimated that the total area of urban built-up regions in the Hunan province will reach 2463.80 km2 by 2026. These findings provide a new perspective for predicting urban areas rapidly and simply, and it also provides a useful reference for studying the spatial expansion characteristics of central cities and formulating a sustainable urban development strategy during the 14th Five-Year Plan of China.
1. Introduction
Urbanization, which represents a substantial change in human history, is significant for the development of society. However, as stated by Friedman, “China’s urbanization process is a result of forces that in their origin are essentially endogenous.” [1], and its process is characterized by complexity and comprehensiveness [2], thereby making it an enduring research topic in several disciplines. In recent years, urban sprawl has exacerbated social and environmental problems in cities and the surrounding areas, which means that the effective expansion of urban space has become the focus of attention and the study of urban sprawl has emerged as a new hot spot in urbanization research [3,4].
Existing domestic researches on urban spatial expansion mainly focus on three aspects: firstly, the modes and characteristics of urban spatial expansion. For example, Wang et al. [5] analyzed the spatio-temporal characteristics of spatial morphological changes of Megacities in China and summarized the spatial expansion modes of typical Chinese cities. Kuang et al. [6], Li et al. [7], Lin et al. [8], Qiao et al. [9], and Fan et al. [10] made a detailed analysis of the spatial expansion patterns and characteristics of Beijing, Tianjing, Xiamen, Nanjing, and Chengdu City, respectively. Secondly, the analysis of influencing factors of spatial expansion. For example, Wang et al. [11] believed that GDP growth was the main driving factor of spatial expansion in Putian City, Fujian Province. Wang et al. [12] reported that the development of tertiary industry is a major driving factor. Long et al., [13] believed that urbanization and suburbanization jointly drive the outward extension of urban boundaries. In addition, Huang et al. [14] divided the driving factors of urban spatial expansion into macro-level (urban planning, policy and other government behaviors, historical old urban pattern), meso-level (economic and social factors), and micro-level (natural geographical location, transportation facilities). The third is the simulation research of urban spatial expansion, such as Cellular Automata (CA) model, agglomeration model (DLA), multi-agent model (MAM), neural network, typing theory, genetic immune system, etc. [15,16,17,18,19,20] which have been widely used in the researches of urban spatial expansion in recent years. Therefore, it is critical to understand the driving force of urban expansion to better simulate the spatial pattern of urban development in the future and formulate sustainable urban development strategy.
CA and regression model are traditional methods for urban sprawl prediction [21,22]. CA model’s prediction relies on rules and the attribute changes of neighbor cells so that it may not reflect the influences caused by distant cells, which severely limited its scope [23]. The internal drivers of urban expansion are interconnected for economic and demographic relationships between distant cities, which is difficult to be detected by CA. Regression models such as the Geographically Weighted Regression (GWR) model fit the urbanization well [24]. However, the qualification of nonlinear regressions is substantially influenced by the equations, and inappropriate equations may result in large residuals. In contrast, the Back Propagation (BP) artificial neural network model based on the principle of gradient descent can approximate any nonlinear continuous function with arbitrary accuracy, which makes it more efficient and accurate than regression models when facing complex nonlinear problems. In addition, the BP neural network can automatically extract the "reasonable rules" between input and output data through training and adaptively memorize them [25]. Thus, it can reflect the impact of small changes in the driving factors and is more sensitive to the driving factors between different cities. Since the process of urban expansion is complex and the BP artificial neural network method has excellent mapping ability of nonlinear complex relationship, it can avoid defects such as over-fitting, thus it is worth trying to simulate urban expansion by using an artificial neural network method.
Nighttime light remote sensing is an important method for researching urban spatial expansion and it has been used extensively in research concerning urbanization owing to its strong operability and spatio-temporal continuity [26,27]. Studies show that there is a high correlation between the light index and the composite index reflecting the urbanization level, which can be used to analyze the urbanization level and its spatio-temporal differentiation and monitor the urbanization process in China [28,29]. Researchers in China have used this method to study urban expansion on a national scale, and within specific economic zones and belts [30,31,32,33]. However, these studies were biased towards the country as a whole or economically developed regions on the spatial scale (mainly eastern provinces and centrally administered municipalities of China) [33,34]. Whether night light remote sensing can be applied to the relatively underdeveloped cities in central and western China needs to be tested. The central and western regions of China are essentially different from the densely populated eastern regions in terms of economic development stage and social organization structure. However, with the adjustment of national macro-regional strategy and the guidance of local government policies in the new century, the cities in the central and western regions have some new changes and characteristics. As one of the most important provinces in central China, the Hunan province has received extensive attention for its rapid economic development and urbanization in recent years. It can be regarded as a typical case for the study of nighttime light remote sensing in urban spatial expansion in central and western China.
Therefore, in this study, 14 central cities in the Hunan province (which are shown in Figure 1, including Chang Sha, Zhu Zhou, Xiang Tan, Heng Yang, Shao Yang, Yi Yang, Yue Yang, Lou Di, Chang De, Huai Hua, Yong Zhou, Chen Zhou, Zhang Jiajie, and Ji Shou) were taken as the research object, and continuous nighttime light remote sensing data from the Hunan province from 1992 to 2018 were introduced. Five most representative and quantifiable indicators of urban driving force were selected to analyze the spatial and temporal characteristics of the expansion of central cities in the Hunan province, including GDP, secondary industry output value to GDP ratio (hereinafter referred to as the secondary industry ratio), tertiary industry output value to GDP ratio (hereinafter referred to as the tertiary industry ratio), year-end urban population, and urban road area (hereinafter referred to as the road area). On this basis, the backpropagation (BP) neural network and autoregressive integrated moving average (ARIMA) model were used to predict the expansion trend of built-up areas in the Hunan province from 2019 to 2026. Our main objectives were to: (1) investigate the spatial and temporal characteristics of central city spatial expansion in the Hunan province; (2) explore the dominant factors affecting the spatial expansion of central cities and its underlying mechanisms, and (3) predict the expansion trend of urban built-up areas in the Hunan province in the future.
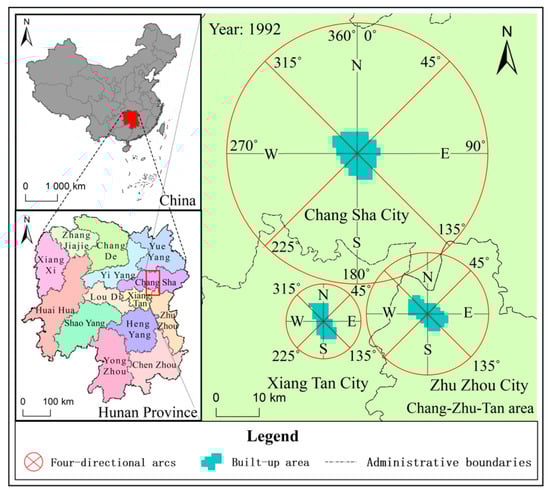
Figure 1.
Four-directional arcs in Chang-Zhu-Tan area in 1992.
2. Materials and Methods
2.1. Data Source
DMSP-OLS (Defense Meteorological Satellite Program-Operational Linescan System) data is representative of nighttime lighting data and has the advantage of high resolution and large time span compared to other nightlight remote sensing data. In this research, the DMSP-OLS nighttime light remote sensing data were used to extract the built-up urban areas in the Hunan province [35], and the selected image data were those produced from the research of Zhao et al. [36]. They constructed data series of DMSP-OLS and NPP-VIIRS (National Polar-orbiting Operational Environmental Satellite System Preparatory Project-Visible infrared Imaging Radiometer) from 1992 to 2018, which combined the temporal advantages of the DMSP-OLS and NPP-VIIRS data, and exhibited high accuracy in extracting urban expansion. The images were resampled into 27-year annual average images with integer gray values, or digital number (DN) values, of 0 to 63 and a resolution of 1 km.
The statistical data of the Hunan province and the 14 cities that were used for the analytical modeling were obtained from the China Statistical Yearbook, Hunan Statistical Yearbook, China Urban Statistical Yearbook, and Thirty Years of Reform and Opening Up in Hunan.
2.2. Extraction of Urban Expansion Feature Data
2.2.1. Extraction of Scope and Expansion Directions of Built-Up Area
We adopted the method of determining the image element value based on statistical data to extract the scope of the urban built-up areas and limited the scope of the image element extraction using urban administrative boundaries [37,38] to improve the accuracy. The specific steps were as follows: (1) Crop the remote sensing data according to the administrative boundaries of cities and towns. (2) Find a DN value threshold that total area of elements with DN value higher than it has the smallest difference with the statistical built-up area [39]. (3) Confirm the extent of the built-up area and calculate the error. According to the above operations, the linear regression coefficients of the DN values for each image element over time were calculated by superimposing all light remote sensing images in chronological order and assigning these to the new images to obtain the light variability images. Moreover, as the expansion of urban space is based on the development of existing urban space [40], a four-directional arc could be established using the geometric center of the built-up area patches in central Hunan City in the starting year (1992) (Figure 1). The four-directional arc consists of four 90-degree circular arcs, each of which is bisected by a positive directional line at the center of the built-up area. The area of the circles is equal to the area of the outer tangent circle when the built-up area is at its maximum in 27 years. ArcGIS was used to determine the areas of the patches in the four-directional arcs in different years to obtain the data of the built-up area in each direction for each year in the 14 central cities. The information regarding the expansion direction of urban built-up areas was analyzed by comparing these data and referring to the spatial distribution of the variability of nighttime lighting DN values.
2.2.2. Expansion Speed of Built-Up Areas
To measure the dynamic change in the built-up area of each central city effectively, the built-up area expansion rate (CS) adopted in this study was obtained by subtracting two data (Si) and (Si−t) from the same city in different years and dividing the result by the interval year (t):
2.3. Backpropagation Neural Network Model
The backpropagation (BP) algorithm uses a gradient descent strategy to adjust the parameters of each node in different layers of the neural network in the direction of the negative gradient of the error function [41]. Thus, the output prediction value continuously approximates the actual value to achieve the model construction. The sigmoid function was selected for this study:
During the training process, each year of data for each central city in the Hunan province was used as a sample, the data of five corresponding factors were the sample input value, and the statistical area of the built-up region corresponding to that year of the city was considered as the output reference value. All samples are normalized before training. The number of nodes in the hidden layer was confirmed to be 9, the number of iterations was 200, the learning rate was 0.01, and all other parameters were default values. To prevent model overfitting, a Bayesian regularization algorithm was invoked to control the average error of the output and sample data during the calculations.
The datasets for the BP model, including input and output values from the whole observational datasets, were randomly divided into two parts: 321 normalized samples, which accounted for 80% of the total number of samples (401 samples), were used for modeling as calibration set. The other 80 samples, which accounted for 20% of the total number of samples, were selected to test the model’s generalization ability and to be validation set. To evaluate the performance of the BP model, we conducted a comparison using of coefficient of determination (R), Mean Absolute Error (MAE), and Mean Square Error (MSE), which is the performance function of an artificial neural network. When the model fitting accuracy increased, MAE and MSE decreased significantly. An F-test was performed on the output data and actual data to verify the reliability of the model results as well. When the test coefficient p of the result is less than 0.05, the BP model output data is defined insignificantly different from the actual data. Finally, we chose the result that passed the F-test successfully with the R-value closes to 1 and the lowest MSE and MAE in both two sets.
2.4. Correlation Analysis and Prediction of Factors
The development process of the built-up area of each central city in the Hunan province exhibited unique characteristics, and the degree of influence of the five factors on the built-up areas varied among the different central cities. For example, the urbanization process of the eastern cities of the Hunan province is obviously faster than that of the western cities, and the industrial structure is better than that of the western cities, which is manifested in the rapid development of the tertiary industry. However, in the mountainous area of western the Hunan province, the limitation of population scale and the imperfect infrastructure such as roads hinder the expansion of urban space to a certain extent. On this basis, a matrix was established to calculate the correlation coefficients of the dependent variable and factors. The correlation coefficients of the five independent variables and dependent variable were obtained for comparison and analysis. If the correlation coefficient was negative, the factor was negatively correlated with the built-up area and was a hindering factor for spatial expansion.
The forecast factor values for 2019 to 2026 were calculated based on the ARIMA model. This model is an integrated model based on time series, which has strong predictive power for data with stable time series [42] and has also been used in studies in the field of geography [43,44]. Thus, it was applicable to the prediction of the factor data selected in this study. When the lag operator L is introduced, the expression is as follows:
where εt is the white noise series, Xt is the time series value, ∅i (i = 1, 2, 3…p) is the autoregressive coefficient, and θi (i = 1, 2, 3…q) is the sliding average coefficient. Augmented Dickey–Fuller and Kwiatkowski–Phillips–Schmidt–Shin (KPSS) tests were performed on the differentially processed data to increase the model accuracy, and the data for each factor for the years 1992 to 2016 (GDP and proportions of secondary and tertiary industries to 2017) were entered. Calculations were performed with data for 2017 to 2018 (GDP and proportion of secondary and tertiary industries to 2019) as a test, and the model parameters were determined by considering the prediction error, Durbin–Watson (DW) test value, Akaike information criterion (AIC), Bayesian information criterion (BIC), and autocorrelation function and partial autocorrelation function distributions. AIC and BIC were metrics of superiority to the ARIMA model, with their values increasing as the model becomes more complex or the likelihood function becomes smaller. Autocorrelation was verified by DW as well (Figure 2). Autocorrelation was insignificant when DW values were closed to 2.
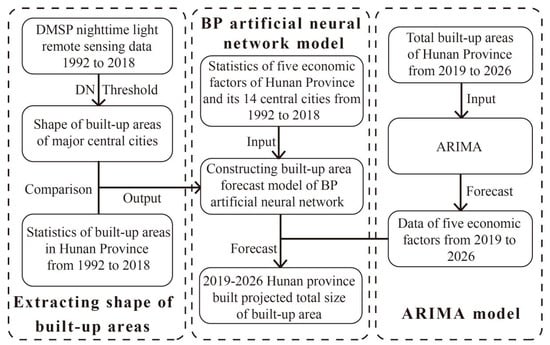
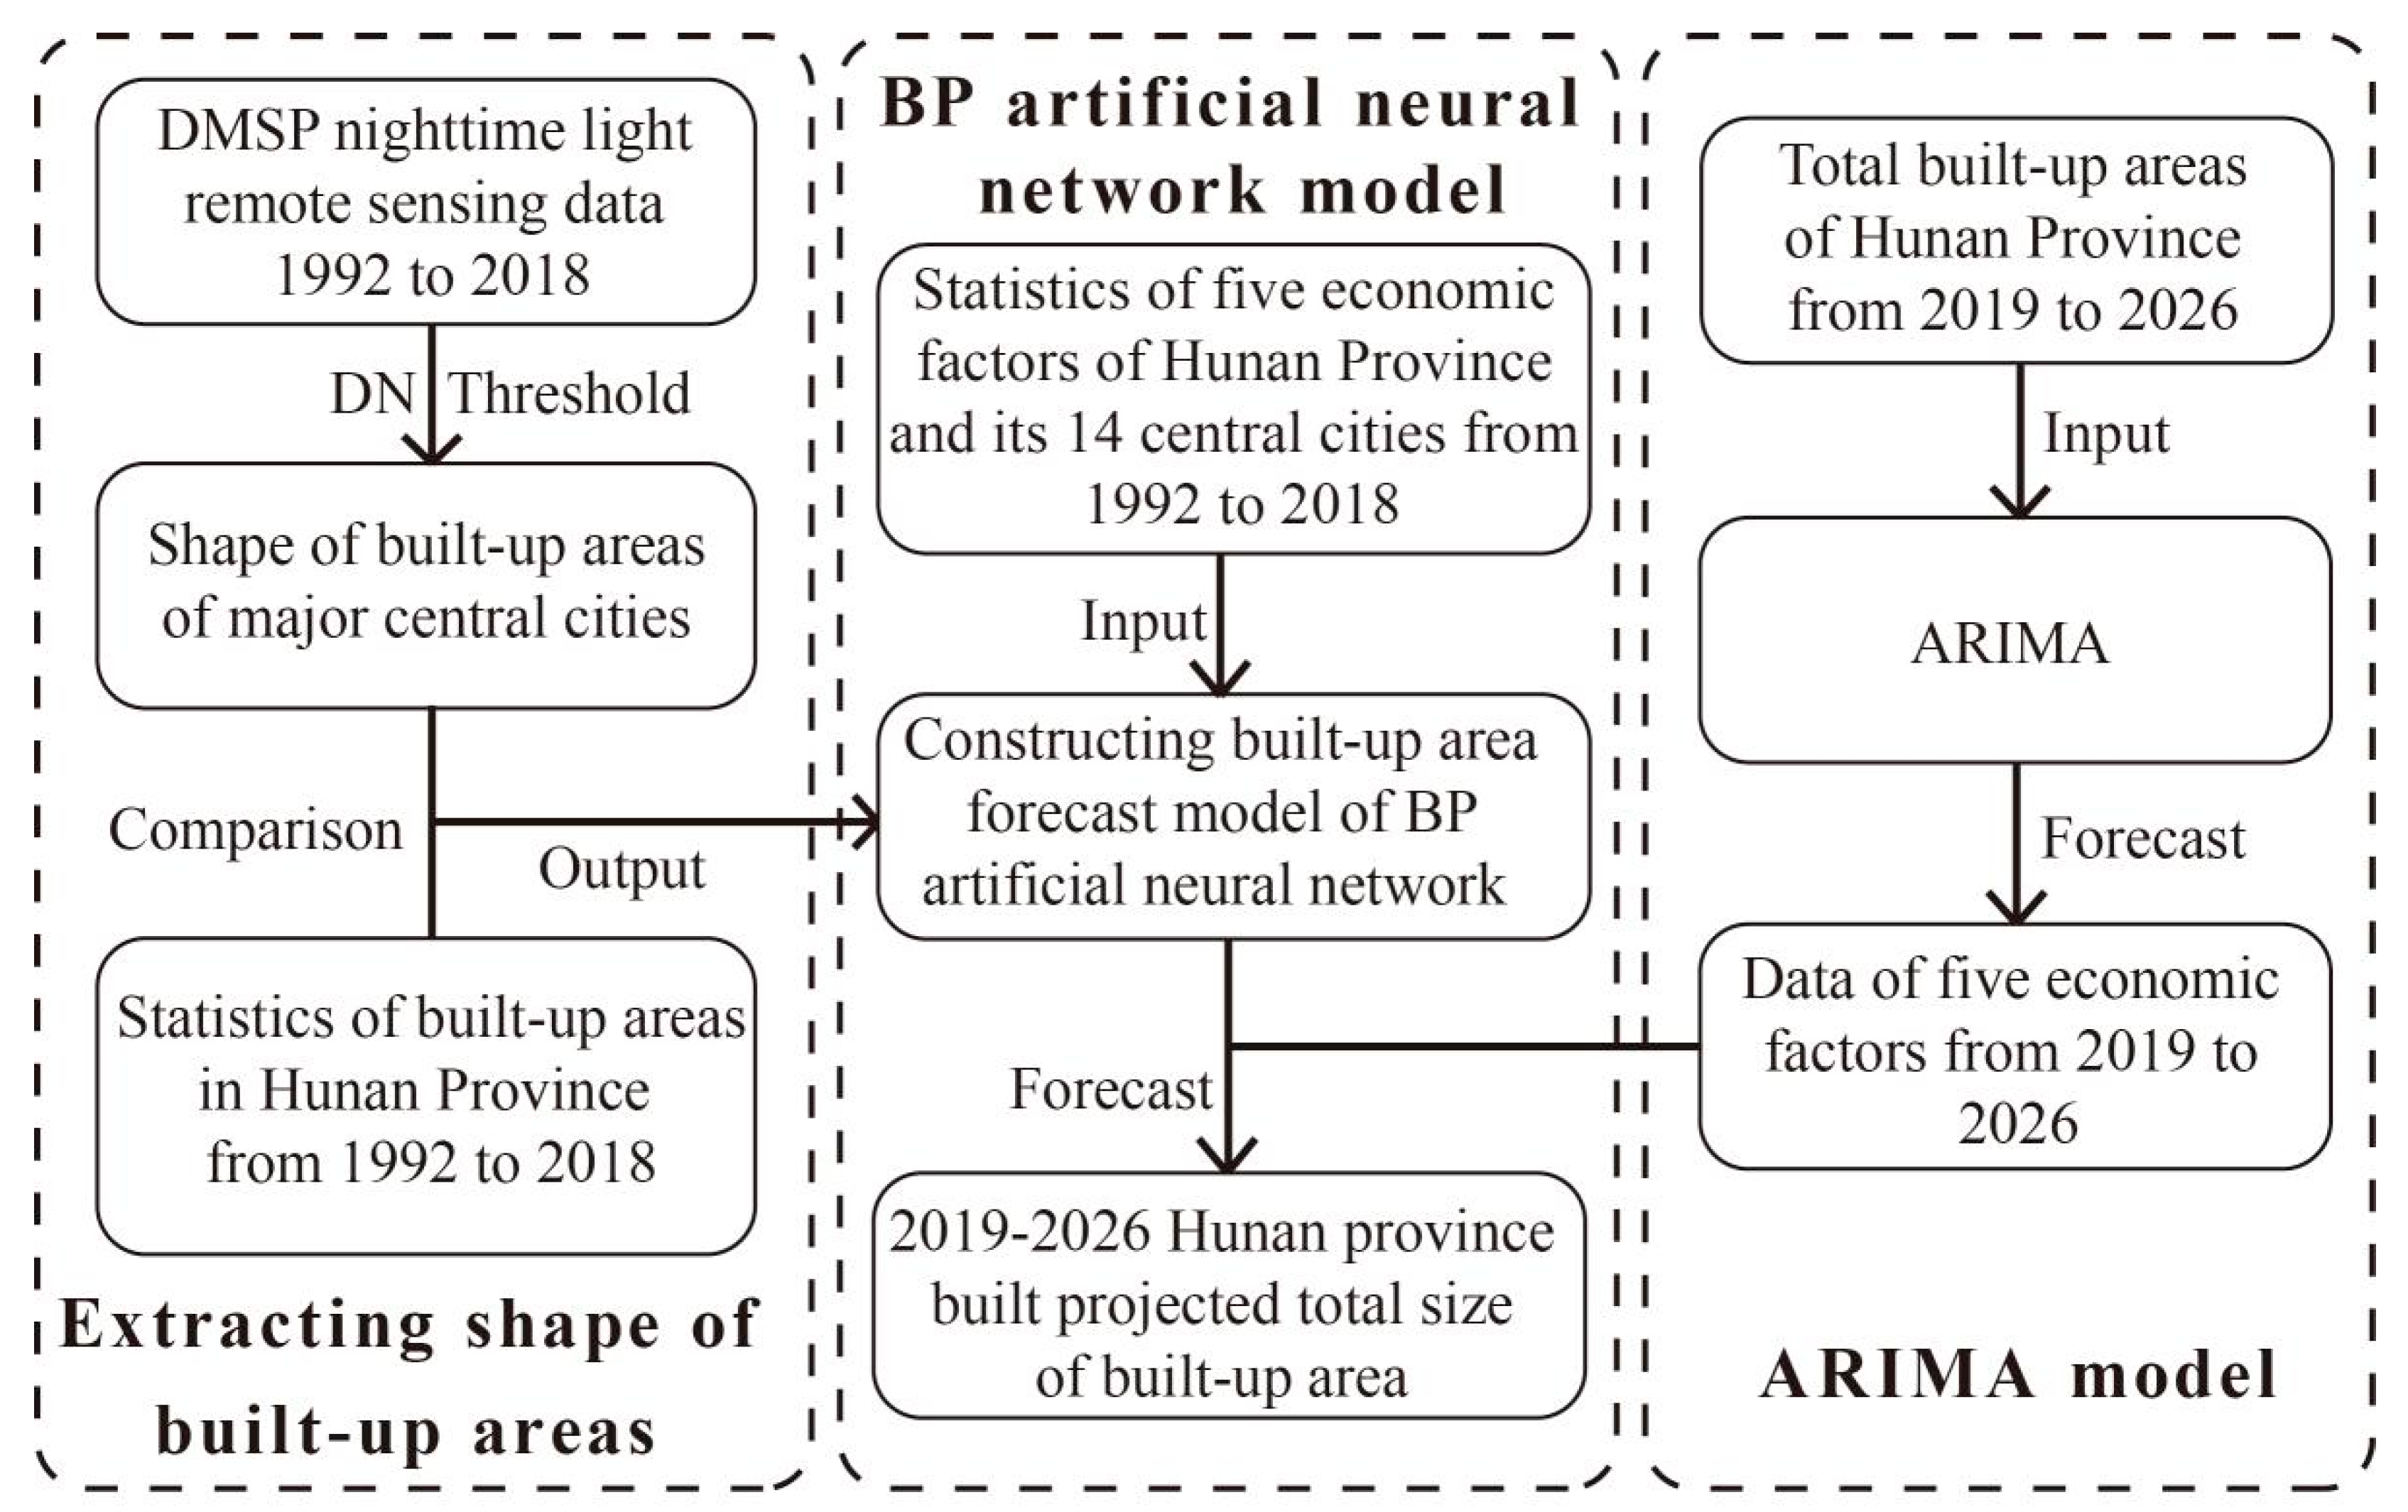
Figure 2.
Schematic of research technology route.
3. Results
3.1. Urban Built-Up Area Extraction and Spatial Expansion Characteristics
The built-up areas of the 14 central cities in the Hunan province from to 1992 to 2018 were extracted using the determination threshold method, in which the error rate of the total area was less than 5% in 25 years and less than 2.5% in 17 years, and the overall accuracy was high.
3.1.1. Scale and Expansion Rate of Built-Up Areas
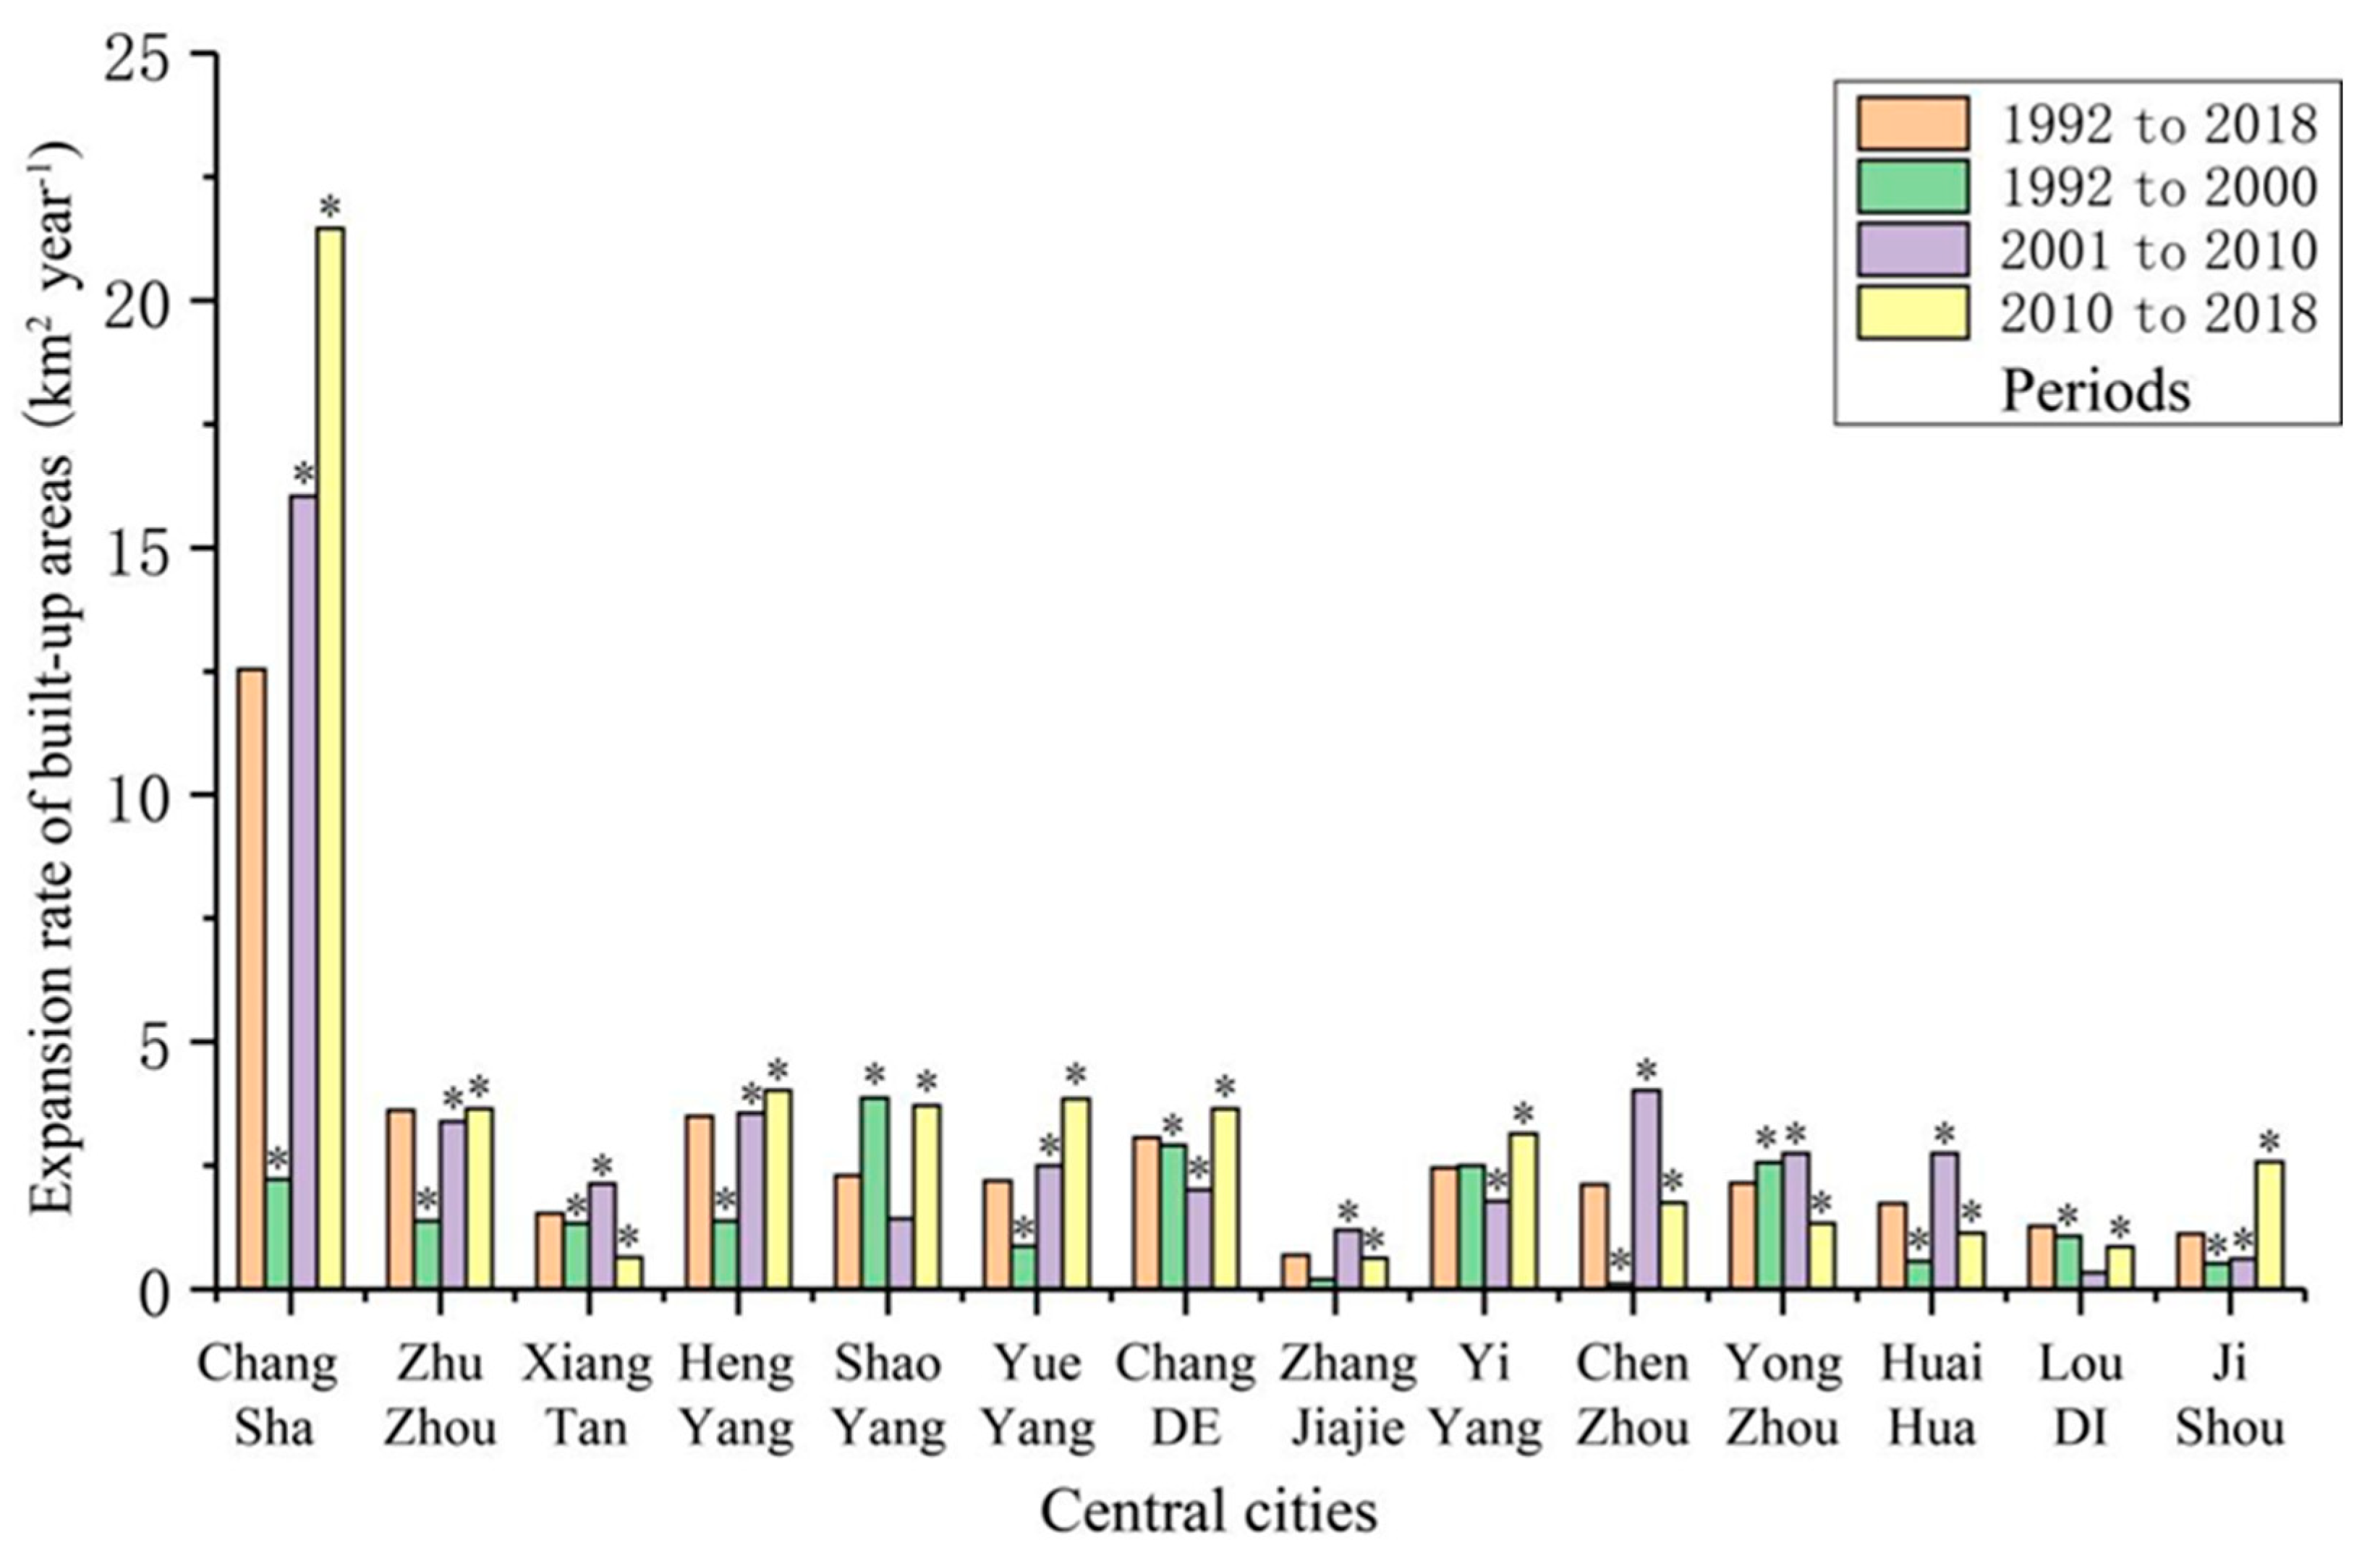
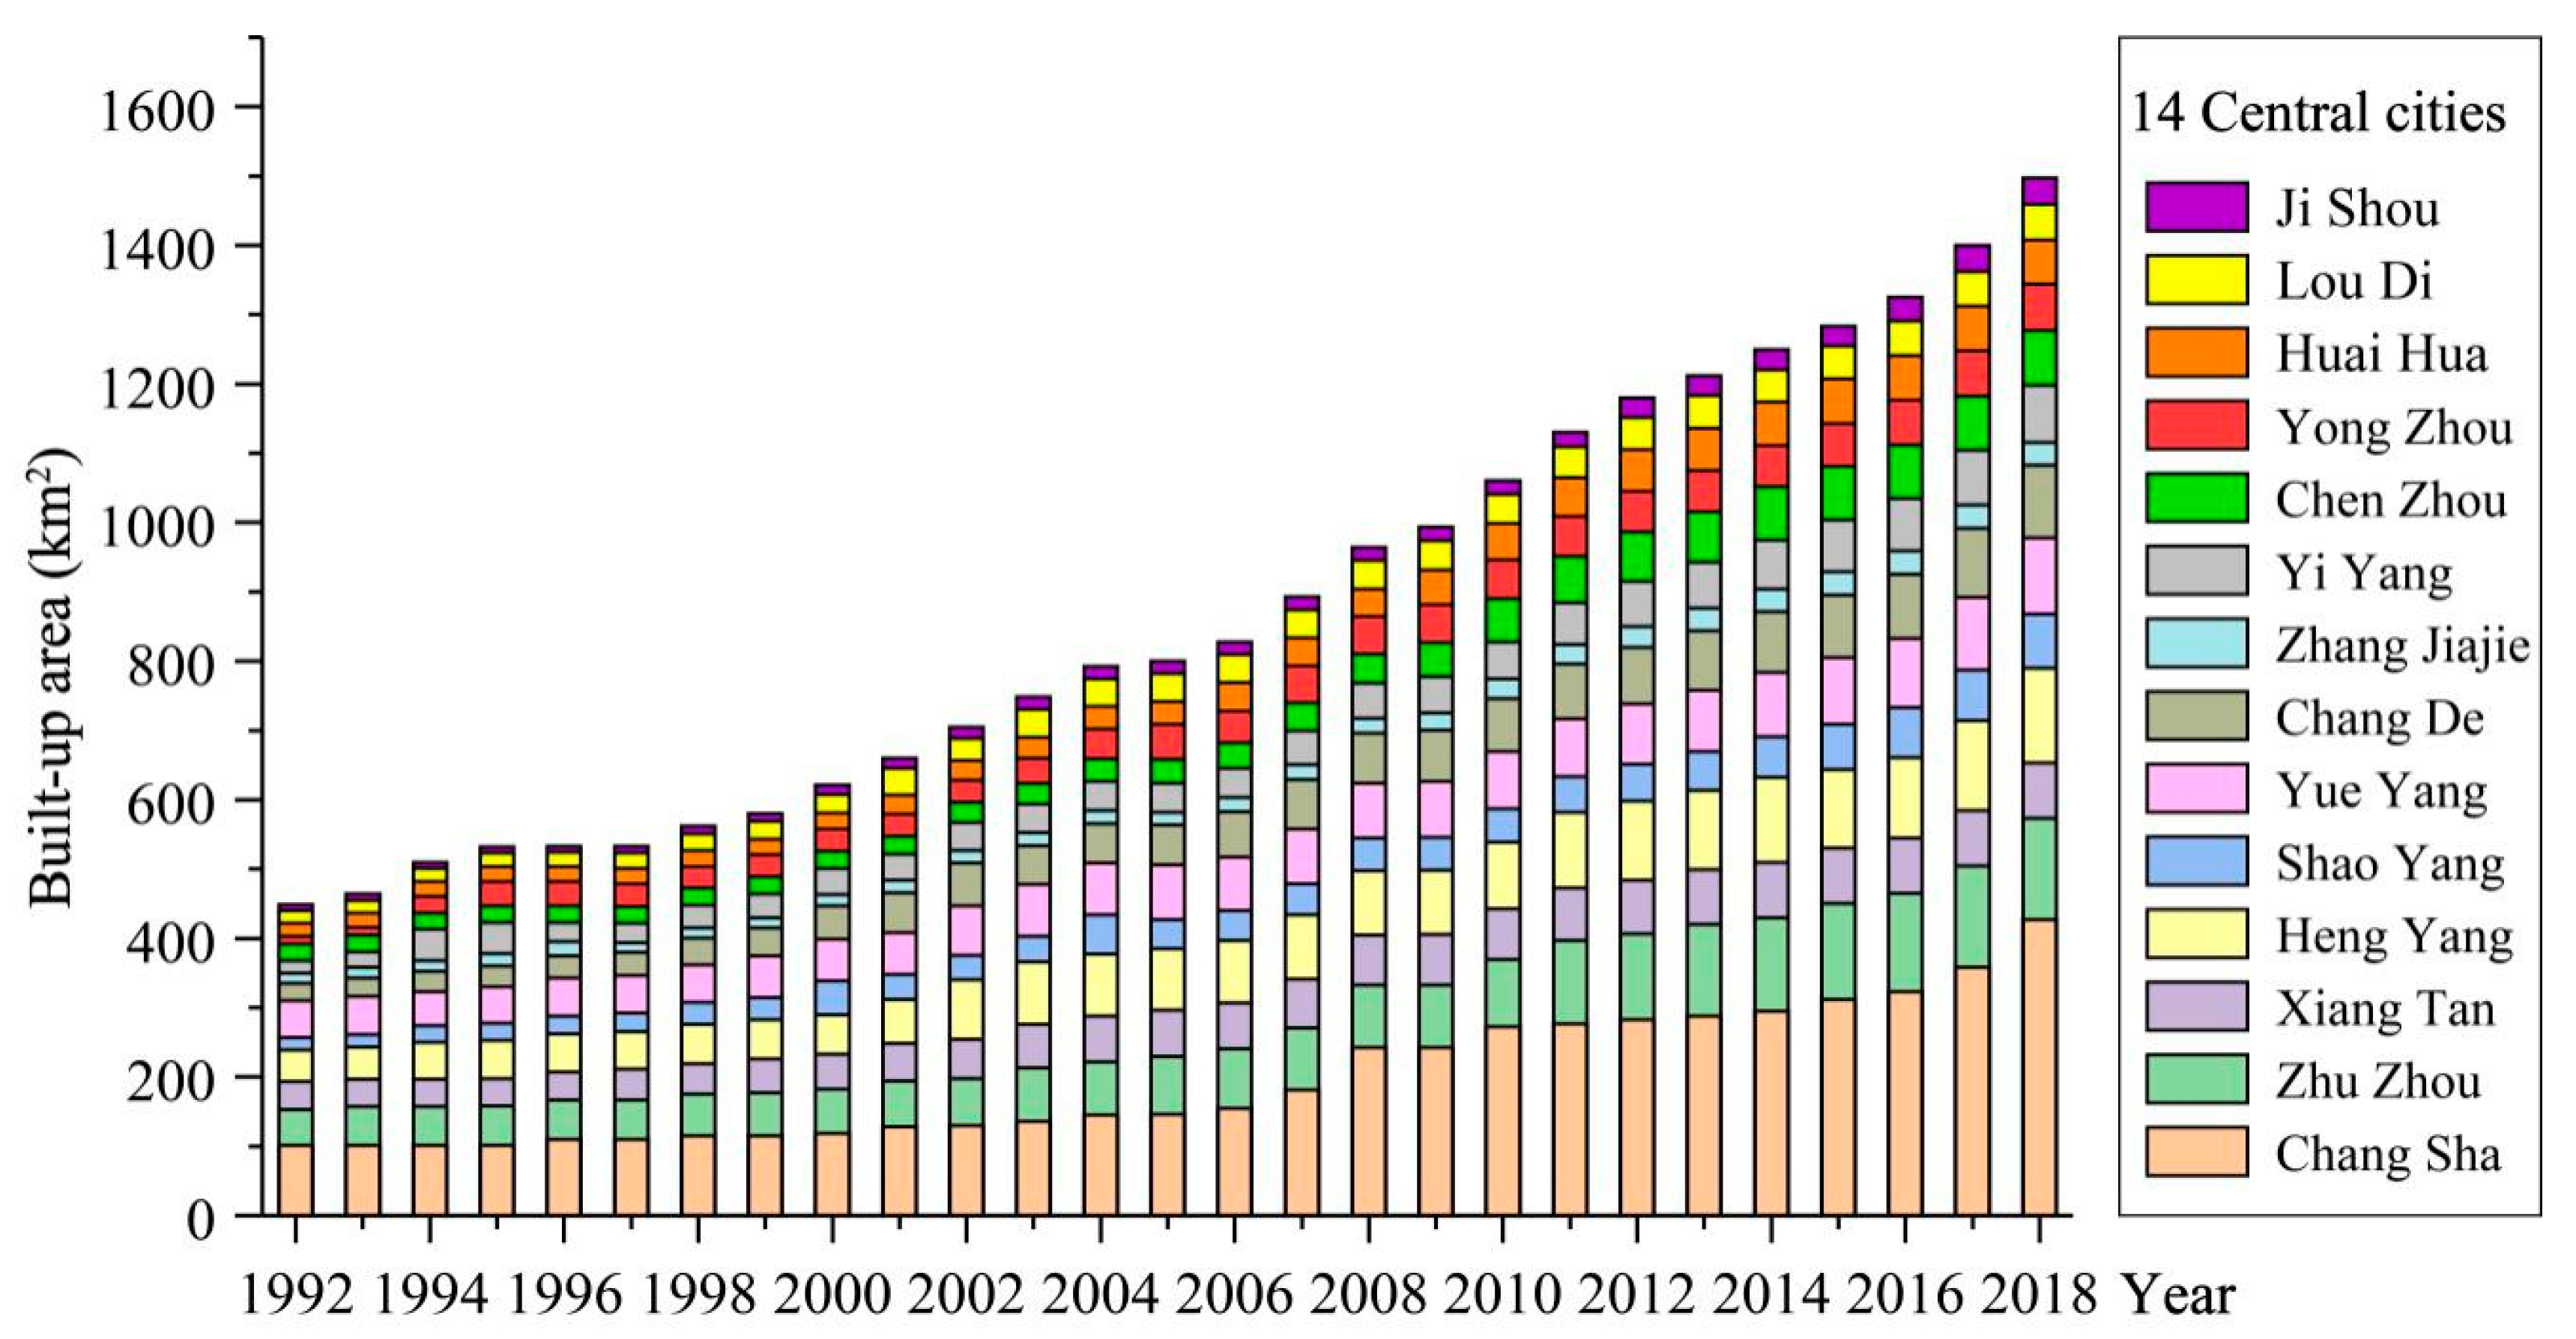
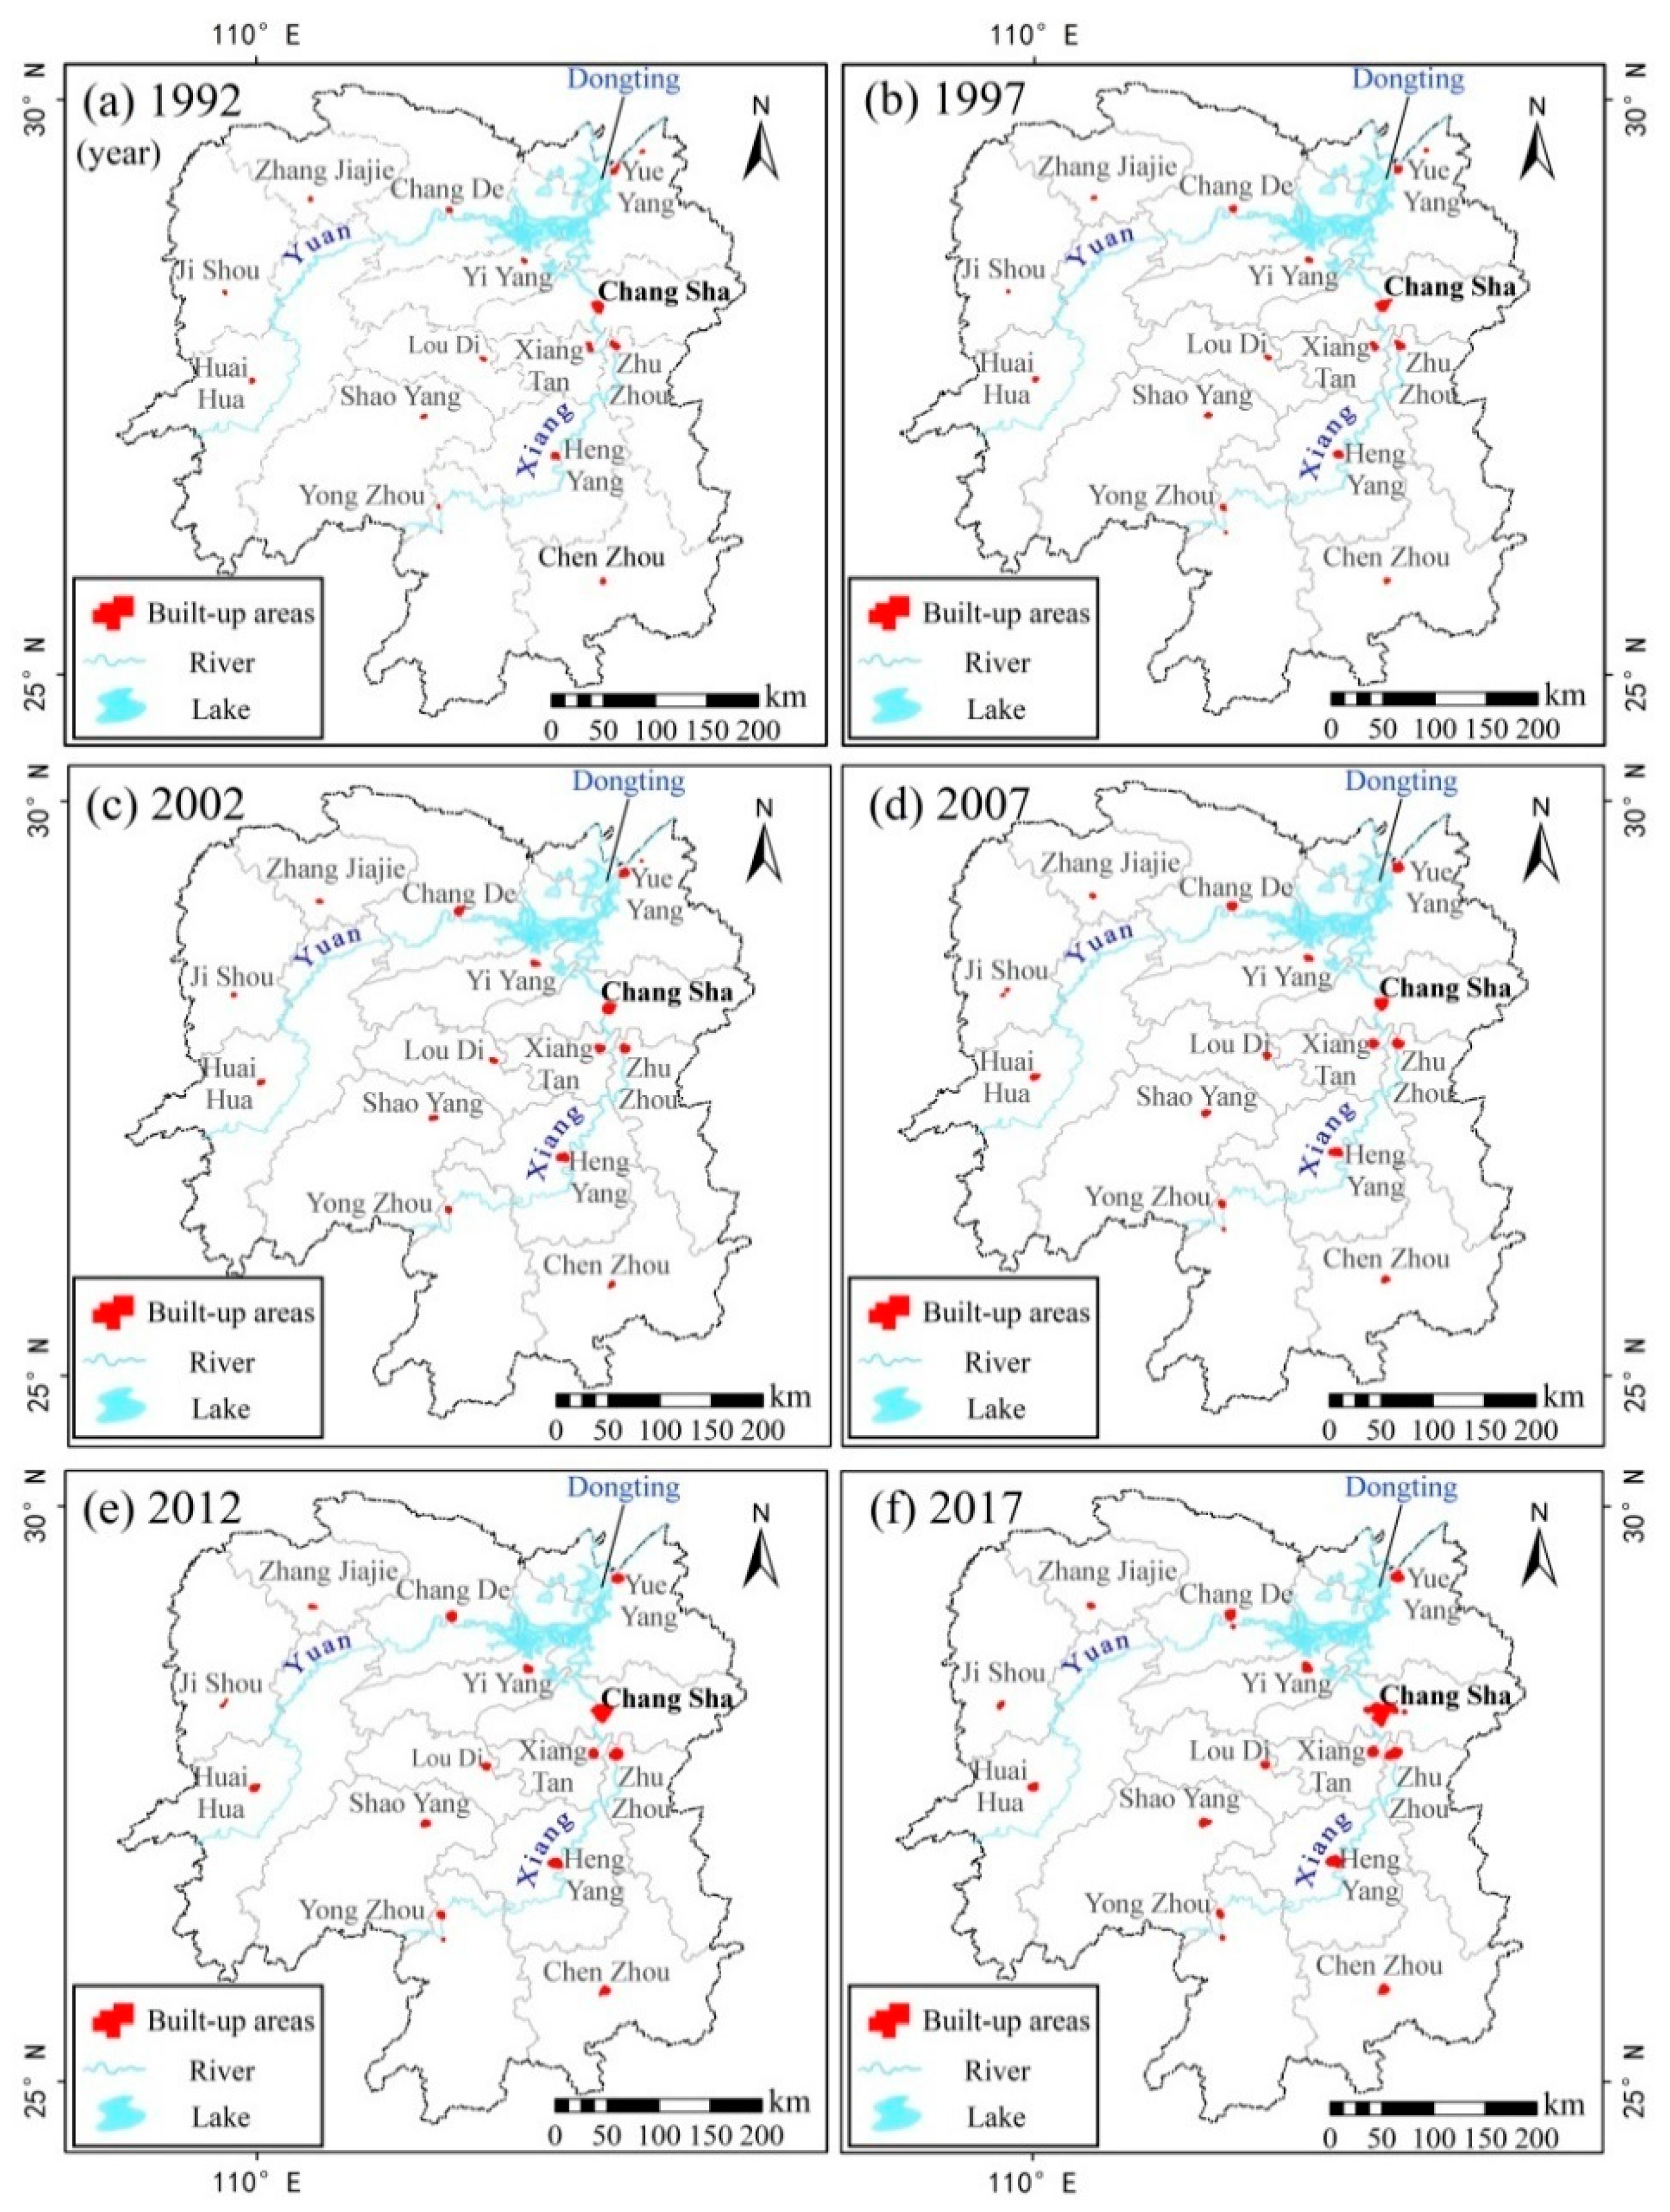
During the period of 1992 to 2018, the scale of the built-up areas of the 14 central cities in the Hunan province exhibited an overall growth trend (Figure 3), with a total built-up area of only 431 km2 in 1992, which reached 1446 km2 in 2018 (Figure 4). The cities in the Hunan province exhibited a distribution pattern of “high in the east and low in the west” on the spatial scale, with the high-scale central cities mainly distributed in the east along the main stream of Xiang River and Dongting Lake (Figure 5), whereas the scale of the central cities in the western part of the Hunan province was generally low. On the temporal scale, the gap between the east and west of the major central cities and between Chang Sha and other cities gradually increased from 1992 to 2018. The size gap between Chang Sha and other cities gradually expanded.
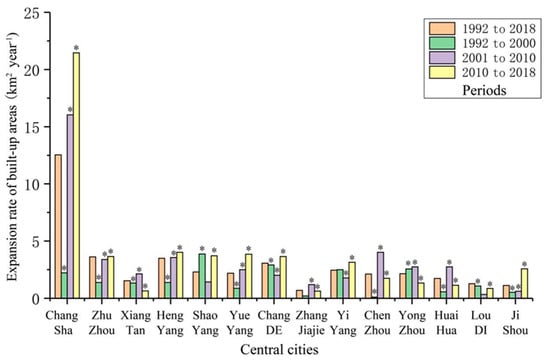
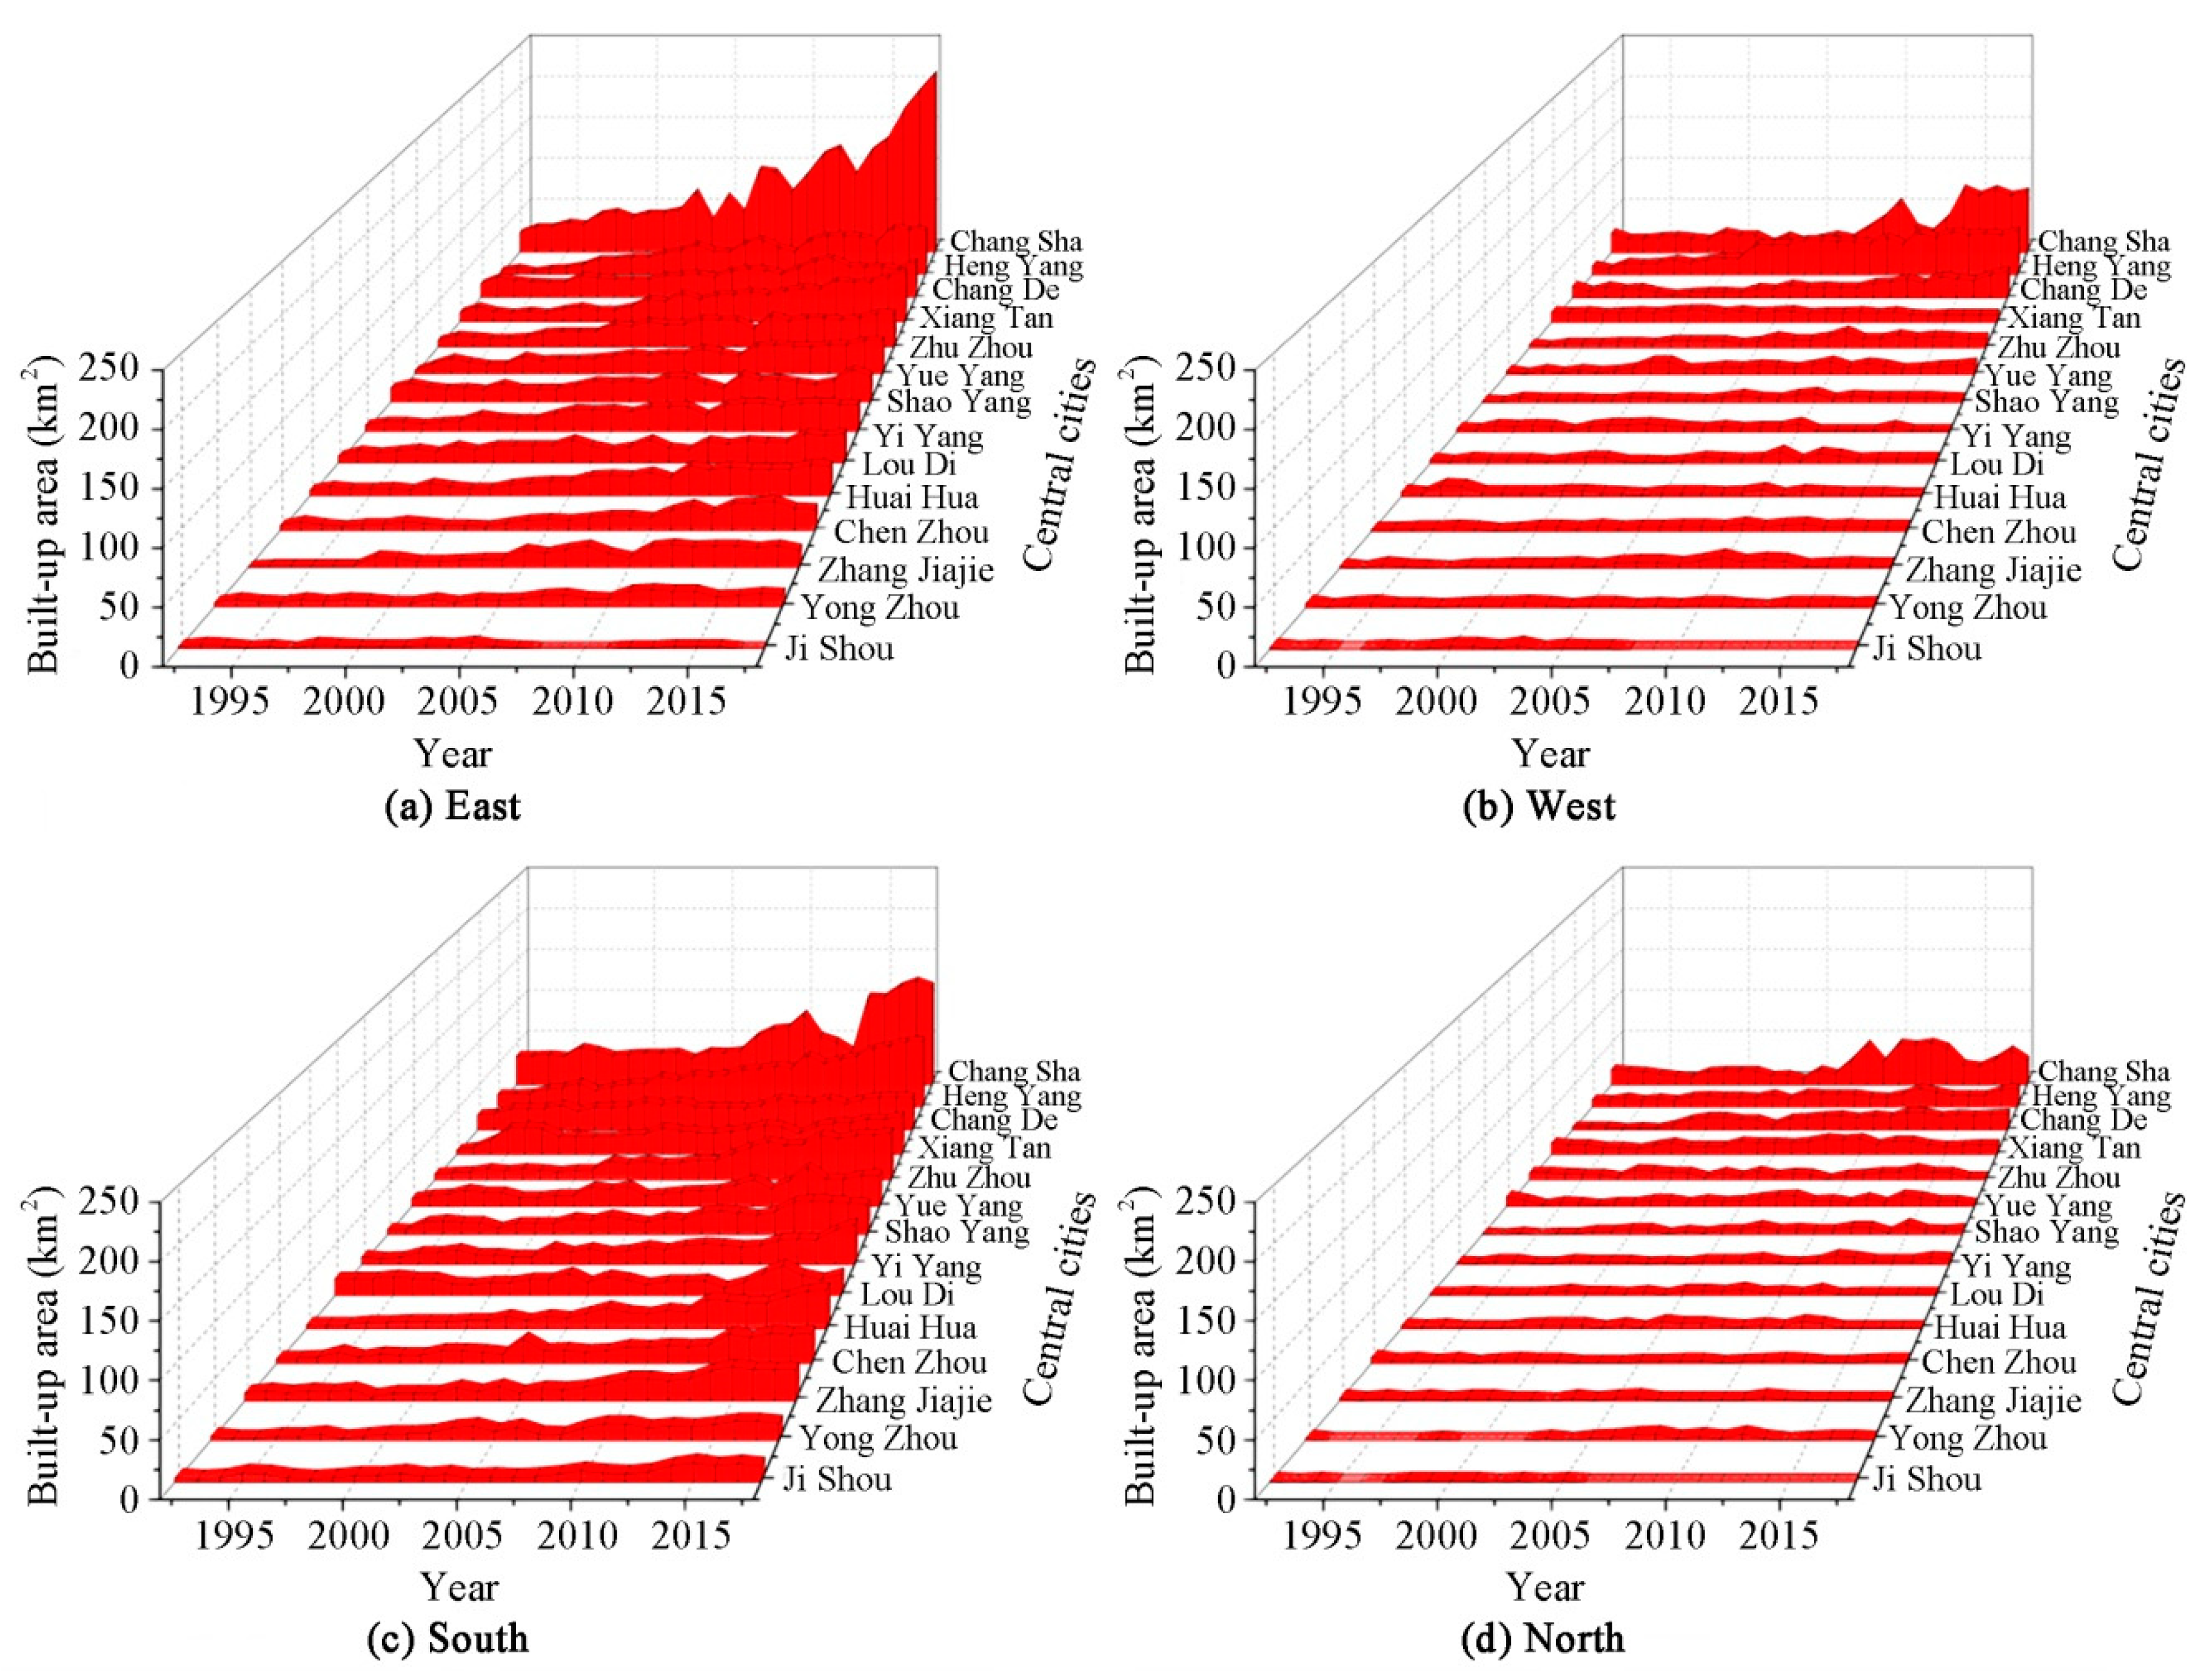
Figure 3.
Average expansion rate of built-up areas of each central city in Hunan. Note: * p < 0.05.
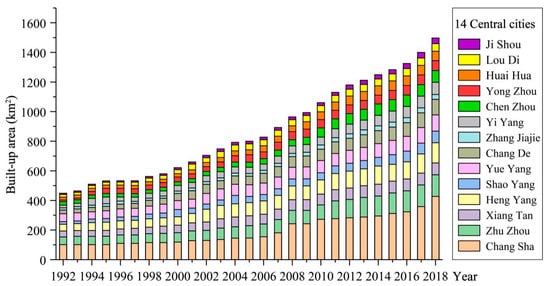
Figure 4.
Urban built-up areas in central cities of 14 prefecture-level cities in Hunan Province.
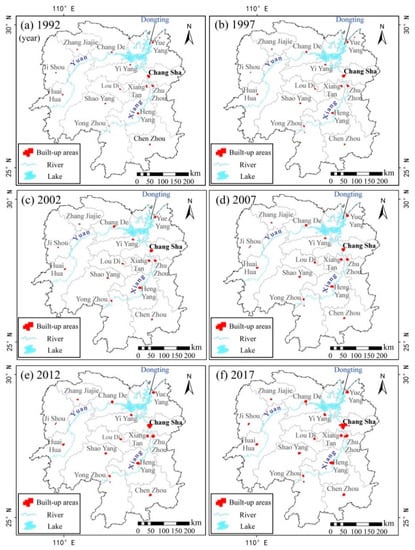
Figure 5.
Changes in built-up area patterns in Hunan Province every five years from 1992 to 2017. (a–f) are built-up area patterns of Hunan Province in 1992, 1997, 2002, 2007, 2012 and 2017, respectively.
For example, although Xiang Tan City is located along the main stream of Xiang River, its built-up area was only 80 km2 in 2018, with an average growth rate of only 1.54 km2/year for 27 years, which was lower than that of the cities located in the western part of Xiang Xi, including Shao Yang City, Huai Hua City, and Xiang Xi Autonomous Prefecture (Figure 3). Moreover, there were differences in the expansion rates between different regions: the difference in the expansion rates of the built-up areas of central cities in the southern Xiang Tan region (including Heng Yang City, Yong Zhou City, and Chen Zhou City) and the Dongting Lake region (including Yue Yang City, Yi Yang City, and Chang De City) was small, whereas the difference between the Chang-Zhu-Tan region and the western Xiang Tan region was obvious. Furthermore, the expansion rate of Chang Sha City in the Chang-Zhu-Tan region was much higher than that of Xiang Tan City in the same region and the expansion rate of Shao Yang City in the western Xiang Tan region was also significantly higher than that of other cities. In terms of the time scale, the built-up area of each central city continued to expand over 27 years, but the expansion rate varied at different times (Figure 3), indicating a cyclical change of “fast-slow-fast” (Figure 4).
3.1.2. Expansion Direction
The distribution of the four-directional arc statistical areas and the numerical change rate of the nighttime lighting DN values in the built-up areas of the 14 central cities in the Hunan province from 1992 to 2018 were compared. The results demonstrated that the expansion of the central cities in the Hunan province was mainly concentrated in the east and south directions (Figure 6). The cities that mainly expanded to the east were Chang Sha City, Xiang Tan City, Yue Yang City, and Loudi City; the cities that mainly expanded to the south were Zhu Zhou City Chen Zhou, Yongzhou, Zhang Jiajie, and Ji Shou. Moreover, Shao Yang, Yiyang, Huai Hua, and Chang De mainly expanded to the east and south. Apart from Heng Yang City, which mainly expanded to the west during the 27-year period (Figure 6), all central cities expanded mainly to the east or south, whereas all central cities expanded relatively little to the north during the 27-year period.
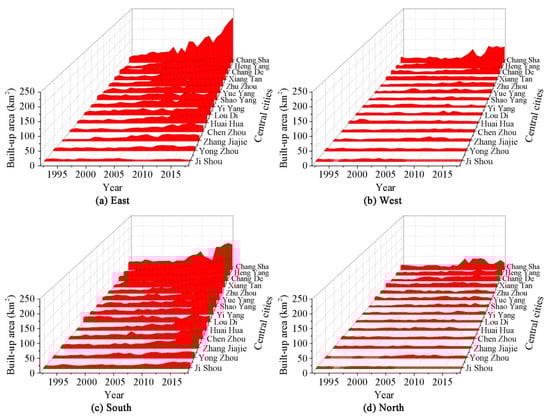
Figure 6.
Changes in built-up areas of 14 central cities in various directions from 1992 to 2018. (a–d) are the built-up area of the central cities in Hunan Province extending to the east, west, south and north, respectively.
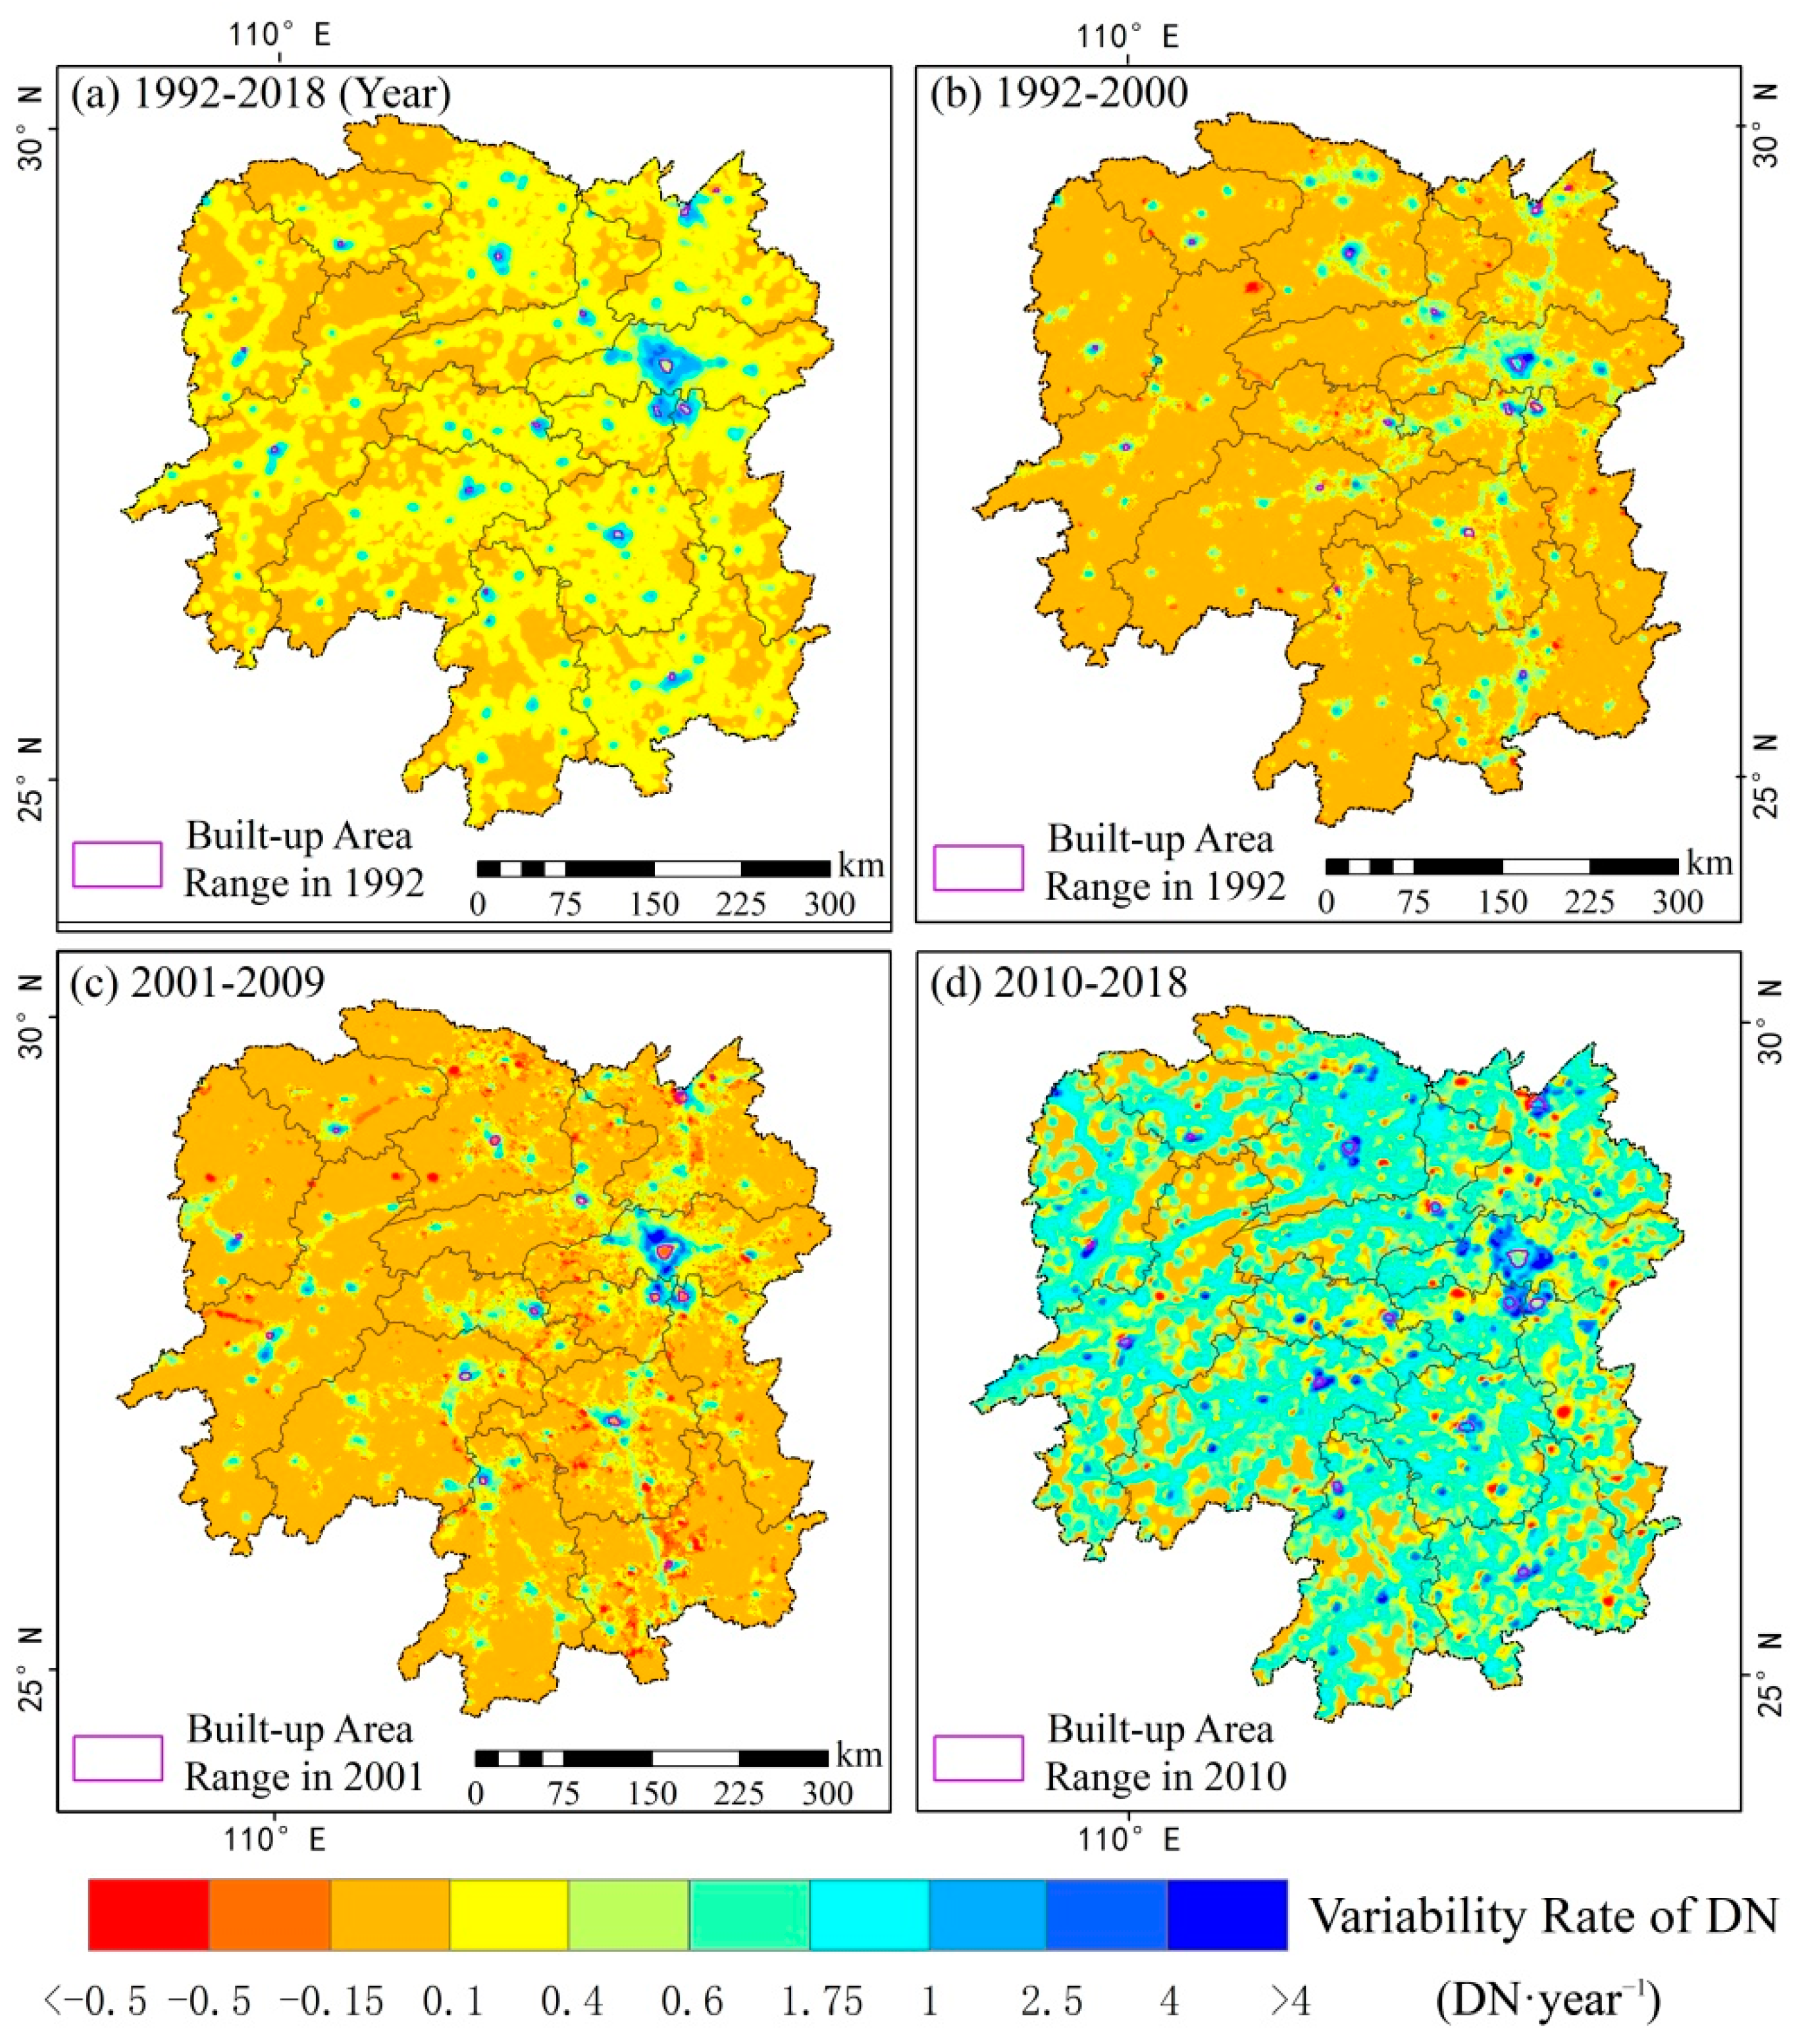
A correspondence was observed between the expansion of built-up areas and the light variation rate. The regions around the built-up areas with high light variability (variability > 1.75 DN·year−1, Figure 7) (hereafter referred to as potential areas) were more easily transformed into built-up areas. Spatially, the distribution direction of the potential areas in the 14 central cities in the Hunan province was generally the same as the expansion direction of the built-up areas (Figure 7). Two types of potential areas were identified: strips (Huai Hua, Ji Shou, Zhang Jiajie, Chen Zhou, Shao Yang, and Chang De) and clusters (Chang Sha, Zhu Zhou, Xiang Tan, Yi Yang, Lou Di, Yue Yang, and Heng Yang). The strip potential areas were mainly distributed in the western and southern regions of the Hunan province, whereas the cluster potential areas were mainly distributed in the eastern regions, which were consistent with the topography and traffic direction.
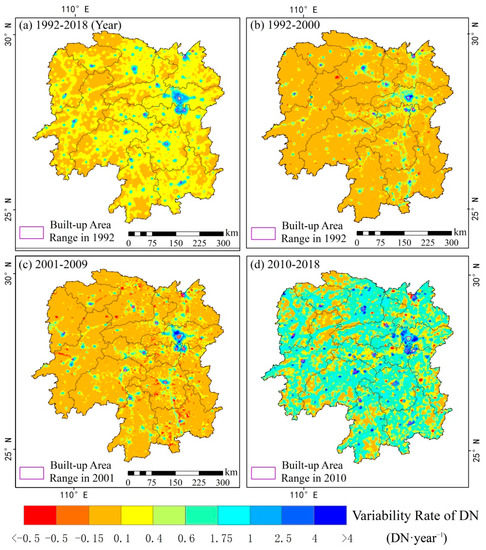
Figure 7.
Light variability of Hunan Province at different times. (a) 1992–2018; (b) 1992–2000; (c) 2001–2009 and (d) 2010–2018.
3.2. Relationships between Built-Up Areas and Driver Factors
Among the five selected factors, the GDP, year-end urban population, and road area were strongly and positively correlated with the built-up areas. The correlation coefficient of the GDP was 0.97, whereas the correlation coefficients of the secondary and tertiary industries were generally lower than those of the above three factors, and were general drivers. Moreover, the correlation coefficients of these two factors fluctuated significantly among the central cities (Table 1). In Chang De and Ji Shou, the correlation coefficients of the built-up area and the proportion of tertiary industries reached 0.93 and 0.96, respectively, and they were the main driving factors for the expansion of the two cities, whereas the correlation coefficient of the proportion of tertiary industries in Chang Sha was only 0.26. In Chen Zhou, the correlation coefficient of the proportion of secondary industries reached 0.84; however, in Zhang Jiajie and Ji Shou, the two correlation coefficients were –0.50 and −0.07, respectively.

Table 1.
Correlation coefficients of factors and built-up areas.
3.3. Precision Inspection of BP Network Model
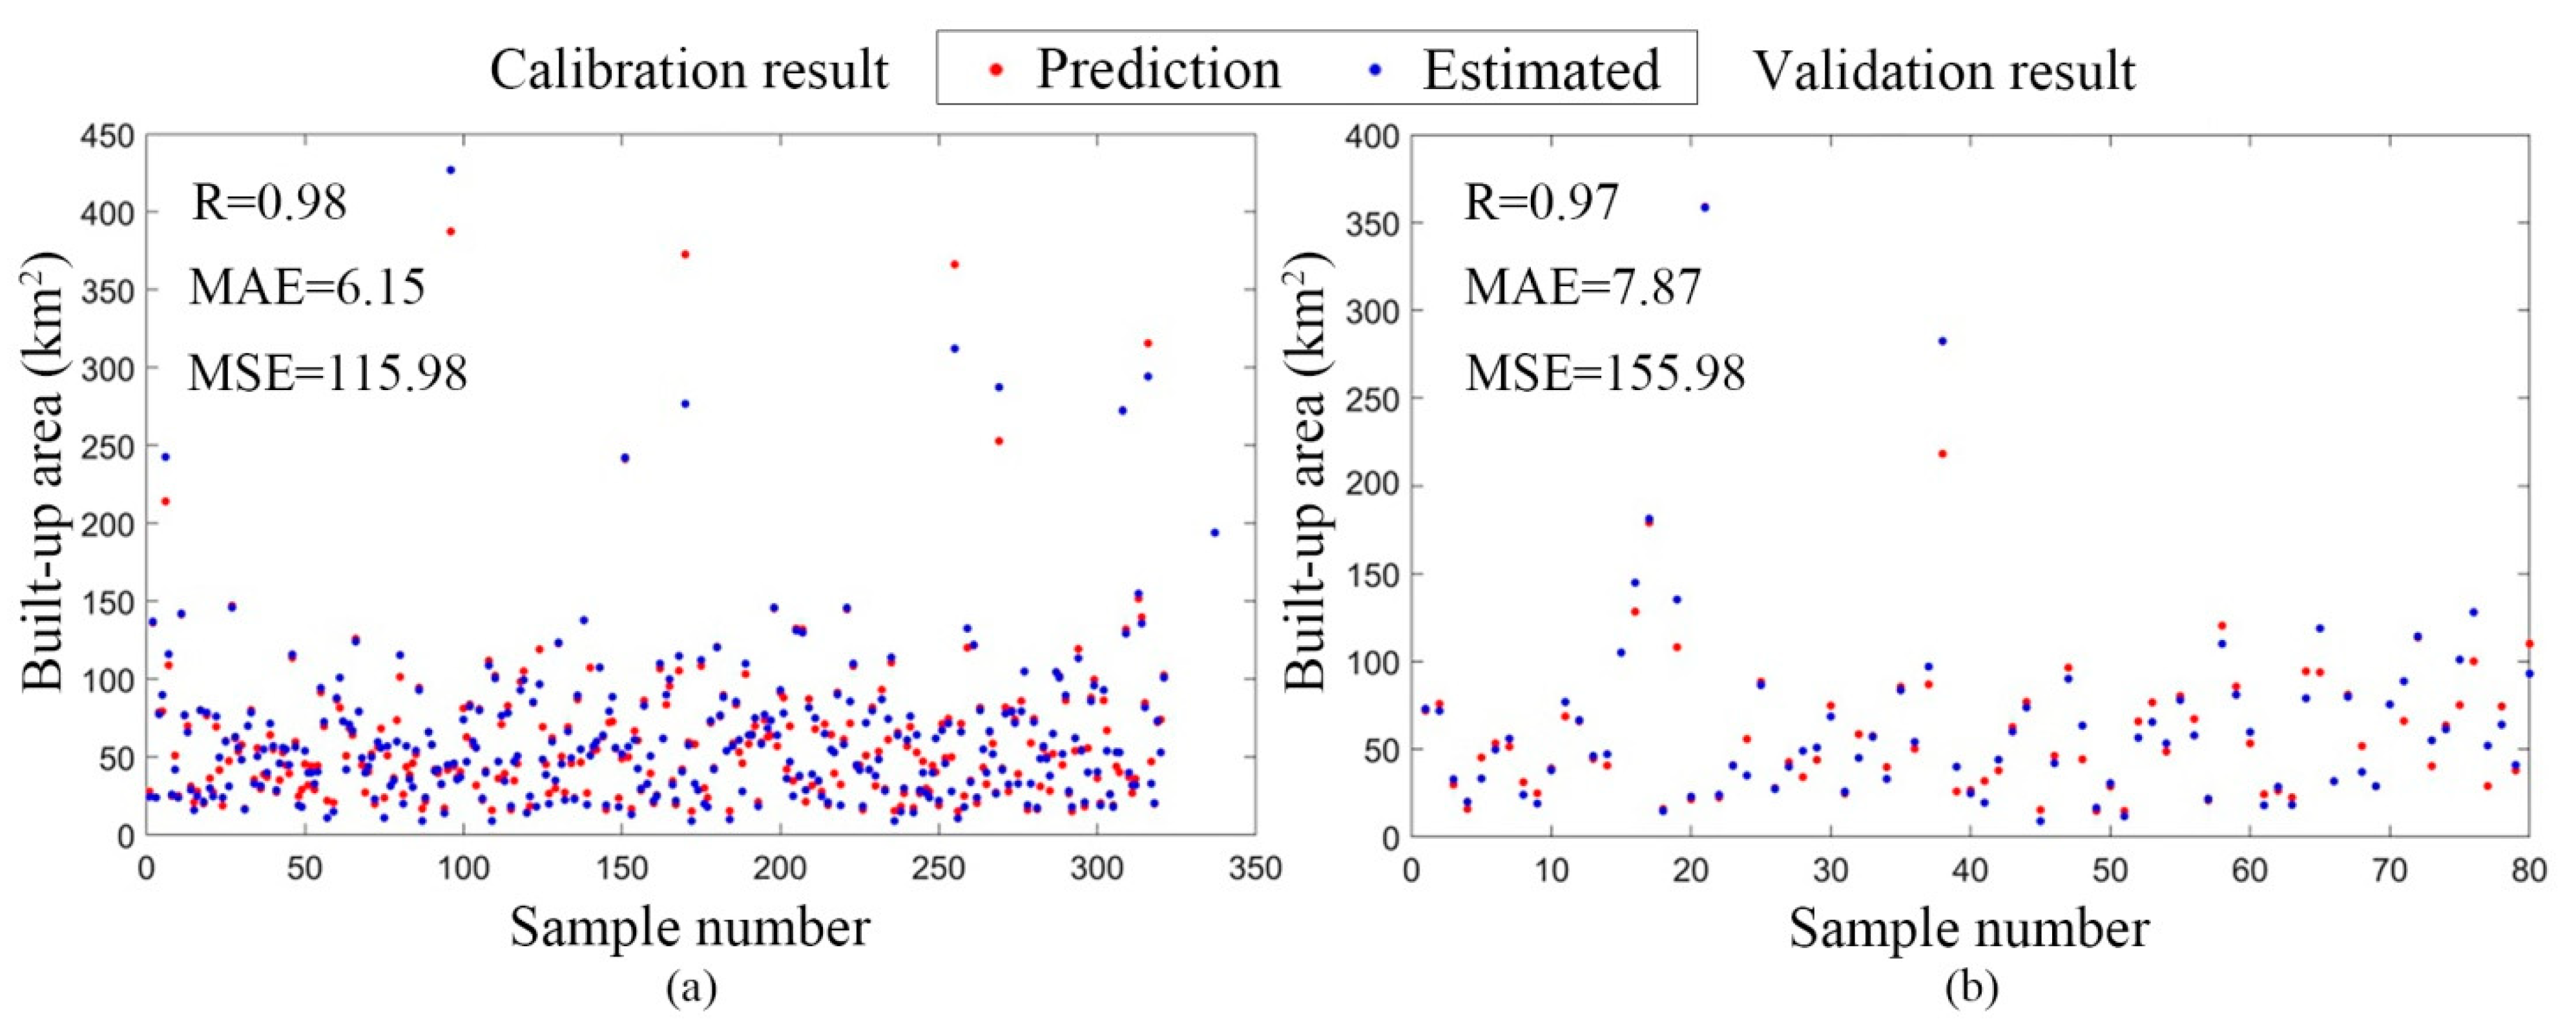
The BP neural network model based on the five selected factors provided high modeling and prediction accuracy (Figure 8). The MSE of the BP artificial neural network results of both calibration set and validation set were low: less than 0.0001 (after normalization). The MSE (without normalization) between the predicted and actual data of the calibration set was 115.98, with MAE (without normalization) of 6.15. The MSE (without normalization) between actual data and output data in validation set was 155.98, with MAE (without normalization) of 7.87. The R of two sets were both close to 1(Figure 8) The F-test was performed on the two sets of predicted and actual data, and a test coefficient of p < 0.01 was obtained.
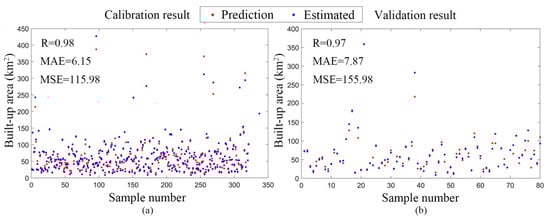
Figure 8.
BP model accuracy diagram. (a) is the predicted and estimated value of the calibration set of the model with performance parameters; (b) is the predicted and estimated value of the validation set of the model with performance parameters.
3.4. Forecast of Built-Up Areas in 2019 to 2026
The distribution of the autocorrelation function and partial autocorrelation function after the ARIMA model incorporated the factor data for different operations, and the residuals between the model output and actual values were analyzed. The ARIMA factor prediction model parameters of the GDP were confirmed to be (2,2,3), the proportion of secondary production was (15,1,1), the proportion of tertiary production was (0,1,11), the year-end urban population was (4,1,2), and the urban road area was (1,2,11). The factor validation parameters and prediction results are listed in Table 2.
Table 2.
ARIMA model factor prediction results and parameters.
Considering the model accuracy and the effect of the COVID-19 epidemic, the GDP, proportion of secondary industries, proportion of tertiary industries, and GDP growth rate of the Chinese macroeconomic forecast for 2020 to 2021 following the outbreak of the COVID-19 epidemic according to the “China Quarterly Macroeconomic Model (CQMM)” group [45] were incorporated for 2019. The GDP forecasts for the corresponding years in the Hunan province were calculated and replaced with the corresponding ARIMA model forecasts to form a factor forecast dataset, which was subsequently input into the BP network model to obtain the total built-up area forecasts for 2019 to 2026 in the Hunan province (Figure 9). On the premise that the change rate of each factor continued to remain stable in the time series, the total built-up area of the Hunan province would still maintain the trend of increasing year by year from 2019 to 2026, in the following order: 1867.62 km2, 1990.92 km2, 2123.65 km2, 2129.63 km2, 2183.77 km2, 2285.31 km2, 2364.33 km2, and 2463.80 km2.
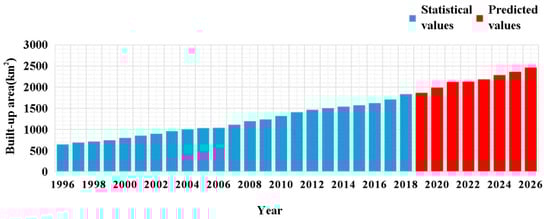
Figure 9.
Forecast of built-up areas in Hunan Province.
4. Discussion
4.1. The Spatial Expansion Characteristics of Urbanization
Our results showed that the spatial scale of cities in the Hunan province presented a trend of "high in the east and low in the west", and the spatial expansion of central cities in the east was faster than that in the west. In terms of time scale, the overall growth rate of central cities in the Hunan province showed a "fast-slow-fast" cyclical change in 27 years. This result accords with the natural geographical conditions and the law of social and economic development of the Hunan province. The terrain of the Hunan province is high in the west and low in the east. The adjustment of regional development policy before and after the new century also affected the urbanization process of the Hunan province indirectly. In particular, at the beginning of the new century, the State has assessed the situation and made overall plans at home and abroad, and put forward national strategies such as the rise of the central Region and the development of the western region. Taking urban agglomeration as the main form to promote urbanization, such as the coordinated development of the Beijing-Tianjin-Hebei region [46], the protection of the Yangtze Economic Belt, the promotion of Guang-dong-Hong Kong-Macao Greater Bay Area, and the rapid development of the Cheng-du-Chongqing urban agglomeration in the west [47], has become a national regional strategy [48], which has completely changed the spatial development pattern of China. Under the influence of the national strategy and policy adjustment, the urbanization process of the Hunan province has once again entered a period of rapid development.
Secondly, the direction of urban spatial expansion in the Hunan province was mainly east and south. The year 1997 was an important juncture. Prior to this, the main expansion direction of the main central cities in the Hunan province was south, and it subsequently changed to east. The direction of urban spatial expansion is the direction of population flow, as well as the result of economic structure adjustment and spatial layout change, and it is the main basis for the regulation of urban spatial structure in the future. Combined with the development of China in the past 30 years, the main reason for the above characteristics in the direction of urban spatial expansion in the Hunan province is also the transformation of the national macro-regional strategy [47,49]. Prior to 1997, the Hunan province developed its regional economy by relying on the Beijing–Guangzhou Railway, giving priority to docking with the Pearl River Delta region, and its main expansion direction was south; after 1997, owing to the rapid development of the Yangtze River Delta and the strengthening of economic ties in the Yangtze River Basin, particularly with the construction of the Yangtze River Economic Belt, the main expansion direction of the central urban built-up areas in the Hunan province changed to east [50]. Moreover, as the core growth pole of the province [51], and the capital of the Hunan province, the Changsha-Zhuzhou-Xiangtan Urban Agglomeration and Changsha City which were located in the eastern Hunan had a trickle-down effect on other cities in the province that could not be ignored.
4.2. The Influence Factors of Urban Expansion
The expansion of urban space is the result of the combined action of multiple factors [1,52,53]. With the development of science and technology, natural factors such as traditional topography and water systems have become less restrictive to urbanization, economic development and social needs have become important factors driving urbanization, and technology has made it possible to expand urban space into areas that are not naturally suitable. Urban spatial expansion is the agglomeration or spread of urban space in a larger scope under the traction of economic development, population growth, policy planning, and transportation factors, and constantly breaking through the limitations of natural factors [33,34]. With the rapid development of China’s economy and society, many cities have experienced extraordinary urban area growth rates. Some cities have even increased dozens or even hundreds of times [54].
It can be concluded from the above research results that among the five selected economic and social factors, urbanization of the population and the construction of road transport were the main driving factors for the expansion of the Hunan central cities. Urban growth in central and western China have been driven by a massive shift in population from rural to urban areas and increased infrastructure investment in recent years [55]. Secondly, the GDP growth was an important driving factor; the proportions of secondary and tertiary industries were general driving factors and the influence varied among cities. For example, the results showed that the urban area of Jishou and Changde was significantly positively correlated with the proportion of tertiary industry, while the tourism cities such as Jishou and Zhangjiajie were negatively correlated with the proportion of secondary industry. This is related to the difference of industrial structure and industrial policy between different cities. Compared with China’s coastal cities, which have entered the mature stage of urbanization development, the economic growth of the vast central and western regions is still the main driving factor of cities, and most cities have not completed the upgrading of industrial structure [56]. A considerable proportion of urban secondary industry still accounts for a high proportion of GDP, which is the pillar industry of cities. The construction of industrial parks has become the main form of space expansion in many inland cities. However, following economic transformation and upgrading, the tertiary industry replaces the secondary industry as the main factor influencing urban space expansion, and the green economy such as tourism and recreation in the tertiary industry may provide an opportunity to promote urban development in the western part of the Hunan province [50,56]. Zhangjiajie city with good tourism resources and Jishou city which advocates the development of ecological tourism under the rural revitalization strategy are good examples of this development trend.
Of course, urban spatial driving force is composed of many factors, such as population factor, economic factor, industrial factor, internal traffic factor, natural geography factor, urban development history, and other internal driving force. There are also external driving forces such as the city’s external traffic and government policies. Different urban development is affected by different factors, and different factors have different effects on urban development. Therefore, only by deeply exploring the speed, mode and driving force factors of urban space expansion can we understand the relevant laws and internal power of urban development, which is conducive to rational and scientific use of urban land, effective urban overall planning, and meet the sustainable development of human beings and social and economic progress. As a typical province in central and western China, the driving factors of spatial expansion in the Hunan province are of remarkable epochal and policy characteristics, which is a meaningful exploration.
4.3. The Simulation and Prediction of Urban Expansion
Deep learning can be a good method to predict as well. However, it may need more hidden layers which make network complex [57]. In consequence, the relationship between dependent and independent variables turn out to be more complex [57]. Phenomena of overfitting happen frequently. The BP model is less prone to overfitting because its structure is relatively simpler than deep learning models. On the research method of spatial expansion, the combination of the BP and ARIMA models overcame the inherent drawback whereby the BP model cannot make predictions independently. Moreover, it was demonstrated through the empirical results of the Hunan province that the complementary application of the two models could effectively fit the process of urban spatial expansion in the Hunan province. This study serves as a useful attempt to complement the application of existing models, and it offers a reference significance for forecasting research of the models. Both the improvement of the model method and the simulation of the spatial expansion can be used for reference for other regions and cities in inland China. City expansion in China will continue contributing to urbanization of this country enormously. It still needs to be explored that many inland cities’ expanding rules which are different from the rules revealed by previous researches and the rules of coastal urbanization in east China.
5. Conclusions
Based on DMSP-OLS nighttime light remote sensing data, the BP artificial neural network and ARIMA model were used to analyze the characteristics of urban spatial expansion in the Hunan province. Our result indicated that the urban scale of the Hunan province exhibited a trend of “high in the east and low in the west.” The high-scale central cities were mostly distributed in the main stream of the Xiangjiang River and the coastal areas of Dongting Lake, and the central cities in western Hunan were sparsely distributed and limited by terrain and traffic. The expansion rate of the central cities in the eastern part of the Hunan province was faster than that in the western part, but there were significant differences in the growth rate among the different regions. The main expansion directions of the built-up areas the central cities were east and south. We found that the GDP growth was an important driving factor of urban expansion, while the proportions of secondary and tertiary industries were general driving factors and the influence varied among cities. According to the prediction model results, the total built-up areas of the central cities in the Hunan province will expand further during the 14th Five-Year Plan period, and will exceed 2400 km2 by 2026, indicating that the Hunan province has certain potential for urban development. Our study enriches the research theory of urban spatial expansion and helps guide the practice of regional urban planning.
Author Contributions
Y.L. and T.H.: Writing—original draft preparation, software, formal analysis. P.L.: Investigation, methodology, software, writing—review & editing. Y.W., C.P., H.D. and S.Y.: Writing—review & editing. All authors have read and agreed to the published version of the manuscript.
Funding
This study was financially supported by the National Natural Science Foundation of China (41901117), Hunan province college students research learning and innovative experiment project (S202010542071), the Outstanding Youth Project of Hunan Provincial Education Department (18B001), and the Natural Sciences and Engineering Research Council of Canada (NSERC) Discover Grant.
Institutional Review Board Statement
Not applicable.
Informed Consent Statement
Not applicable.
Data Availability Statement
The Nighttime light data can be downloaded from https://www.ngdc.noaa.gov/eog/dmsp/downloadV4composites.html (accessed on 8 August 2021). All the relevant data from this study are also available from the corresponding author upon request.
Conflicts of Interest
The authors declare no conflict of interest.
References
- Friedmann, J. Four theses in the study of China’s urbanization. China City Plan. Rev. 2006, 15, 80–85. [Google Scholar] [CrossRef]
- Chen, M.X. Research progress and scientific issues in the field of urbanization. Geogr. Res. 2015, 34, 614–630. [Google Scholar] [CrossRef]
- Shi, L.; Shao, G.; Cui, S.; Li, X.; Lin, T.; Yin, K.; Zhao, J. Urban three-dimensional expansion and its driving forces—A case study of Shanghai, China. Chin. Geogr. Sci. 2009, 19, 291–298. [Google Scholar] [CrossRef]
- Seto, K.C.; Fragkias, M. Quantifying Spatiotemporal Patterns of Urban Land-use Change in Four Cities of China with Time Series Landscape Metrics. Landsc. Ecol. 2005, 20, 871–888. [Google Scholar] [CrossRef]
- Wang, X.S.; Liu, J.Y.; Zhuang, D.F.; Wang, L.M. Spatial-temporal Changes of Urban Spatial Morphology in China. Acta Geogr. Sin. 2005, 60, 392–400. [Google Scholar] [CrossRef]
- Kuang, W.; Shao, Q.; Liu, J.; Sun, C. Spatio-temporal Patterns and Driving Forces of Urban Expansion in Beijing Central City Since 1932. J. Geo-Inf. Sci. 2009, 11, 428–435. [Google Scholar] [CrossRef]
- Xiao, L.; Tian, G.J. Study on Spatial Modes and Driving Mechanisms of Tianjin’s Urban Expansion. Resour. Sci. 2014, 36, 1327–1335. [Google Scholar]
- Li, X.; Lin, T.; Zhang, G.-Q.; Xiao, L.; Zhao, Q.; Cui, S. Dynamic analysis of urban spatial expansion and its determinants in Xiamen Island. J. Geogr. Sci. 2011, 21, 503–520. [Google Scholar] [CrossRef]
- Qiao, W.F.; Mao, G.X.; Wang, Y.H.; Chen, Y.J. Research on Urban Expansion and Land Use Change in Nanjing over the Past 32 Years. J. Geo-Inf. Sci. 2016, 18, 200–209. [Google Scholar] [CrossRef]
- Fan, S.Y.; Peng, W.F.; Mao, H.; Pan, H.J.; Zhou, J.M. Analysis on spatial and temporal change of urban sprawl in Chengdu. Sci. Surv. Mapp. 2015, 40, 102–108. [Google Scholar] [CrossRef]
- Wang, T.T.; Wang, Y.D.; Yang, Q.; Zhang, J. Urban Expansion and Its Driving Force for Putian City from 1988 to 2014. Remote. Sens. Inf. 2015, 30, 111–115. [Google Scholar]
- Wang, L.P.; Zhou, Y.K.; Xue, J.F. Study on Urban Land Expansion and Its Driving Mechanism in Jiangsu Province. China Land Sci. 2005, 19, 26–29. [Google Scholar] [CrossRef]
- Long, M.Q.; Meng, X.C. Urbanization, Suburbanization and China’s Urban Spatial Expansion. Areal Res. Dev. 2015, 34, 53–60. [Google Scholar]
- Huang, Q.X.; He, C.Y.; Shi, P.J.; Zhao, Y.Y.; Yang, Y.; Liu, H.Y. Understanding Multi-Scale urban expansion driving forces: In the case study of Beijing. Econ. Geogr. 2009, 29, 714–721. [Google Scholar]
- Yang, Q.; Li, X.; Shi, X. Cellular automata for simulating land use changes based on support vector machines. Comput. Geosci. 2008, 34, 592–602. [Google Scholar] [CrossRef]
- Liu, X.P.; Li, X.; Ye, J.A.; He, J.Q.; Tao, J. Using Ant Colony Optimization to Mining the Conversion Rules of Geographical Cellular Automata. Sci. China Press 2007, 37, 824–834. [Google Scholar] [CrossRef]
- Gan, X.Q. Study on City Growth Spatial from Based on Constrained Logisitic-CA Model. Master’s Thesis, Central South University, Changsha, China, 2008. [CrossRef]
- Zhang, H.H.; Zeng, Y.N.; Jin, X.B.; Yin, C.L.; Zou, B. Urban Land Expansion Model Based on Multi-agent System and Application. Acta Geogr. Sin. 2008, 63, 869–881. [Google Scholar] [CrossRef]
- Wang, Z.C. Study of Simulation for Urban Land Expansion Based on GIS and MAS. Master’s Thesis, Nanjing University, Nanjing, China, 2012. [Google Scholar]
- Wang, Z.Y.; Shi, P.J.; Zhang, X.B.; Wang, Y.S.; Xie, X.Y. Simulation of Lanzhou urban land expansion based on multi-agent model. Chin. J. Appl. Ecol. 2021, 6, 169–2179. [Google Scholar] [CrossRef]
- Zhang, Y.; Chang, X.; Liu, Y.; Lu, Y.; Wang, Y.; Liu, Y. Urban expansion simulation under constraint of multiple ecosystem services (MESs) based on cellular automata (CA)-Markov model: Scenario analysis and policy implications. Land Use Policy 2021, 108, 105667. [Google Scholar] [CrossRef]
- Li, X.; Zhou, Y.; Chen, W. An improved urban cellular automata model by using the trend-adjusted neighborhood. Ecol. Process. 2020, 9, 1–13. [Google Scholar] [CrossRef]
- Chen, W.Z.; Zhang, Z.H.; He, X.S. The Fine-Scale Urban Expansion Modeling in the Big Data Era. Urban Dev. Stud. 2017, 24, 71–76. [Google Scholar]
- Zhao, C.; Jensen, J.; Weng, Q.; Weaver, R. A Geographically Weighted Regression Analysis of the Underlying Factors Related to the Surface Urban Heat Island Phenomenon. Remote Sens. 2018, 10, 1428. [Google Scholar] [CrossRef] [Green Version]
- Li, Y.-W.; Cao, K. Establishment and application of intelligent city building information model based on BP neural network model. Comput. Commun. 2020, 153, 382–389. [Google Scholar] [CrossRef]
- Li, X.; Elvidge, C.; Zhou, Y.; Cao, C.; Warner, T. Remote sensing of night-time light. Int. J. Remote Sens. 2017, 38, 5855–5859. [Google Scholar] [CrossRef] [Green Version]
- Yu, B.; Shi, K.; Hu, Y.; Huang, C.; Chen, Z.; Wu, J. Poverty Evaluation Using NPP-VIIRS Nighttime Light Composite Data at the County Level in China. IEEE J. Sel. Top. Appl. Earth Obs. Remote Sens. 2015, 8, 1217–1229. [Google Scholar] [CrossRef]
- Chen, J.; Zhuo, L.; Shi, P.J. The Study on Urbanization Process in China Based on DMSP/OLS Data: Development of a Light Index for Urbanization Level Estimation. J. Remote Sens. 2003, 7, 168–175. [Google Scholar] [CrossRef]
- Li, X.M.; Zheng, X.Q.; Yuan, T. Knowledge Mapping of Research Results on DMSP/OLS Nighttime Light Data. J. Geo-Inf. Sci. 2018, 20, 351–359. [Google Scholar] [CrossRef]
- Guo, M.Q.; Bai, L.Y. A study of urban expansion feature of China based on DMSP-OLS stable nighttime light data. J. Green Sci. Technol. 2017, 10, 183–187. [Google Scholar] [CrossRef]
- Zhong, Y.; Lin, A.W.; Hu, B.S.; Ju, M. Spatial pattern evolution of urban system in Yangtze River Economic Belt based on DMSP-OLS night light data (1992–2013). Resour. Environ. Yangtze Basin 2018, 27, 2162–2171. [Google Scholar] [CrossRef]
- Zhang, P.; Kohli, D.; Sun, Q.; Zhang, Y.; Liu, S.; Sun, D. Remote sensing modeling of urban density dynamics across 36 major cities in China: Fresh insights from hierarchical urbanized space. Landsc. Urban Plan. 2020, 203, 103896. [Google Scholar] [CrossRef]
- Zhong, Y.; Lin, A.; He, L.; Zhou, Z.; Yuan, M. Spatiotemporal Dynamics and Driving Forces of Urban Land-Use Expansion: A Case Study of the Yangtze River Economic Belt, China. Remote Sens. 2020, 12, 287. [Google Scholar] [CrossRef] [Green Version]
- Zhong, Y.; Lin, A.; Xiao, C.; Zhou, Z. Research on the Spatio-Temporal Dynamic Evolution Characteristics and Influencing Factors of Electrical Power Consumption in Three Urban Agglomerations of Yangtze River Economic Belt, China Based on DMSP/OLS Night Light Data. Remote Sens. 2021, 13, 1150. [Google Scholar] [CrossRef]
- He, C.Y.; Shi, P.J.; Li, J.G. Research on the spatial process reconstruction of China’s mainland urbanization in the 1990s based on DMSP/OLS night light data and statistical data. Chin. Sci. Bull. 2006, 51, 856–861. [Google Scholar] [CrossRef]
- Zhao, M.; Zhou, Y.; Li, X.; Zhou, C.; Cheng, W.; Li, M.; Huang, K. Building a Series of Consistent Night-Time Light Data (1992–2018) in Southeast Asia by Integrating DMSP-OLS and NPP-VIIRS. IEEE Trans. Geosci. Remote Sens. 2019, 58, 1843–1856. [Google Scholar] [CrossRef]
- Liu, Q.P.; Yang, Y.C.; Fu, D.X.; Li, H.Y.; Tian, H.Z. Urban spatial expansion based on DMSP_OLS nighttime light data in China in 1992–2010. Sci. Geogr. Sin. 2014, 34, 129–136. [Google Scholar] [CrossRef]
- Ma, A.G. The Sprawl Research on Valley City Based on Cellular Automata. Master’s Thesis, Lanzhou University, Lanzhou, China, 2009. [Google Scholar]
- Liu, P.; Wang, Q.; Zhang, D.; Lu, Y. An Improved Correction Method of Nighttime Light Data Based on EVI and WorldPop Data. Remote Sens. 2020, 12, 3988. [Google Scholar] [CrossRef]
- Zhou, Z.H. Machine Learning; Tsinghua University Press: Beijing, China, 2015; pp. 102–106. [Google Scholar]
- Hu, Z.; Gong, X.; Liu, H. Prediction of household consumption carbon emission in western cities Based on BP model: Case of Xi′an city. J. Arid Land Resour. Environ. 2020, 34, 82–89. [Google Scholar]
- Mirsanjari, M.M.; Zarandian, A.; Mohammadyari, F.; Visockiene, J.S. Investigation of the impacts of urban vegetation loss on the ecosystem service of air pollution mitigation in Karaj metropolis, Iran. Environ. Monit. Assess. 2020, 192, 1–23. [Google Scholar] [CrossRef] [PubMed]
- Chen, H.S.; Zhou, Y.L.; Zhou, P.; Jin, J.L. Analysis and prediction of annual precipitation in Huangshan City based on wavelet and ARIMA. South-to-North Water Transf. Water Sci. Technol. 2019, 17, 50–55. [Google Scholar] [CrossRef]
- Zhang, J.H.; Zhang, Q.; Xu, D.H.; Ding, Y. Application of a combined ARIMA-LSTM model based on SPI for the forecast of drought: A case study in Qinghai Province. Arid Land Geogr. Arid Land Geogr. 2020, 43, 1004–1013. [Google Scholar] [CrossRef]
- Group, Project team of China Quarterly Macroeconomic Model. Macroeconomic forecasts for China in 2020–2021. J. Xiamen Univ. 2020, 21–29. Available online: https://mall.cnki.net/magazine/Article/XMDS202103008.htm (accessed on 8 September 2021).
- Fang, C.; Cui, X.; Li, G.; Bao, C.; Wang, Z.; Ma, H.; Sun, S.; Liu, H.; Luo, K.; Ren, Y. Modeling regional sustainable development scenarios using the Urbanization and Eco-environment Coupler: Case study of Beijing-Tianjin-Hebei urban agglomeration, China. Sci. Total. Environ. 2019, 689, 820–830. [Google Scholar] [CrossRef] [PubMed]
- Cao, G.Z.; Chen, S.C.; Liu, T. Changing spatial patterns of internal migration to five major urban agglomerations in China. Acta Geogr. Sin. 2021, 76, 1334–1349. [Google Scholar]
- Fang, C.L. New Structure and New Trend of Formation and Development of Urban Agglomerations in China. Sci. Geogr. Sin. 2011, 31, 1025–1034. [Google Scholar] [CrossRef]
- Zhu, X. A New Strategy of Hunan Space Development; Hunan Education Press: Hunan, China, 2019. [Google Scholar]
- Han, Z.; Jiao, S.; Zhang, X.; Xie, F.; Ran, J.; Jin, R.; Xu, S. Seeking sustainable development policies at the municipal level based on the triad of city, economy and environment: Evidence from Hunan province, China. J. Environ. Manag. 2021, 290, 112554. [Google Scholar] [CrossRef]
- Tan, Z.P. Urbanization Spatial Pattern and Affecting Factors Analysis of Hunan Province. Master’s Thesis, Hunan Normal University, Changsha, China, 2011. [Google Scholar]
- Gu, C. Urbanization: Processes and driving forces. Sci. China Earth Sci. 2019, 62, 1351–1360. [Google Scholar] [CrossRef]
- Wu, R.; Li, Z.; Wang, S. The varying driving forces of urban land expansion in China: Insights from a spatial-temporal analysis. Sci. Total. Environ. 2021, 766, 142591. [Google Scholar] [CrossRef]
- Liu, F.; Zhang, Z.; Shi, L.; Zhao, X.; Xu, J.; Yi, L.; Liu, B.; Wen, Q.; Hu, S.; Wang, X.; et al. Urban expansion in China and its spatial-temporal differences over the past four decades. J. Geogr. Sci. 2016, 26, 1477–1496. [Google Scholar] [CrossRef]
- Liang, J.S.; Wang, M. The allometric growth of urban land use and population and its experiential research. Sci. Geogr. Sin. 2002, 22, 649–654. [Google Scholar] [CrossRef]
- Han, M.; De Jong, M.; Jiang, M. City Branding and Industrial Transformation from Manufacturing to Services: Which Pathways do Cities in Central China Follow? Sustainability 2019, 11, 5992. [Google Scholar] [CrossRef] [Green Version]
- Clarke, K.C.; Johnson, J.M. Calibrating SLEUTH with big data: Projecting California’s land use to 2100. Comput. Environ. Urban Syst. 2020, 83, 101525. [Google Scholar] [CrossRef]


Publisher’s Note: MDPI stays neutral with regard to jurisdictional claims in published maps and institutional affiliations. |
© 2021 by the authors. Licensee MDPI, Basel, Switzerland. This article is an open access article distributed under the terms and conditions of the Creative Commons Attribution (CC BY) license (https://creativecommons.org/licenses/by/4.0/).