Article

Renewable Minigrid Electrification in Off-Grid Rural Ghana: Exploring Households Willingness to Pay

by
Artem Korzhenevych
1,2 and
Charles Kofi Owusu
2,3,*
1
Leibniz Institute of Ecological Urban and Regional Development, Weberplatz 1, 01217 Dresden, Germany
2
Faculty of Business and Economics, Technische Universität Dresden, Helmholtzstr 10, 01062 Dresden, Germany
3
Kumasi Institute of Technology, Energy and Environment (KITE), Accra GA23321, Ghana
*
Author to whom correspondence should be addressed.
Sustainability 2021, 13(21), 11711; https://doi.org/10.3390/su132111711
Submission received: 30 September 2021 / Revised: 18 October 2021 / Accepted: 20 October 2021 / Published: 23 October 2021
(This article belongs to the Special Issue Renewable Energy and Energy Saving: Worldwide Research Trends)

Abstract

:
Renewable energy minigrids hold significant prospects for Africa’s energy sector and its economic development in general. The government of Ghana has established pilot renewable minigrids in five off-grid communities as a testing ground for the electrification of over 600 existing rural communities that cannot be electrified via the national grid. Although there is evidence on willingness to pay (WTP) values for renewable-generated electricity in some developing countries, little is known about households’ WTP for renewable-based electricity in Ghana and, in particular, about renewable minigrids for rural electrification. This paper provides one of the first WTP estimates for renewable-based electricity for rural electrification in a developing economy context such as Ghana. Using data from a contingent valuation survey undertaken in all five pilot renewable minigrid project communities, we found that rural households are willing to pay an average of 30 GHC/month (≈5 USD/month) for high-quality renewable-powered electricity services, which is twice the amount they are currently paying based on the Uniform National Tariffs. The hypothetical bias is addressed by conducting a survey among active users of the minigrids. The starting point bias is reduced by employing random starting bids. The respondents are willing to pay between 9 and 11% of their discretionary incomes to cover the cost of accessing reliable renewable-powered electricity in the rural, off-grid communities in Ghana. The paper concludes by discussing the policy implications of these findings regarding the development of tariff regulations and business models for renewable minigrids in the rural, off-grid sector.

1. Introduction

About one billion people in developing countries currently lack access to electricity, most of them living in sub-Saharan African and developing Asian countries [1,2]. A vast majority (87%) of these unelectrified households live in rural areas [2]. This challenge is specifically addressed by Goal 7 “Ensure access to affordable, reliable, sustainable and modern energy for all” of the Sustainable Development Goals [2]. Despite ongoing electrification projects in different jurisdictions, the current trend is likely to lead to an estimated 700 million people who will remain unelectrified in 2030, nearly all of them in sub-Saharan Africa [1].
Despite the economic feasibility of extending the electricity grid to under-served areas in some situations, minigrids may be better suited to address the low electrification rates and electrification challenges in areas with scattered households, low populations, and low demand potential [1,3,4]. A vast majority of the rural households without adequate electricity access would be better serviced with standalone systems or minigrids [5]. Alongside the existing traditional approach of electricity grid extension, off-grid renewable energy solutions, notably, solar minigrids and standalone systems, provide a modern and scalable approach to achieve universal electrification [6]. Renewable energy minigrids therefore hold enormous prospects for the African energy sector, not only by enhancing energy access, but also by enabling the increased use of low-carbon energy sources, with the benefits for sustainable rural development.
Though investment levels in the solar minigrid market remain low [6], recent years have witnessed a significant increase in interest from different stakeholders (i.e., international organizations, governments, and the private sector) in developing minigrids as cost-effective and reliable means to reach unelectrified populations [7]. Indeed, an estimated half of the investment in electrification projects in the next decades is expected to target minigrids—creating a minigrid yearly investment volume of up to USD 20 billion [7].
As donors and developing economies alone are likely unable to meet these investment levels, renewable minigrid projects must be able to attract private equity and debt financing to sustain the scale of deployment required to realize global electrification goals [6,7]. With the critical role off-grid renewable energy is expected to play in achieving universal electricity access targets [1,8], attention must be paid to how policy makers can encourage private investments into this emerging off-grid renewable sector. The respective tariffs must be able to at least generate sufficient revenues to cover operations and maintenance costs and other liabilities, generate sufficient profit, and recover minigrid investment cost to be fully commercial [9].
However, in developing economies, designing commercially viable tariffs is often not as straightforward an issue as one might expect. Electricity is generally viewed as a public good, and thus from a government perspective, equity and fairness are paramount concerns. Many African governments have established uniform national electricity tariffs in order to ensure not only fairness across customers but also affordability [7]. Often these national tariffs are set at a rate below what utilities must charge to cover their capital and operational costs.
Ghana is no exception—uniform national tariffs apply to both grid electricity and off-grid renewable projects including the five current pilot renewable minigrids developed under the World Bank-funded Ghana Energy Development and Access Project. However, these tariffs do not allow a viable business model for potential commercial investors, as the true costs are currently not passed on to the electricity consumers. Thus, there is a need to understand and model the actual households’ demand for renewable-based electricity that would furnish relevant information for optimal tariff design in the rural, off-grid sector.
This study provides one of the first willingness to pay (WTP) estimates for renewable-based rural electricity provision in a developing economy context such as Ghana. Importantly, the study is new in that it was conducted among actual users of renewable minigrids, thus reducing potential bias in the WTP. Several econometric specifications making use of both dichotomous choice and open-ended survey questions are tested to increase the robustness of the results. The study is expected to inform policy makers on the amount an average rural household is willing to expend to access renewable minigrid electricity services and will consequently guide not only tariff adjustment, but also support the development of the overall business strategy for the off-grid, renewable-energy based electrification services.
To this end, this study seeks to respond to the following research questions: What is the WTP for a 24-h renewable minigrid electricity service in a rural off-grid setting in Ghana? What are the factors that influence households’ WTP? What do the findings suggest regarding the choice of future business models in this sector?
The rest of the paper is organized as follows. Section 2 discusses Ghana’s electricity sector in general and the off-grid electrification project development in particular. Section 3 reviews related empirical and theoretical literature. In Section 4, the methodology for the study is discussed. Analyses and discussion of study results are presented in Section 5 while Section 6 derives conclusions and policy implications.

2. Developments in Ghana’s Electricity Sector and the Ghana Energy Development and Access Project

The government of Ghana launched the National Electrification Scheme (NES) in 1989, with the overall objective of providing universal access to electricity in Ghana over a 30-year horizon [10,11,12,13]. By 2009, a 65% electricity access rate was achieved from a low of 28% in 1990. A total of 4221 communities with populations of at least 500 inhabitants were initially expected to be connected by 2020, a goal accomplished to 98% [10,11].
The 2010 NES Master Plan Review showed that about 85,000 communities and 13% of the Ghanaian population remained unelectrified. The document noted that approximately 70,000 (82%) of the unserved communities have low populations, scattered settlements, and are located in rural communities far from the grid, making it prohibitively expensive to extend the national grid to serve them [14]. Moreover, some of the communities are islands and lakeside communities, and, hence, the economics and practicalities of electrifying them via the grid are unrealistic. For these unserved communities, decentralized electrification options (such as minigrids and standalone systems) have been found to be the most cost-effective way of delivering reliable energy access [1,6].
The Ghana Energy Development and Access Project (GEDAP) was launched in 2007 as part of efforts to provide the off-grid, isolated communities with alternative electrification options [12,13]. The GEDAP installs pilot photovoltaic minigrid systems (with a back-up generator) providing electricity supply to five (Pediatorkope in the Greater Accra region, Atigagome and Wayokope in the Brong-Ahafo region, Kudorkope and Aglakope in the Volta region) of these isolated rural communities on islands in the Volta Lake in Ghana. The GEDAP Project is financed with concessional funding from the World Bank, the Global Environment Fund, and the Swiss Development Agency. Ownership of the project’s assets is vested in the government of Ghana. In all, a total 228 kW of photovoltaic capacity has been installed at the five minigrid sites supplying a total of 598 households. Households use this electricity typically for lighting, cell phone charging, powering their television and radio, fans, and fridges.
A dominant regulatory problem hindering the development of the minigrid market is the fact that the Uniform National Tariff policy, originally applicable to grid-connected households, has been extended to the renewable minigrids [12]. This means that consumers of electricity in the five pilot communities pay the same electricity price per kilowatt-hour (kWh) as grid-connected customers. Table 1 below shows, among others, the difference between what is deemed to be cost-reflective tariffs (only covering minigrid operational and maintenance cost) and the approved UNT in Ghana [10].
Because of the application of the UNT, the total revenue received from minigrid customers is only sufficient to cover a fraction of the operational expenses and does not cover the investment or maintenance costs [15]. The resulting negative cash flow is a disincentive to private investments into minigrids. Thus, there is research need regarding the features of off-grid household electricity demand that would allow alternative price setting.

3. Literature Review

A number of methodological approaches exist in the valuation literature that are used to estimate people’s willingness to pay (WTP) for public or non-market goods and services. The contingent valuation (CV) approach, a well-known and established valuation method [16,17] is a stated preference methodology for economic valuation characterized by the creation of hypothetical markets for non-market goods where individuals are asked how much they would be willing to pay for the good if the market really existed. This paper relies on the CV method to capture rural households’ WTP for renewable-generated electricity, since it provides theoretically accurate monetary measures of utility changes as well as offers an accurate and credible estimate of the respondent’s full non-market value of a good [16,17].
Specifically for Ghana, there are a handful of empirical studies on WTP for electricity. Twerefou [18] used a CV method to assess WTP for improved electricity supply in Ghana from a survey of 1000 households. The survey captured the northern, coastal, and middle zones of the country. The study used a combination of dichotomous choice and open-ended question elicitation methods, and from the author’s ordered probit estimations, the results showed that households in Ghana are willing to pay an average of GHC 2.7 for a kilowatt-hour of electricity supply, about one and a half times more than what they were actually paying. However, respondents in the study were asked to state their WTP estimates based on an amount (in kWh) of electricity consumed. Analysis based on kWh is a bit technical (and might not elicit the right value placed on electricity consumption by households) as compared to what most users are accustomed to: the average amount they pay in a month for power consumed within that month. As noted in previous studies [19,20,21,22], energy is abstract, invisible, and measured in kWh, a unit hard to deal with for most consumers. The study also did not capture any heterogeneity, such as the rural–urban distinction in the WTP figures or the north–south divide within Ghana in terms of income profiles and living standards.
Using a tobit regression technique, Taale and Kyeremeh [23] showed that urban households in Ghana are willing to pay 44% (GHC 6.8) more, compared to their current average monthly electricity bill, in order to access improved electricity services. The study showed that prior notice of power outages, monthly income, education level, and household size are among the factors that significantly affect households’ willingness to pay for reliable electricity in Ghana. The authors, in their econometric model, however, did not account for differences in geographical location and in economic circumstances among communities, which could affect the household’s WTP for electricity.
A number of other electricity-related WTP studies have been conducted in other developing countries. There also have been studies on willingness to pay for renewable-generated electricity in both developing and developed countries. A summary of the relevant literature is provided in Table 2 below. To the best of the authors’ knowledge, the literature so far does not include a WTP study on renewable-generated electricity in Ghana and, in particular, on renewable minigrids for rural electrification.

4. Study Methodology

4.1. Study Area and Selection of Survey Households

In order to estimate the willingness to pay for renewable-powered electricity service in rural Ghana, a contingent valuation survey was undertaken in all five renewable minigrid project communities in Ghana, located in 3 (Greater Accra, Volta, and Brong-Ahafo) of the 16 regions of Ghana. All of them are located on islands in the Volta River.
The communities are mainly accessible by water and are predominantly rural, with mud houses and thatched roofs. Fishing and farming are the predominant occupations and the source of income for most households. Fish trading, clothing making, hairdressing, livestock breeding, and small retail stores also provide income for households. Only a few households are employed in petty trade and public service (e.g., district assembly employees and teachers).
Prior to the minigrid electrification project, there was no electricity in the communities. All traditional sources of energy and the respective equipment such as storm lamps, kerosene, dry batteries, diesel generators, etc., were purchased at very high prices from surrounding towns, increasing energy costs and overall household expenditures. In the absence of electricity to run cold storage equipment, households were forced to sell their fish harvest in the market at cheap prices. Processing of agricultural products was also problematic owing to the high cost of diesel to operate the existing mills. The minigrid electrification project can therefore be considered a very important infrastructure that will help meet the social, health, and economic needs of the communities.
The conceptual framework for WTP analysis and contingent valuation is consistent with consumer demand theory and captures both use and non-use values of a commodity. The contingent valuation method is deeply rooted in microeconomic welfare theory, where households or individuals minimize their expenditure under utility constraints or maximize their utility subject to income or budget constraints [40,41].
Households in the project communities (refer to Table 3) were selected for interview using a combination of a cluster sampling approach and simple random sampling. Cluster sampling was applied because of the scattered nature of the settlements in the project communities. The number of households picked from each cluster was set in proportion to the cluster population. Inside any cluster, the households interviewed were selected randomly. The number of households selected per community for the face-to-face interviews was in proportion to the total number of households in the community. The survey took place between 28 October 2020 and 14 November 2020, and a total of 200 households (respondents) were interviewed (see Table 3). Four field researchers participated in the main survey after being trained with a pilot survey.

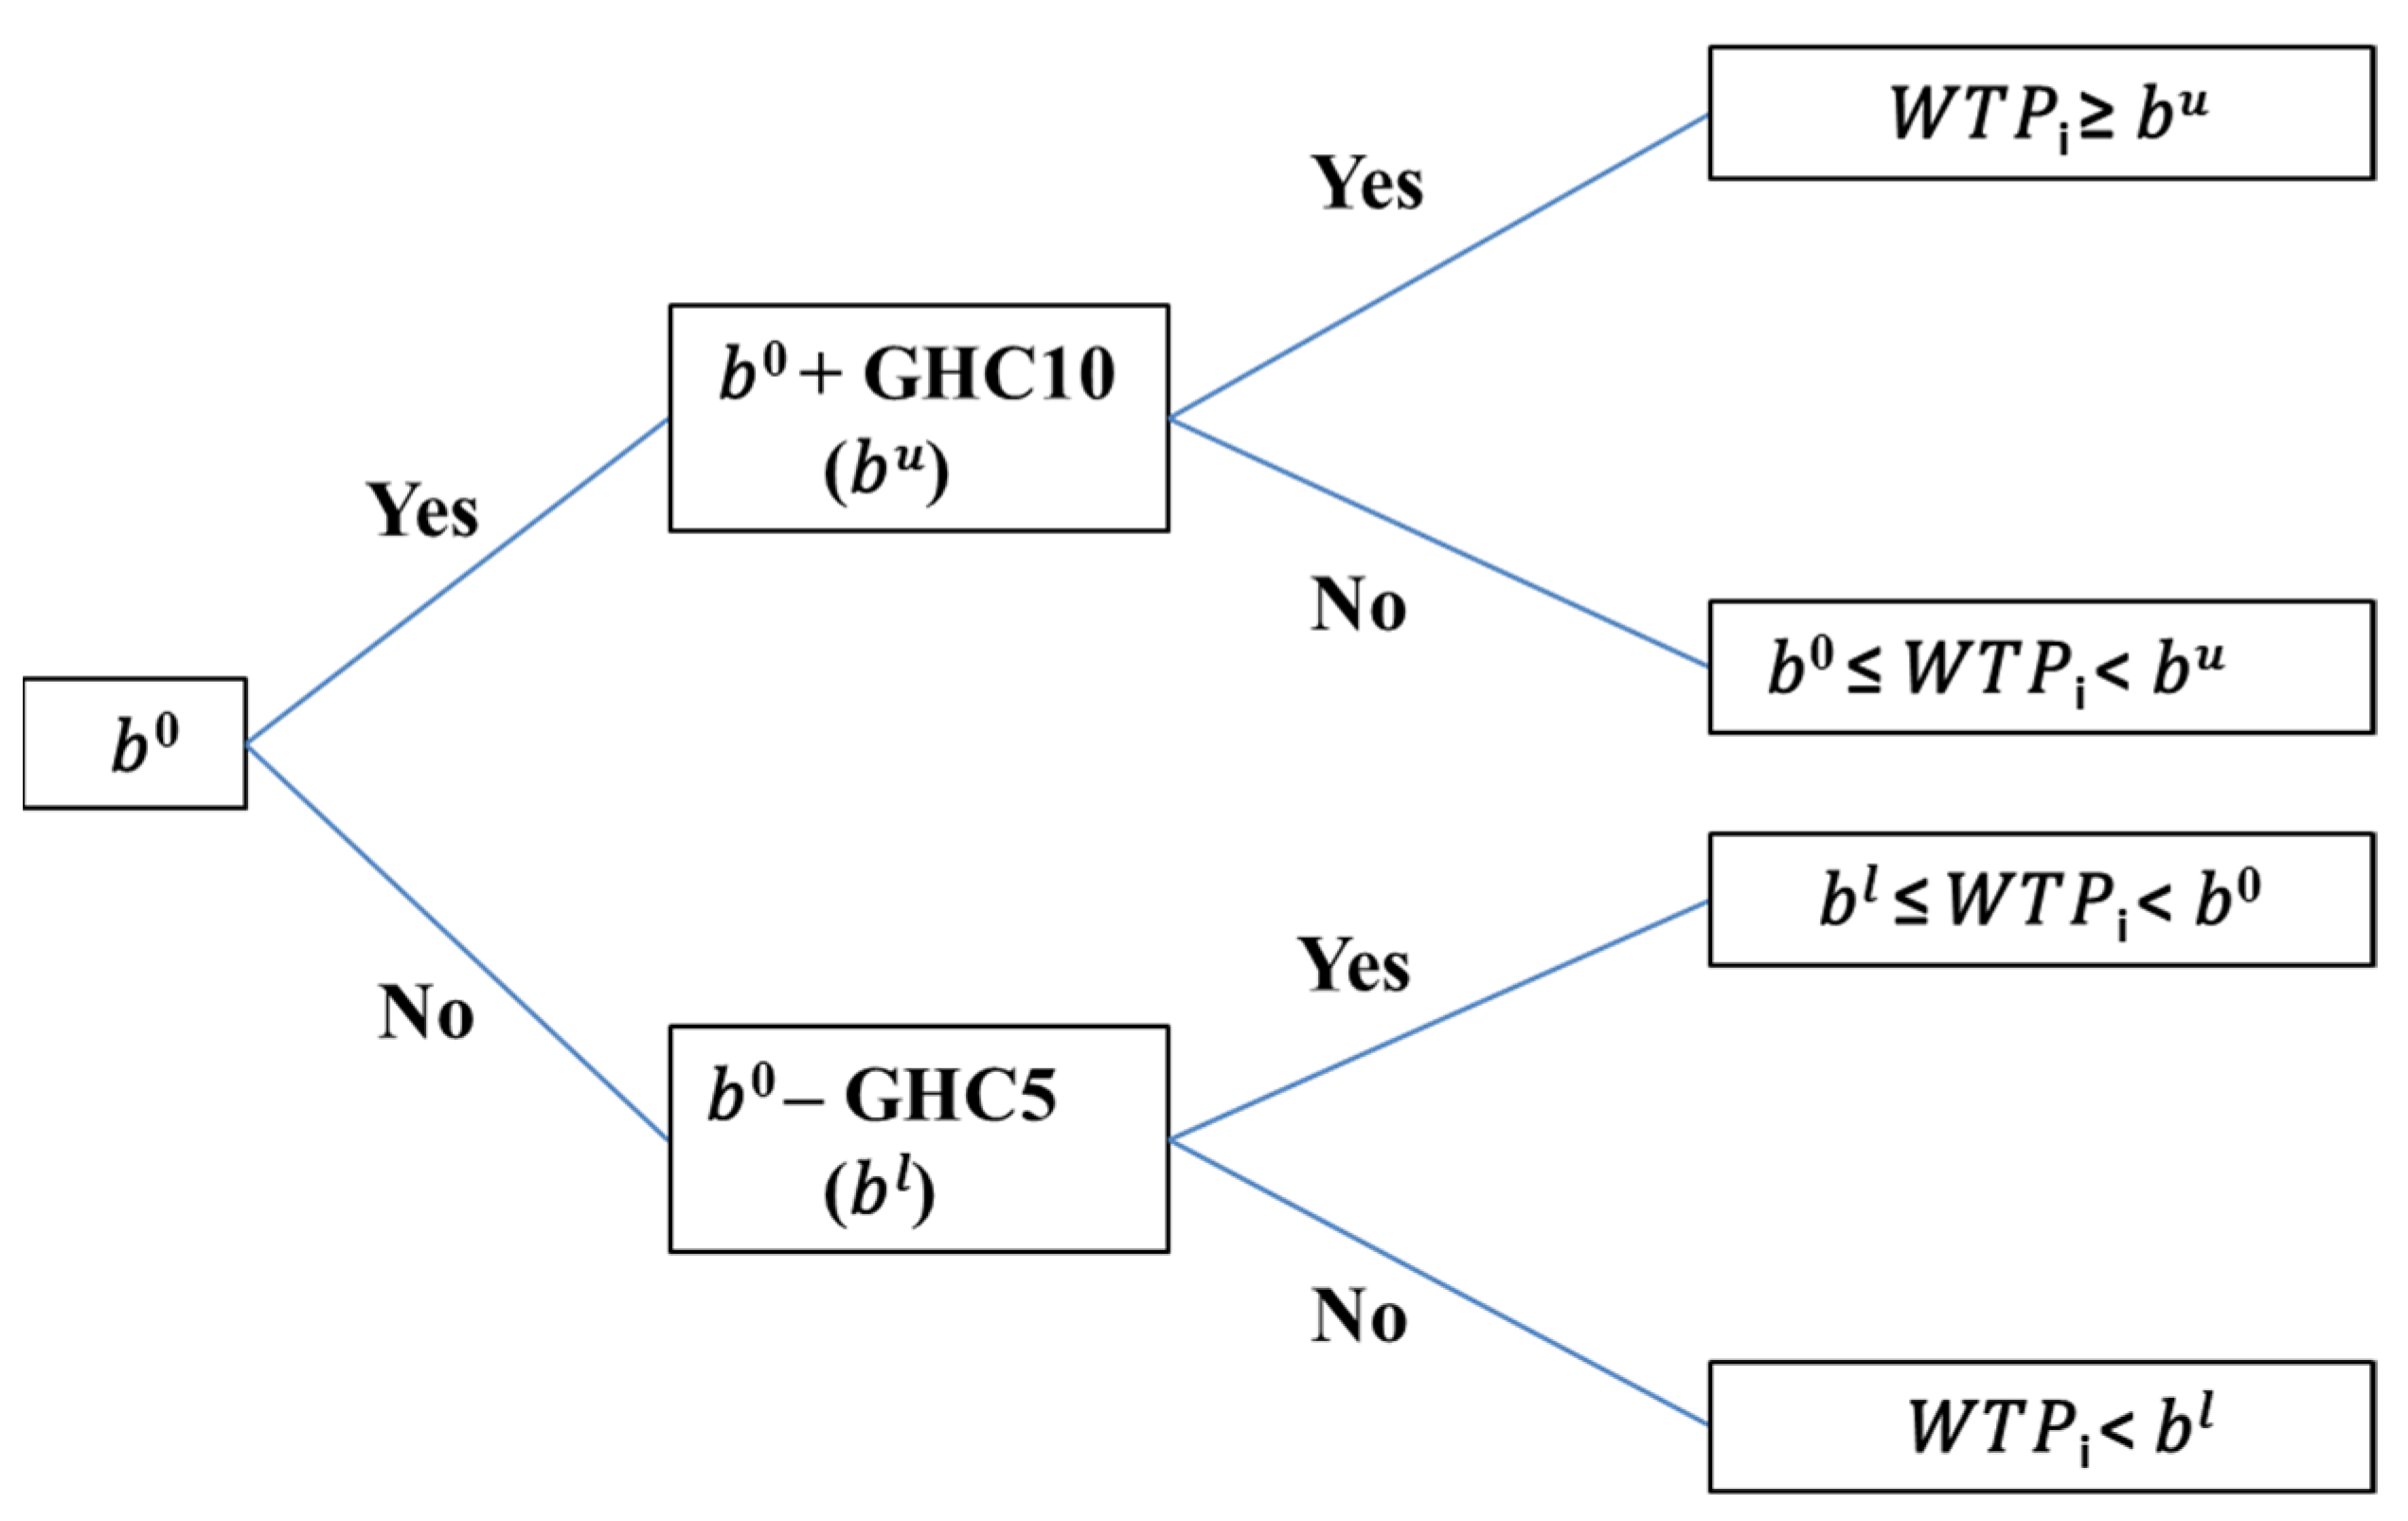
4.2. Questionnaire Design and WTP Elicitation Process

The survey was structured in three main sections. These included (i) respondent’s socioeconomic characteristics, (ii) utility-related information, and (iii) questions on WTP for renewable minigrid electricity. Renewable minigrid electricity access and bills paid were captured under a second, utility-related information, section.
Contingent valuation questions were asked in the third part of the questionnaire using the double-bounded dichotomous choice (DBDC) and open-ended techniques. The DBDC method implies that two different monetary payments are subsequently suggested to survey respondents. The second amount proposed to respondents is contingent on their response to the first proposed monetary payment [42,43,44]. The DBDC technique was adopted for its several advantages. This elicitation method is robust to poorly-designed bids [45,46] and is incentive-compatible [47]. It is also efficient [45] and robust to strategic and cognitive biases [48]. The open-ended question asked directly for the maximum WTP after the first two questions of yes/no type. Both elicitation approaches were used to increase construct validity of the WTP estimates [43].
In each of the minigrid project communities, there are currently the same 6 electricity tariff levels (with corresponding monthly payments) based on the Uniform National Tariffs, as reported in Table 1. The majority (82%) of the households in the communities have signed onto the T11, T21 and T31 tariff bands and are paying GHC 7, GHC 12.4 and GHC 17.8, respectively, as average monthly electricity bills. For the dichotomous choice WTP questions, this study randomized the starting bid values in order to control for the anchoring effect or the starting point bias. For each household, the starting bid (b0) was randomly picked from a set of six possible monthly tariff tiers ranging from GHC 15 to 40 (this corresponds to the middle level of the cost-reflective tariff calculations for the most popular current tariff categories, see Table 1).
The initial question was formulated as “Assume your household is provided with a 24-h, reliable renewable minigrid electricity supply, which is able to power all your electrical equipment. Are you willing to pay amount x per month to cover the cost of power production?” It was followed by another similar dichotomous choice question, where the starting bid was adjusted upwards or downwards, depending on the first answer (see Figure 1).
The final question in the survey was open-ended: “State the maximum amount you are willing to pay, to cover cost of power production, assuming your household is provided with a 24-h, reliable renewable minigrid electricity supply, which is able to power all your electrical equipment.” The DBDC results and the maximum WTP were used separately in the econometric analyses to check the validity of the results.
Despite the fact that contingent valuation methodology has been widely applied in research, some researchers have raised concerns over its validity. According to some authors [49,50,51,52] as reported in Hanemann [53], results from a contingent valuation study may be inconsistent with economic theory. According to Hausman [54], the approach is plagued by three main issues, namely: willingness to pay—willingness to accept dichotomy, hypothetical response bias, and scope effect (which renders it an ineffective tool in terms of policy formulation). Hausman [54] averred that people do not do what they say; a ‘yes’ response to a hypothetical question, as happens in contingent valuation studies, does not signify economic power neither can it be suggested to mean that survey respondents would do exactly in reality. However, other authors [55,56,57] have adduced counterarguments to the views of the critics.
Evidence can be used to justify application of the contingent valuation approach in this study along the lines of the criticism. First, according to Rowe et al. [58] (p. 6), hypothetical bias is “the potential error induced by not confronting any individual with the real situation.” The renewable minigrid electricity, which is being valued, is not new to the survey households; the commodity is not a hypothetically described market good and hence cannot be so predisposed to the hypothetical bias. In terms of scope sensitivity, Morey et al. [59] affirmed that, “economic theory suggests that in general WTP will depend on income, justifying the inclusion of income in the utility difference model.” This study estimated the WTP of households subject to their income, which is consistent with consumer demand theory.

4.3. Econometric Estimation

4.3.1. Dichotomous Choice Models Estimation

The answers of respondents to the discrete choice questions of the survey were employed to construct two models estimated using maximum likelihood techniques. First, a simple probit model was estimated using only the answers to the first dichotomous choice question. Second, the answers to both dichotomous choice questions were used together in the estimation of a double-bounded (interval) model using the doubleb STATA command developed by Lopez-Feldman [60]. The interval model used the combinations of the two answers (Yes–Yes, Yes–No, No–Yes, No–No) to a certain extent to limit the individual WTP values to the bands within the known bids (Figure 1).
Selected households’ socioeconomic characteristics included in the regressions were informed by previous studies discussed in Section 3. They included the initial bid, the current electricity bill, household income, marital status, gender and educational level of the respondent, household size and a dummy taking a value of 0 if the household was using electricity for all activities/energy services and 1 otherwise. All monetary variables were converted into logs. Community-specific dummy variables were added to all models.
As a measure of household income, the household’s discretionary income was used, which was the remaining portion of the household’s income after committed expenditures on clothing, housing, food, transportation, and other market and non-market goods were taken into account. According to Laitila [61], this is a relevant measure of household income, which is supported by economic theory, because the household’s maximum WTP for any good should be restricted by their ability to pay.

4.3.2. OLS Estimation of the Maximum WTP

In the definition of elicitation methods, when open-ended questions are posed and a continuous bid variable is obtained, ordinary least squares (OLS) can be an appropriate estimation method [44]. The OLS model uses the stated maximum WTP values as the dependent variable. The explanatory variables employed were the same as in the dichotomous choice models estimation, including community-specific dummy variables. All regressions were run in STATA.

5. Results and Discussion

5.1. Descriptive Analysis

From the summary statistics shown in Table 4, the mean household size was 6.6, which was higher than the national average of 5.5 for rural dwellers [62]. Out of the 200 respondents interviewed, approximately 70% were males, which is characteristic of male dominance in Ghanaian households, affirmed by the national average of 72% in the rural areas [62]. On the average, respondents reported a monthly discretionary income of GHC 323 per household, which was below the national estimate of GHC 422 for rural dwellers [62]. Furthermore, 63% of the respondents were married as compared to an estimated 48% for rural inhabitants in Ghana [62]. From the survey, an average of 59% of households were not able to meet all their energy service needs as they wished, compared with 41% who did not have those capacity constraints. With respect to education, a majority (60%) of the respondents had attained a basic education while 13% had not acquired any form of education. A fifth (20%) of the sample had a secondary education, while 7% were schooled up to the tertiary level. For comparison, according to national statistics, about a fifth (20%) of all rural dwellers have never been to school while approximately 47% have some basic education. Additionally, about 15% of the rural population have acquired a secondary or higher level of education [62].
As for the WTP, 29% of the respondents were willing to pay at most GHC 25 per month, the majority (60%) were willing to pay between GHC 25 and GHC 35 while the remaining 11% were willing to pay above GHC 35. However, their current average monthly electricity bill equaled approximately GH 15. A recorded average WTP of GHC 29 was almost twice the respondents’ current average electricity expenditure.

5.2. Factors Influencing the Willingness to Pay

The WTP was estimated using three models: a probit model using the first round of dichotomous choice questions, a double-bounded (interval) model using two rounds of dichotomous choice questions, and an OLS model using the stated maximum WTP. Figure 2 compares the estimated WTP from three methods at three points of the distributions: 25th, 50th, and 75th percentiles. The OLS model using the maximum WTP produced the most reliable estimates, and the results of the interval model were quite similar. This is why later in this section the WTP determinants are discussed based on these two models. Other estimation results are presented in the Appendix A, Table A1.
The econometric estimation results are shown in Table 5. Community dummies were used to control for community-specific effects. The Variance Inflation Factor (VIF) was applied to test for the presence of multicollinearity. The results from the test showed that VIFs for all the regressors were less than 10, which deemed multicollinearity unproblematic. Furthermore, the models were estimated with robust standard errors owing to the problem of heteroskedasticity associated with cross-sectional data. The F-tests (OLS) undertaken to evaluate the validity and significance of the model parameters showed the estimated models were highly significant at the 1% significance level.
The starting bid variable was insignificant in the OLS estimation, which was important and demonstrated the absence of a starting point bias in this estimation. In the interval model, the starting bid was significant and negative, which is an often-observed effect in dichotomous choice models, where a high initial bid is more likely to be rejected.
Household income was highly significant and carried the expected positive sign. Furthermore, the coefficient decreased when the sample was reduced toward low-income households (see Appendix). This was consistent with economic theory and showed that an increase in household income will lead to an increased WTP for renewable-powered electricity in rural areas. The coefficient was in the order of 0.5, further implying that renewable-powered electricity was regarded as a normal good or even a necessity. This result confirmed the findings of other studies in developing countries [18,23,24,25,26,31,33,34,63], which found that income is an important variable in determining the amount households are willing to pay for electricity.
Marital status was significant in the OLS regression with a positive impact on households’ WTP for clean electricity services. This could be due to the fact that married couples were more likely to have their own children and corresponding increased energy needs. Previous studies [19,23,26] found similar results, which showed that married couples are more likely to pay for electricity connection services relative to the unmarried.
The size of a household was also important in determining the WTP for renewable electricity. The coefficient of household size was positive. This was also in accordance with previous findings [19,25,33,36]. The positive sign could be attributed to the fact that people attached status to large household sizes and the show of economic strength, especially in the rural areas. Hence, with an increasing household size, families may be forced to live in line with this status symbol. However, other studies [18,64] found a negative relationship between the size of a household and willingness to pay for electricity.
Households that wanted the opportunity to use the electricity for all the activities and energy services they require were generally inclined toward paying more for electricity services. This study revealed similar trends. Households that did not have enough electrical capacity to meet all their current and potential energy needs were willing to pay more for renewable-powered electricity services. This result confirmed the findings in other studies [23,48,65], which found a positive association between duration of power outage and willingness to pay for improved electricity service. This was summed up in Otegbulu [65] and Oseni [37], who found that a majority of Nigerian households, irrespective of their socioeconomic status, valued reliable electricity supply and were thus willing to pay more to access it.
Secondary education was the only education dummy, which was positive and significant in the OLS regression. No significant negative effects of higher education were observed. It suggested the importance that household heads with some level of schooling attached to electricity in general. The assumption was that households with some level of education understood the benefits of electricity access, including convenience, income generation opportunities, and quality of life in general relative to the uneducated. Findings from several studies in developing countries [39,66] affirmed that education is a key socioeconomic variable that positively impacts the adoption and WTP for renewable technology electrification. Zarnikau [67] also found that the education levels of households positively impact their WTP for electricity efficiency investments. Other studies [18,23,34,35] found similar results indicating higher WTP with the levels of education of a household head.

5.3. Mean WTP Levels

This section discusses the mean maximum WTP values as obtained from the sample prior to estimating the regression and the predicted mean WTP estimates using the OLS estimation. The sample means represent the observed WTP for the renewable-powered electricity services while the predicted estimates reflect the impact of the socioeconomic variables. Table 6 captures both the observed and empirical mean estimates for the full and respective sub-samples.
In Table 6, the mean WTP in the full sample is GHC 29.79. This constituted an estimated 9% of the rural households’ discretionary income. This proportion of income to electricity expenditure was consistent with previous contingent valuation results [23,68].
The average WTP were further evaluated based on sub-samples belonging to current tariff categories (of the Uniform National Tariff) in the minigrid project communities. As explained earlier (see Table 1), there were six main tariff categories. The respective numbers of households surveyed were as follows: 37 (18.5%) households in T11, 90 (45%) households in T21, 55 (22.5%) households in T31, 16 (8%) households in T42, and 2 (1%) households subscribed to the T53 tariff. None of the households surveyed subscribed to the T01 tariff category. Results of the regressions based on the three large sub-samples are included in the Appendix B as Table A2.
Table 6 shows the observed and predicted average WTP of households within these tariff bands. The predicted average WTP for the T11 tariff band sub-sample was GHC 28.25. This estimated amount corresponded to about 9% of those households’ monthly income and was more than three times their current electricity expenditure (GHC 7). In the same vein, the predicted average WTP for the T21 tariff band sub-sample was GHC 28.55 as compared to the current amount of GHC 12.4 per month. This estimated WTP amount (GHC 28.55) was more than twice their current expenditure on electricity and corresponded to about 9% of the households’ monthly income. A similar WTP result was obtained for the T31 tariff band sub-sample. The expected mean WTP for this group of households was GHC 29.96, compared with their current monthly electricity expenditure of GHC 17.8, representing about a 68% increment over their current electricity expenditure and corresponding to 9% of the average monthly income from this subsample.
Thus, households were willing to pay substantially more than currently if a stable renewable energy supply was guaranteed. Oseni [37] similarly showed that Nigerian households are similarly willing to pay up to 86% above their current electricity tariffs for an enhanced power supply. According to ESMAP [69], rural households in Ghana want electricity more than they want low electricity tariffs, because in the absence of electricity access, households resort to paying higher proportions of their income on inferior energy forms. This also suggests that any form of business model to be considered and adopted by the government in the long term must seriously consider households’ willingness to enjoy more and better available electricity and the fact that rural households are ready to discharge appropriate financial commitment to support sustainability of minigrids. However, poorer households currently signed on to low tariffs would be confronted with the largest increase in electricity expenditure, if they were charged according to their stated WTP. This calls for caution in the implementation of business models that might replace the uniform tariffs.

6. Conclusions and Policy Implications

Universal access to reliable and sustainable energy services requires expanding access to electricity, a key precondition for achieving the Sustainable Development Goals. Many governments in Africa set the agenda of meeting the universal electrification goals by electrifying remote and off-grid communities in rural areas with renewable minigrids. These minigrid technologies require huge capital outlays and therefore would need the backing of government, private sector, and households living in isolated, rural communities to achieve electrification goals and more so to ensure minigrid systems scalability and sustainability. This study relied on the contingent valuation method to estimate households’ willingness to pay for renewable-generated electricity in the rural, off-grid communities in Ghana.
The results from the study indicated that rural households are willing to pay an average of about GHC 30 (USD 5) per month for renewable-powered electricity services, which is on average twice the amount they are currently paying, based on the Uniform National Tariffs. The surveyed households are thus willing to pay around 9% of their discretionary incomes for renewable-powered electricity. The results also showed that the elasticity of willingness to pay with regards to household income is 0.46. Given the economic growth rate of Ghana, at approximately 1.7% in 2020 (a decline from 6.5% in 2019 due to the COVID-19 shock), households’ willingness to pay for electricity is expected to significantly increase in the future.
Household income, household size, basic education level of household head and marital status of respondents were noted to be significant factors that impact households’ willingness to pay for renewable minigrid services. Another important finding was that households that do not have enough electrical capacity to meet all their current and potential energy needs are willing to pay more for renewable-powered electricity services.
The benefits that come with electricity access are evident to all the minigrid-connected communities, as even households without adequate electrical capacity indicated their readiness and willingness to pay a “premium” price for the minigrid electricity services. This should serve as a major signal to the policy makers: first, of the households’ readiness to embrace new forms of alternative energy sources, and second, of the need to fast-track access provision for the energy have-nots and under-served areas, bringing into sharp focus the importance of the minigrid business model.
The results suggested that a private sector model could be considered and adopted for minigrid electrification in the future, as off-grid rural households’ financial circumstances can support the sustainability of this business model. A hybrid minigrid business model (Public–Private Partnership) could also be explored. To this end, the government must develop the relevant regulatory and policy frameworks that support sustainable tariff approaches and minigrid business models, in order to de-risk investments and attract private developers into the off-grid renewable sector.
Another policy implication of the study is for the government and district/municipal authorities to support the minigrid communities with the development of productive uses of clean energy. Such initiatives have the potential of generating income for households from light industrial and agro-processing activities and thus enhancing the wealth of families in the rural areas. Poor households will then be better positioned to withstand shocks that may come with the abolishment of the Uniform National Tariff policy.
The study exclusively surveyed the five minigrid communities (which were the only renewable minigrid-electrified communities at the time of the study), and the sample was thus representative of the population covered by rural minigrids. Although the surveyed communities generally shared similar socioeconomic characteristics with the rural poor in Ghana (and hence results are generalizable), these minigrid communities have had the benefit of already enjoying renewable electricity access relative to the other rural population with little or no electricity access. Thus, perceptions and attitudes about alternative energy sources and the level of willingness to pay for these energy sources may differ from the general population. It will be a task for future research to evaluate whether there are significant differences in WTP values for renewable minigrid electricity services across already electrified communities and unelectrified rural locations.

Author Contributions

C.K.O.: Conceptualization, methodology, formal analysis, writing—original draft, funding acquisition. A.K.: Methodology, writing—review and editing, supervision, formal analysis, funding acquisition. All authors have read and agreed to the published version of the manuscript.

Funding

The Alexander von Humboldt Foundation provided support for conducting the research and preparing the article (Ref 3.5-1208742-GHA-IKS). They did not have any role in the study design, data collection, analysis and report writing, and in the decision to submit the article for publication.

Institutional Review Board Statement

Not applicable.

Informed Consent Statement

Not applicable.

Data Availability Statement

The data presented in this study may be made available from the authors upon request.

Acknowledgments

The authors wish to thank Selorm Kpoh (and the entire KITE field team) for the technical assistance provided in the survey design and instrumentation and for facilitating the field survey. We express our appreciation to the participants of the RSAI 2021 Conference, the GfR Summer Conference 2021, and the Seminar Series at the Faculty of Business and Economics, TU Dresden, for their insightful comments. The usual disclaimer applies.

Conflicts of Interest

The authors declare no conflict of interest. The funders had no role in the design of the study; in the collection, analyses, or interpretation of data; in the writing of the manuscript, or in the decision to publish the results.

Appendix A. Discrete Choice Model Results (Double-Bounded and Probit Models)

Table A1. Maximum WTP regression results.
Explanatory VariableDouble-Bounded ModelProbit Model
Starting bid (log)−0.170 **−11.970 ***
(0.067)(−2.321)
Electricity bill (log)−0.0090.179
(0.030)(−0.479)
Monthly discretionary income (log)0.572 ***6.507 ***
(0.055)(−1.099)
Marital status (Dummy)0.0370.327
(0.028)(−0.406)
Gender (Male)0.0030.065
(0.028)(−0.356)
Use of electricity for all activities (No = 1)0.071 **0.876 **
(0.028)(−0.404)
Household size0.0070.117 *
(0.004)(−0.065)
Educational level, basic−0.002−0.264
(0.043)(−0.554)
Educational level, secondary0.001−0.292
(0.048)(−0.622)
Educational level, tertiary−0.012−1.842 *
(0.059)(−0.947)
Constant0.663 **3.725
(0.274)(−3.963)
Community dummiesYesYes
Regression’s estimated standard error0.114 ***
(0.012)
Observations200200
Hosmer and Lemeshow goodness-of-fit (prob > chi2) 0.75
Note: Standard errors in parentheses; *** p < 0.01, ** p < 0.05, * p < 0.1. Source: Authors.

Appendix B. Further OLS Regression Results

Table A2. OLS regression results—full vs. sub-samples (tariff categories).
(1)(2)(3)(4)
VariableFull Sample Sub-Sample 1
(Tariff Level = GHC 12.4)
Sub-Sample 2
(Tariff Level = GHC 17.8)
Sub-Sample 3
(Tariff Level = GHC 7)
Starting bid (Log)−0.038
(0.027)
−0.017
(0.038)
−0.011
(0.039)
−0.161 *
(0.086)
Monthly income (Log)0.463 ***
(0.045)
0.450 ***
(0.067)
0.534 ***
(0.059)
0.397 ***
(0.097)
Marital status (Dummy)0.063 ***
(0.021)
0.090 ***
(0.028)
0.012
(0.032)
0.057
(0.077)
Gender (Male)−0.009
(0.018)
0.012
(0.029)
−0.017
(0.027)
−0.037
(0.053)
Use of electricity for all activities (No)0.060 ***
(0.021)
0.060 *
(0.031)
0.001
(0.038)
0.097 *
(0.051)
Household size0.007 ***
(0.003)
0.009 *
(0.005)
0.003
(0.006)
0.017 **
(0.008)
Education level, basic0.036
(0.024)
0.065 *
(0.038)
−0.054
(0.046)
0.052
(0.049)
Education level, secondary0.047 *
(0.027)
0.050
(0.044)
0.024
(0.038)
−0.016
(0.067)
Education level, tertiary−0.006
(0.040)
0.020
(0.057)
0.032
(0.046)
Constant0.752 ***
(0.249)
0.640 *
(0.324)
0.382
(0.360)
1.411 **
(0.629)
Community dummiesYesYesYesYes
Observations200905537
Expected Mean29.1428.5529.96
R-squared0.7130.7460.8010.735
F-test26.13 ***14.17 ***24.42 ***11.52 ***
Dependent Variable for WTP: WTP Amount (Final); Robust standard errors in parentheses. *** p < 0.01, ** p < 0.05, * p < 0.1. Source: Authors.

References

  1. International Energy Agency. WEO-2017 Special Report: Energy Access Outlook; IEA: Paris, France, 2017; Available online: https://www.iea.org/reports/energy-access-outlook-2017 (accessed on 17 August 2021).
  2. International Energy Agency; International Renewable Energy Agency; United Nations; World Bank Group; World Health Organization. Tracking SDG7: The Energy Progress Report 2018; World Bank: Washington, DC, USA, 2018. [Google Scholar]
  3. International Energy Agency. Energy for All; IEA: Paris, France, 2011; Available online: https://www.iea.org/reports/energy-for-all (accessed on 17 August 2021).
  4. Peters, J.; Sievert, M.; Toman, M.A. Rural electrification through mini-grids: Challenges ahead. Energy Policy 2019, 132, 27–31. [Google Scholar] [CrossRef] [Green Version]
  5. Antonanzas-Torres, F.; Antonanzas, J.; Blanco-Fernandez, J. State-of-the-Art of Mini Grids for Rural Electrification in West Africa. Energies 2021, 14, 990. [Google Scholar] [CrossRef]
  6. UNDP; ETH Zurich. Derisking Renewable Energy Investment: Off-Grid Electrification; United Nations Development Program: New York, NY, USA; ETH Zurich, Energy Politics Group: Zurich, Switzerland, 2018. [Google Scholar]
  7. Reber, T.J.; Booth, S.S.; Cutler, D.S.; Li, X.; Salasovich, J.A. Tariff Considerations for Micro-Grids in Sub-Saharan Africa; National Renewable Energy Lab: Golden, CO, USA, 2018.
  8. World Bank; Foster, V.; Azuela, G.; Bazilian, M.; Sinton, J.; Banergee, S.; De Wit, J.; Ahmed, A.; Portale, E.; Angelou, N.; et al. Sustainable Energy for All 2015: Progress toward Sustainable Energy; The World Bank: Washington, DC, USA, 2015. [Google Scholar]
  9. Deshmukh, R.; Carvallo, J.P.; Gambhir, A. Sustainable Development of Renewable Energy Mini-Grids for Energy Access: A Framework for Policy Design; Lawrence Berkeley National Laboratory: Berkeley, CA, USA, 2013.
  10. KITE (Kumasi Institute of Technology, Energy and Environment). An Assessment of Renewable Energy Technologies as Off-Grid Power Solution in Ghana, Final Report Submitted to the African Development Bank; KITE: Accra, Ghana, 2018. [Google Scholar]
  11. Kemausuor, F.; Ackom, E. Toward universal electrification in Ghana. Wiley Interdiscip. Rev. Energy Environ. 2016, 6, e225. [Google Scholar] [CrossRef] [Green Version]
  12. Bukari, D.; Kemausuor, F.; Quansah, D.A.; Adaramola, M.S. Towards accelerating the deployment of decentralised renewable energy mini-grids in Ghana: Review and analysis of barriers. Renew. Sustain. Energy Rev. 2021, 135, 110408. [Google Scholar] [CrossRef]
  13. Kumi, E.N. The Electricity Situation in Ghana: Challenges and Opportunities; Center for Global Development: Washington, DC, USA, 2017. [Google Scholar]
  14. Ghana Ministry of Energy. National Electrification Scheme Master Plan Review (2011–2020); MoE: Accra, Ghana, 2010.
  15. Trama TecnoAmbiental. Final O&M Technical and Financial Report Submitted to the GEDAP Secretariat; Trama TecnoAmbiental: Barcelona, Spain, 2018. [Google Scholar]
  16. Arrow, K.; Solow, R.; Portney, P.R.; Leamer, E.E.; Radner, R.; Schuman, H. Report of the NOAA Panel on Contingent Valuation. Fed. Regist. 1993, 58, 4601–4614. [Google Scholar]
  17. Mitchell, R.C.; Carson, R.T. Evaluating the Validity of Contingent Valuation Studies; Venture Publishing: State College, PA, USA, 1988. [Google Scholar]
  18. Twerefou, D.K. Willingness to Pay for Improved Electricity Supply in Ghana. Mod. Econ. 2014, 5, 489–498. [Google Scholar] [CrossRef] [Green Version]
  19. Amoah, A. Estimating Demand for Utilities in Ghana: An Empirical Analysis; University of East Anglia: Norwich, UK, 2016. [Google Scholar]
  20. Buchanan, K.; Russo, R.; Anderson, B. The question of energy reduction: The problem(s) with feedback. Energy Policy 2015, 77, 89–96. [Google Scholar] [CrossRef] [Green Version]
  21. Burgess, J.; Nye, M. Re-materialising energy use through transparent monitoring systems. Energy Policy 2008, 36, 4454–4459. [Google Scholar] [CrossRef]
  22. Hargreaves, T.; Nye, M.; Burgess, J. Making energy visible: A qualitative field study of how householders interact with feedback from smart energy monitors. Energy Policy 2010, 38, 6111–6119. [Google Scholar] [CrossRef]
  23. Taale, F.; Kyeremeh, C. Households’ willingness to pay for reliable electricity services in Ghana. Renew. Sustain. Energy Rev. 2016, 62, 280–288. [Google Scholar] [CrossRef] [Green Version]
  24. Abdullah, S.; Jeanty, P.W. Willingness to pay for renewable energy: Evidence from a contingent valuation survey in Kenya. Renew. Sustain. Energy Rev. 2011, 15, 2974–2983. [Google Scholar] [CrossRef]
  25. Abdullah, S.; Mariel, P. Choice experiment study on the willingness to pay to improve electricity services. Energy Policy 2010, 38, 4570–4581. [Google Scholar] [CrossRef]
  26. Alam, M.; Bhattacharyya, S. Are the off-grid customers ready to pay for electricity from the decentralized renewable hybrid mini-grids? A study of willingness to pay in rural Bangladesh. Energy 2017, 139, 433–446. [Google Scholar] [CrossRef]
  27. Ayodele, T.; Ogunjuyigbe, A.; Ajayi, O.; Yusuff, A.; Mosetlhe, T. Willingness to pay for green electricity derived from renewable energy sources in Nigeria. Renew. Sustain. Energy Rev. 2021, 148, 111279. [Google Scholar] [CrossRef]
  28. Deutschmann, J.W.; Postepska, A.; Sarr, L. Measuring willingness to pay for reliable electricity: Evidence from Senegal. World Dev. 2021, 138, 105209. [Google Scholar] [CrossRef]
  29. Dogan, E.; Muhammad, I. Willingness to pay for renewable electricity: A contingent valuation study in Turkey. Electr. J. 2019, 32, 106677. [Google Scholar] [CrossRef]
  30. Du Preez, M.; Menzies, G.; Sale, M.; Hosking, S. Measuring the indirect costs associated with the establishment of a wind farm: An application of the contingent valuation method. J. Energy S. Afr. 2012, 23, 2–7. [Google Scholar] [CrossRef]
  31. Entele, B.R. Analysis of households’ willingness to pay for a renewable source of electricity service connection: Evidence from a double-bounded dichotomous choice survey in rural Ethiopia. Heliyon 2020, 6, e03332. [Google Scholar] [CrossRef]
  32. Graber, S.; Narayanan, T.; Alfaro, J.; Palit, D. Solar microgrids in rural India: Consumers’ willingness to pay for attributes of electricity. Energy Sustain. Dev. 2018, 42, 32–43. [Google Scholar] [CrossRef]
  33. Gunatilake, H.; Maddipati, N.; Patil, S. Willingness to Pay for Electricity Supply Improvements in Rural India. J. Resour. Energy Dev. 2013, 10, 55–78. [Google Scholar] [CrossRef]
  34. Harajli, H.; Chalak, A. Willingness to Pay for Energy Efficient Appliances: The Case of Lebanese Consumers. Sustainability 2019, 11, 5572. [Google Scholar] [CrossRef] [Green Version]
  35. Kim, J.-H.; Kim, S.-Y.; Yoo, S.-H. Public Acceptance of the “Renewable Energy 3020 Plan”: Evidence from a Contingent Valuation Study in South Korea. Sustainability 2020, 12, 3151. [Google Scholar] [CrossRef] [Green Version]
  36. Kim, J.-H.; Lim, K.-K.; Yoo, S.-H. Evaluating Residential Consumers’ Willingness to Pay to Avoid Power Outages in South Korea. Sustainability 2019, 11, 1258. [Google Scholar] [CrossRef] [Green Version]
  37. Oseni, M.O. Self-Generation and Households’ Willingness to Pay for Reliable Electricity Service in Nigeria. Energy J. 2017, 38, 165–194. [Google Scholar] [CrossRef]
  38. Scarpa, R.; Willis, K. Willingness-to-pay for renewable energy: Primary and discretionary choice of British households’ for micro-generation technologies. Energy Econ. 2010, 32, 129–136. [Google Scholar] [CrossRef]
  39. Zhang, L.; Wu, Y. Market segmentation and willingness to pay for green electricity among urban residents in China: The case of Jiangsu Province. Energy Policy 2012, 51, 514–523. [Google Scholar] [CrossRef]
  40. Cullen, R.; Hanley, N.; Spash, C.L. Cost-Benefit Analysis and the Environment; Edward Elgar Publishing Limited: Hants, UK, 1993. [Google Scholar]
  41. Spash, C.L. The Contingent Valuation Method: Retrospect and Prospect; CSIRO Sustainable Ecosystems: Canberra, Australia, 2008. [Google Scholar]
  42. Boyle, K.J.; Bishop, R.C. Welfare Measurements Using Contingent Valuation: A Comparison of Techniques. Am. J. Agric. Econ. 1988, 70, 20–28. [Google Scholar] [CrossRef]
  43. Whitehead, J.C.; Huang, J.-C.; Blomquist, G.C.; Ready, R.C. Construct Validity of Dichotomous and Polychotomous Choice Contingent Valuation Questions. Environ. Resour. Econ. 1998, 11, 107–116. [Google Scholar] [CrossRef]
  44. Rietbergen-McCracken, J.; Abaza, H. Environmental Valuation: A Worldwide Compendium of Case Studies; Earthscan: London, UK, 2000. [Google Scholar]
  45. Hanemann, M.; Loomis, J.; Kanninen, B. Statistical Efficiency of Double-Bounded Dichotomous Choice Contingent Valuation. Am. J. Agric. Econ. 1991, 73, 1255–1263. [Google Scholar] [CrossRef]
  46. Scarpa, R.; Bateman, I. Efficiency Gains Afforded by Improved Bid Design versus Follow-up Valuation Questions in Discrete-Choice CV Studies. Land Econ. 2000, 76, 299. [Google Scholar] [CrossRef]
  47. Carson, R.T.; Groves, T. Incentive and informational properties of preference questions. Environ. Resour. Econ. 2007, 37, 181–210. [Google Scholar] [CrossRef]
  48. Carlsson, F.; Martinsson, P. Does it matter when a power outage occurs?—A choice experiment study on the willingness to pay to avoid power outages. Energy Econ. 2008, 30, 1232–1245. [Google Scholar] [CrossRef] [Green Version]
  49. Diamond, P.A.; Hausman, J.A. On contingent valuation measurement of nonuse values. In Health Econometrics; Emerald Publishing Limited: Bentley, UK, 1993; Volume 220, pp. 3–38. [Google Scholar]
  50. Diamond, P.A.; Hausman, J.A. Contingent Valuation: Is Some Number Better than No Number? J. Econ. Perspect. 1994, 8, 45–64. [Google Scholar] [CrossRef]
  51. Milgrom, P. Is sympathy an economic value? Philosophy, economics, and the contingent valuation method. In Contributions to Economic Analysis; Elsevier BV: Amsterdam, The Netherlands, 1993; pp. 417–441. [Google Scholar]
  52. Mcfadden, D.; Leonard, G.K. Issues in the contingent valuation of environmental goods: Methodologies for data collection and analysis. In Contributions to Economic Analysis; Elsevier BV: Amsterdam, The Netherlands, 1993; pp. 165–215. [Google Scholar]
  53. Hanemann, W.M. Willingness To Pay and Willingness To Accept: How Much Can They Differ? Reply. Am. Econ. Rev. 2003, 93, 464. [Google Scholar] [CrossRef]
  54. Hausman, J. Contingent Valuation: From Dubious to Hopeless. J. Econ. Perspect. 2012, 26, 43–56. [Google Scholar] [CrossRef] [Green Version]
  55. Carson, R. Contingent Valuation: A Practical Alternative when Prices Aren’t Available. J. Econ. Perspect. 2012, 26, 27–42. [Google Scholar] [CrossRef] [Green Version]
  56. Haab, T.C.; Interis, M.G.; Petrolia, D.R.; Whitehead, J.C. From Hopeless to Curious? Thoughts on Hausman’s “Dubious to Hopeless” Critique of Contingent Valuation. Appl. Econ. Perspect. Policy 2013, 35, 593–612. [Google Scholar] [CrossRef] [Green Version]
  57. Kling, C.L.; List, J.A.; Zhao, J. A dynamic explanation of the willingness to pay and willingness to accept disparity. Econ. Inq. 2011, 51, 909–921. [Google Scholar] [CrossRef]
  58. Rowe, R.D.; D’Arge, R.C.; Brookshire, D.S. An experiment on the economic value of visibility. J. Environ. Econ. Manag. 1980, 7, 1–19. [Google Scholar] [CrossRef]
  59. Morey, E.R.; Shaw, W.; Rowe, R.D. A discrete-choice model of recreational participation, site choice, and activity valuation when complete trip data are not available. J. Environ. Econ. Manag. 1991, 20, 181–201. [Google Scholar] [CrossRef]
  60. Lopez-Feldman, A. Introduction to Contingent Valuation Using Stata. 2012. Available online: https://mpra.ub.uni-muenchen.de/41018/2/intro_CV.pdf (accessed on 29 August 2021).
  61. Bateman, I.J.; Carson, R.T.; Day, B.; Hanemann, M.; Hanley, N.; Hett, T.; Jones-Lee, M.; Loomes, G.; Mourato, S.; Özdemiroglu, E.; et al. Economic Valuation with Stated Preference Techniques: A Manual. Ecol. Econ. 2004, 50, 155–156. [Google Scholar] [CrossRef]
  62. Ghana Statistical Service. Ghana Living Standards Survey Report of the 6th Round. 2014. Available online: https://www2.statsghana.gov.gh/publications.html (accessed on 18 August 2021).
  63. Kateregga, E. The Welfare Costs of Electricity Outages: A Contingent Valuation Analysis of Households in the Suburbs of Kampala, Jinja and Entebbe. J. Dev. Agric. Econ. 2009, 1, 1–11. [Google Scholar]
  64. Ito, N.; Takeuchi, K.; Tsuge, T.; Kishimoto, A. Applying threshold models to donations to a green electricity fund. Energy Policy 2010, 38, 1819–1825. [Google Scholar] [CrossRef]
  65. Otegbulu, A.C. A contingent valuation model for assessing electricity demand. J. Financ. Manag. Prop. Constr. 2011, 16, 126–146. [Google Scholar] [CrossRef]
  66. Lay, J.; Ondraczek, J.; Stoever, J. Renewables in the energy transition: Evidence on solar home systems and lighting fuel choice in Kenya. Energy Econ. 2013, 40, 350–359. [Google Scholar] [CrossRef] [Green Version]
  67. Zarnikau, J. Consumer demand for ‘green power’ and energy efficiency. Energy Policy 2003, 31, 1661–1672. [Google Scholar] [CrossRef]
  68. Whittington, D.; Lauria, D.T.; Mu, X. A study of water vending and willingness to pay for water in Onitsha, Nigeria. World Dev. 1991, 19, 179–198. [Google Scholar] [CrossRef]
  69. Energy Sector Management Assistance Program (ESMAP). Mini Grids for Timely and Low-Cost Electrification in Ghana: Exploring Regulatory and Business Models for Electrifying the Lake Volta Region; World Bank: Washington, DC, USA, 2017. [Google Scholar]
Figure 1. Elicitation of willingness to pay in the survey (b0 = starting bid, bl = lower bid, bu = upper bid). Source: Authors.
Sustainability 13 11711 g001
Figure 2. Comparison of WTP estimates from the three methods (25th, 50th, and 75th percentile WTP estimates with respective 95% confidence intervals). Source: Authors.
Sustainability 13 11711 g002
Table 1. Pricing of electricity in Ghana: Uniform National Tariff versus Cost-Reflective Tariffs.
Tariff ProfileEDA 1 (Wh/Day)Power (kW)Uniform National Tariff (GHC 2/Month)Cost-Reflective Tariff 3—Only Operation and Maintenance (GHC/Month)
T012750.54.2010.00
T115500.56.9020.00
T2111000.512.4040.20
T3116500.517.8060.20
T422200133.6080.30
T5327501.544.70100.40
1 Energy Daily Allowance (amount of energy per day allotted to a household per their tariff profile or category). 2 GHC = Ghana Cedi (Ghanaian currency), GHC 1 = USD 0.17 as of August 2021. 3 Given that the initial capital cost was fully funded by a grant, the cost-reflective tariff is estimated to be the minimum reference tariff that yields a positive Net Present Value (NPV > 0). The minimum reference tariff was estimated to be around 0.23 USD/kWh. This tariff will generate sufficient revenues on an annual basis to cover replacement cost of components (batteries) as well as operation and maintenance expense. Source: Data from KITE report [10].
Table 2. Summary of relevant literature.
Author (s)CountryGood/Service ValuedStudy MethodEconometric Estimation Method
1Twerefou [18]GhanaImproved electricityCV:WTPordered probit
2Taale and Kyeremeh [23]GhanaReliable electricityCV:WTPtobit
3Abdullah and Jeanty [24]KenyaRenewable energy for rural electrificationCV:WTPparametric/non-parametric models
4Abdullah and Mariel [25]KenyaElectricity servicesChoice modelingmixed logit
5Alam and Bhattacharyya [26]BangladeshRenewable minigrid electricityCV: WTPlogit, OLS
6Ayodele et al. [27]NigeriaRenewable energy minigrid/Renewable electricityCV:WTPANOVA test
7Deutschmann et al. [28]SenegalReliable electricityCV:WTPprobit, OLS
8Dogan and Muhammad [29]TurkeyRenewable electricityCV:WTPtobit/probit/logit
9du Preez et al. [30]South AfricaWind farmCV:WTAlogit
10Entele [31]EthiopiaSolar PV vs. Grid electricityCV:WTPprobit
11Graber et al. [32]IndiaSolar microgridsChoice modelingmixed logit
12Gunatilake et al. [33]India24 h electricity supplyCV:WTPprobit, OLS
13Harajli and Chalak [34]LebanonEnergy efficient appliancesCV:WTPmultivariate tobit
14Kim et al. [35]South KoreaRenewable electricityCV:WTPspike model
15Kim et al. [36]South KoreaReliable electricityCV:WTPspike model
16Oseni [37]NigeriaReliable electricityCV:WTPdouble-bounded (interval) model
17Scarpa and Willis [38]United KingdomRenewable electricityChoice modelingmultinomial logit
18Zhang and Wu [39]ChinaGreen electricityCV:WTPmultinomial logit
Note: CV—contingent valuation, WTP—willingness to pay, WTA—willingness to accept, OLS—ordinary least squares. Source: Authors.
Table 3. List of communities and number of households interviewed per community.
Study CommunityRegionNumber of Clusters in the CommunityNumber of Households Interviewed
PediatorkopeGreater Accra1049
AtigagomeBrong-Ahafo725
AglakopeVolta546
WayokopeBrong-Ahafo317
KudorkopeVolta463
Total 29200
Source: Authors.
Table 4. Descriptive statistics of variables used in the WTP model.
VariableClassificationExpected SignObs.MeanStd. Dev.MinMax
Maximum WTP (GHC)Continuous 20029.796.2841550
First bid response (Yes = 1; No = 0)Dummy 2000.650.47801
Second bid response (Yes = 1; No = 0)Dummy 2000.500.50101
Electricity bill (GHC)Continuous+20014.917.355745
Starting bid (GHC)Discrete+20026.808.2371540
Monthly discretionary income (GHC)Continuous+200322.65105.74795705
Marital status (Married = 1; Otherwise = 0)Dummy+2000.630.48401
Gender (Male = 1, Female = 0)Dummy+2000.700.46201
Use of electricity for all activities (No = 1; Yes = 0)Dummy+2000.590.49301
Household sizeContinuous+2006.613.346118
No educationDummy2000.1250.33101
Basic educationDummy2000.610.49001
SecondaryDummy+2000.200.40101
TertiaryDummy+2000.070.25501
Source: Authors.
Table 5. Estimation results for the maximum willingness to pay.
Explanatory VariablesOLS ModelDouble-Bounded (Interval) Model
Starting bid (Log)−0.038−0.170 **
−0.027−0.067
Household monthly income (Log)0.463 ***0.572 ***
−0.045−0.055
Electricity bill (Log)−0.010−0.009
−0.021−0.03
Respondent marital status (Married = 1)0.063 ***0.037
−0.021−0.028
Respondent gender (Male = 1)−0.0090.003
−0.018−0.028
Use of electricity for all activities (No = 1)0.060 ***0.071 **
−0.021−0.028
Household size0.007 ***0.007 *
−0.003−0.004
Respondent education level, basic = 10.036−0.002
−0.024−0.043
Respondent education level, secondary = 10.047 *0.001
−0.027−0.048
Respondent education level, tertiary = 1−0.006−0.012
−0.04−0.059
Constant0.752 ***0.663 **
−0.249−0.274
Community dummiesYesYes
Observations200200
Expected Mean29.1431.21
R-squared0.713
F-test26.13 ***
Wald chi2(14) 195.01 ***
Note: Robust standard errors in parentheses. *** p < 0.01, ** p < 0.05, * p < 0.1. Source: Authors.
Table 6. Mean WTP from the OLS estimation.
SampleObservationsMean Stated WTPMean IncomeEstimated Mean WTP
Full sample20029.79
(6.35)
[28.90–30.68]
322.65
(105.75)
29.14
(1.24)
[28.97–29.31]
Sub-sample 1
(Tariff level T11 = GHC 7)
3729.81
(5.89)
[27.84–31.77]
328.40
(111.98)
28.25
(1.21)
[27.50–29.02]
Sub-sample 2
(Tariff level T21 = GHC 12.4)
9029.25
(6.5)
[27.88–30.61]
311.78
(111.38)
28.55
(1.24)
[28.29–28.81]
Sub-sample 3
(Tariff level T31 = GHC 17.8)
5530.76
(5.67)
[29.23–32.29]
335.65
(89.30)
29.96
(1.21)
[26.63–30.28]
Note: Standard deviation in parentheses, 95% confidence intervals in square brackets. Source: Authors.
Publisher’s Note: MDPI stays neutral with regard to jurisdictional claims in published maps and institutional affiliations.

