Abstract
This study investigated seasonal variation, spatial distribution, sources, composition and potential ecological risks of 16 polycyclic aromatic hydrocarbons (PAHs) in Red Sea coastal water. Surface seawater samples were collected at fourteen different locations. The sum of 16 PAHs concentrations in Red Sea showed clear variation between seasons, ranged from 1.08–6.10, 0.79–50.86, 1.37–54.47 and 0.21–7.18 μg/L in summer, autumn, winter, and spring respectively. PAHs levels in Red Sea coastal waters were relatively high at certain sites during autumn and winter seasons. They could be classified as highly polluted by PAHs contaminants (>10 μg/L). According to the diagnostic ratios measured, the majority of PAHs in this study originated from pyrogenic sources, while minor amounts originated from petrogenic sources. Four rings PAHs accounted for more than 64% of the total PAHs studied. PAHs pose a high ecological risk along the period of study, according to the ecological risk assessment by Risk quotients (RQNCs and RQMPCs).
1. Introduction
The Red Sea’s coastal and marine resources contribute to Egypt’s food, energy, oil (exploration and production), and tourism industry. In recent years, the quality and protection of natural ecosystems has become a major concern, especially in the coastal and marine areas, where growing population and anthropogenic activities have put a stress on a wide range of natural systems [1,2]. Tourism, shipping activities, oil extraction, harbours, and fishing practices are all examples of environmental threats to the Red Sea ecosystem [3,4,5,6].
A group of over 100 compounds with fused benzene rings is known as polycyclic aromatic hydrocarbons (PAHs) [7]. PAHs are contained in soot, smoke, boat shipping activities and exhausts generated by incomplete combustion of organic compounds such as petroleum [8]. PAHs are toxic, mutagenic, and carcinogenic. PAHs are considered as persistent organic pollutants (POPs) found in ecosystems, including coastal waters [9].
PAHs pollution in the aquatic ecosystem can be traced back to three different sources: pyrogenic, petrogenic, and diagenetic. High molecular weight PAHs dominate pyrogenic PAHs, as a result of incomplete combustion of organic material. Petrogenic PAHs are homologue series of PAHs that are found in petroleum products (e.g., refined and crude oil). Biogenic PAHs are formed in marine sediments at early stages of diagenesis or biological processes (e.g., perylene) [10,11,12]. PAHs are environmentally dangerous compounds especially those with 2–7 benzene rings. Based on their physical, chemical, and biological characteristics, PAHs are divided into two classes [13]. Low molecular weight (LMW) PAHs (e.g., naphthalene, phenanthrene, anthracene and fluorine) that cause acute toxicity in aquatic species. High molecular weight (HMW) PAHs (e.g., chrysene and coronene). Despite the fact that they do not cause acute toxicity, they are considered carcinogenic [14]. Due to their toxic, mutagenic, and carcinogenic properties, sixteen PAHs have been designated as priority organic contaminants [15]. In aquatic organisms, PAHs toxicity is determined by their metabolism and photochemical transformation. These metabolites are usually more harmful than the parent compounds. Some of PAHs may be accumulate in food chains, especially fish and shellfish marked by much higher concentrations compared to the surrounding environment [16].
Seasonal climate factors such as wind direction, as well as anthropogenic factors with seasonal variability—the hot seasons and the intensity of seawater and shipping activities—can influence the PAHs content and composition in the coastal water environment. However, in order to complete the picture of PAHs distribution in the area of study and moreover the seasonal changes of this distribution, it is necessary to take into account the spatio-temporal dynamics of PAHs in the aquatic environment. Because of the impact of anthropogenic pollution on marine ecosystems, it is critical to understand and evaluate the threat posed by human activities on the Red Sea environmental pollution [17,18,19]. Currently, there is limited research available about PAHs pollution in this area. Therefore, the current research focuses on the spatial and temporal distribution, risk assessment, and sources of PAHs along the Egyptian Red Sea coastal water. The origins of the investigated compounds were determined using diagnostic ratios. The findings of this research will serve as useful baseline data for PAHs contamination in the area of study.
2. Materials and Methods
2.1. Locations of Sampling
Seawater samples were collected seasonally from 14 sites along the Red Sea coast of Egypt during January, May, August, and November 2015 as described in Figure 1. Location of the stations was determined by the global positioning system (GPS) presented in Table 1. To determine the effect of various pollution sources on the study area, coastal sites near potential pollution sources, harbours, marinas, shipyards, and shipping activities were chosen. Surface seawater samples (0–0.2 m) were collected manually in 1L brown glass bottles (methanol and hexane were used to wash it several times). To protect the samples from bacterial activity during transportation and storage, they were acidified to a pH of ≈ 2.0 by adding a few drops of %10 HCL. The samples were kept at 4 °C until analysis.
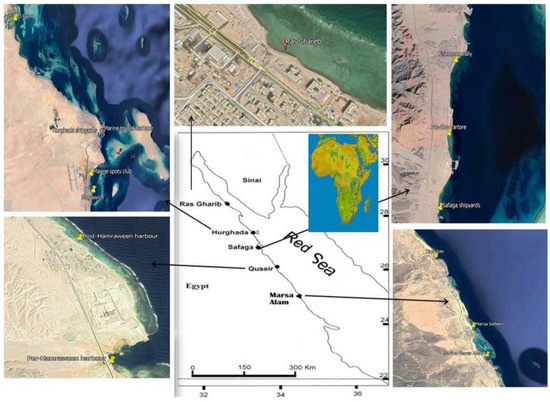
Figure 1.
Locations of sampling points.

Table 1.
Location of sampling stations.
2.2. Chemicals
PAHs mixture standard (>99%) were purchased from Accustandard (New Haven, CT, USA). The solvents of hexane, methanol and dichloromethane were used for the extraction of hydrocarbons ≥ 99.9% purity, HPLC grade, Fisher Scientific Company (Hampton, NH, USA), Merck (Darmstadt, Germany) and Fluka (Buchs, Switzerland) respectively. Other chemicals were purchased from Kanto Chemical co. (Tokyo, Japan) and Merck (Darmstadt, Germany) and were of analytical grade. Na2SO4 (analytical grade) was additionally activated before use at 400 °C for 6 h and then stored in sealed containers. SiO2 and Al2O3 were activated at 200 °C prior to use for 4 h. After that, 5% deionized water was added to partially deactivated.
2.3. Preparation and Extraction of Samples
Prior to extraction, surface seawater samples were filtered with a glass fiber filter (0.45 μm, Millipore, Burlington, MA, USA). The extraction of PAHs was carried out in accordance with method described by Parsons et al. 1984 [20]. Extracts was measured using gas chromatography–mass spectrometry (GC–MS, Shimadzu QP2010 ultra) technique.
2.4. Quality Control and Assurance
Quality control procedures were applied to all data. External standards were used to quantify PAHs, with calibration curves with correlation coefficients both exceeding 0.992. PAHs mixture standard (purity > 99%) were purchased from Accustandard (USA), which included naphthalene (Naph), acenaphthylene (Acthy), acenaphthene (Ace), fluorene (F), phenanthrene (Phe), anthracene (Ant), fluoranthene (Flu), pyrene (Pyr), benzo(a)anthracene (BaA), chrysene (Chr), benzo(b)fluoranthene (BbF), benzo(k)fluoranthene (BkF), dibenzo(a, h)anthracene (DahA), benzo(a)pyrene (BaP), indeno(1,2,3-cd)pyrene (IP), and benzo(g, h, i) perylene (BP). The recovery of the 16 PAHs ranged from 70 to 111% on average, with most (RSD) values less than 16%. Individual PAHs have an instrumental limit of detection (LOD) of 3*S, where S is the standard deviation of eight replicate tests of spiked seawater samples [21].
After every five samples, procedural blanks were tested; no interferences were found in the blanks. Blank experiments were performed and used for the calculation of LODs. The detection limits ranged from 0.01 μg/L to 0.03 μg/L which includes 0.01 μg/L for naphthalene, acenaphthylene, fluorene, anthracene, fluoranthene and phenanthrene, 0.02 μg/L for acenaphthene, benzo[a]anthracene, and benzo[k] fluoranthene, and benzo[a]pyrene, and 0.03 μg/L for benzo[b]fluoranthene, pyrene, indeno[1,2,3-cd]pyrene, Chrysene, benzo[ghi]perylene, and dibenzo[a,h]anthracene.
2.5. Statistical Analysis
The findings were statistically analyzed using the SPSS 25 statistical package. The results of total PAHs in different sites and seasons are non—parametric because they were not normally distributed and non-homogeneous (p < 0.05). Therefore, Kruskal-Wallis one-way ANOVA on ranks (where normality test failed) and Mann- Whitney U test post hoc are used to assess statistical significance of differences. The Kolmogorov–Smirnov (K–S) and Levene–Smirnov (L–S) tests were used to determine normality and equal variance respectively.
3. Results and Discussion
3.1. Total PAHs Seasonal Variations and Patterns of Distribution
The total PAHs (∑PAHs) concentrations in surface seawater of the study area differ significantly in hot seasons (summer and spring seasons) from cool seasons (winter and autumn seasons). The levels of ∑PAHs in the summer season varied from 1.08 μg/L at station 11 to 6.10 μg/L at station 4 with mean value of 3.16 μg/L ‘Table 2’. While in autumn season, concentrations of ∑PAHs ranged from 0.79 μg/L at station 10 to 50.86 μg/L at station 8 with mean value 7.32 μg/L. Whereas in winter season, concentrations of ∑PAHs ranged from 1.37 μg/L at station 14 to 54.47 μg/L at station 13 with mean value 20.88 μg/L. The concentrations of ∑PAHs in the spring season ranged from 0.21 μg/L at station 4 to 7.18 μg/L at station 7 with mean value 2.12 μg/L (Figure 2).
Table 2.
Individual PAHs concentrations (µg/L) in seawater samples obtained from the Red Sea coast.
Table 2.
Individual PAHs concentrations (µg/L) in seawater samples obtained from the Red Sea coast.
| PAHs | Range | |||
|---|---|---|---|---|
| Summer (21 August) | Autumn (21 August) | Winter (21 January) | Spring (21 May) | |
| Naph | 0.06–0.14 | 0.04–0.14 | 0.05–0.25 | ND–0.13 |
| Acthy | ND | ND–0.03 | ND–0.06 | ND–0.01 |
| Ace | ND–0.05 | ND | ND–0.05 | ND–0.20 |
| F | ND | ND–0.06 | ND–0.14 | ND–0.09 |
| Phe | 0.06–0.46 | ND–0.12 | 0.04–4.72 | ND–0.12 |
| Ant | ND–0.06 | ND–0.05 | ND–4.17 | ND–0.05 |
| Flu | ND–2.34 | ND–22.72 | 0.15–14.93 | ND–0.64 |
| Pyr | 0.08–0.61 | ND–17.82 | ND–11.76 | ND–0.49 |
| BaA | 0.14–1.02 | 0.16–2.48 | 0.23–6.68 | ND–0.80 |
| Chr | 0.01–1.74 | 0.24–6.72 | 0.75–18.86 | ND–2.88 |
| BbF | ND–1.90 | ND–1.75 | ND–5.17 | ND–2.18 |
| BkF | ND–0.17 | ND–1.42 | ND–1.90 | ND |
| BaP | ND | ND–0.66 | ND–4.33 | ND |
| DahA | ND | ND | ND | ND |
| BP | ND | ND | ND | ND |
| IP | ND–1.70 | ND–2.62 | ND–5.38 | ND |
Naph = naphthalene, Acthy = acenaphthylene, Ace = acenaphthene, F = fluorene, Phe = phenanthrene, Ant = anthracene, Flu = fluoranthene, Pyr = pyrene, BaA= benzo[a]anthracene, Chr = chrysene, BbF = benzo[b]fluoranthene, BkF = benzo[k]fluoranthene, BaP = benzo[a]pyrene, DahA= dibenzo[a,h]anthracene, Bp = benzo [ghi] perylene, IP = indeno [1,2,3-cd] pyrene and N.D = not detection (under the limit of detection).
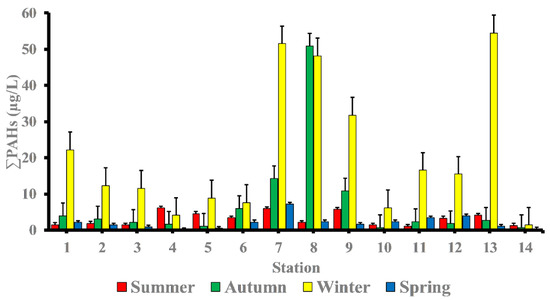
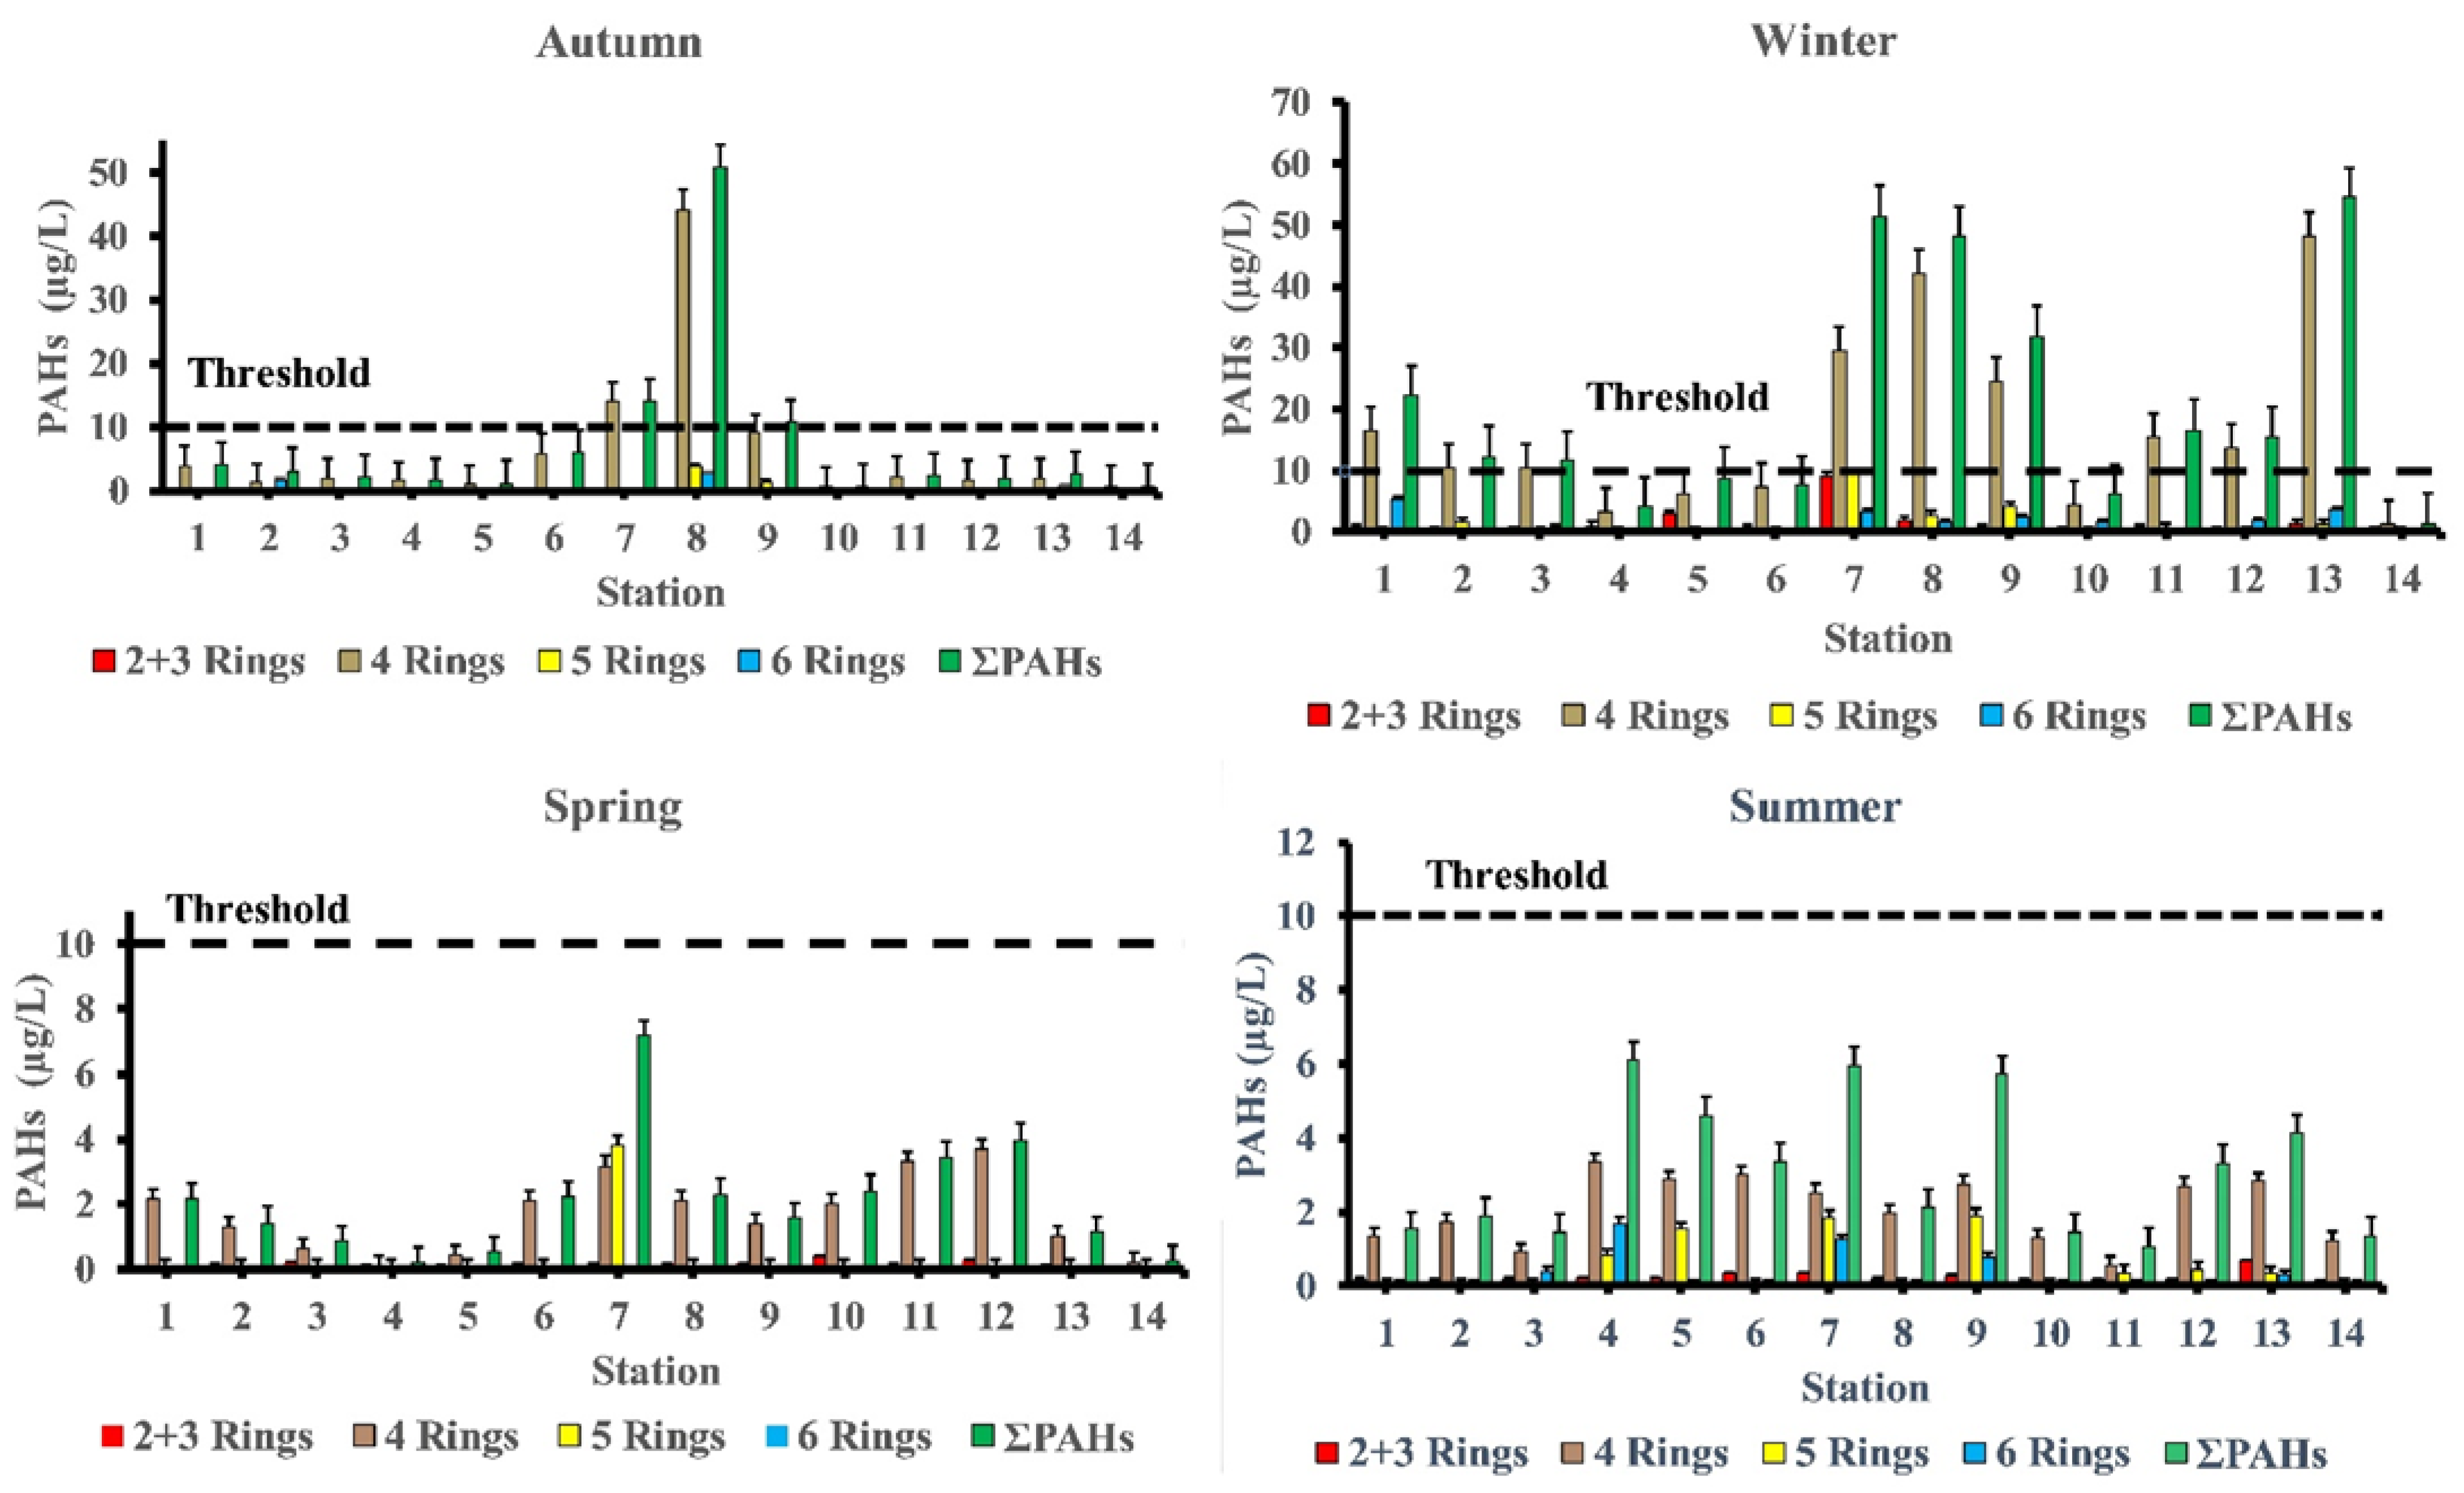
Figure 2.
Spatial and temporal variability of PAHs (µg/L) concentrations in the seawater of Red Sea coast.
Figure 2.
Spatial and temporal variability of PAHs (µg/L) concentrations in the seawater of Red Sea coast.
As shown at station 4, the summer season has a comparatively high percentage of PAHs (marine sport club, Hurghada) (6.10 μg/L). This site has popular jetties for tourists where boating activities are likely to contribute significantly to the ∑PAHs levels found in the area of study—particularly when there is a petroleum leak or sloppy engine oil disposal from boats and ferries. In addition, concentrations of PAHs in station 7 (Safaga shipyard) (5.97 μg/L) were in dockyards and where shipping maintenance work takes places, which could contribute to ∑PAHs in the seawater. During the autumn season, the level of PAHs was highest in station 8 (50.86 μg/L), followed by station 7 (14.19 μg/L), and station 9 (10.85 μg/L). These sites have intense shipping activities, which may contribute to PAHs in the seawater of the area of study.
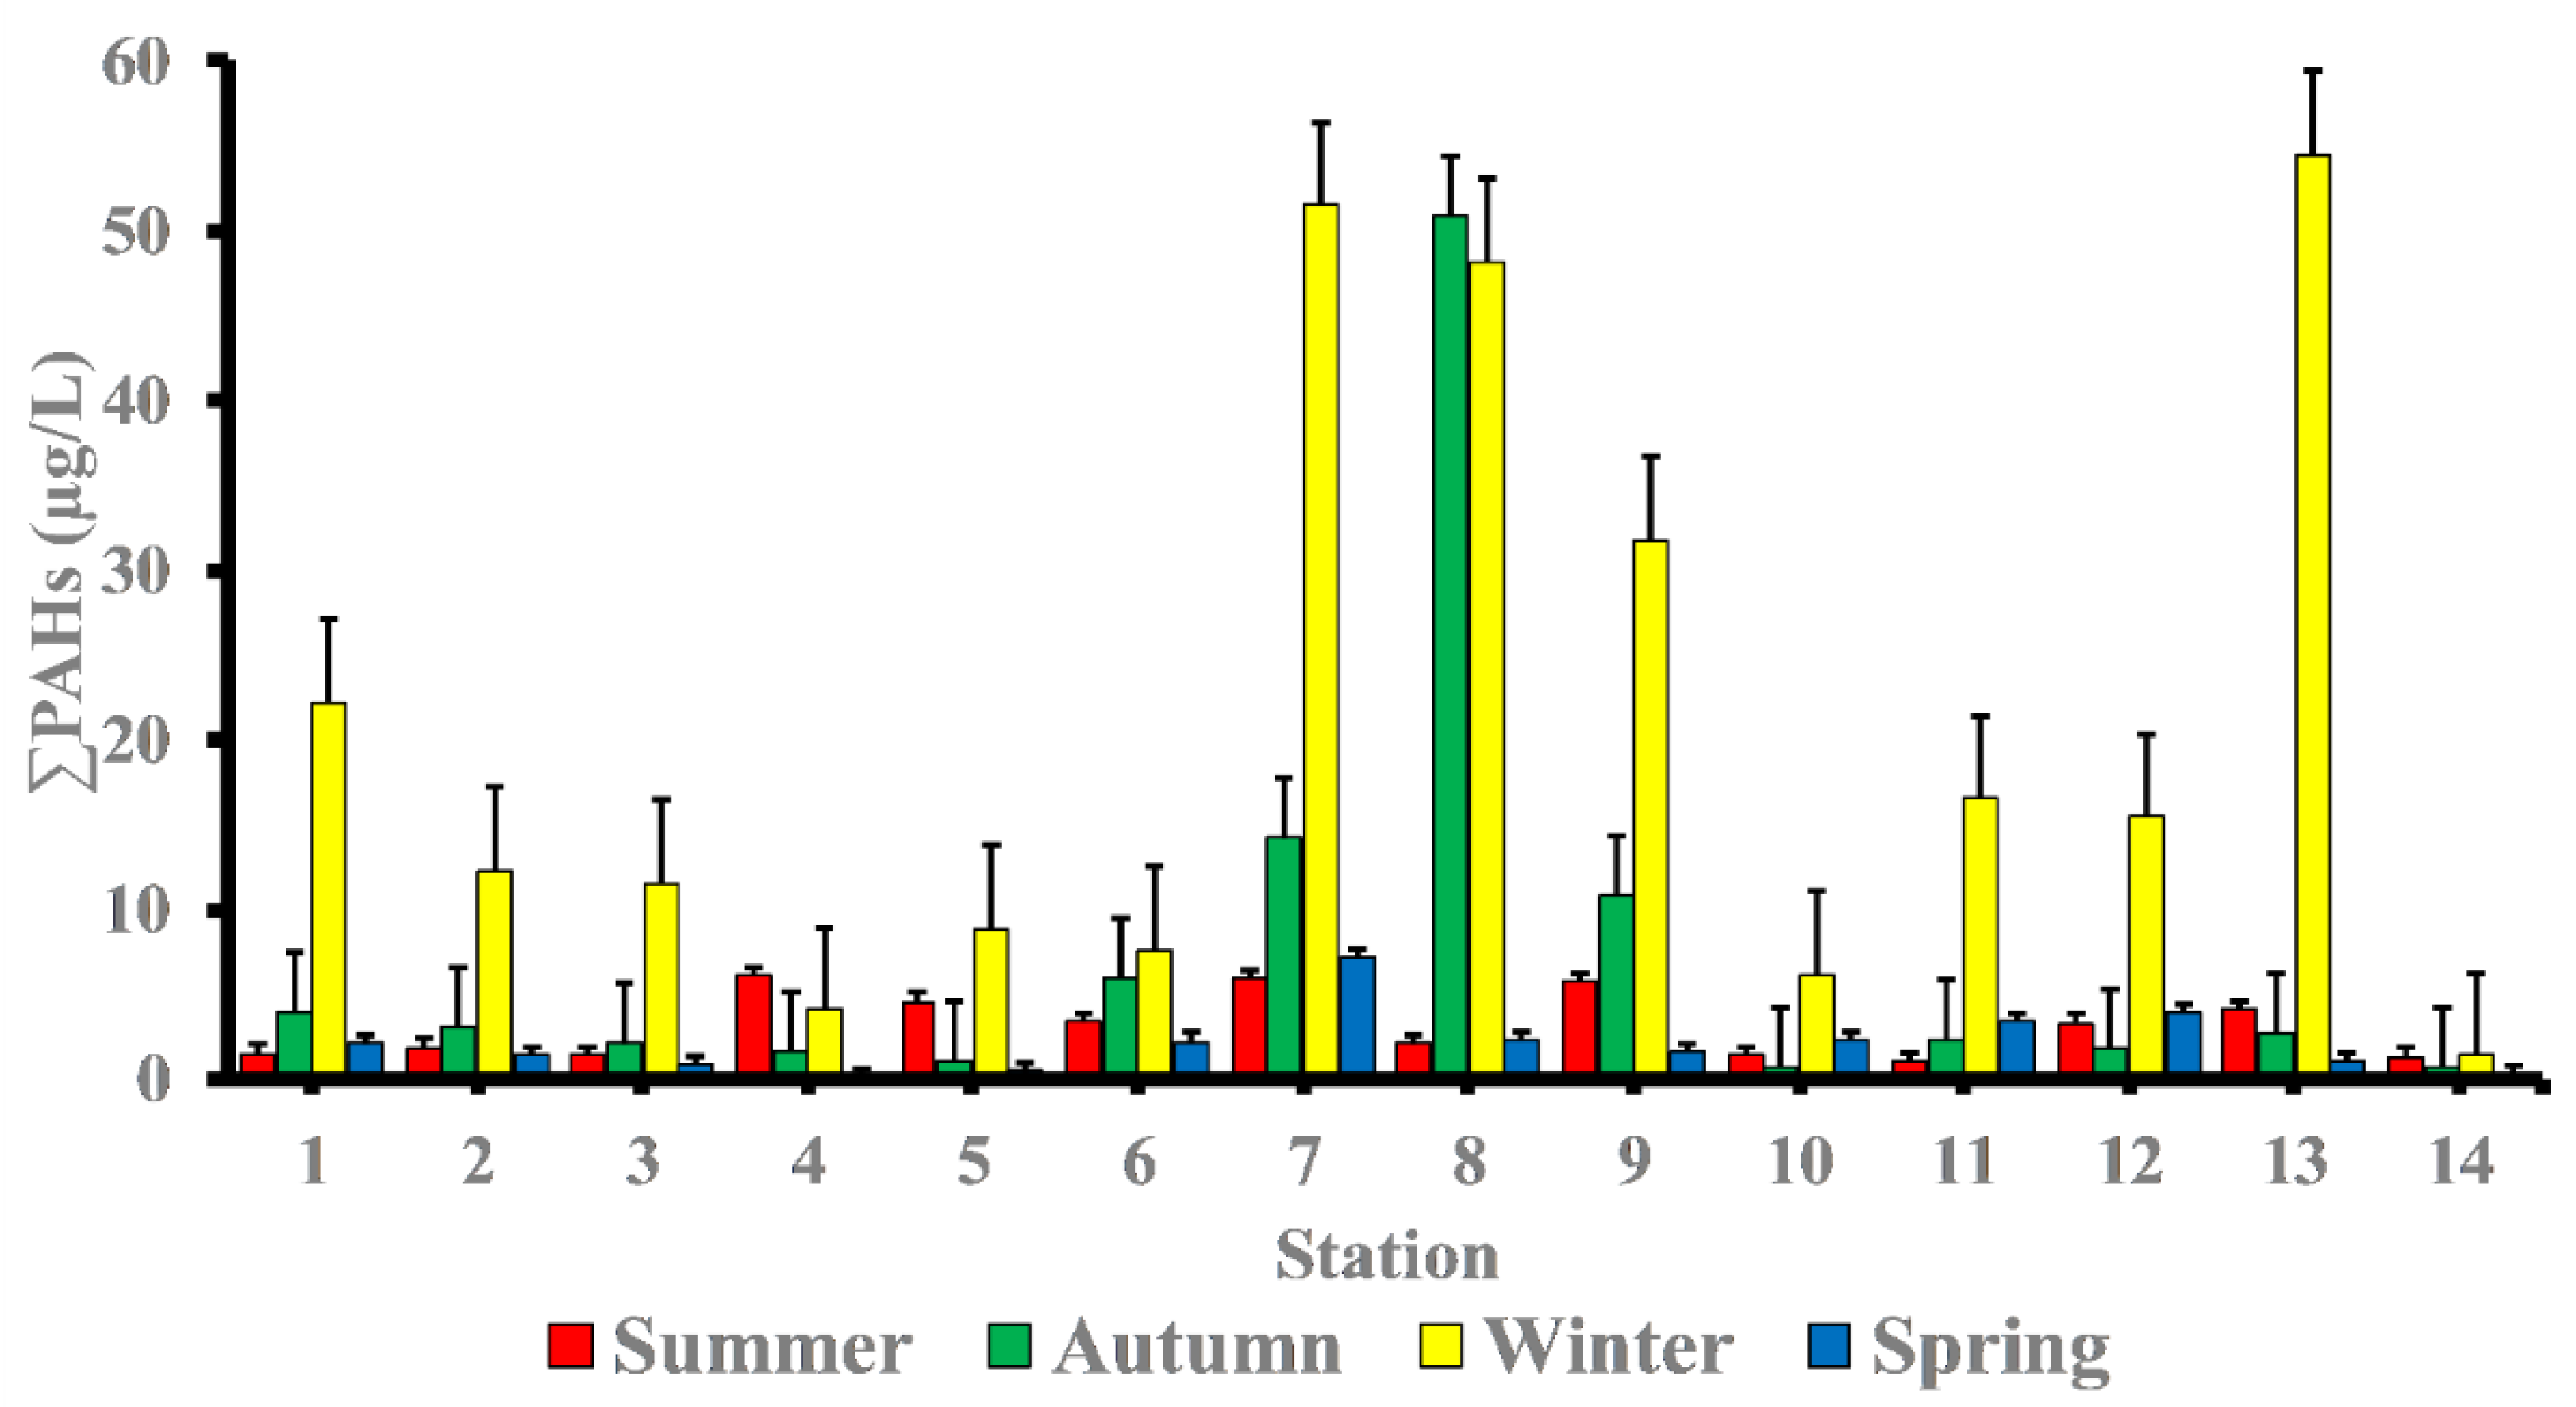
In the winter season, high concentrations of ∑PAHs were observed at station 13 (marina Marsa Alam) (54.47 μg/L) which is the main touristic port for Marsa Alam area, station 7 (Safaga shipyard) (51.52 μg/L), station 8 (adjacent to Abou Tartour harbour, Safaga) (48.18 μg/L), station 9 (fishermen valley, safaga) (31.82 μg/L) and station 1 (near oil company, Ras Gharieb) (22.20 μg/L). At station 7 (Safaga shipyard) (7.18 μg/L), a rather high concentration of PAHs in seawater was recorded throughout the spring season. Additionally, the total concentration of PAHs at stations (7, 8 and 9) during the autumn season and stations (1, 2, 3, 7, 8, 9, 11, 12 and 13) during the winter season were higher than the maximum permissible concentrations of 10 µg/L, indicating that certain species, especially fish, in these locations were likely exposed to PAHs during their lifetime. Our findings agreed with previous research indicating that PAH concentrations is generally related to seasonal variations, with lower PAH concentrations observed during the summer and higher concentrations observed during the winter [22,23]. References [23,24] observed that decreasing concentrations in the summer may be due to increased degradation caused by higher seawater temperatures, which influences the rate at which PAHs are degraded by microorganisms, or higher photo-oxidation. When the lower molecular weight PAHs are more than the larger molecular weight, PAHs do not have a very high acute toxicity to aquatic organisms [25]. By comparing our results with internationally permissible levels [26], we find that the total PAH levels at all stations are significantly higher than the European Union’s maximum allowable concentrations of 0.20 μg/L and the US Environmental Quality Criteria, ΣPAHs = 0.030 μg/L, for conservation of human aquatic life consumers [27,28]. Figure 3 shows the PAHs composition pattern by ring number. Four-ring PAHs (fluoranthene, pyrene, benzo(a)anthracene, and chrysene) are clearly the most abundant in most samples at various seasons of the year. Stations (7 and 8) in the autumn season and stations (1, 2, 7, 8, 9, 11, 12 and 13) in the winter season had four-ring PAHs concentrations that were higher than the maximum allowable concentrations10 μg/L. During the summer season, the most commonly detected PAHs in samples were Chrysene (31.56%), Benzo[a]anthracene (16%), Benzo[b]Fluoranthene (15.76%), Fluoranthene (12.18%), Indeno (1,2,3-c,d)pyrene (9.97%), Pyrene (6.17%), and Phenanthrene (4.24%). Whereas, in the autumn season the most frequently individual PAHs detected were Fluoranthene (28.73 %), Chrysene (26.17%), Pyrene (23.05%), and Indeno (1,2,3-c,d)pyrene. While, in the winter season the most frequently detected PAHs were Chrysene (38.51%), Fluoranthene (19.47%), Benzo[a]anthracene (11.13%), Pyrene (10.58%), Indeno(1,2,3-c,d) pyrene (7.01%), and Benzo[b]Fluoranthene (4.53%). Finally, in the spring season the most frequently individual PAHs detected were Chrysene (53.06%), Benzo[a]anthracene (10.95%), Pyrene (9.41%), Benzo[b]Fluoranthene (7.33%), Fluoranthene (6.04%), and Benzo[a]Pyrene (5.57%) ‘Table 3’.
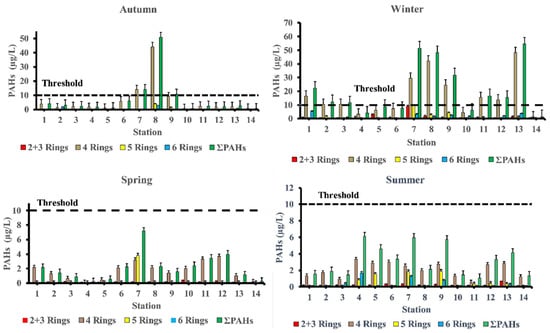
Figure 3.
Parent PAHs concentration and composition pattern in seawater of the area of study.
Table 3.
Individual PAHs concentrations (µg/L) and percentages (%) in different seasons.
The mean concentration of individual PAHs, including carcinogenic and noncarcinogenic PAHs, in all samples ranged from ND to 1.00 μg/L, ND to 2.68 μg/L, ND to 8.04 μg/L, and ND to 2.18 μg/L, over the summer, autumn, winter, and spring seasons, respectively. Individual PAHs levels are either within or beyond the European Water Framework Directive’s (WFD) Annual Average Environmental Quality Standards (AA-EQS), which indicate that the permissible range for PAHs is 0.002 to 2.4 µg/L [29].
The results obtained by using non- parametric Kruskal- Wallis’ test (K-W) were found no significant differences (p > 0.05) among stations studied, whereas significant differences (p < 0.01) were found among four seasons. The seasonal average concentrations of total PAHs were higher in winter and autumn seasons compared to the other seasons. By using Mann—Whitney U test post hoc for non- parametric results that exhibit significant difference between the winter season and (summer, autumn and spring season, respectively) with P value (0.000, 0.002 and 0.000, respectively), no significant difference was found between (spring and summer), (summer and autumn), and (autumn and spring) (p =0.178; p = 0.87; p = 0.125), respectively. Seasonal variation of TPAHs values for stations, represented in form of box-whisker plots Figure 4. In different seasons, the total PAHs concentrations in surface seawater of the study area were in the decreasing order as: winter > autumn > summer > spring (Figure 4).
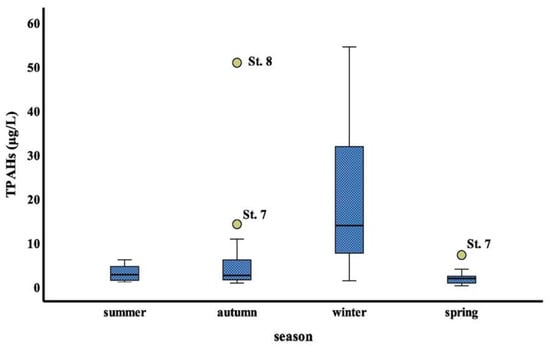
Figure 4.
Seasonal variations in PAHs in the study area’s surface seawater.
These concentrations are comparable to those observed in other parts of the world as shown in Table 4. Direct comparison of data in the literature regarding PAHs were somewhat difficult due to differences in the analytical methods, representative samples, yearly seasons, and detected PAH components. It was found that the mean total PAH concentrations observed in the current study were greater than those found in Alexandria coast, Egypt [30], Venice Lagoon, Italy [31], Dalian coast, China in winter and summer seasons [32], Suez Canal, Egypt in all seasons [33], Thane creek, India [34], Shandong coastal area, China [35], Persian Gulf, Iran [36], Pearl River estuary, China [37], and Gulf of Trieste, Northern Adriatica Slovenia [38] due to the increase of the coastal anthropogenic activities in the study area compared to these areas previously mentioned. Our results, on the other hand, were lower than those from Egypt’s Red Sea Coasts [39], Alexandria coast, Egypt [40], Suez Gulf, Egypt [25], Langkawi Island, Malaysia [41], and Coastal Area of Suez Gulf, Egypt [42].
Table 4.
PAHs content of seawater from various locations in selected countries worldwide.
3.2. Composition of PAHs
PAHs are usually found in complex mixtures rather than as individual compounds. Compounds with four or more rings that are generated by high-temperature combustion processes are known as high-molecular-weight PAHs (HMW-PAHs) [43,44]. Four rings of PAHs (FIu, Pyr, BaA, and Chr), five rings (BbF, BkF, BaP, and DahA), and six rings (IP, BP) were dominated by high-molecular-weight PAHs, representing the range of 83.54–96.43%, 79.81–99.72%, 67.95–98.53%, and 38.80–100% of the total values of PAHs in the summer, autumn, winter and spring seasons, respectively which are most likely the result of anthropogenic activities [45] including incomplete combustion of fuel in ships and vehicle engines ‘Table 5’. Whereas the concentration of the total fossil polycyclic aromatic hydrocarbons (ΣTFPAHs) or LMW-PAHs (low molecular weight PAHs) are comprised of two rings (Nap) and three rings (Ac, Ace, Ant, F, and Phe) ranging from 3.57–16.46%, 0.28–20.19%, 1.47–32.05% and zero–61.20% of the total PAHs concentrations, in the summer, autumn, winter, and spring season, respectively. The contamination pattern of PAHs was in the sequence of four rings > 2 + 3 rings > 6 rings > 5 rings of the 16 PAHs based on ring number detected in the autumn and winter season. Whilst, decreasing in the order as following: 4 rings > 5 rings > 2 + 3 rings > 6 rings and that 4 rings > 2 + 3 rings > 5 rings > 6 rings in the summer and spring, respectively. The most abundant 4-rings compounds of (Chr, BaA, Pyr, and FIu), were present in all seasons’ samples.
Table 5.
PAHs % distribution in surface seawater based on the number of aromatic rings throughout the Red Sea coast of Egypt.
The carcinogenicity of PAHs has been studied by scientists [4,46,47]. Benzo(a)pyrene, benzo(k)fluoranthene, benzo(a)anthracene, chrysene, benzo (g,h,i) perylene, benzo(b)fluoranthene, indeno (1,2,3-cd)pyrene and dibenzo(a,h)anthracene are the eight PAHs (Car-PAHs) that are commonly considered as potential carcinogens [47]. In our study the total concentration of potentially carcinogenic-PAHs (∑CARC) ranged from 0.57 to 5.36 μg/L, accounting for 17.01–89.78% of total PAHs in summer, from 0.54 to 10.19 μg/L (20.03–97.16% of total PAHs) in autumn, from 0.98 to 29.62 μg/L (28.35–97.01% of total PAHs) in winter and from 0.00 to 6.89 μg/L, accounting for 0.00–95.99% of total PAHs in spring season ‘Table 6’. The ∑CARC results greater than the EPA’s National Recommendations of Water Quality for the conservation of marine life and human health in various seasons [28].
Table 6.
Concentration of ΣPAHs, (ΣCOMP), (ΣCARC) and (ΣTFPAHs) in the area of study.
In the summer, autumn, winter, and spring seasons, benzo[a] anthracene (BaA), a potential carcinogenic pollutant, was found in all samples, with concentrations ranging from 0.41 to 1.02 μg/L (average of 0.5 μg/L), 0.16 to 2.48 μg/L (average of 0.71 μg/L), 0.23 to 6.68 μg/L (average of 2.32 μg/L) and ND to 0.8 μg/L (average of 0.27 μg/L), respectively. In different seasons, the mean level of BaA was greater than the EPA National Recommended Water Quality Criteria for the conservation of aquatic Life (0.010 μg/L), which could have an ecological impact in these areas [28].
The highest average level of individual PAHs measured in seawater samples was chrysene (1.00, 1.92, 8.04 and 1.31 μg/L) in the summer, autumn, winter and spring season, respectively. This high chrysene concentration may be due to its low water solubility, which allows it to be adsorbed onto particulate matter’s surface, and also its high resistance to degradation. Our findings agree with those of [48], who discovered that the amount of chrysene did not shift significantly after 12 years of oil spill, suggesting the chrysene is difficult to degrade by to the aquatic ecosystem than other compounds.
Fluoranthene and Benz(a)anthracene are two typical tetracyclic polycyclic aromatic hydrocarbons that are difficult to degrade [49]. In the summer and spring seasons, respectively, benzo[a]anthracene, which has the fingerprint of fossil fuels, was found to have the second highest mean concentration for individual PAHs (0.19 and 0.27 μg/L). During the autumn and winter seasons, fluoranthene (Flu) had the second highest mean concentration of individual PAHs (2.68 and 4.06 μg/L, respectively).
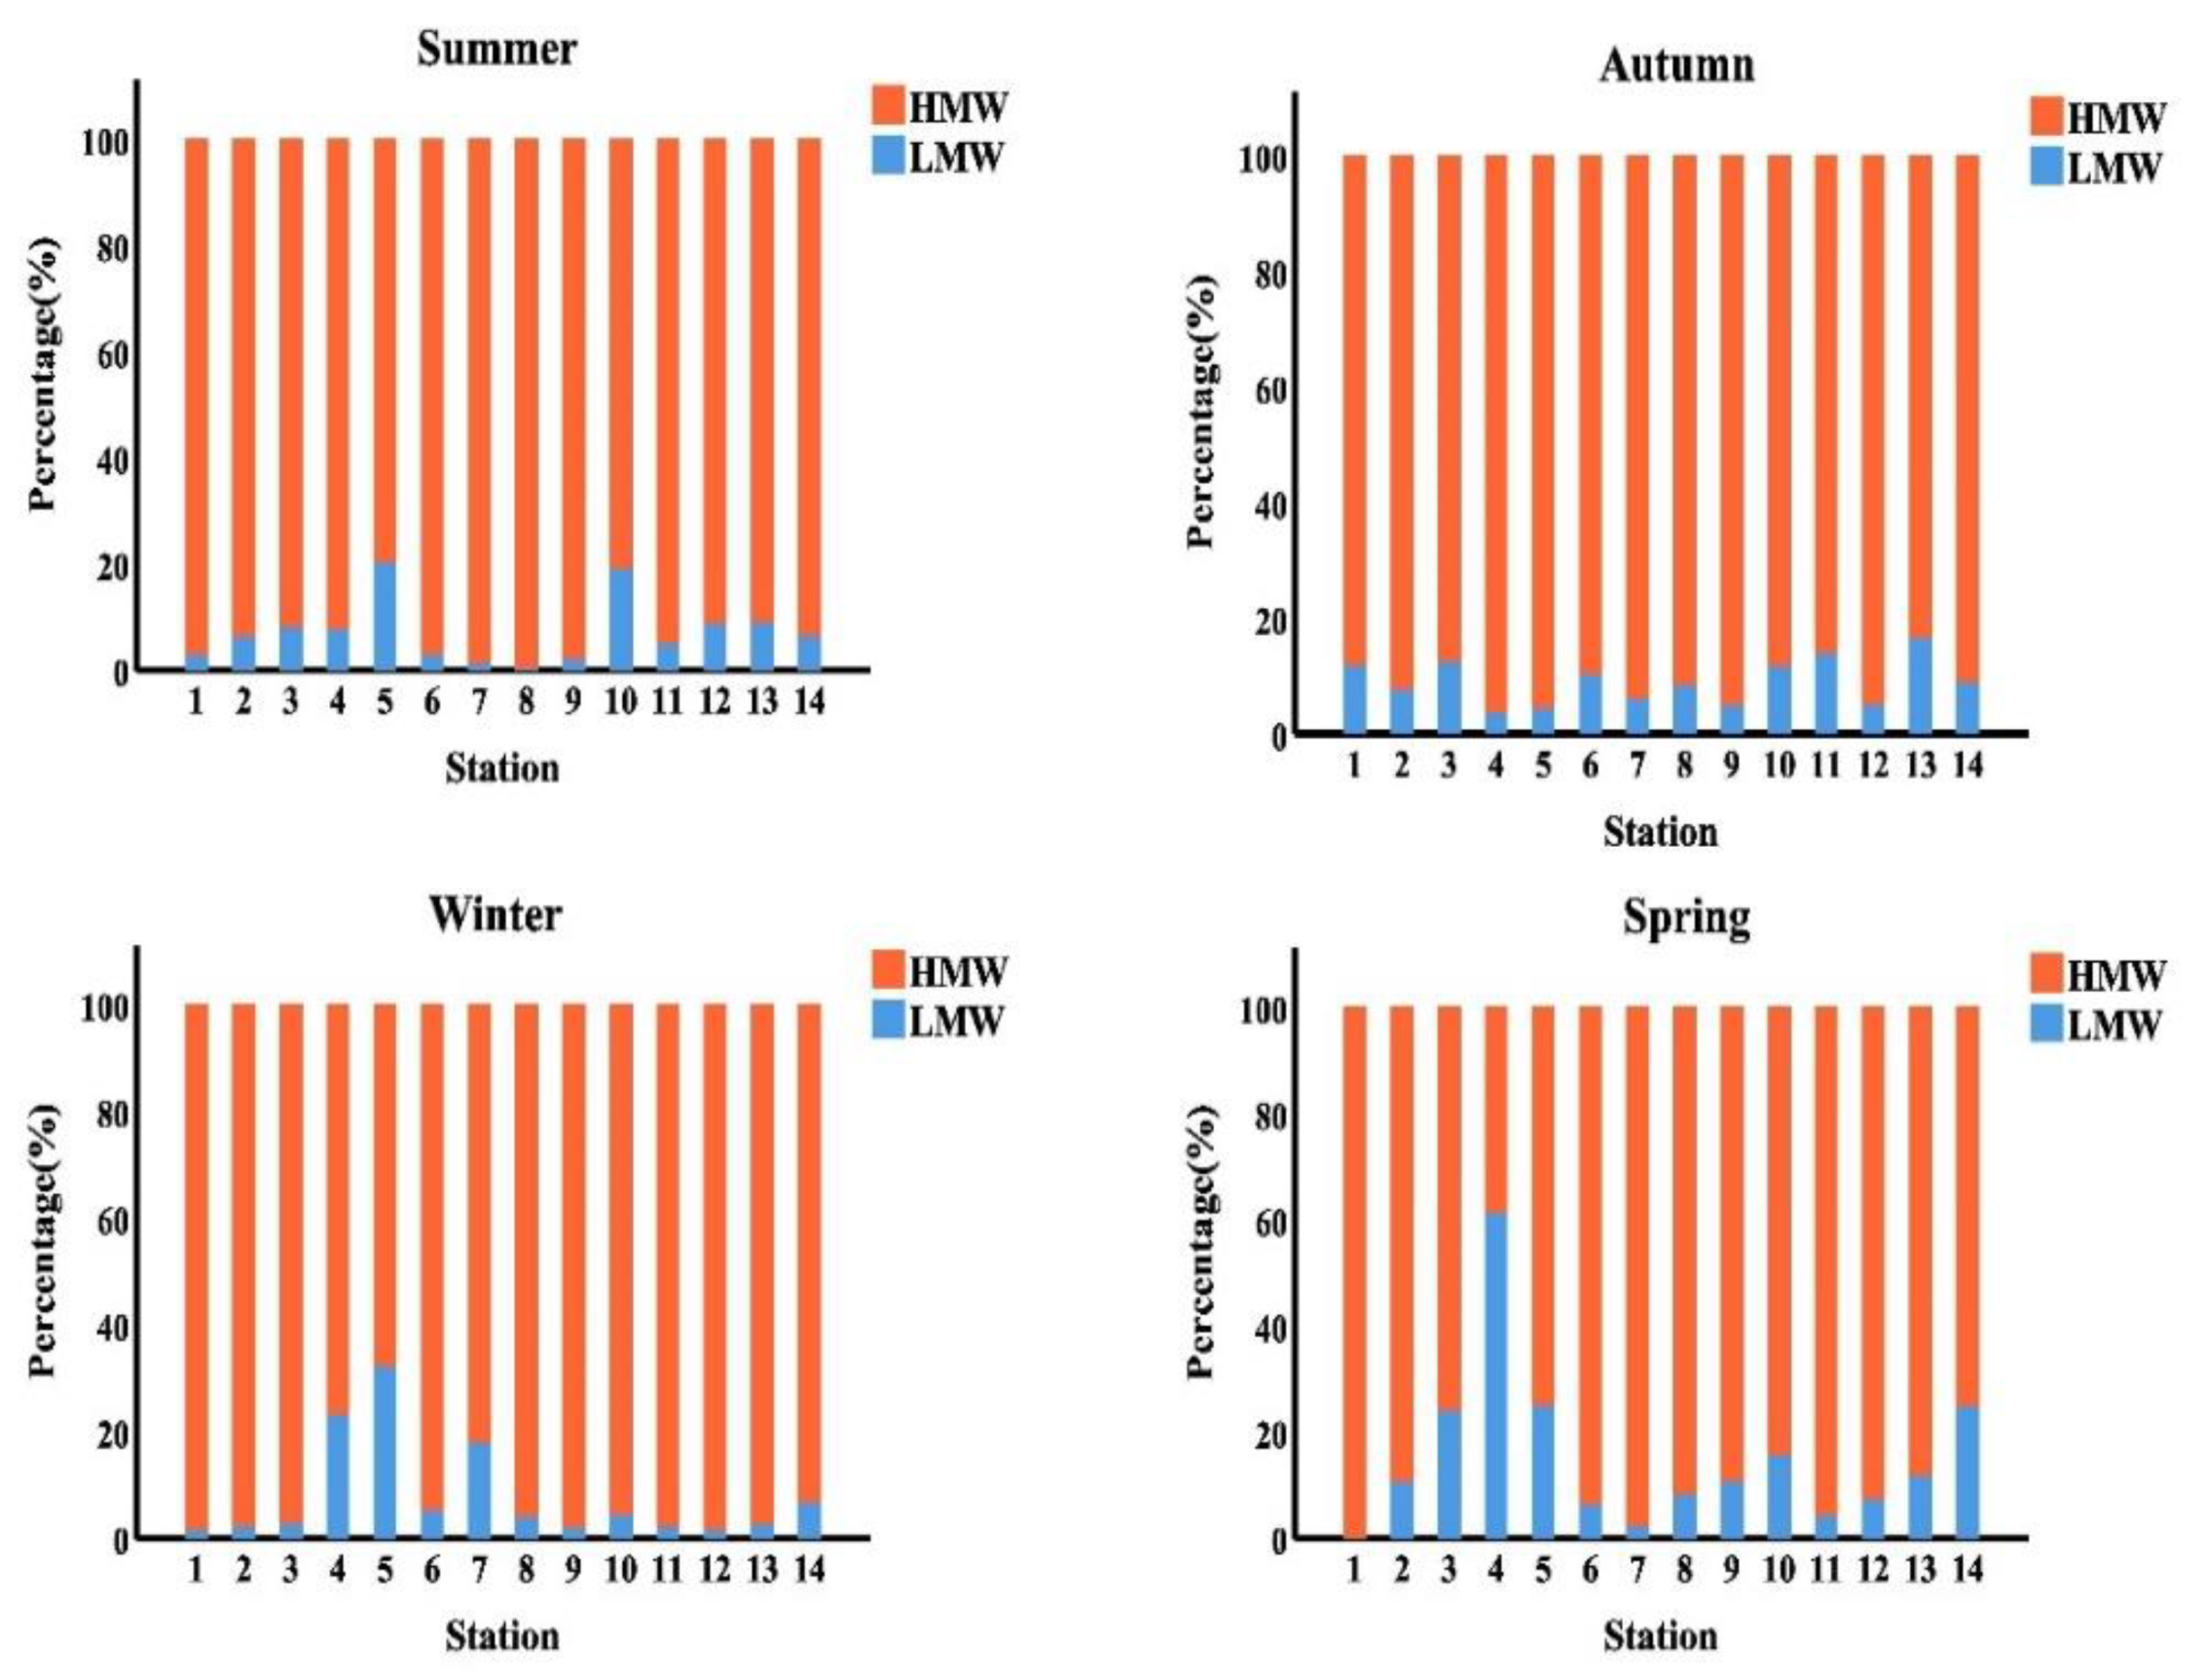
As presented in Figure 5, HMW-PAHs with four rings are predominated (65.92%, 87.64%, 79.68% and 79.64% of the total PAHs in the summer, autumn, winter, and spring season, respectively. In the summer, autumn, winter, and spring seasons, PAHs with three rings accounted for 4.89%, 1.02%, 5.94% and 4.05% of total PAHs, respectively. While, in the summer, autumn, winter, and spring seasons, the PAHs with the two rings accounted for 2.75%, 1.17%, 0.6% and 3.63% of the overall PAHs in the samples analyzed, respectively. Whereas the PAHs with the five rings were reported 16.49%, 5.09%, 6.77% and 12.90% of the total PAHs in the studied samples in the summer, autumn, winter, and spring season, respectively. Finally, the PAHs with the six rings accounted for 9.97%, 5.08%, 7.01% and 0.00% of the overall PAHs in the studied samples in the summer, autumn, winter, and spring season, respectively. The total PAHs in the samples studied may have come from a pyrogenic source, which could explain these findings.

Figure 5.
Histogram represented the seasonal distribution of (LMW&HMW-PAHs %) along the surface water of Egyptian Red Sea coast.
3.3. Identification of PAHs Sources
Many factors contribute to the difficulties in identifying PAHs sources, such as the possibility of multiple sources of pollution coexisting, as well as the transformation process of PAHs [50].
Seven molecular diagnostic ratios were employed to identify putative sources of PAHs in the study area, as indicated in Table 7. In the aquatic ecosystem, the ratio of low molecular weight to high molecular weight PAHs (LMW/HMW) is a measure of weathering. A high level of microbial degradation resistance is indicated by a lower value of this ratio [51].
Table 7.
Diagnostic ratios used in the present study, along with their typical values for different processes.
Pyrogenic sources were found to be depleted in low molecular weight 2–3 rings PAHs (LMW) and enriched in high molecular weight 4–6 rings PAHs (HMW), resulting in LMW/HMW ratios of less than one. LMW-PAHs predominated in petrogenic sources such as light refined petroleum products or fuel oil with an LMW/HMW > 1 ratio [50,52,53]. The LMW/HMW ratios were less than one in all seasons, with the exception of station 4 in the spring, indicating that they derived from pyrogenic sources.
The potential sources of PAHs are measured by the pyrogenic index (PI), which is the ratio of LMW to HMW that is greater than one. The PI has some advantages over the PAHs isomers ratio for three reasons: first, any change in the ratio will accurately represent changes in LMW and HMW-PAHs; second, the PI provides greater precision with greater consistency and lower uncertainty; and third, natural weathering and biodegradation slightly alter the PI values [59].
To differentiate between pyrogenic and petrogenic origins, PAHs with molecular masses of 178 and 202 are widely used [50,57,58,60]. Previous researchers have used values of ratios as an example Flu/Pyr (M.wt = 202) and Phe/Ant (M.wt = 178) [50,57,58,61]. Since petroleum produces more phenanthrene than anthracene (a more thermodynamically stable tricyclic aromatic isomer) the Phe/Ant ratio is expected to be quite high in cases of petrogenic pollution with PAHs [50,60,62]. Budzinski et al.(1997) [57] noticed that Phe/Ant ratios larger than 10 suggested petrogenic inputs, while Phe/Ant ratios less than 10 were indicative of pyrolytic sources. Furthermore, Flu/Pyr values less than one indicated petrogenic origins, whereas values more than one were connected to a pyrolytic origin.
The Phe/Ant ratios for all stations in all studied seasons is less than 10, this suggested a pyrolytic origin, with the exception of station 4 in the winter season. Fluoranthene/pyrene (Flu/pyr) rates reveal the source of PAHs. For the summer season, PAHs from stations (9, 11, 12, and 13) are mostly petrogenic, while the rest of the stations are mostly pyrolytic. For the autumn season, PAHs from stations (3, 4, 9, 12, and 13) are mostly petrogenic, while the rest of the samples are mostly pyrolytic. For the winter season, PAHs from station (2) are mostly petrogenic, whereas PAHs of stations (1, 5, 6, 8, 9, and 12) have mainly petrogenic origin while the rest of the stations have mainly pyrolytic origin for spring season, and the rest of the samples have Flu/Pyr >1 suggest pyrolytic origins.
Ant/(Ant + Phe), Flu/(Flu + Pyr), and BaA/(BaA + Chr) were also used in the current study for further linking PAHs composition to pollution sources [56]. A ratio of Ant/(Ant + Phe) less than 0.1 indicates petroleum origin, whereas a ratio larger than 0.1 suggests combustion dominance. The results indicate Ant /(Ant + phe) ratio > 0.1 values at stations 5 and 12 for the autumn and spring seasons respectively, while the majority of the samples showed low concentrations at both seasons. In both the summer and the winter seasons, the Ant/(Ant + Phe) ratio > 0.1, suggesting pyrogenic origin, with the exception of station (4) in the winter season.
With Flu/(Flu + Pyr) ratio less than 0.4 indicates petroleum combustion, and from 0.4 to 0.5 indicates fossil fuel combustion (crude oil and vehicle), while greater than 0.5 suggesting combustion of coal, wood and kerosene [56]. In this study, the Flu/(Flu + Pyr) ratio was greater than 0.5, indicating pyrolytic origin for the majority of locations along all seasons. Except for stations (11 and 12), stations (3, 4, 9 and 13) and station (2) with recorded Flu/(Flu + Pyr) ratios between 0.4 and 0.5 in summer, autumn, and winter seasons. This suggests petroleum combustion origin. In the summer, autumn, and spring seasons, the Flu/(Flu + Pyr) ratios for stations (9 and 13), station (12), and stations (1, 5, 6, 9 and 12) were all less than 0.4, indicating petroleum pollution.
A ratio BaA/(BaA + Chy) lower than 0.2 indicates petroleum source, while from 0.2 to 0.35 indicates combustion of petroleum origin, and a value higher than 0.35 indicates combustion source [56]. During the summer season, PAHs from stations (3, 4 and 5) had mostly petrogenic origin, while PAHs from stations (8, 9 and 12) had a mixed origin. The majority of the stations had mostly pyrolytic origin. Stations (2, 9, 11, 12 and 13) in the autumn season had petroleum contamination origin, while stations (3, 7 and 8) have BaA/(BaA + Chy) ratio 0.2 suggesting petroleum origin. However, the rest of the samples had primarily pyrolytic origin. Stations (1, 3, 7 and 11) in winter season have petrogenic origin, while stations (2, 8, 9 and 12) have mixed sources. The rest of sample had BaA/(BaA + Chy) ratio <0.35 indicating pyrolytic source. Stations (1, 2, 3, 6, 7, 8, and 11) have mainly petrogenic origins, while stations (10, 12 and 13) had BaA/(BaA + Chy) between 0.2 and 0.35, suggesting petroleum combustion source, while the remaining stations had mainly pyrolytic origins for the spring season.
A petrogenic source is indicated by a ΣCOMB/Σ16PAHs ratio of <0.3, a mixed source by a ratio of 0.3 to 0.7, and a high-temperature combustion source by a ratio of >0.7 [54]. In all seasons, the COMB/16PAHs ratio was >0.7, with the exception of station (4) in the spring season, which dropped within the range of mixed sources. This indicates that the PAHs sources in the study area came from combustion sources.
3.4. Risk Quotients (RQs)
Risk quotients (RQ) are frequently employed to assess the potential environmental impact of PAHs on aquatic organisms [63,64,65]. The risk levels posed by PAHs were determined using RQ as the following:
Individual PAHs concentrations were referred to as CPAHs. The quality values are based on the concentrations of PAHs in seawater that are considered insignificant (NCs) and maximum permitted (MPCs) by [63]. As a result, RQNCs and RQMPCs can be described as:
where and were the quality values of PAHs in the medium’s NCs and MPCs, respectively [66].
The risk classification of PAHs and mean PAHs’ RQNCs and RQMPCs in the investigated samples along the Red Sea coast during various seasons are shown in Table 8. The majority of measured individual PAHs had RQ(NCs) >1.0 in all seasons, indicating that the majority of individual PAHs in the study area were above moderate risk thresholds.
RQ(MPCs) of (Naph, Ace, Acthy, F, Phe and Ant in all seasons) and (BaP in summer and autumn, IP in spring) were <1.0, while RQ(MPCs) of (Flu, Pyr, BaA Chr and BbF in all seasons, BaP in winter and spring seasons and IP in summer, autumn, and winter seasons) were >1.0. Individual PAHs posed a moderate to high ecological risk in the study area’s seawater according to these findings. The RQΣPAHs (NCs) and the RQΣPAHs(MPCs) of the study area in different seasons are depicted in Figure 6. The RQΣPAHs (NCs) and RQΣPAHs (MPCs) indicate that ΣPAHs posed a high ecological risk to marine organisms in all seasons, with the exception of the spring season, where stations 4 and 14 posed a moderate risk. Finally, the ecological risk of PAHs in the study area’s seawater has been contaminated, necessitating the implementation of appropriate control and remediation measures should be introduced.
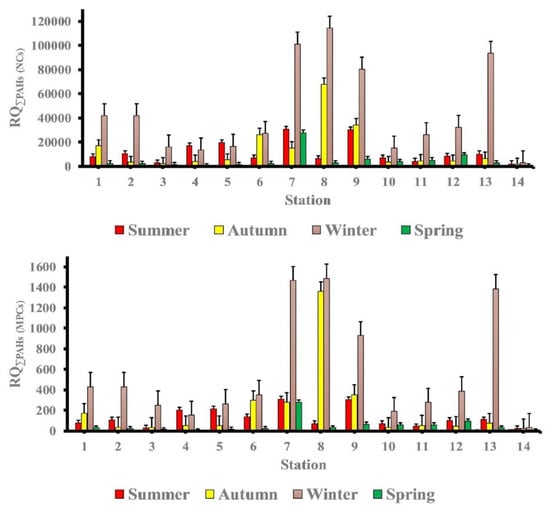
Figure 6.
The mean values of RQ(NCs) and RQ(MPCs) of total PAHs in the study area at different seasons.
Figure 6.
The mean values of RQ(NCs) and RQ(MPCs) of total PAHs in the study area at different seasons.

The RQ(NCs) and RQ(MPCs) may be a more accurate indication than PAHs concentrations. Figure 7 demonstrates the composition of RQ(NCs). The contributions of individual PAHs to RQ(NCs) were quite similar to their contributions to RQ(MPCs). The ratio of RQ(NCs) of 4 -ring PAHs was found to be the key contributor to the ecological load in seawater in different seasons. In the summer season, the RQ(NCs) of 5-ring PAHs were the predominant ecosystem risk at stations (5, 7, 9 and 11), and in the winter and spring seasons, the RQ(NCs) of 5-ring PAHs were the primary ecosystem risk at station (7).
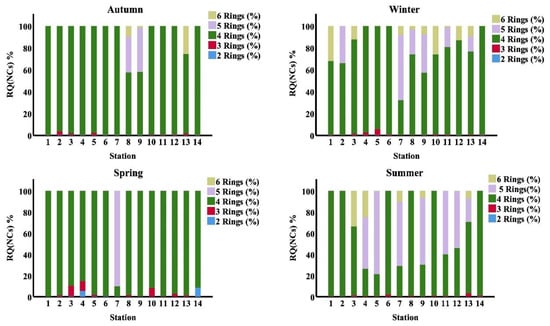
Figure 7.
Proportion of RQ(NCs)% according to number of Rings PAHs in study area at different seasons.
Figure 7.
Proportion of RQ(NCs)% according to number of Rings PAHs in study area at different seasons.
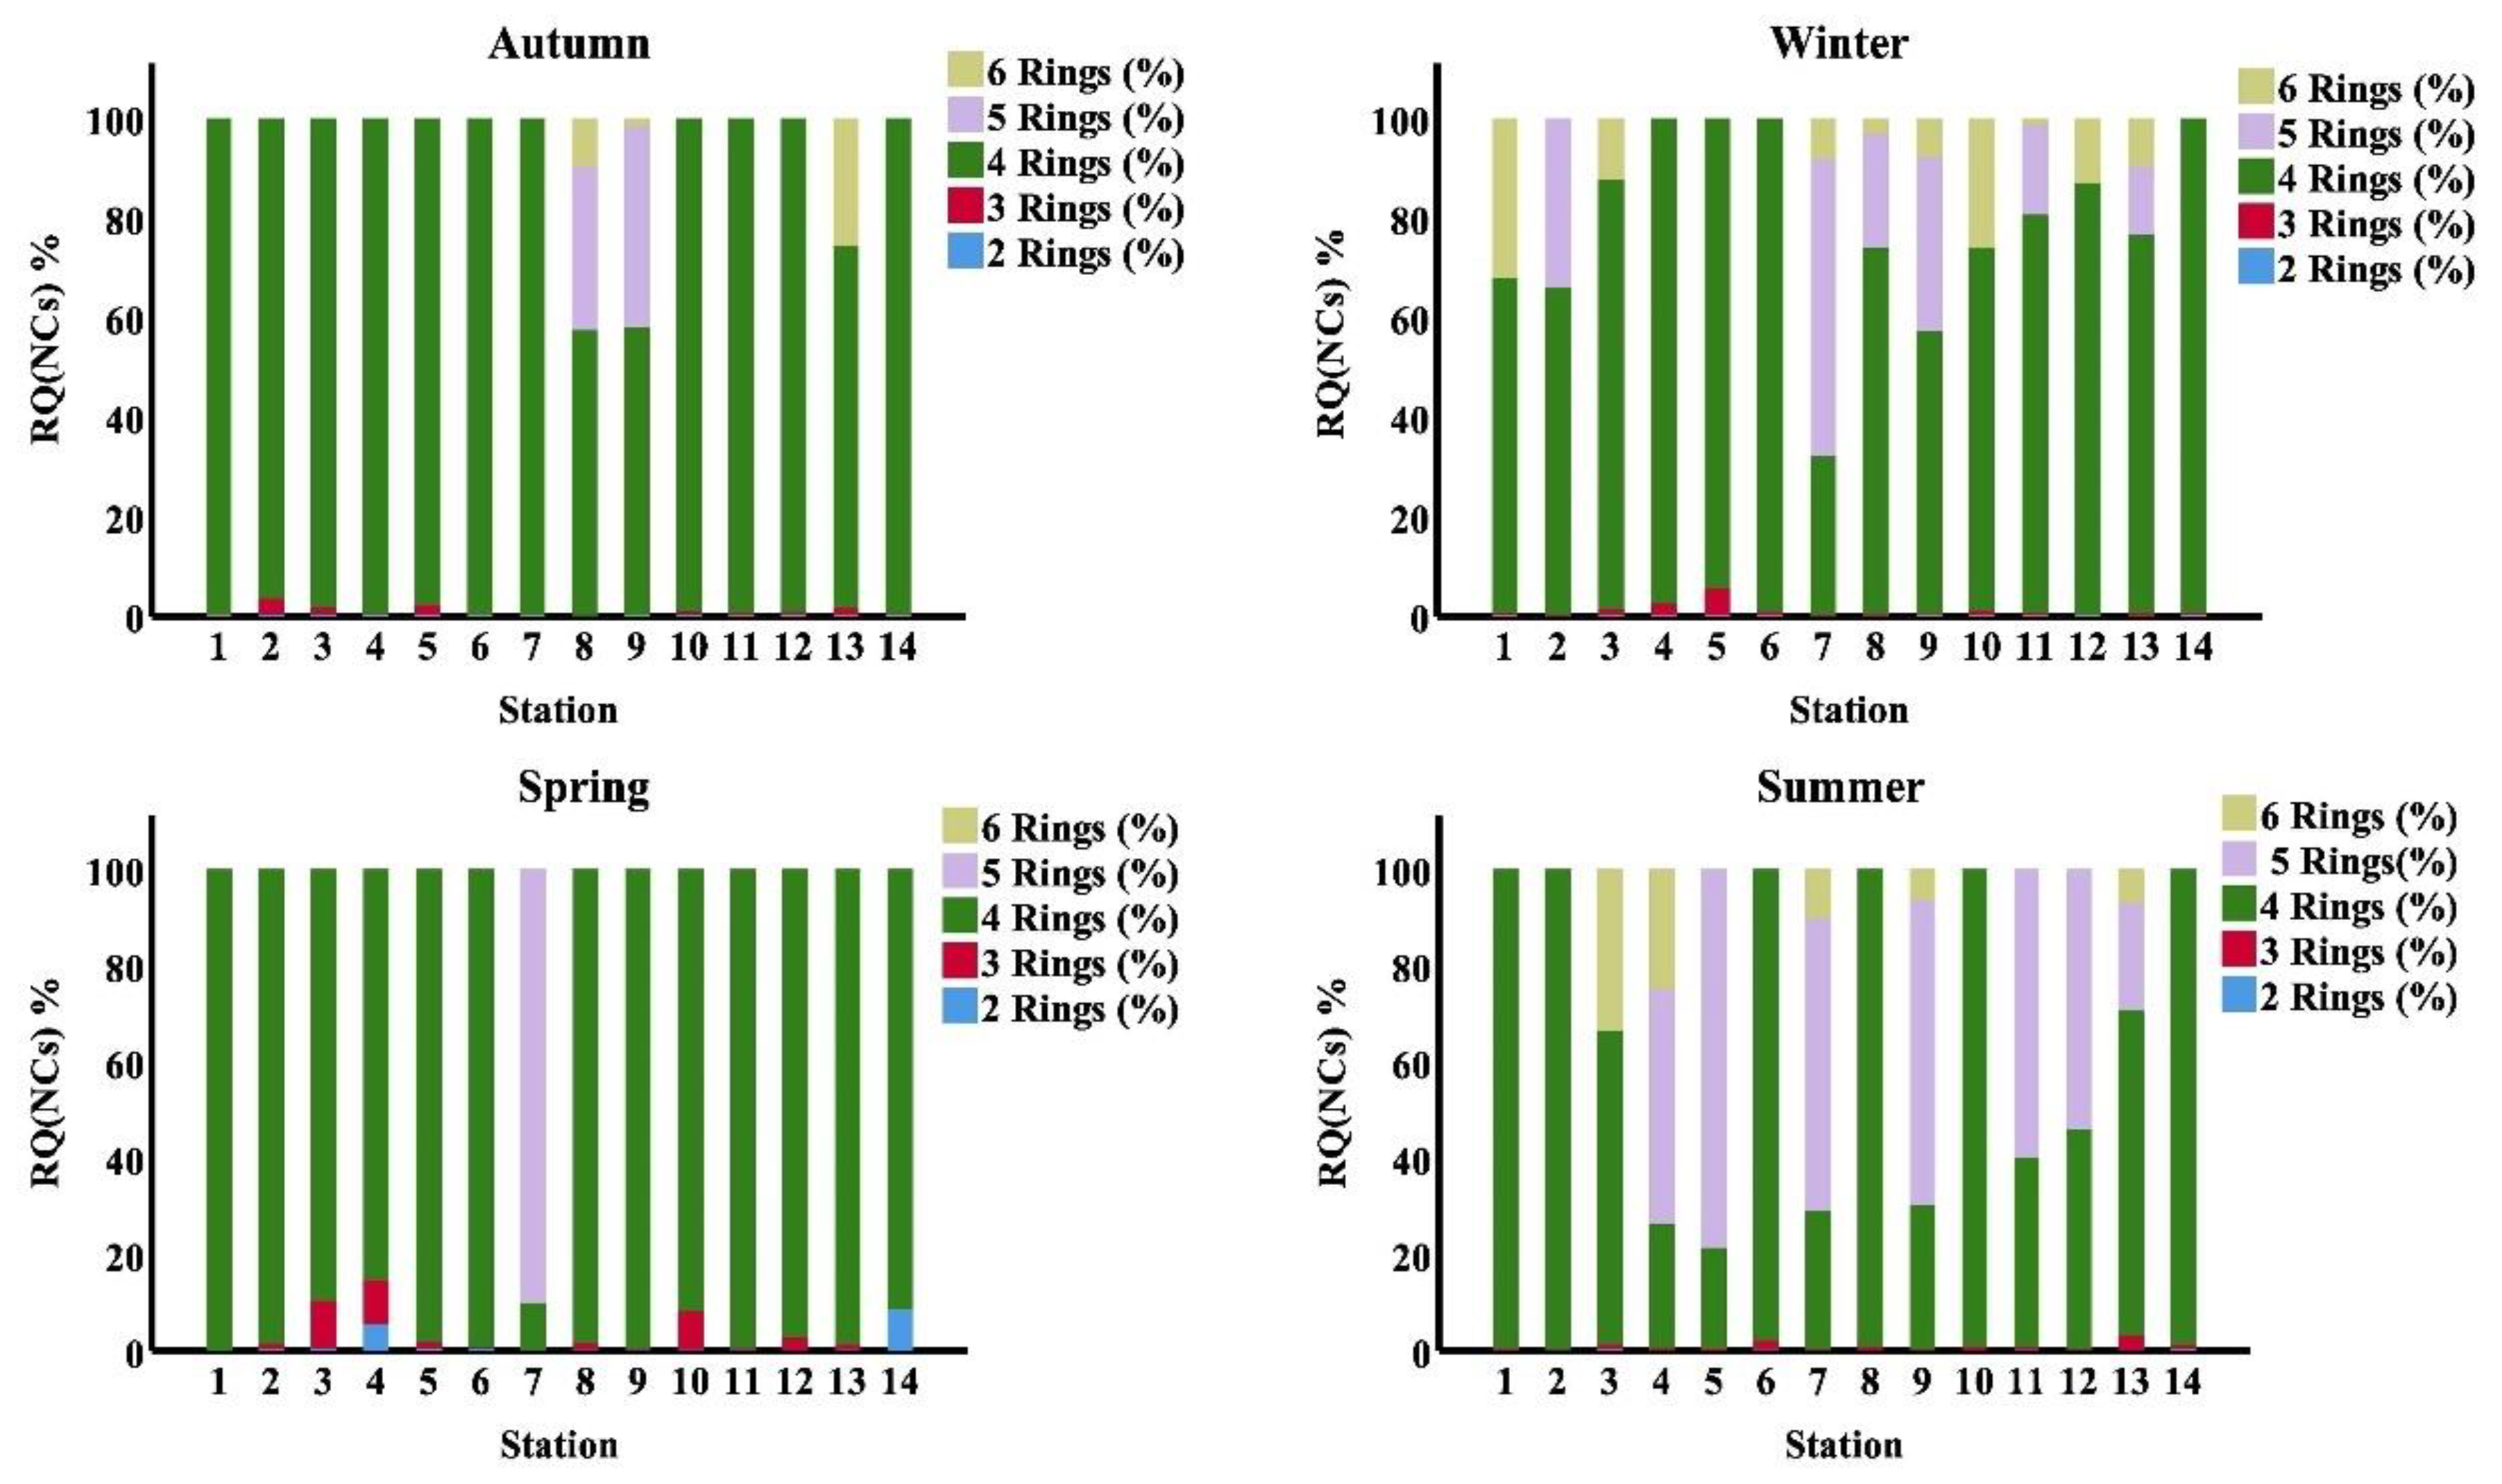
Table 8.
Mean values of PAHs’ RQNCs and RQMPCs (µg/L) and their classification according to Cao et al., (2010) in seawater along the area of study.
Table 8.
Mean values of PAHs’ RQNCs and RQMPCs (µg/L) and their classification according to Cao et al., (2010) in seawater along the area of study.
| PAHs | Summer | Autumn | Winter | Spring | ||||||||||
|---|---|---|---|---|---|---|---|---|---|---|---|---|---|---|
| NCs | MPCs | RQ(NCs) | RQ(MPCs) | Class | RQ(NCs) | RQ(MPCs) | Class | RQ(NCs) | RQ(MPCs) | Class | RQ(NCs) | RQ(MPCs) | Class | |
| Naph | 0.012 | 1.2 | 7.23 | 0.07 | Moderate risk | 7.13 | 0.07 | Moderate risk | 10.37 | 0.1 | Moderate risk | 6.42 | 0.06 | Moderate risk |
| Acthy | 0.0007 | 0.07 | ND | ND | Risk-free | 3.87 | 0.04 | Moderate risk | 8.39 | 0.08 | Moderate risk | 1.1 | 0.01 | Moderate risk |
| Ace | 0.0007 | 0.07 | 5.55 | 0.06 | Moderate risk | ND | ND | Risk-free | 5.12 | 0.05 | Moderate risk | 31.86 | 0.32 | Moderate risk |
| F | 0.0007 | 0.07 | ND | ND | Risk-free | 9.81 | 0.1 | Moderate risk | 34.31 | 0.34 | Moderate risk | 9.23 | 0.09 | Moderate risk |
| Phe | 0.003 | 0.3 | 44.65 | 0.45 | Moderate risk | 20.45 | 0.2 | Moderate risk | 270.26 | 2.7 | High-risk | 17.69 | 0.18 | Moderate risk |
| Ant | 0.0007 | 0.07 | 23.59 | 0.24 | Moderate risk | 5.05 | 0.05 | Moderate risk | 564.25 | 5.64 | High-risk | 4.73 | 0.05 | Moderate risk |
| Flu | 0.003 | 0.03 | 128.23 | 12.82 | High-risk | 700.92 | 70.09 | High-risk | 1354.51 | 135.45 | High-risk | 42.72 | 4.27 | High-risk |
| Pyr | 0.0007 | 0.07 | 278.53 | 2.79 | High-risk | 2410.11 | 24.1 | High-risk | 3155.36 | 31.55 | High-risk | 285.22 | 2.85 | High-risk |
| BaA | 0.0001 | 0.01 | 5051.29 | 50.51 | High-risk | 7088.06 | 70.88 | High-risk | 23235.8 | 232.36 | High-risk | 2325 | 23.25 | High-risk |
| Chr | 0.0034 | 0.34 | 293.05 | 2.93 | High-risk | 563.35 | 5.63 | High-risk | 2364.33 | 23.64 | High-risk | 331.32 | 3.31 | High-risk |
| BbF | 0.0001 | 0.01 | 4648.68 | 49.77 | High-risk | 2241.85 | 22.42 | High-risk | 9458.46 | 94.58 | High-risk | 1556.7 | 15.57 | High-risk |
| BkF | 0.0004 | 0.04 | 57.08 | 0.57 | Moderate risk | 253.53 | 2.54 | High-risk | 395.64 | 3.96 | High-risk | ND | ND | Risk-free |
| BaP | 0.0005 | 0.05 | ND | ND | Risk-free | 94.36 | 0.94 | Moderate risk | 618.61 | 6.19 | High-risk | 236.57 | 2.37 | High-risk |
| DahA | 0.0005 | 0.05 | ND | ND | Risk-free | ND | ND | Risk-free | ND | ND | Risk-free | ND | ND | Risk-free |
| BP | 0.0003 | 0.03 | ND | ND | Risk-free | ND | ND | Risk-free | ND | ND | Risk-free | ND | ND | Risk-free |
| IP | 0.0004 | 0.04 | 786.71 | 7.87 | High-risk | 632.94 | 6.33 | High-risk | 3659.42 | 36.59 | High-risk | ND | ND | Risk-free |
| ∑PAHs | 0.03 | 2.45 | 11324.6 | 128.07 | High-risk | 14031.4 | 203.4 | High-risk | 45134.9 | 573.25 | High-risk | 4848.6 | 52.33 | High-risk |
4. Conclusions
This work investigated 16 PAHs in surface seawater along Egypt’s Red Sea coast. At different sampling sites, the spatial distribution and species of PAHs differed significantly. According to the European Union’s water standard, the levels of PAHs contamination along the Red Sea coast was higher than the maximum permissible PAHs concentrations (0.20 μg/L) in all samples and this may cause toxicity in certain species that are exposed. Benzo(a)pyrene (BaP) and Dibenzo(a, h)anthracene were not observed in all seasons, whereas HMW PAHs were prevalent in both. PAHs pollution along the Red Sea coast was primarily caused by pyrogenic sources linked to shipping and shipyards, according to the source identification. Individual PAHs pose a moderate to high ecological risk, according to RQNCs and RQMPCs, while the mean values of RQΣPAHs (NCs) and RQΣPAHs (MPCs) show that PAHs pose a high ecological risk in the majority of sites. The findings of this research are serve as useful baseline data for PAHs contamination in the area of study.
Author Contributions
Data curation, M.E.-N.; Methodology, S.H.; Supervision, A.M.Y.; Writing—original draft, M.A.G.; Writing—review & editing, A.-A.Y.E.-S. All authors have read and agreed to the published version of the manuscript.
Funding
This research received no external funding.
Institutional Review Board Statement
Not applicable.
Informed Consent Statement
Not applicable.
Data Availability Statement
This study did not report any data.
Acknowledgments
The authors would like to thank the Pure and Applied Chemistry Group at The University of Sharjah for partially supported this work.
Conflicts of Interest
The authors declare no conflict of interest.
References
- Younis, A.M. Environmental Impacts on Egyptian Delta Lakes’ Biodiversity: A Case Study on Lake Burullus. In Egyptian Coastal Lakes and Wetlands: Part II: Climate Change and Biodiversity; Negm, A.M., Bek, M.A., Abdel-Fattah, S., Eds.; Springer International Publishing: New York, NY, USA, 2018; pp. 107–128. [Google Scholar]
- Younis, A.M.; Aly-Eldeen, A.M.; Elkady, M.E. Effect of different molecular weights of chitosan on the removal efficiencies of heavy metals from contaminated water. Egypt. J. Aquat. Biol. Fish. 2019, 23, 149–158. [Google Scholar] [CrossRef] [Green Version]
- Mansour, A.M.; Nawar, A.H.; Mohamed, A.W. Geochemistry of coastal marine sediments and their contaminant metals, Red Sea, Egypt: A legacy for the future and a tracer to modern sediment dynamics. Sediment. J. Egypt. 2000, 8, 231–242. [Google Scholar]
- Younis, A.M.; Soliman, Y.A.; Elkady, E.M.; El-Naggar, M.H. Assessment of polycyclic aromatic hydrocarbons in surface sediments and some fish species from the Gulf of Suez, Egypt. Egypt. J. Aquat. Biol. Fish. 2018, 22, 49–59. [Google Scholar] [CrossRef] [Green Version]
- Soliman, N.F.; Elkady, E.M.; Younis, A.M. Chemical fractions and ecological risk of metals in sediments of the Bitter Lakes, Egypt. J. Aquat. Biol. Fish. 2020, 24, 167–196. [Google Scholar] [CrossRef]
- Amin, H.H.; Ahmed, O.O.; Rasmey, A.-H.M.; Younis, A.; Bekhitd, A.E.-D.A. Effect of technological processing on the safety of Indian mackerel (Rastrelliger kangurata) from Suez, Egypt. J. Aquat. Biol. Fish. 2018, 22, 273–284. [Google Scholar] [CrossRef] [Green Version]
- Wei, M.-C.; Jen, J.-F. Determination of polycyclic aromatic hydrocarbons in aqueous samples by microwave assisted head-space solid-phase microextraction and gas chromatography/flame ionization detection. Talanta 2007, 72, 1269–1274. [Google Scholar] [CrossRef]
- Katsoyiannis, A.; Sweetman, A.J.; Jones, K.C. PAH Molecular Diagnostic Ratios Applied to Atmospheric Sources: A Critical Evaluation Using Two Decades of Source Inventory and Air Concentration Data from the UK. Environ. Sci. Technol. 2011, 45, 8897–8906. [Google Scholar] [CrossRef]
- IARC. IARC Monographs on the Evaluation of the Carcinogenic Risk of Chemicals to Humans, Overall Evaluations of Car-Cinogenicity; An Updating of IARC Monographs; International Agency for Research on Cancer: Lyon, France, 1987; Volume 1–42 (Suppl. 7). [Google Scholar]
- Laflamme, R.; Hites, R.A. The global distribution of polycyclic aromatic hydrocarbons in recent sediments. Geochim. et Cosmochim. Acta 1978, 42, 289–303. [Google Scholar] [CrossRef]
- Mostafa, A.R.; Wade, T.L.; Sweet, S.T.; Al-Alimi, A.K.A.; Barakat, A.O. Distribution and characteristics of polycyclic aro-matic hydrocarbons (PAHs) in sediments of Hadhramout coastal area, Gulf of Aden, Yemen. J. Mar. Syst. 2009, 78, 1–8. [Google Scholar] [CrossRef]
- Yim, U.H.; Hong, S.H.; Ha, S.Y.; Han, G.M.; An, J.G.; Kim, N.S.; Lim, D.-I.; Choi, H.-W.; Shim, W.J. Source- and region-specific distribution of polycyclic aromatic hydrocarbons in sediments from Jinhae Bay, Korea. Sci. Total Environ. 2014, 470–471, 1485–1493. [Google Scholar] [CrossRef]
- Martinez, E.; Gros, M.; Lacorte, S.; Barceló, D. Simplified procedures for the analysis of polycyclic aromatic hydrocarbons in water, sediments and mussels. J. Chromatogr. A 2004, 1047, 181–188. [Google Scholar]
- Neff, J.M. Polycyclic Aromatic Hydrocarbons in the Aquatic Environment. Sources, Fates and Biological Effects; Applied Science Publishers Ltd.: London, UK, 1979. [Google Scholar]
- Tam, N.; Ke, L.; Wang, X.; Wong, Y. Contamination of polycyclic aromatic hydrocarbons in surface sediments of mangrove swamps. Environ. Pollut. 2001, 114, 255–263. [Google Scholar] [CrossRef]
- Karacık, B.; Okay, O.S.; Henkelmann, B.; Bernhöft, S.; Schramm, K.W. Polycyclic aromatic hydrocarbons and effects on ma-rine organisms in the Istanbul Strait. Environ. Int. 2009, 35, 599–606. [Google Scholar] [CrossRef]
- Shreadah, M.A.; Said, T.O.; Younis, A.M.; Farag, R.S. Speciation of organotin compounds in sediments of semi-closed areas along the Mediterranean coast of Alexandria. Chem. Ecol. 2006, 22, 395–404. [Google Scholar] [CrossRef]
- Soliman, N.F.; Younis, A.M.; El Kady, E.M. An insight into fractionation, toxicity, mobility and source apportionment of metals in sediments from El Temsah Lake, Suez Canal. Chemosphere 2019, 222, 165–174. [Google Scholar] [CrossRef]
- Younis, A.M. Accumulation and rate of degradation of organotin compounds in coastal sediments along the Red Sea, Egypt. J. Aquat. Biol. Fish. 2020, 24, 413–436. [Google Scholar] [CrossRef]
- Parsons, T.R.; Maita, Y.; Lalli, C.M. Determination of Petroleum Hydrocarbons. In A Manual of Chemical & Biological Methods for Seawater Analysis; Elsevier BV: Amsterdam, The Netherlands, 1984; pp. 56–59. [Google Scholar]
- Smith, R.K. Handbook of Environmental Analysis, 4th ed.; Genium Publishing Corporation: New York, NY, USA, 1999. [Google Scholar]
- Halsall, C.J.; Barrie, L.A.; Fellin, P.; Muir, D.C.G.; Billeck, B.N.; Lockhart, L.; Rovinsky, F.Y.; Kononov, A.E.Y.; Pastukhov, B. Spatial and Temporal Variation of Polycyclic Aromatic Hydrocarbons in the Arctic Atmosphere. Environ. Sci. Technol. 1997, 31, 3593–3599. [Google Scholar] [CrossRef]
- Witt, G. Occurrence and transport of polycyclic aromatic hydrocarbons in the water bodies of the Baltic Sea. Mar. Chem. 2002, 79, 49–66. [Google Scholar] [CrossRef]
- Koudryashova, Y.; Chizhova, T.; Tishchenko, P.; Hayakawa, K. Seasonal Variability of Polycyclic Aromatic Hydrocarbons (PAHs) in a Coastal Marine Area in the Northwestern Region of the Sea of Japan/East Sea (Possiet Bay). Ocean Sci. J. 2019, 54, 635–655. [Google Scholar] [CrossRef]
- Emara, M.M.; Farid, N.A.; El-Sabagh, E.A.; Ahmed, O.E.; Kamal, E.M. Origin and Distribution of Polycyclic Aromatic Hydrocarbons (PAHs) in Surface Water of Suez Gulf. Egypt. J. Chem. 2013, 56, 325–344. [Google Scholar]
- Law, R.; Dawes, V.; Woodhead, R.; Matthiessen, P. Polycyclic aromatic hydrocarbons (PAH) in seawater around England and Wales. Mar. Pollut. Bull. 1997, 34, 306–322. [Google Scholar] [CrossRef]
- Martin, M.H.; Jorgensen, S.E.; Nielsen, S.N.; Jorgensen, L.A. Handbook of Ecological Parameters and Ecotoxicology. J. Appl. Ecol. 1992, 29, 791. [Google Scholar] [CrossRef]
- USEPA. National Recommended Water Quality Criteria; 4304T; United States Environmental Protection Agency: Washington, DC, USA, 2009.
- Werres, F.; Balsaa, P.; Schmidt, T.C. Total concentration analysis of polycylic aromatic hydrocarbons in aqueous samples with high suspended particulate matter content. J. Chromatogr. A 2009, 1216, 2235–2240. [Google Scholar] [CrossRef]
- El Nemr, A.; Abd-Allah, A.M. Contamination of polycyclic aromatic hydrocarbons (PAHs) in microlayer and subsurface waters along Alexandria coast, Egypt. Chemosphere 2003, 52, 1711–1716. [Google Scholar] [CrossRef]
- Manodori, L.; Gambaro, A.; Piazza, R.; Ferrari, S.; Stortini, A.; Moret, I.; Capodaglio, G. PCBs and PAHs in sea-surface microlayer and sub-surface water samples of the Venice Lagoon (Italy). Mar. Pollut. Bull. 2006, 52, 184–192. [Google Scholar] [CrossRef] [Green Version]
- Hong, W.-J.; Jia, H.; Li, Y.-F.; Sun, Y.; Liu, X.; Wang, L. Polycyclic aromatic hydrocarbons (PAHs) and alkylated PAHs in the coastal seawater, surface sediment and oyster from Dalian, Northeast China. Ecotoxicol. Environ. Saf. 2016, 128, 11–20. [Google Scholar] [CrossRef]
- Al-Agroudy, N.; Soliman, Y.A.; Hamed, M.A.; Zaghloul, G.Y. Distribution of PAHs in water, sediments samples of Suez Canal during 2011. J. Aquat. Poll. Toxicol. 2017, 1, 1–10. [Google Scholar]
- Tiwari, M.; Sahu, S.; Pandit, G. Distribution of PAHs in different compartment of creek ecosystem: Ecotoxicological concern and human health risk. Environ. Toxicol. Pharmacol. 2017, 50, 58–66. [Google Scholar] [CrossRef]
- Pan, L.; Xu, R.; Wen, J.; Guo, R. Assessing PAHs pollution in Shandong coastal area (China) by combination of chemical analysis and responses of reproductive toxicity in crab Portunus trituberculatus. Environ. Sci. Pollut. Res. 2017, 24, 14291–14303. [Google Scholar] [CrossRef]
- Ranjbar Jafarabadi, A.; Riyahi Bakhtiari, A.; Shadmehri Toosi, A. Comprehensive and comparative ecotoxicological and human risk assessment of polycyclic aromatic hydrocarbons (PAHs) in reef surface sediments and coastal seawaters of Ira-nian Coral Islands, Persian Gulf. Ecotoxicol. Environ. Saf. 2017, 145, 640–652. [Google Scholar] [CrossRef]
- Niu, L.; Cai, H.; van Gelder, P.; Luo, P.; Liu, F.; Yang, Q. Dynamics of polycyclic aromatic hydrocarbons (PAHs) in water column of Pearl River estuary (China): Seasonal pattern, environmental fate and source implication. Appl. Geochem. 2018, 90, 39–49. [Google Scholar] [CrossRef]
- Penko, L.; Bajt, O. Aliphatic and polycyclic aromatic hydrocarbons in surface seawater of the GULF of Trieste (northern ADRIATIC). Mar. Pollut. Bull. 2019, 142, 103–111. [Google Scholar] [CrossRef]
- Said, T.O.; Hamed, M.A. Mobility of Polycyclic Aromatic Hydrocarbons in Water of the Egyptian Red Sea Coasts. Bull. Environ. Contam. Toxicol. 2006, 77, 126–136. [Google Scholar] [CrossRef]
- Nazik, A.F.; Omayma, E.A.; Abd El-Rahman, M.M. Contamination of water, sediment, tar ball and fishes by poly-aromatic hydrocarbons (PAHs) in Alexandria Sea Coasts. J. Appl. Sci. Res. 2013, 9, 5619–5632. [Google Scholar]
- Nasher, E.; Heng, L.Y.; Zakaria, Z.; Surif, S. Concentrations and sources of polycyclic aromatic hydrocarbons in the sea-water around Langkawi Island, Malaysia. J. Chem. 2013, 2013, 1–11. [Google Scholar] [CrossRef]
- Farid, N.A.; Mahmoud, S.A.; Ahmed, O.E. Occurrence and Distribution of Aliphatic and Polycyclic Aromatic Hydrocar-bons in Surface Waters along Coastal Area of Suez Gulf. Egypt. J. Chem. 2015, 58, 43–69. [Google Scholar]
- Barrick, R.C.; Prahl, F.G. Hydrocarbon geochemistry of the Puget Sound region—III. Polycyclic aromatic hydrocarbons in sediments. Estuarine, Coast. Shelf Sci. 1987, 25, 175–191. [Google Scholar] [CrossRef]
- McCready, S.; Slee, D.J.; Birch, G.F.; Taylor, S.E. The Distribution of Polycyclic Aromatic Hydrocarbons in Surficial Sedi-ments of Sydney Harbour, Australia. Mar. Pollut. Bull. 2000, 40, 999–1006. [Google Scholar] [CrossRef]
- Omar, N.Y.M.J.; Abas, M.R.B.; Rahman, N.A.; Tahir, N.M.; Rushdi, A.I.; Simoneit, B.R. Levels and distributions of or-ganic source tracers in air and roadside dust particles of Kuala Lumpur, Malaysia. Environ. Geol. 2007, 52, 1485–1500. [Google Scholar] [CrossRef]
- Menzie, C.A.; Potocki, B.B.; Santodonato, J. Exposure to carcinogenic PAHs in the environment. Environ. Sci. Technol. 1992, 26, 1278–1284. [Google Scholar] [CrossRef]
- IARC. IARC Monographs on the Evaluation of the Carcinogenic Risk of Chemicals to Humans: Polynuclear Aromatic Compounds; Part 1, Chemical, Environmental and Experimental Datal; International Agency for Research on Cancer: Lyon, France, 1983; Volume 32. [Google Scholar]
- Wang, Z.; Fingas, M.; Sergy, G. Chemical Characterization of Crude Oil Residues from an Arctic Beach by GC/MS and GC/FID. Environ. Sci. Technol. 1995, 29, 2622–2631. [Google Scholar] [CrossRef]
- Sun, K.; Song, Y.; Liu, Z.; Jing, M.; Wan, J.; Tang, J.; Liu, R. Toxicity assessment of Fluoranthene, Benz(a)anthracene and its mixed pollution in soil: Studies at the molecular and animal levels. Ecotoxicol. Environ. Saf. 2020, 202, 110864. [Google Scholar] [CrossRef]
- Soclo, H.; Garrigues, P.; Ewald, M. Origin of Polycyclic Aromatic Hydrocarbons (PAHs) in Coastal Marine Sediments: Case Studies in Cotonou (Benin) and Aquitaine (France) Areas. Mar. Pollut. Bull. 2000, 40, 387–396. [Google Scholar] [CrossRef]
- Sany, S.B.T.; Hashim, R.; Salleh, A.; Rezayi, M.; Mehdinia, A.; Safari, O. Polycyclic aromatic hydrocarbons in coastal sedi-ment of Klang Strait, Malaysia: Distribution pattern, risk assessment and sources. PLoS ONE 2014, 9, e94907. [Google Scholar] [CrossRef]
- De Luca, G.; Furesi, A.; Micera, G.; Panzanelli, A.; Piu, P.C.; Pilo, M.; Spano, N.; Sanna, G. Nature, distribution and origin of polycyclic aromatic hydrocarbons (PAHs) in the sediments of Olbia harbor (Northern Sardinia, Italy). Mar. Pollut. Bull. 2005, 50, 1223–1232. [Google Scholar] [CrossRef]
- Wang, X.-C.; Sun, S.; Ma, H.-Q.; Liu, Y. Sources and distribution of aliphatic and polyaromatic hydrocarbons in sediments of Jiaozhou Bay, Qingdao, China. Mar. Pollut. Bull. 2006, 52, 129–138. [Google Scholar] [CrossRef]
- Ravindra, K.; Sokhi, R.; Van Grieken, R. Atmospheric polycyclic aromatic hydrocarbons: Source attribution, emission factors and regulation. Atmos. Environ. 2008, 42, 2895–2921. [Google Scholar] [CrossRef] [Green Version]
- Liu, W.; Ma, L.; Abuduwaili, J.; Li, Y. Distribution, source analysis, and ecological risk assessment of polycyclic aromatic hydrocarbons in the typical topsoil of the Issyk-Kul Lake Basin. Environ. Monit. Assess. 2017, 189, 1–11. [Google Scholar] [CrossRef]
- Yunker, M.B.; Macdonald, R.; Vingarzan, R.; Mitchell, R.H.; Goyette, D.; Sylvestre, S. PAHs in the Fraser River basin: A critical appraisal of PAH ratios as indicators of PAH source and composition. Org. Geochem. 2002, 33, 489–515. [Google Scholar] [CrossRef]
- Budzinski, H.; Jones, I.; Bellocq, J.; Piérard, C.; Garrigues, P. Evaluation of sediment contamination by polycyclic aromatic hydrocarbons in the Gironde estuary. Mar. Chem. 1997, 58, 85–97. [Google Scholar] [CrossRef]
- Sicre, M.-A.; Marty, J.; Saliot, A.; Aparicio, X.; Grimalt, J.; Albaiges, J. Aliphatic and aromatic hydrocarbons in different sized aerosols over the Mediterranean Sea: Occurrence and origin. Atmos. Environ. 1987, 21, 2247–2259. [Google Scholar] [CrossRef]
- Gereslassie, T.; Workineh, A.; Liu, X.; Yan, X.; Wang, J. Occurrence and ecological and human health risk assessment of pol-ycyclic aromatic hydrocarbons in soils from Wuhan, central China. Int. J. Environ. Res. Public Health 2018, 15, 2751. [Google Scholar] [CrossRef] [Green Version]
- Gschwend, P.M.; Hites, R.A. Fluxes of polycyclic aromatic hydrocarbons to marine and lacustrine sediments in the north-eastern United States. Geochim. Cosmochim. Acta 1981, 45, 2359–2367. [Google Scholar] [CrossRef]
- Baumard, P.; Budzinski, H.; Michon, Q.; Garrigues, P.; Burgeot, T.; Bellocq, J. Origin and Bioavailability of PAHs in the Med-iterranean Sea from Mussel and Sediment Records. Estuar. Coast. Shelf Sci. 1998, 47, 77–90. [Google Scholar] [CrossRef]
- Yang, G.-P. Polycyclic aromatic hydrocarbons in the sediments of the South China Sea. Environ. Pollut. 2000, 108, 163–171. [Google Scholar] [CrossRef]
- Kalf, D.F.; Crommentuijn, T.; van de Plassche, E.J. Environmental Quality Objectives for 10 Polycyclic Aromatic Hydro-carbons (PAHs). Ecotoxicol. Environ. Saf. 1997, 36, 89–97. [Google Scholar] [CrossRef]
- Sun, J.-H.; Wang, G.-L.; Chai, Y.; Zhang, G.; Li, J.; Feng, J. Distribution of polycyclic aromatic hydrocarbons (PAHs) in Henan Reach of the Yellow River, Middle China. Ecotoxicol. Environ. Saf. 2009, 72, 1614–1624. [Google Scholar] [CrossRef]
- Wang, Y.; Mu, J.; Wang, Z.; Yao, Z.; Lin, Z. Aquatic predicted no-effect concentration for three polycyclic aromatic hydrocarbons and probabilistic ecological risk assessment in Liaodong Bay of the Bohai Sea, China. Environ. Sci. Pollut. Res. 2014, 21, 148–158. [Google Scholar] [CrossRef]
- Cao, Z.; Liu, J.; Luan, Y.; Li, Y.; Ma, M.; Xu, J.; Han, S. Distribution and ecosystem risk assessment of polycyclic aromatic hy-drocarbons in the Luan River, China. Ecotoxicology 2010, 19, 827–837. [Google Scholar] [CrossRef]


Publisher’s Note: MDPI stays neutral with regard to jurisdictional claims in published maps and institutional affiliations. |
© 2021 by the authors. Licensee MDPI, Basel, Switzerland. This article is an open access article distributed under the terms and conditions of the Creative Commons Attribution (CC BY) license (https://creativecommons.org/licenses/by/4.0/).