Article

An Overview on Solid Waste Generation and Management: Current Status in Chile

by
Romina Cayumil
1,
Rita Khanna
2,*,
Yuri Konyukhov
3,
Igor Burmistrov
4,
Jumat Beisembekovich Kargin
5 and
Partha Sarathy Mukherjee
6
1
Facultad de Ingenieria & Centro de Investigación Para La Sustentabilidad, Universidad Andres Bello, Santiago 7500000, Chile
2
School of Materials Science and Engineering (Ret.), The University of New South Wales, Sydney, NSW 2052, Australia
3
Department of Functional Nanosystems and High-Temperature Materials, National University of Science and Technology “MISiS”, Moscow 119049, Russia
4
Engineering Centre, Plekhanov Russian University of Economics, Moscow 117997, Russia
5
Department of Technologies Commercialization, L.N. Gumilyov Eurasian National University, Nur-Sultan 010008, Kazakhstan
6
Institute of Minerals and Materials Technology (Ret.), Council of Scientific and Industrial Research, Bhubaneshwar 751013, India
*
Author to whom correspondence should be addressed.
Sustainability 2021, 13(21), 11644; https://doi.org/10.3390/su132111644
Submission received: 14 September 2021 / Revised: 8 October 2021 / Accepted: 12 October 2021 / Published: 21 October 2021
(This article belongs to the Special Issue Environmental Sustainability of Current Waste Management Practices)

Abstract

:
The widespread generation of, ever increasing volumes of and the sustainable management of solid wastes are global issues of great concern. Due to wide variations in composition and associated complexities, significant efforts are required for their collection, processing and environmentally safe disposal in a cost effective manner. An overview of solid wastes is presented in this article with a specific focus on municipal solid wastes and industrial waste from the iron/steelmaking and aluminium industries. Key waste issues such as its sources, compositions, volumes, the factors affecting waste generation and waste processing are first discussed, followed by a further discussion regarding recycling, resource recovery, disposal and the associated environmental impacts. In a special case study, waste generation and management in Chile is presented in greater detail. Detailed information is provided on government initiatives and legislation for integrated solid waste management and its movement towards a circular economy. Measures include regulations on waste management framework which concerns the transboundary movements of hazardous wastes, persistent organic pollutants, the closure of mining activities and installations and restrictions on plastics disposal. With Chile being world’s largest producer of copper, significant efforts for mining waste management, its infrastructure and procedures are being put in place to reduce the environmental impact of the mining sector and its associated waste generation.

1. Introduction

Solid waste management is a global issue affecting individuals, communities and governments in most countries. Poor and inadequate waste management decisions can affect daily health, cleanliness and productivity, thereby affecting economic development at all levels of society. Some of the issues include the contamination of oceans, flooding, clogged drains, respiratory diseases, airborne particulates, waste consumption by animals and air and land pollution. The growing level of prosperity, rapid urbanization and population growth has led to increases in the per capita generation of waste. In addition, waste management is often administered by local authorities with limited capacity for management, operational monitoring and financial resources. It has been estimated that every year, over a billion tonnes of waste are produced globally. This number continues to rise for most nations with data reported in 2018 at: East Asia and the Pacific (468 MT); Europe and Central Asia (392 MT); South Asia (334 MT); North America (289 MT); Latin America (231 MT); Sub-Saharan Africa (174 MT) and Middle east and North Africa (129 MT) [1,2]. Unless urgent action is taken on several waste management fronts, global waste generation rates may increase to 20 billion tonnes/year by 2050.
Due to the wide variation in waste composition and characteristics, different types of solid wastes can be classified as: Municipal Solid Waste (MSW), Industrial Waste (IW), Agricultural Waste (AW), Construction and Demolition Waste (C&DW), Hazardous Waste, Medical Waste and Electronic Waste (e-waste). The world-bank has reported that high-income countries, with a population of 16% of globe inhabitants, produce approximately 34% of the planet’s waste [3]. Table 1 summarizes the amount of different wastes generated per capita per day worldwide. The largest quantities of wastes were found to be industrial types of waste (12.73 kg), followed by agricultural waste (3.35 kg). Further, there was an estimated 1.68 kg of C&D waste, 0.74 kg of MSW produced globally, followed by 0.32 kg of hazardous waste, 0.25 kg of medical waste, and 0.02 kg of e-waste [4].
Through a focus on solid waste generation and management, this article is organized as follows: an overview of different types of wastes is presented in Section 2 along with detailed statistics on two major solid wastes, namely, municipal solid waste and industrial waste from key metal processing industries. The complexities associated with these wastes including their composition, generation, collection, volumes, recycling methods, disposal and environmental impact will be discussed in the global scenario. Section 3 focusses on the practical realities of solid waste management in Chile, serving as a representative example. With a population of over 18 million and a total area 756,000 km2, this South American country borders the South Pacific Ocean to the west with a coastline of over 6000 km long. Around 90% of the population lives in urban areas, primarily in the metropolitan area of Greater Santiago. Chile is among Latin America’s fastest-growing economies in recent decades, enabling the country to significantly reduce poverty. Chile is gradually moving to a circular economy through legislation, long-term plans and the provision of funds from public and private entities and has demonstrated a financial implementation of these objectives.

2. Generation, Management and Disposal of Solid Wastes: A global Overview

2.1. Municipal Solid Waste (MSW)

2.1.1. Sources and Composition

Municipal solid waste represents the typical waste generated by households, offices, commercial shops, hotels, schools and other institutions. The major contributors are food waste, paper, plastics, metal, yard waste, cardboard and packing waste glass. It can also include some demolition and construction debris along with small amounts of hazardous and chemical waste, e.g., electric light bulbs, batteries, automotive parts, discarded medicines and chemicals. An overview of the typical sources of MSW and its constituents are given in Table 2 [5].
Typical proportions (wt. %) of different MSW components are estimated as: Food waste (25–35); Paper (25–35); Plastics (7–10); Ferrous metals (3–5); Non-ferrous metals (0.5–2); Glass (5–10); Yard waste (10–15); Hazardous waste (1–2) [6]. In middle- and low-income countries, organic waste accounts for more than 50% of the total MSW generated. In high income countries, this percentage reaches 32%, approximately. Recyclable materials range from 10% in low income countries and up to 50% in high income countries. Recovery and recycling of wastepaper has seen a significant increase among the recyclables over time. In high-income countries, one third of the total amount of waste produced is presently recycled or composted [7]. Table 3 summarizes the generation of MSW for different global regions along with projected increases by 2050.
In 2016, the largest amounts of MSW were generated in the East Asia and Pacific Region, with the region generating 468 million tonnes, representing 23% of the total amount of MSW. Waste generation from Sub-Saharan Africa is expected to increase three times by 2050, reaching 516 million tonnes, followed by South Asia with 661 million tonnes by 2050, doubling on the 334 million tonnes produced in 2016. The Middle East and North Africa region will also double their waste by 2050, with an estimated amount of 255 million tonnes. The problem here not only lies with continuously increasing waste volumes, but also with inadequate waste disposal and management [7].

2.1.2. Factors Influencing MSW Generation

Several factors that affect the volume of MSW that is generated includes population growth, income levels, immigration, industrial and economic development. While population growth is considered to be a critical factor influencing MSW generation [8], EPA has also highlighted income and tax revenue as key factors; electricity consumption was another compelling factor [9,10]. Sukholthaman et al. found that MSW generation tended to increase with increasing levels of gross domestic product (GDP) and the consumer purchase index [11]. Liu et al. have reported on the impact of consumption patterns on the generation of MSW in China [12]. These researchers investigated the impact of economic development and consumption levels on MSW generation. The highest levels of MSW generation were found to exist in medium to low economic consumption groups. Developing regions with large development potential had fast economic growth rates and generated more MSW compared with developed regions with marginal growth in MSW generation. These findings have been summarized in Table 4 [13].

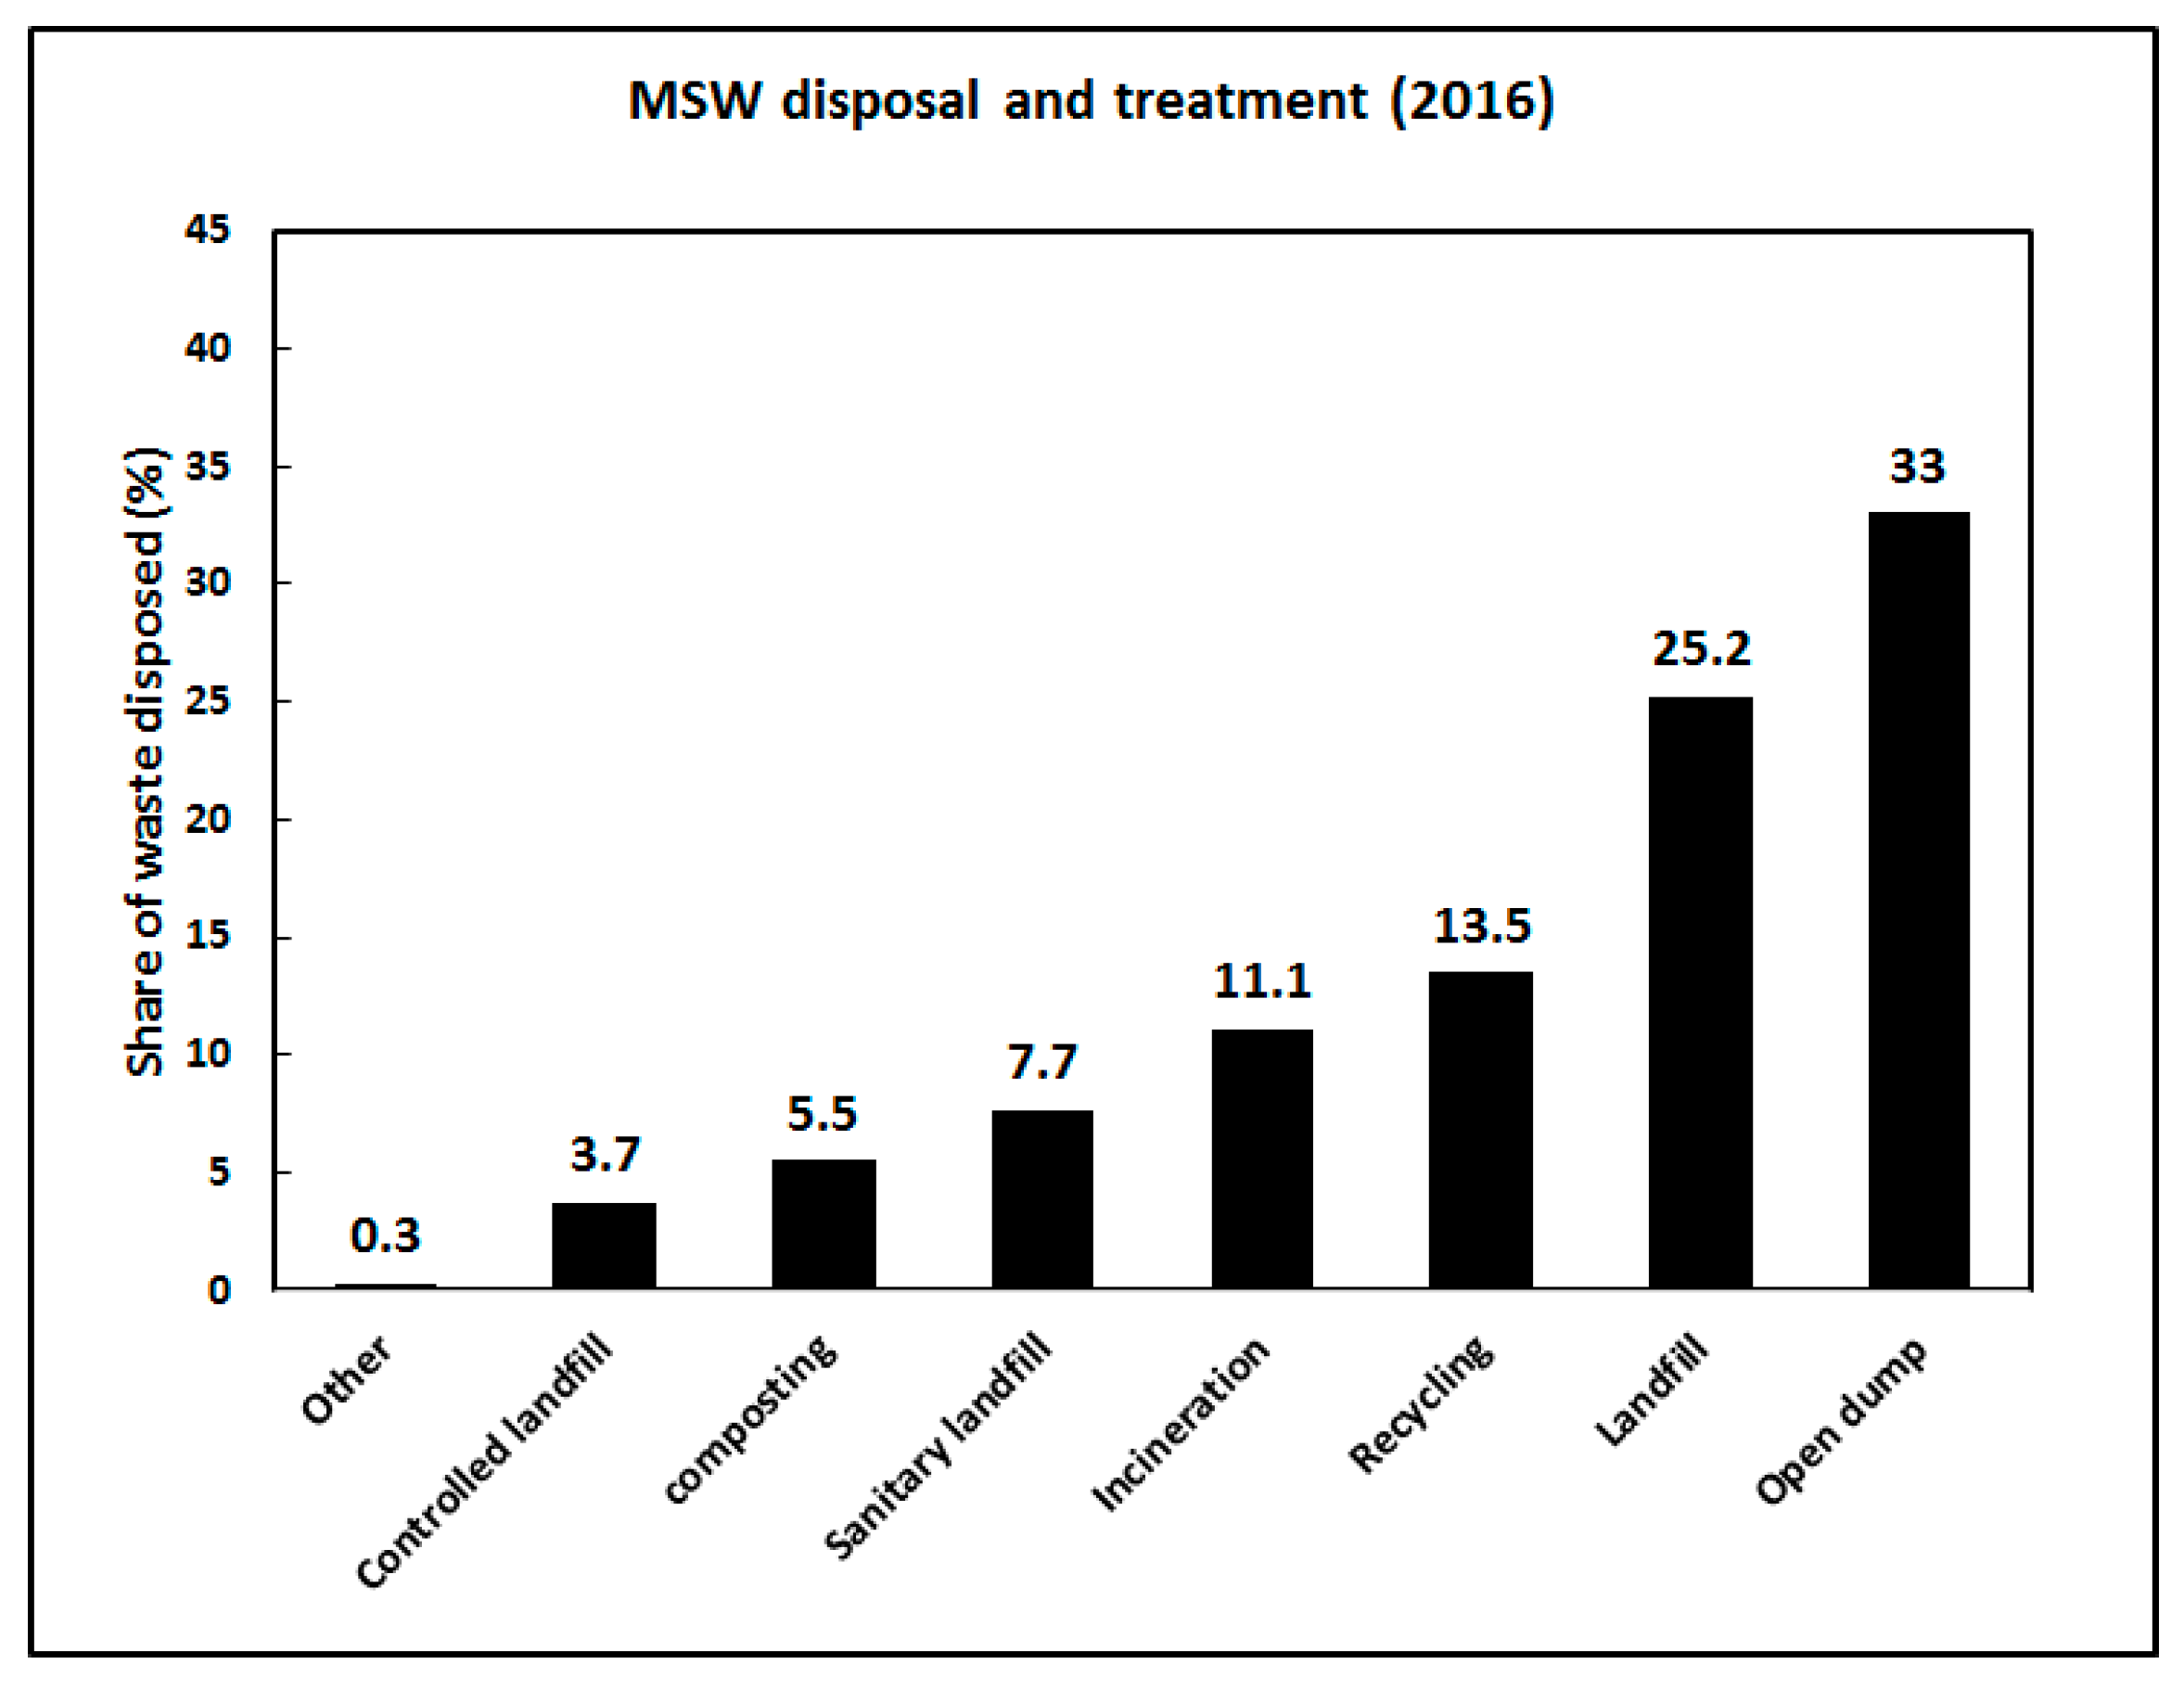
2.1.3. Waste Collection and Disposal

In urban areas, MSW collection and transport involves its storage at the generation source and at pick-up points, its collection by crews/trucks driving around the neighbourhood and finally its transport to a disposal station. The collection of MSW is difficult, complex and costly, accounting for up to 60-80% of the total solid waste budget of a typical community. In residential areas, the most common collection methods are via the kerb, an alley or through backyard carry. In a kerb or alley service, the residents carry plastic bags and/or containers to the kerb or collection point and collect the empty container at a later point. The collection of MSW occurs once or twice per week in most communities. Wang et al. have reported on the rural solid waste management in China, observing that the rural solid waste collection services, facilities and equipment were often of a lower quality [14]. High costs and the inconsistent employment of waste collection workers were found to be unsustainable, and hindered the overall quality of waste collection services [15].
The various materials are separated either by the users at the source or separated from the mixed refuse at a central processing facility. Material separation at the source involves separating the material into different components followed by their transportation. Waste separation at the source is carried out by using separate bins for the biodegradable fraction and the recyclables and hazardous waste materials. The active household response for waste separation has generally been quite poor. The separation of material in MSW usually occurs at a central facility. The organic material is shredded and processed through air classifiers, which separate the desired components for further processing and recycling and for classification as a material or an energy resource. For handpicking, a conveyor moves the solid waste along a group of workers who collect a few of the larger components by hand. A mechanized material recovery method utilizes shearers to break open the bags and trammel screens to separate cans, glass and other inorganic material. Magnetic and electromechanical systems are used for separating ferrous and non-ferrous metals.
An overview of waste disposal methods in the USA is shown in Figure 1 [16]. It is estimated that 75–80% of total MSW generated is collected and only 22–28% is processed and treated. A significant proportion of the collected waste is often dumped indiscriminately, clogging the drains and sewer systems [17]. Additionally, due to imperfect waste infrastructure and recycling systems, the recycling rates of MSW in developing provinces are low. All these factors suggest the generation of large MSW volumes in the near future in developing provinces. In contrast, the developed regions have a stable economic development rate and high recycling efficiency rates of MSW. From the perspective of waste clearance volumes, the developed regions will generate less MSW than developing provinces in the near future [18].

2.2. Industrial Waste

Industrial activities such as manufacturing processes, mining operations, construction, demolition and the operation of factories produce waste products in the form of materials that have been rendered useless and are no longer required. Industrial wastes include masonry and concrete, dirt and gravel, scrap metal, chemicals, oil, solvents and scrap lumber. Industrial waste can either be solid, semi-solid or liquid in form; they may be hazardous and toxic or may be a non-hazardous waste. Hazardous wastes include, among others explosive wastes, flammable solid wastes, wastes liable to spontaneous combustion, wastes that emit flammable gases on contact with water, oxidising wastes, organic peroxide wastes, infectious wastes and corrosive wastes. [19]. Industrial waste is sometime mixed into municipal waste, making the conduction of accurate assessments difficult. Such waste can pollute the adjacent soil or water bodies thereby contaminating groundwater, rivers or coastal waters [20]. An estimated 7.6 billion tonnes of industrial waste was produced in the USA in 2017. In this overview, we focus our attention on the leading metal processing industries, namely the iron and steelmaking sector and the aluminium industry and the associated waste management.

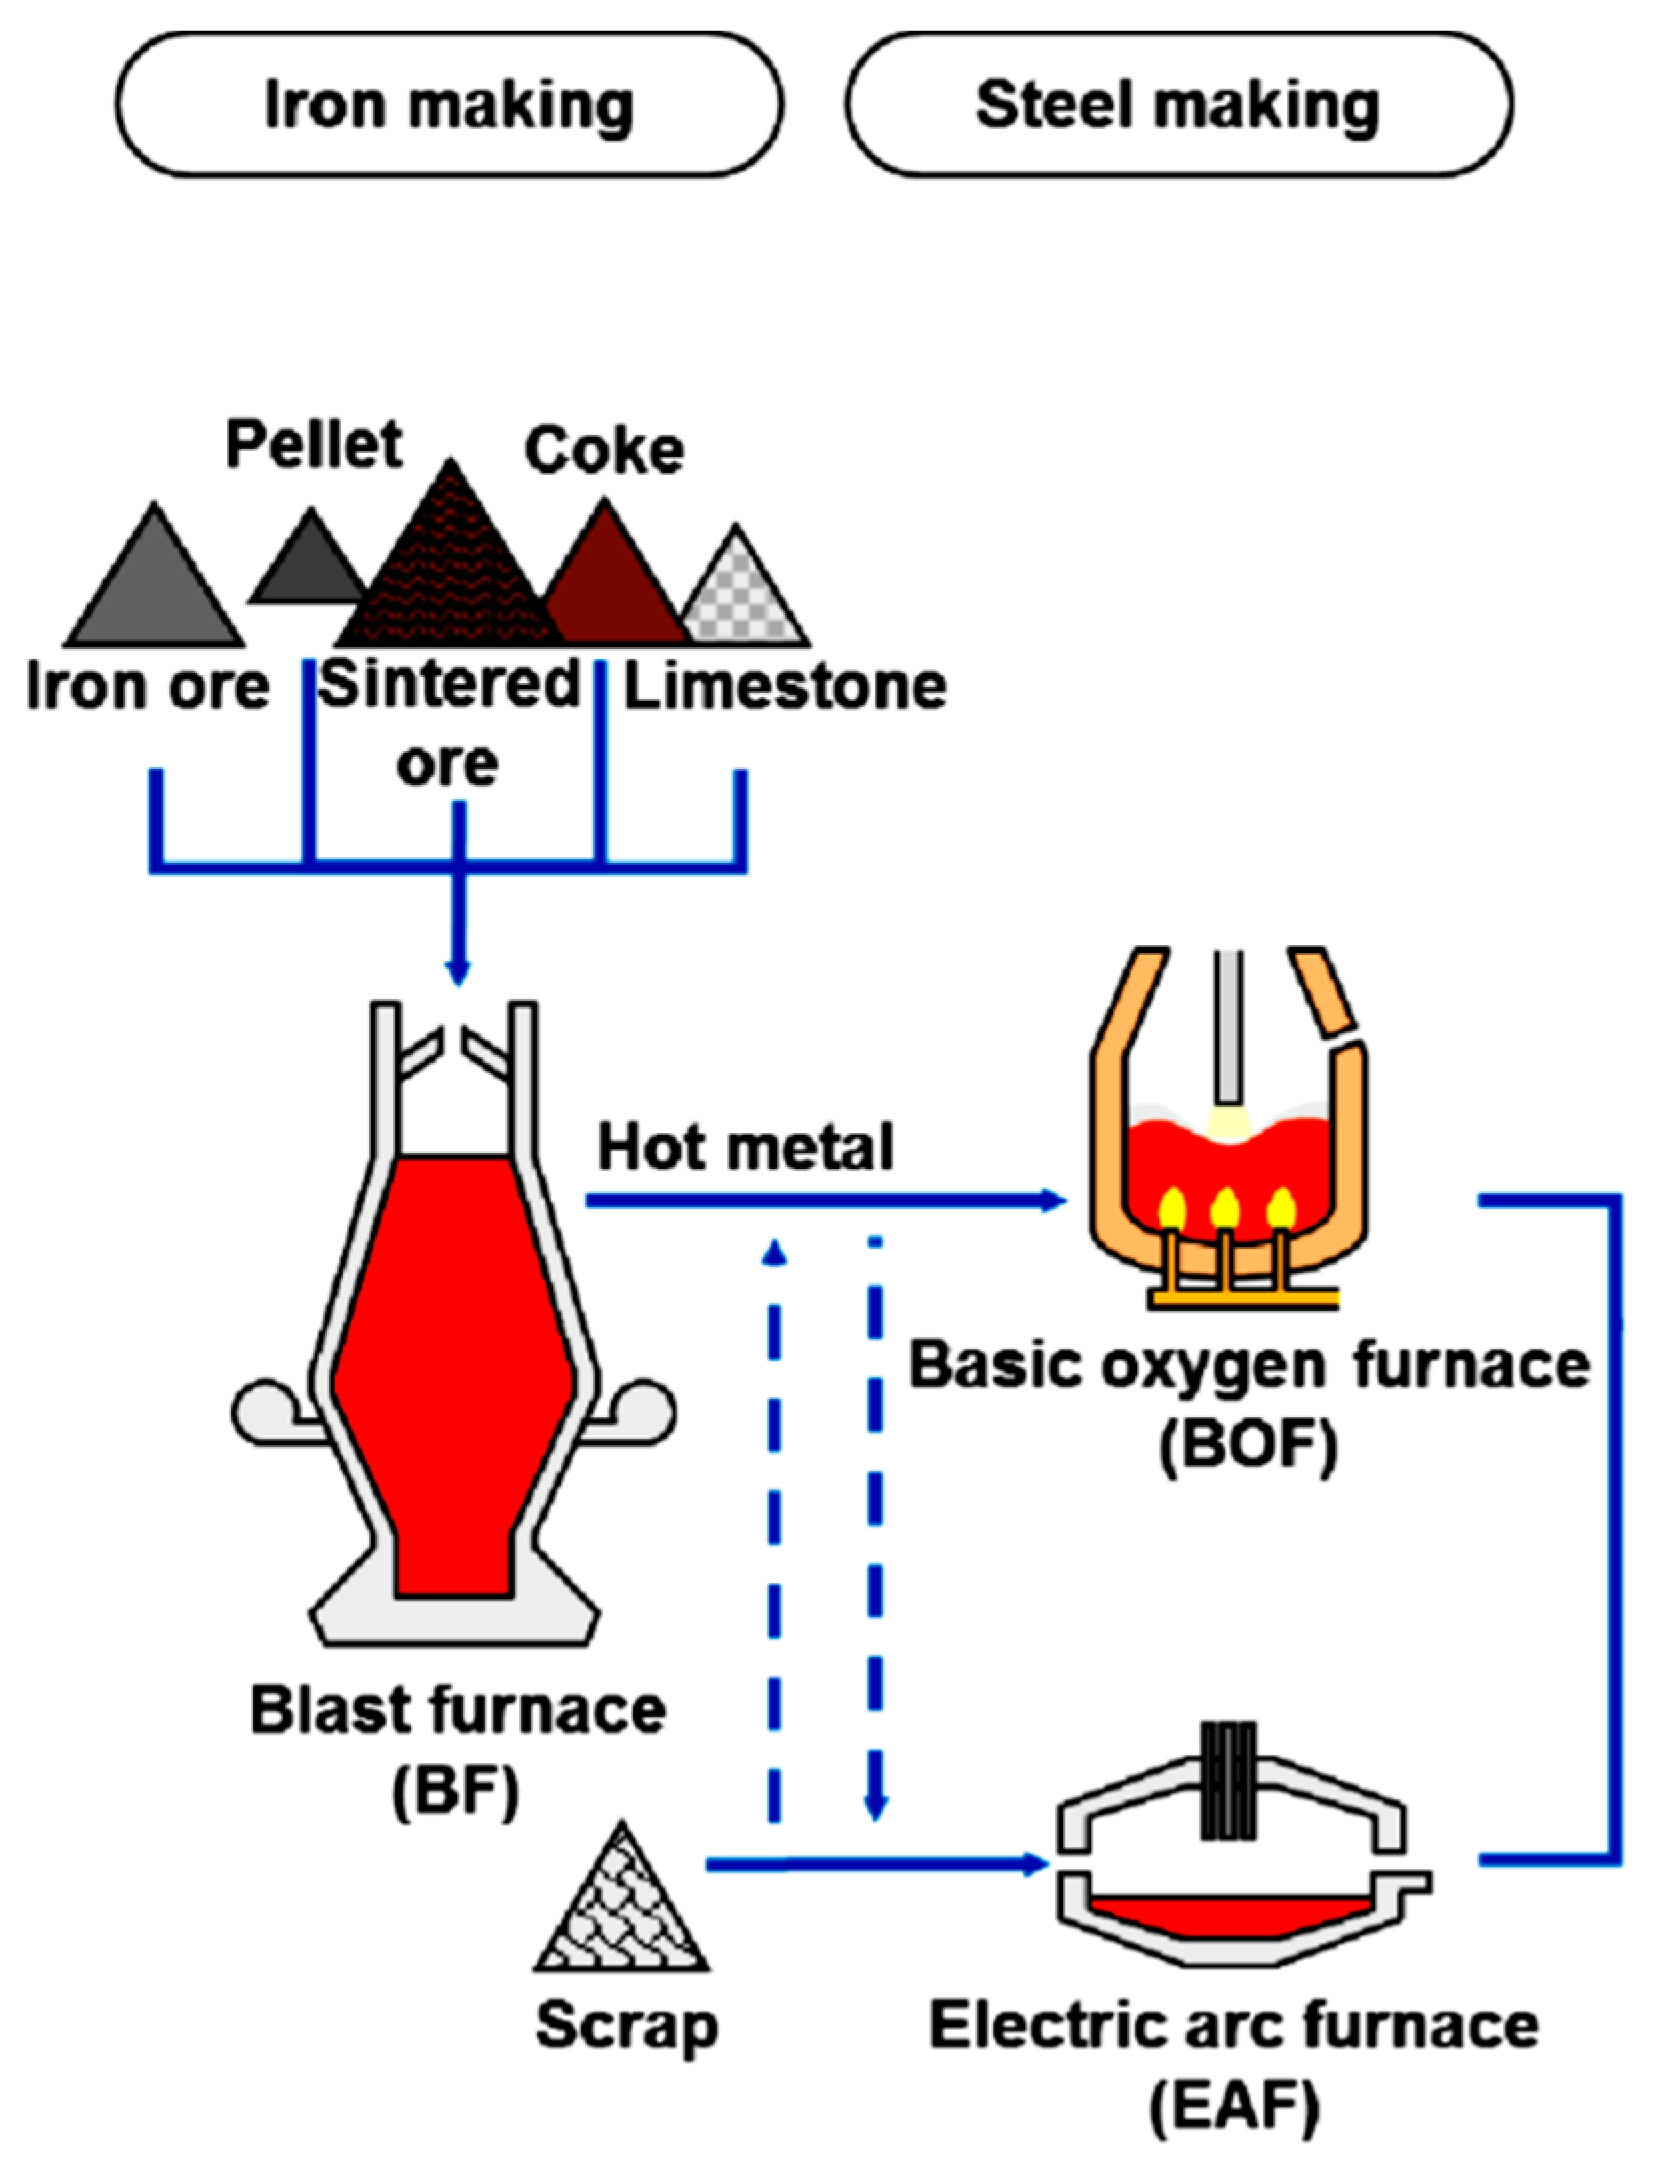
2.2.1. Iron and Steelmaking Sector

With the ability to adapt to changing conditions regarding raw material availability, energy resources and hot metal demands, ironmaking technology has achieved a high degree of excellence. New challenges, especially with respect to the environment and CO2 emissions, are the main drivers for technological progress in the 21st century. Steel consumption worldwide is increasing steadily, as is its impact on the environment through energy consumption. Steel provides a key input for other industrial sectors that produce items essential to the functioning of the wider economy, e.g., automobiles, trains, aircrafts, hand tools, complex factory machinery and countless other items.
The industry is continuing to expand, with the application advanced high–strength steels for transport systems, bridges, pylons, construction sector, infrastructure, housing, manufacturing, agriculture and energy [21]. As a permanent material that can be continuously recycled without losing its properties, steel is fundamental to a successful circular economy. The steel industry amounts for 10.7% of national GDP in the USA. Furthermore, China accounts for 31% of steel’s value-added contribution, with the USA and Japan accounting for 11% and 10% respectively [22]. The global steel production in 2020 is shown in Table 5, along with the production levels of the top five countries.
During the process of ironmaking, the iron ore is converted into different types of iron through several processes (Figure 2). The blast furnace is the most commonly used process and produces pig iron which composed of around 92-94% of iron and 3-5% of carbon along with smaller amounts of other elements. However, pig iron has limited uses, and most of this iron arrives at steel mills, where it is converted into various steel alloys by reducing the carbon content and adding other alloying elements to acquire steel specific properties. Steelmaking uses both recycled materials as well as pig iron from the blast furnace. Both basic oxygen steelmaking (BOS)/ basic oxygen furnace (BOF) and electric arc furnace (EAF) account for virtually all steel production in the world.
This industry focuses on reducing raw material consumption and reusing the waste produced in various iron/steelmaking operations. In the 1970/1980s, modern steel plants generally required 1.44 tonnes of raw material to produce 1 tonne of steel; this number has been reduced to ~1.15 tonne of inputs to make 1 tonne of steel as of 2020, thereby achieving a 21%reduction. However, more than a billion tonnes of waste was produced by the iron and steel sector in 2020, largely due to a significant increase in overall steel production. A brief overview of major solid waste products produced during various iron/steel production processes is provided along with techniques used for their disposal in the next section [23,24,25,26,27].
Coke making—These wastes include coal dust, coke dust, tar sludge and acid sludge. Coal dust is recycled through the coal blend and/or by its addition to the sinter charge mix. Tar sludge is added to the coal blend to improve its density. Acid sludge has to be neutralized before its disposal.
Sinter making—The solid wastes generated are dusts and sludges. Dusts are generated at the sinter machine building’s floors, in cyclones and the ESP (Electrostatic precipitator). Sludge is generated at the clarifier of the water treatment plant. These materials are recycled back into sinter making, either by blending them with iron ore fines or briquetting.
Pellet plant—The major wastes here are dusts and undersized green pellets. These wastes are generally reused as pellet feed materials.
Blast furnace iron making (BF)—The generated wastes include dusts, burden screenings at the stock house, cast house runner jams, cast house muck, blast furnace slag, flue dust, sludge, refractory waste and hot metal ladle skulls. Dusts and burden screenings are recycled into sinter making by blending them with the iron ore fines in the raw material yard or by being briquetted. Cast house runner jams are either sold as iron scrap for re-melting or recycled in the steel melting shop. Cast house muck is dumped as land-fill material. The air-cooled BF slag is either dumped at landfills or used for road repairs within the steel plant. Refractory waste is reused by the refractory manufacturer in the manufacture of mortars.
Iron making by direct reduction (DRI)—The main solid wastes are char, dusts (both coal and iron) and under sized and reject DRIs. Coal dusts and chars are used in the power plants as fuel for the boiler. Iron dust can also be sold to the cement manufacturers. Under-sized DRIs are briquetted and used in a steel melting shop; DRI rejects are recycled back into the process.
Basic oxygen steel making (BOS)—The main solid wastes include converter slag, scrap, waste refractories, converter muck and gas cleaning plant sludge. Most of these waste materials are produced in a mixed condition, therefore extensive sorting is required prior to their recycling. The plant sludge is dried and blended with the iron ore fines as raw material and are briquetted and reused in sinter making. The converter slag is recycled as a replacement for limestone in the sinter mix. The converter slag can also be used in road repairs, as railway track ballast and as soil conditioner. Scrap and refractory wastes from the converter muck are removed and a balance is used for landfill. There are two types of refractory wastes: magnesium carbon refractories from converter linings, and the other types are from refractory ladles. Alumina based refractory wastes can be used for manufacturing mortars.
Electric Arc Furnace (EAF) steel making—The typical waste products include GCP dust, slag, scrap and waste refractories. Presently, there is not a well-established method for recycling EAF slag. The grinding and processing of EAF is energy intensive due to its high iron oxide content. It has been used for making roads and ceramic tiles.
Other solid waste contributions come from continuous casting, rolling mills and lime calcining, which primarily includes casting scales, refractory scrap, slag, muck, mill scale, limestone and dolomite screenings, lime dust and lime fines.

2.2.2. Aluminium Sector

Currently, aluminium (Al) is the second most widely used metal in the world. To meet the needs and challenges of the 21st century, the production of Al has increased form 1000 tonnes in 1900s to 58 million tonnes in 2016. Being strong, lightweight and durable, Al is increasingly used in the transport sector towards the aim of a partial replacement of steel, which is heavier. A high strength-to-weight ratio means it is particularly useful as a structural material, weighing around 65% less than steel. Lightweight Al also contributes to an increased fuel economy in vehicles from cars to armored tanks. Aluminium is extremely important for the aviation sector, e.g., Airbus A380 uses up to 66%Al in its airframe and a Boeing 747 can use up to 75 tonnes of Al. There is a significant usage of Al in the shipping sector including in military applications, in building and construction, for domes for gymnasiums, schools, storage facilities, industrial roof systems, multi-purpose arenas, packaging, aluminium cans, food containers, wrapping foils, etc. [28]. The global production of aluminium is summarized in Table 6 [29].
Bauxite is a key aluminium ore containing ~30–54% alumina (Al2O3) along with mixtures of silica, iron oxides, titanium dioxide and several impurities. Around 95% of Al is produced from bauxite ore using the Bayer’s process worldwide. In the Bayer process, bauxite is washed in a hot solution of sodium hydroxide, which leaches Al in the form of Al(OH)3; it is later calcined to form Al2O3. Red mud (RM), also known as bauxite residue, is a solid waste biproduct of the alumina recovery process. Producing one tonne of alumina consumes up to 2–3 tonnes of bauxite and generates ~0.4–2 tonnes of RM depending on the source/location of the ore; the global average of RM produced is 1.3 tonnes per tonne of alumina [30,31].
Global bauxite resources are estimated to be ~55 to 75 billion tonnes with reserves in Africa (32%), Oceania (23%), South America and the Caribbean (21%) and Asia (18%). With the production of primary aluminium increasing to 47 million tonnes, an estimated 150 million tonnes of RM are being produced in various aluminium plants across the world [32]. The nearly 3 billion tonnes of RM, presently stored in vast waste reserves, represents large industrial waste scenarios around the globe [33]. Several red mud incidents in different countries have also been tabulated in various publications [34].
The Hall–Héroult process is the main process used for smelting aluminium, and involves dissolving alumina in molten cryolite, and electrolyzing the molten salt bath in a purpose-built cell. The electrolysis takes place at 940–980 °C and produces 99.5–99.8% pure aluminium [35,36]. An aluminium smelter produces 40–60 kg of mixed solid wastes per tonne of product, with spent cathodes, spent pot, cell linings comprising the major fraction of waste. The linings consist of 50% refractory material and 50% of carbon. Over the useful life of the linings, the carbon becomes impregnated with aluminium and silicon oxides (averaging 16% of the carbon lining), fluorides (34% of the lining), and cyanide compounds (about 400 ppm). The contamination levels in the refractories element of failed linings are generally low. The other by-products for disposal include skim, dross, fluxing slags, and road sweepings [37,38,39].
Extensive efforts have been made to process, recycle and reutilize red mud waste. Key challenges in processing RM include high alkalinity (pH: 10–13), small particle sizes (≤75 µm), large volumes and high transportation costs [40,41]. Landfilling and dumping around the industrial plants have been the standard practice worldwide. Vast amounts of stockpiled RM can also be toxic and very hazardous [42]. Deep sea dumping and storage in ponds has also been attempted. Poorly designed storage dams are likely to fail under certain circumstances, resulting in local and environmental contamination. Many efforts are being made to find economically viable and environmentally sustainable solutions to the RM problem. However, most options can only accommodate for a small fraction of the red mud generated globally [43].
The recycling of aluminium requires only 5% of the energy necessary to smelt it from the alumina and a small fraction of greenhouse gases are emitted during aluminium recycling compared with the production of primary aluminium. Properly treated and sorted aluminium scrap can be used to produce different types of goods at low cost given that these scraps already contain some of the alloying elements required for certain applications. Aluminium recycling plants can be found all over the world, but are significant concentrated in Europe, the USA and Japan [44,45].

3. Waste Management in Chile: Current Status

Chile is gradually moving toward a Circular Economy (CE) system. The evolution towards sustainable development and CE is taking place in conjunction with legislation, long-term plans and funds, support and financial implementation from public and private entities. The current national situation regarding waste management and the new Waste Management Framework has encouraged the processing of copper mining tailings and prohibited the commercial use of plastic bags. While Chile has a wide variety of resources, mineral resources are the most valuable in economic terms as the national economy is, to a great extent, driven by the mining sector. A wide variety of wastes are generated by the diverse industries in the country. National laws classify waste residues depending on their nature as hazardous waste or non-hazardous waste. The non-hazardous waste is further categorized into industrial waste (IW), municipal solid waste (MSW) and sewage sludge (SS). According to the Chilean Ministry of the Environment, 19.6 million tonnes of total waste were generated in 2018, 97.3% of which were non-hazardous waste. These figures do not include radioactive residues, gangue, low grade minerals, leaching gravel, tailings or slags produced in mineral processing. [46].
This section presents the current status of waste management in Chile and the initiatives towards a more sustainable economy. Waste management activities, waste characterization, regulatory measures, challenges and opportunities and initiatives towards a circular economy will be discussed.

3.1. Waste Management: Legislations and Regulations

All countries need to develop a common criteria for the environmental management of waste residues, technical guidelines, regulations with respect to environmental requirements, a holistic management criteria for the minimization of waste generation, and their application during the productive cycle towards clean technologies and circular economy [47]. Chile is a signatory to several international conventions and agreements on waste management and sustainable development. Some of the efforts made by Chile include:
Chile is a member of the OECD, United Nations and The Southern Common Market (MERCOSUR for its Spanish abbreviation), all committed to promote sustainable development. Chile has also subscribed to the Basel Convention as well as to the Stockholm’s agreement. Basel Convention establishes mandatory actions for hazardous waste management and appropriate disposal as well as legislation for transboundary movement of waste [48]. The Stockholm convention provides an agreement to protect both human health and the environment from harmful persistent organic pollutants (POP’s) [49]. Chile is devoted to eliminating or minimizing the release of POP’s to the soil, water and air [50].
The Latin American Agreement of Environmental Management of Special Residues and After Use Responsibility” (Acuerdo de Gestión Ambiental de Residuos Especiales y Responsabilidad Post Consumo), signed during the fourth extraordinary meeting of MERCOSUR’s Ministries of the Environment, established the commitment to incorporating production patterns and sustainable consumption, with the objective of minimizing the quantity and harmfulness of waste generated [51]. This agreement also established the term “special residues of universal generation waste” based on their environmental impact, hazardous characteristics, risks or potential harmful damage to the environment; such wastes require special environmental management and need to be separated from other residues. Universal wastes include hazardous wastes produced by the households and several businesses including televisions, computers and various electronic devices, batteries, fluorescent lamps, mercury thermostats, mercury containing equipment.
The policy of integrated solid waste management was promulgated in 2005 with the objective to ascertain that all activities related to the management of solid wastes should be carried out with minimal risks for human health and the environment. The following regulatory procedures have been developed for managing and for the disposal of hazardous electronic waste: Law 19,300 provides the general basis for the environment [52]; the Basel Convention concerns the transboundary movement of hazardous waste and its elimination; Law 20,920 concerns Waste Management Framework, Extended Producer Responsibility (EPR) law [53]; and promotion for the recycling law, sanitary standard DS 148, provides regulations for recycling funds [54], among others.

3.2. Waste Management Initiatives

The Chilean government has undertaken several campaigns to increase awareness about recycling. The plan “Santiago recycles” began in 2017, and is believed to be one of the most ambitious projects concerning reuse in the country. With a budget of ~5 million euros, the aims of the project were to educate people, build waste management facilities and to make Santiago a more sustainable city [55]. The implementation of the Waste Management Framework has provided formal pathways to the producers of lubricants, electric and electronic equipment, batteries, packaging, and rubber tires on their management during the manufacturing process, commercialization, and at their end-of-life, encouraging their use as a resource elsewhere. Extended producer responsibility (EPR) has increased activities to appropriately manage and process these types of wastes. A number of private entities have started businesses for collection and storage, while other companies use these components as B grade raw materials for reuse while minimizing the environmental impact [56].
To avoid the contamination of land and the ocean, a law was approved in 2018 prohibiting the commercial use of plastic bags in the whole territory, with Chile being the first country in Latin America that prohibits plastics use. In 2019, the campaign to reduce single use plastics was launched, particularly plastic straws, and also a campaign to avoid cigarette butts being disposed of in public spaces and/or directly in the soil. The creation of the Circular Economy Office in the Ministry of the Environment was the result of all the actions adopted in waste minimization, management, valorization and recycling [57]. These measures, however, did not include the waste produced by the mining industry. Two key wastes, namely MSW and mining waste, will be discussed in the following sections.

3.3. Municipal and Industrial Wastes

Chile, considered a relatively high-income country, has a population of ~19 million inhabitants. The average generation of MSW per day per capita in Chile is about 1.15 kg, slightly higher than the world’s average of 0.74 kg waste per capita [58]. Of the overall amount of MSW produced, 44.9% of MSW was generated in the metropolitan region of Santiago, the capital city of Chile which is home to 41.1% of the country’s population. Considerably lower levels of MSW were produced by the Valparaíso, Bío-Bío and Coquimbo regions, accounting for 10.6%, 9.3% and 5.2%, respectively. Approximately 8 million tonnes of MSW is generated in Chile every year; the waste collection rate is almost 100%; the volume of waste rose by 30% during the period 2000–2010.
Household waste is generally collected door-to-door in plastic bags, whereas recyclables are primarily collected at central collection points equipped with containers. Kerb-side collection is still quite limited, with household waste collected on the kerb-side and then transferred into the rear of a compactor truck [59]. The overall efficiency and cost effectiveness is limited as not all citizens are regularly serviced, leading to negative impacts on the environment and the society. The waste is mainly composed of food and green waste, which accounts for 58% of the total waste generated. The remaining waste includes dry recyclables, paper and cardboard (13%), plastics (12%), glass (4%), metal (3%), and up to 15% of organic waste. Approximately 50% of the waste is disposed in sanitary landfills, however, the use of open dumps account for ~27% of disposal and processing. A further 15% of the MSW is transferred to controlled landfills. The normal collection system transports all the mixed waste to a transfer station or to a landfill [60].
Because they comprise a relatively small fraction of the overall waste, hazardous waste, medical waste and e-waste are generally disposed of along with MSW. Only 5% of the MSW is sent to recycling facilities and less than 1% waste is composted due to limited material separation. Recycling and composting are still emerging treatments and the extent of their usage varies significantly across the country. A new strategy proposes recycling up to 66% of organic waste by 2040, by reducing the level of organic waste produced encouraging its separation in houses, offices, schools and markets, and through the use of infrastructure, equipment and logistic systems that allow the organic residues to be used as a resource in the production of soil enhancers and electric or thermal energy [61,62].
Several methods and recovery systems are currently used in Santiago for recycling the organic fraction of MSW. These include sorted collection at source, separation at source for drop-off collection and sanitary landfills. [63]. Sorting prior to collection at the source involves the sorting of recyclables at home before collection by a municipal service or by informal collectors. Currently, only three municipalities offer a formal sorted collection system; Vitacura and Nuñoa collect dry recyclable waste with a mixed bank collection system, and La Pintana collects kitchen waste with a sorted waste bank. Informal collectors, numbering in excess of 60,000 collect around 2-10 tonnes/month/person of recyclables, and account for ~76% of the total recyclables collected [64]. Project Santiago Recycles introduced the separation of recyclables at the origin for their drop-off collection at solitary bell-shaped container stations associated with charity institutions, and ‘clean point’ stations with a larger drop-off area for containers of different types of recyclable waste. Recycled waste collected at the largest clean point in Santiago experienced a156% increase between 2009 and 2014. In 2009, there were three sanitary landfills in Santiago and two transfer stations; several dumpsites have been closed in the metropolitan region.
Among the key productive sectors of the Chilean economy are the manufacturing industry, electricity, gas and water supply, livestock industry, agriculture, mining, the wood industry and the fishing industry. As reported by the ‘Ministry of Environment’ 10.5 million tonnes of non-hazardous industrial waste was generated in 2018 representing ~50% of the total waste produced. The manufacturing industry was the largest waste producer, producing 4.2 million tonnes, followed by the electricity, gas and water supply industry which produced 2.2 million tonnes. The construction industry, real-estate activity sector and commerce respectively produced 0.67, 0.67 and 0.61 million tonnes of waste. The agriculture, livestock, hunting and forestry sectors produced total of 0.61 million tonnes of waste. Smaller amounts of waste were generated by the fishing, small mine & pit, transport, storage & communication sectors, which produced 0.48, 3.61 and 0.3 million tonnes, respectively. A further 0.2 million tonnes of waste were produced by other sectors. Regarding sewage sludge, a 57.8% was generated in the metropolitan Santiago area, which amounted to 198,000 tonnes in 2018. The amount of hazardous waste increased considerably between 2006 and 2018 from 26,840 tonnes (in 2006) to 612,427 tonnes (in 2018) [46,65,66]. This waste was mainly produced in the Antofagasta region, and the Metropolitan region. The large amounts generated in the Antofagasta region, located in the north of Chile, can be attributed to mining activities and other associated services.

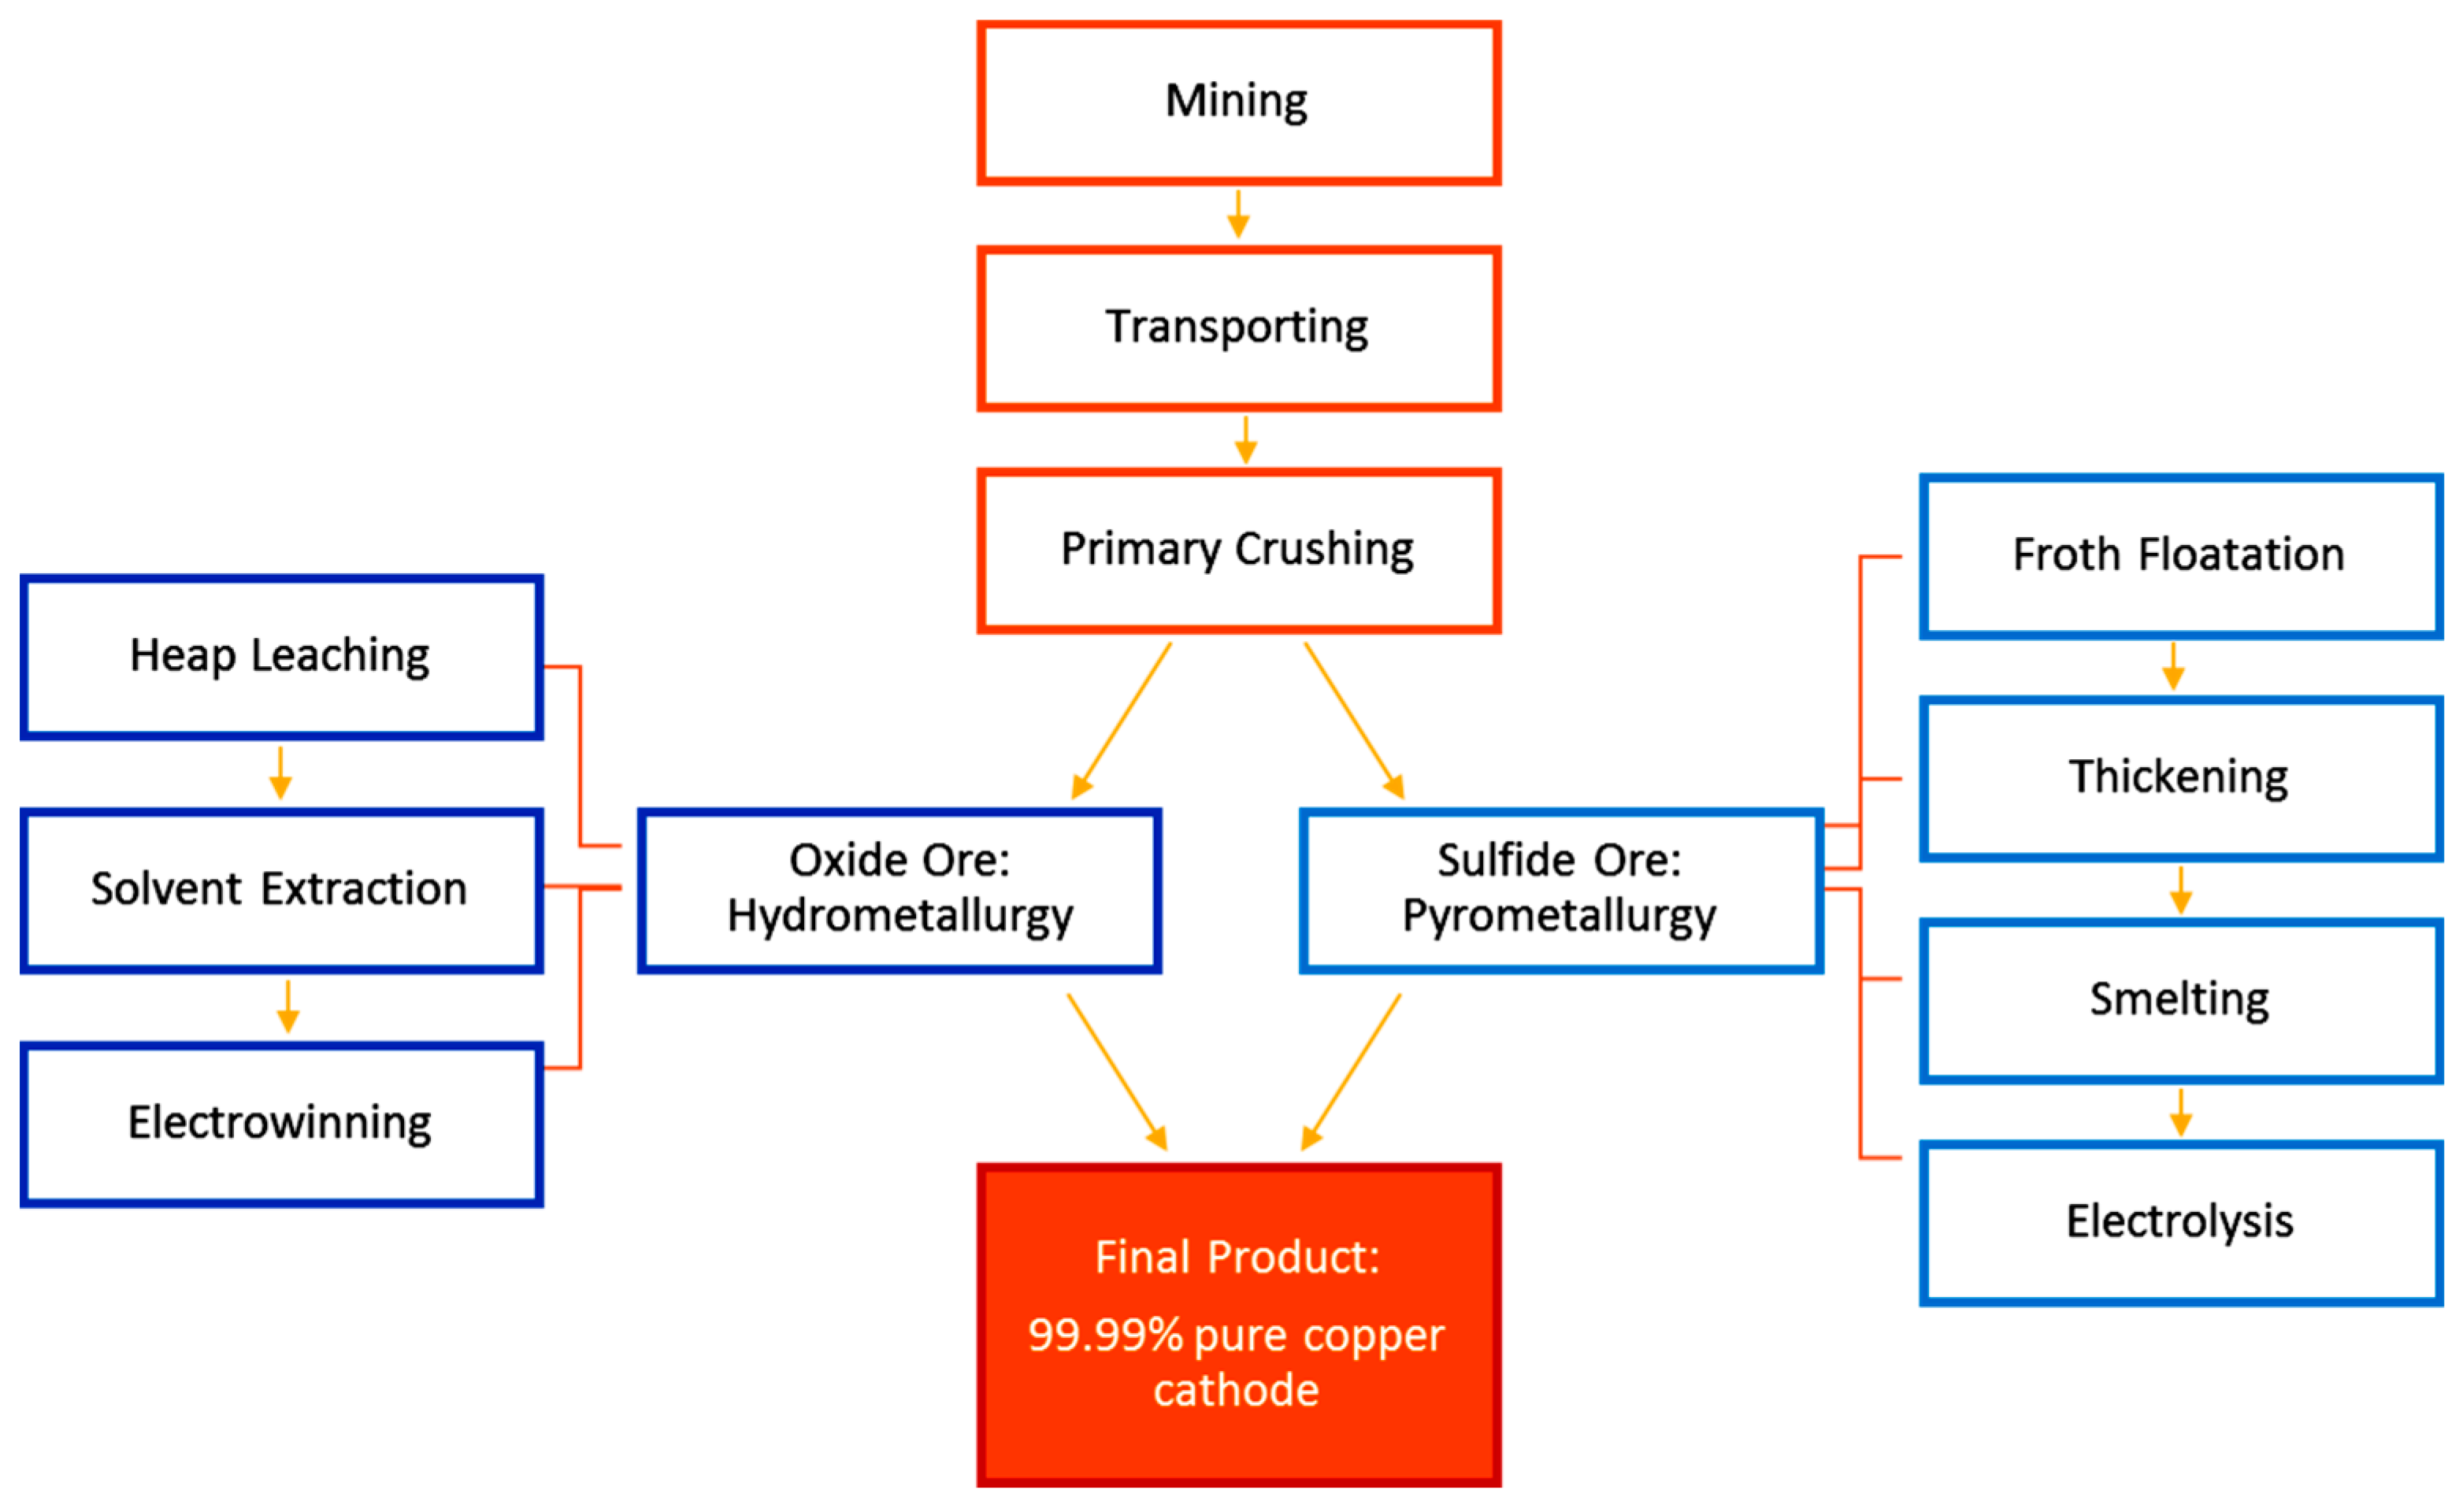
3.4. Copper Mining Waste

3.4.1. General Information

Chile is the world’s largest producer of copper, with high-quality mineral resources located in northern Chile which has resulted in the installation of mineral processing plants over the last century (see Table 7). The copper mining industry is Chile’s main economic sector, contributing to 11% of its GDP during last 10 years. Copper and its associated by-product exports represent the biggest revenue source for the country [67]. Copper production, however, produces millions of tonnes of waste; mining is generally considered as highly contaminating and unsustainable. Several measures have been implemented to optimize processes, dispose residues in an appropriate and safe manner, and to develop valorization processes.
Legislative regulations are essential to establish the responsibilities and duties of mining companies, through an exploratory and exploitative concession. Laws such as ‘Closure of Mining Activities and Installations’ (Law 20.551) provide protection to the environment and to the population, as well as the mitigation of negative effects generated during the mine’s lifespan and its closure [68]. Rule D28, which has been operational since December 2018, establishes the maximum permitted emissions of SO2, arsenic, mercury and particulate matter for copper foundries. They are required to capture more than 95% of these particulate emissions [69]. The program “Alta Ley” was created by Fundación Chile, a non-profit organization to co-ordinate the framework of these improvements. The program developed a technological road map called ‘From Copper to Innovation’ which reports areas of work focused on correcting, renewing and improving the mining industry. The most important challenges include ore grades, water resources, energy resources, waste generation, gas and fine dust emissions, among others [70].

3.4.2. Typical Mining Wastes

Several types of wastes are produced during mining depending on the type of mineral exploited and its processing route. Mine waste, low grade ores and gangue represent the largest volumes of solid residues produced by the Chilean copper mining industry. Several million tonnes of soil must be removed to process valuable minerals/ores. For example, in an open pit operation, up to 500 tonnes of material may need to be removed for each tonne of copper produced. However, most of these wastes are inert materials and rocks with little environmental impact. Only a small fraction (up to 1%) may require specialist disposal. The physical stability of mining and metallurgical wastes plays a crucial role in their impact on the environmental. The chemical aspects and mineralogical composition of ores and mining waste determine the chemical stability, degradation and associated environmental impact.
A schematic representation of copper extraction routes from oxide and sulfide ores is provided in Figure 3.
A few of the focal waste sources are provided in the next section. Low grade ores are sometimes dumped separately for processing at a later stage. Metal dissolution, acid generation, bacterial leaching and effluents can lead to environmental issues at the dump sites. Froth flotation is a method that is used to concentrate copper sulfide ores by fine grinding the ore and the separation of the gangue. This process generates large amounts of tailings containing the gangue minerals and a portion of sulfides (mainly pyrite). The tailings are characterized by fine grained minerals, with a high water fraction and a high pH value. Abandoned tailing ponds constitute very serious environmental challenges. These are solid wastes produced after the flotation process, which are milled and have a fine particle size. Approximately 98% of the rock that is finely milled is disposed of, and only 2% of the rock contains copper [73]. With ore grades becoming poorer, higher volumes of rock must be removed to maintain production levels. This means that larger quantities of material will be disposed of, either as gangue or tailings. It has been estimated that copper tailings will double in size by 2035 [74]. Tailings are one of the biggest solid residues generated during the processing of copper minerals. It has been estimated that 60 to 100 tonnes of tailings are generated per 1 tonne of copper produced. The latest studies indicate that the cumulative volumes of tailings would reach ~7,900Mm3 with a total mass of ~10,600Mt, corresponding to 742 deposits in the country. Out of 742 deposits, 104 are active, 463 inactive and 173 have been abandoned [75]. The various metallurgical wastes produced during copper processing include spent leached ore, slags, pyrometallurgical dust and gas cleaning residues. The high temperature processing of copper concentrates involves smelting, converting and refining. During these stages, slags are produced and represent the largest volumes of residues generated, with 2 to 5 tonnes of slags per 1 tonne of copper produced. Less than 1 ton of SO2 is also formed as a gaseous biproduct [76].

3.4.3. Waste Disposal and Environmental Initiatives

As the mining industry represents the major activity in the country and generates huge amounts of residues, several measures have been taken to improve its waste and resource management. Regarding tailings generation, conventional tailings represent potential water losses and/or evaporation which is a serious issue for their appropriate disposal and management. The disposal of thickened tailings has three clear advantages, namely, good water recovery, low percolation and low fine-dust emissions. The rules pertaining to the disposal of thickened tailings have been established as per the ‘Closure of Mining Activities and Installations’ law [77]. An increase in tailings generation will generate significant physical, chemical and territorial storage issues. A study in the Coquimbo region of three types of industries, i.e., mining, wastewater treatment and agriculture found that their associated wastes can cause sludges and dam sediments to encapsulate and neutralize tailings, thereby reducing the environmental impact of their storage [78].
A few accidents have occurred due to the relative instability of tailing dams. The risks are associated with the breaking off of the tailing retaining wall followed by land floods. This can occur as a result of natural events or operational design issues. In Chile, the latest risk event occurred in the 1960’s when a tailing dam collapsed. It is important to assess the percolation and environmental impact of the tailing dams. These can cause harmful effects on health, water and soil. The law requires that tailings be managed in a way that they are physically and chemically stable once disposed of, and as such control is a highly important factor in preventing risks associated with natural disasters.
With regard to slags, two processing plants for slags have been built by CODELCO, one is located in El Teniente division and the other in El Salvador. These are floatation plants that recover copper and generate filtered tailings. There has also been some research on slag treatments. Investigations have confirmed the presence of Fe-C-Cu alloys and precious metals, which could be processed further to recover metals. Additionally, inert slags could be used for cement production. It has also been possible to recover iron and molybdenum from copper slags by selective reduction due to their chemical affinities [79,80,81]. All these byproducts are being studied and used as construction materials; chemical and physical studies have demonstrated that that have similar characteristics to the materials used in the construction industry. This is a clear example of a circular economy, as the residues produced in one industry could provide the raw material needed for a different industry, thereby enhancing the pyrometallurgical capacity in the region as well as expertise in the mining field [47].

3.5. Other Solid Wastes—Electronic Waste, Plastics

In addition to the consistent efforts to improve waste management for MSW and in the mining sector, Chile has made significant improvements in managing other wastes as well. Chile is the second biggest producer of electronic waste (e-waste) in Latin America, producing 8.9 kg of e-waste per capita per year [82]. The highest e-waste producers in Latin America are Brazil and Mexico, generating 1.5 and 1 Mtons, respectively; Chile is estimated to have produce ~200,000 tonnes of e-waste in 2018 [83]. Although this amount is much lower than the amounts produced by Brazil and Mexico, Uruguay and Chile were among highest e-waste producers per inhabitant in 2016, generating 10.8 and 8.7 kg per capita, respectively. While the typical annual growth worldwide is 3–4%, the estimated growth of e-waste in Latin America in 2018, was 5%. One of the key factors contributing to a high e-waste generation in Chile is directly related to the GDP rise during previous years. In 2012, the per capita income in Chile was 18,354 USD as compared to 1, 292 USD in Haiti. Higher income levels lead to a higher acquisition of electronic goods and the consequent generation of e-waste [84].
A typical recycling chain for e-waste consists of four steps: collection, dismantling, mechanical/physical processing and metallurgical processing [85]. Chile has developed an urban mining sector with a focus on the first two stages of the chain, i.e., collection and disassembly. The valuable components of e-waste, such as printed circuit boards (PCBs), are currently sent overseas where the material is processed. Any plastics separated from the e-waste are formally processed in the country. Some initiatives are currently being developed to implement the recovery of metals from PCBs locally. The validation of a high temperature pyrolysis process is currently being pursued through a collaboration between the Chilenter Foundation and Universidad Andrés Bello [86,87,88]. The purpose of this project is to concentrate valuable metals into a reduced fraction, while other components are retained as a non-metallic fraction to be used as a raw material for purposes such as carbon and energy resource. Chile has the potential of recovering valuable metals from e-waste as it has the largest pyrometallurgical capacity in the region, as well as expertise in the mining field [47].
As Chile consumes large amounts of plastic products, waste plastics are recycled at a considerable rate in the country. As a priority product considered in the Waste Management Framework, if packaging is created using plastic, then the extended producer responsibility plays an important role in controlling the type and quantity of plastic being used for fabrication and its subsequent disposal. Another important measure promoted by the Chilean government is to prohibit the commercial use of plastic bags in the whole of its territory, making Chile the first country in Latin America to prohibit their use [89]. Action has been taken to avoid the contamination of the land and especially the ocean across the whole country. It is important to mention that Chile has 4,300 km of coast. The Government has also launched a campaign to reduce the use of plastic straws, which has increased awareness regarding environmental impact of single-use plastics and has therefore minimized their use, either by avoiding them or by replacing them with glass or steel straws.

4. Concluding Remarks

An in-depth overview has been presented on solid waste management in relation to the global scenario, and a further special report on waste management in Chile has been presented. Given the wide variety of wastes being produced, there is no single method to manage all wastes. For example, one of the major issues in managing MSW is its collection from various households, offices and institutes, and its transportation to central processing areas. This feature represents one of the costliest aspects of waste management operations. Biodegradable organic wastes, inert wastes and the mixed nature of waste and their sorting presents additional challenges. The collection of waste is not a major issue for industrial wastes as most of it is produced locally at industrial sites. However, large volumes and relatively inert wastes, some of which may be hazardous, poses a major challenge. Through various related government projects and legislation, Chile is making very sincere multipronged efforts to manage wastes produced by its population, its industries and the mining sector. Continuous sustained efforts, an education of its populace, an awareness of waste hazards and the creation of waste management infrastructures provides the solution for sustainable waste management, the recovery of resources and a circular economy.

Author Contributions

Conceptualization, original draft: R.C. and R.K.; Supervision and resources: Y.K., I.B.; Formal analysis: J.B.K. and P.S.M. All authors have read and agreed to the published version of the manuscript.

Funding

This research received no external funding.

Institutional Review Board Statement

Not applicable.

Informed Consent Statement

Not applicable.

Data Availability Statement

Not applicable.

Conflicts of Interest

The authors declare no conflict of interest.

References

  1. Global Waste Generation—Statistics & Facts. Available online: https://www.statista.com/topics/4983/waste-generation-worldwide/ (accessed on 28 August 2021).
  2. What a Waste 2.0: A Global Snapshot of Solid Waste Management to 2050. Chapter 2. Available online: https://datatopics.worldbank.org/what-awaste/trends_in_solid_waste_management.html (accessed on 28 August 2021).
  3. What a Waste 2.0: A Global Snapshot of Solid Waste Management to 2050. Available online: https://openknowledge.worldbank.org/handle/10986/30317 (accessed on 30 August 2021).
  4. What a Waste Global Database. Available online: https://datacatalog.worldbank.org/dataset/what-waste-global-database (accessed on 30 August 2021).
  5. Center for Sustainable Systems, University of Michigan. 2021. “Municipal Solid Waste Factsheet”. Pub. No. CSS04-15. Available online: https://css.umich.edu/factsheets/municipal-solid-waste-factsheet (accessed on 20 August 2021).
  6. Bidlingmaier, W.; Sidaine, J.M.; Papadimitriou, E.K. Separate collection and biological waste treatment in the European Community. Rev. Environ. Sci. Bio/Technol. 2004, 3, 307–320. [Google Scholar] [CrossRef]
  7. What a Waste 2.0: A Global Snapshot of Solid Waste Management to 2050. Available online: https://www.worldbank.org/en/news/infographic/2018/09/20/what-a-waste-20-a-global-snapshot-of-solid-waste-management-to-2050 (accessed on 20 August 2021).
  8. Patel, V.; Meka, S. Forecasting of Municipal Solid Waste Generation for Medium Scale Towns Located in the State of Gujarat, India. Int. J. Innov. Rese. Sci. Engg. Tech. 2013, 2, 4707–4716. [Google Scholar]
  9. EPA. Adjusting waste generation. In Appendix H: Methodology to Calculate Waste Generation Based on Previous Year; United State Environmental Protection Agency: Washington, DC, USA, 1997; p. 5. [Google Scholar]
  10. Rachdawong, P.; Khaodhiar, S.; Sangiampaisalsuk, N. Analysis of solid waste generation-Characteristics in Bangkok, Thailand. J. Environ. Res. 2000, 22, 80–92. [Google Scholar]
  11. Sukholthaman, P.; Chanvarasuth, P.; Sharp, A. Analysis of waste generation variables and people’s attitudes towards waste management system: A case of Bangkok, Thailand. J. Mater. Cycles Waste Manag. 2017, 19, 645–656. [Google Scholar] [CrossRef]
  12. Liu, J.; Li, Q.; Gu, W.; Wang, C. Generation of Municipal Solid Waste in China: Evidences from Provincial Data. Int. J. Environ. Res. Public Health 2019, 16, 1717. [Google Scholar] [CrossRef] [Green Version]
  13. Masebinu, S.O.; Akinlabi, E.T.; Muzenda, E.; Aboyade, A.O.; Mbohwa, C.; Manyuchi, M.M.; Naidoo, P. A Review on Factors affecting Municipal Solid Waste Generation. In Proceedings of the 2nd International Engineering Conference (IEC 2017) Federal University of Technology, Minna, Nigeria, 17–19 October 2017. [Google Scholar]
  14. Wang, A.; Zhang, L.; Shi, Y.; Rozelle, S.; Osborn, A.; Yang, M. Rural Solid Waste Management in China: Status, Problems and Challenges. Sustainability 2017, 9, 506. [Google Scholar] [CrossRef] [Green Version]
  15. Zeng, C.; Niu, D.; Zhao, Y. A comprehensive overview of rural solid waste management in China. Front. Environ. Sci. Eng. 2015, 9, 949–961. [Google Scholar] [CrossRef]
  16. Municipal Solid Waste in the U.S.—Statistics & Facts. Available online: https://www.statista.com/topics/2707/municipal-solid-waste-in-the-united-states/ (accessed on 23 August 2021).
  17. Distribution of Municipal Solid Waste Treatment and Disposal Worldwide in 2016, by Method. Available online: https://www.statista.com/statistics/916682/global-municipal-solid-waste-treatment-by-method/ (accessed on 22 August 2021).
  18. EPA Victoria. Industrial Waste Resource Guidelines. Solid Industrial Waste Hazard Categorisation and Management. Available online: https://www.epa.vic.gov.au/about-epa/publications/iwrg631 (accessed on 23 August 2021).
  19. Maczulak, A.E. Pollution: Treating Environmental Toxins; Infobase Publishing: New York, NY, USA, 2010; p. 120. ISBN 9781438126333. [Google Scholar]
  20. United States Environmental Protection Agency EPA. Facts and Figures about Materials, Waste and Recycling. Available online: https://www.epa.gov/facts-and-figures-about-materials-waste-and-recycling/national-overview-facts-and-figures-materials (accessed on 21 August 2021).
  21. The Role of Steel Manufacturing in the Global Economy. 2019. Available online: https://www.worldsteel.org/en/dam/2520Summary.pdf (accessed on 10 August 2021).
  22. Steel Industry Co-Products. Available online: https://www.worldsteel.org/publications/position-papers/co-product-position-paper.html (accessed on 21 August 2021).
  23. Solid Waste Management in a Steel Plant. Available online: https://www.ispatguru.com/solid-waste-management-in-a-steel-plant/ (accessed on 23 August 2021).
  24. U.S. Department of Transportation. User Guidelines for Waste and Byproduct Materials in Pavement Construction. Available online: https://www.fhwa.dot.gov/publications/research/infrastructure/structures/97148/ssa1.cfm (accessed on 23 August 2021).
  25. Kongkarat, S.; Khanna, R.; Koshy, P.; O’Kane, P.; Sahajwalla, V. Use of waste Bakelite as a raw material resource for recarburization in steelmaking processes. Steel Res. Int. 2011, 82, 1228–1239. [Google Scholar] [CrossRef]
  26. The Management of Steel Industry By-Products and Waste ed; International Iron and Steel Institute: Brussels, Belgium, 1987.
  27. Rahman, M.; Khanna, R.; Sahajwalla, V.; O’Kane, P. The influence of ash impurities on interfacial reactions between carbonaceous materials and EAF slag at 1550 C. ISIJ Int. 2009, 49, 329–336. [Google Scholar] [CrossRef] [Green Version]
  28. Aluminium—The Second Most Used Metal in the World. Available online: https://etem.com/blog/aluminium-the-second-most-used-metal-in-the-world (accessed on 3 September 2021).
  29. Countries with the Largest Smelter Production of Aluminium from 2016 to 2020. Available online: https://www.statista.com/statistics/264624/global-production-of-aluminum-by-country/ (accessed on 3 September 2021).
  30. Zhang, R.; Zheng, S.; Ma, S.; Zhang, Y. Recovery of alumina and alkali in Bayer red mud by the formation of andradite-grossular hydrogarnet in hydrothermal process. J. Hazard. Mater. 2011, 189, 827–835. [Google Scholar] [CrossRef]
  31. Khanna, R.; Konyukhov, Y.V.; Ikram-ul-haq, M.; Burmistov, I.; Cayumil, R.; Belov, V.A.; Rogachev, S.O.; Leybo, D.V.; Mukherjee, P.S. An innovative route for valorising iron and aluminium oxide rich industrial wastes: Recovery of multiple metals. J. Environ. Manag. 2021, 295, 113035. [Google Scholar] [CrossRef]
  32. Patel, S.; Pal, B.K. Current Status of an Industrial Waste: Red Mud an Overview. IJLTEMAS 2015, 7, 1–16. [Google Scholar]
  33. Yolandi, S.; Oberholster, S.P.; Somerset, V. A decision-support framework for industrial waste management in the iron and steel industry: A case study in Southern Africa. Case Stud. Chem. Environ. Eng. 2021, 3, 100097. [Google Scholar]
  34. Khairul, M.A.; Zanganeh, J.; Moghtaderi, B. The composition, recycling and utilisation of Bayer red mud. Resour. Conserv. Recyc. 2019, 141, 483–498. [Google Scholar] [CrossRef]
  35. Totten, G.E.; MacKenzie, D.S. Handbook of Aluminium: Volume 2: Alloy Production and Materials Manufacturing; Marcel Dekker, Inc.: New York, NY, USA, 2003; Volume 2, ISBN 0-8247-0896-2. [Google Scholar]
  36. The Aluminium Association: Primary Production. Available online: https://www.aluminum.org/industries/production/primary-production (accessed on 7 July 2021).
  37. OECD Global Forum on Environment. Focusing on Sustainable Materials Management. Materials case study 2: Aluminium. Available online: https://www.oecd.org/env/waste/46194971.pdf (accessed on 23 August 2021).
  38. United States Environmental Protection Agency EPA. Bauxite and Alumina Production Wastes. Available online: https://www.epa.gov/radiation/tenorm-bauxite-and-alumina-production-wastes (accessed on 7 July 2021).
  39. The Aluminium Association: Recycling. Available online: https://www.aluminum.org/industries/production/recycling (accessed on 7 July 2021).
  40. Liu, Y.; Lin, C.; Wu, Y. Characterization of red mud derived from a combined Bayer process and bauxite calcination method. J. Hazard. Mater. 2007, 146, 255–261. [Google Scholar] [CrossRef]
  41. Mayes, W.M.; Jarvis, A.P.; Burke, I.T.; Walton, M.; Feigl, V.R.; Klebercz, O.; Gruiz, K. Dispersal and attenuation of trace contaminants downstream of the Ajka bauxite residue (red mud) depository failure. Hungary. Environ. Sci. Technol. 2011, 45, 5147–5155. [Google Scholar] [CrossRef]
  42. Wang, J.; Zhao, P. Method of De-Alkalizing Red Mud and Recovering Aluminium and Iron. Available online: https://patents.google.com/patent/CN103031443A/en (accessed on 7 July 2021).
  43. Kumar, R.A.S.; Premchand, J.P. Utilization of Iron Values of Red Mud for Metallurgical Applications. Environ. Waste Manag. 1998, 108–119. [Google Scholar] [CrossRef]
  44. Gronostajski, J.; Marciniak, H.; Matuszak, A. New methods of aluminium and aluminium-alloy chips recycling. J. Mater. Process. Technol. 2000, 106, 34–37. [Google Scholar] [CrossRef]
  45. The SPL Waste Management Challenge in Primary Aluminum. Available online: https://www.lightmetalage.com/news/industry-news/smelting/the-spl-waste-management-challenge-in-primary-aluminum/ (accessed on 7 July 2021).
  46. Ministerio del Medio Ambiente. Informe del Estado del Medio Ambiente (IEMA) 2020, Chapter 10, p. 2. “Residuos”—SINIA. Available online: https://sinia.mma.gob.cl/index.php/resiudos/ (accessed on 29 August 2021).
  47. Ulloa, G.; Cayumil, R.; Sánchez, M. Urban Mining in Chile: State of the art. In Proceedings of the Fourth Symposium of Urban Mining and Circular Economy, Bergamo, Italy, 21–22 May 2018. [Google Scholar]
  48. Basel Convention. On the Control of Transboundary Movements of Hazardous Wastes and Their Disposal; Basel Convention: Geneva, Switzerland, 2014. [Google Scholar]
  49. United Nations Environment Program. Stockholm Convention on Persistent Organic Pollutants. United Nations, Geneva. Nations, Geneva. 2019. Available online: https://www.unep.org/annualreport/2019/index.php (accessed on 30 August 2021).
  50. CONAMA. Plan Nacional de Implementación para la Gestión de los Contaminantes Orgánicos Persistentes (COPs) en Chile. 2005, 1–67. Available online: https://www.informea.org/en/plan-nacional-de-implementaci%C3%B3n-para-la-gesti%C3%B3n-de-los-contaminantes-org%C3%A1nicos-persistentes-cops-en (accessed on 29 August 2021).
  51. MERCOSUR: A Status Report and Prospects for Canada-Mercosur Relations. Available online: https://www.sice.oas.org/TPD/CAN_MER/Studies/MercosurFocal_e.pdf (accessed on 21 August 2021).
  52. Ministerio del Medio Ambiente. Santiago Recicla. Available online: http://centralenergia.cl/uploads/2011/09/Bases_generales_del_medio_ambiente_LEY-19300.pdf (accessed on 20 August 2021).
  53. Available online: https://www.informea.org/en/framework-law-waste-management-law-no-20920-2016 (accessed on 10 August 2021).
  54. Available online: https://eticayseguridad.uc.cl/documentos/comite-seguridad/normativa-seguridad/127-dcto-148-residuos-peligrosos/file.html (accessed on 21 August 2021).
  55. Ministerio del Medio Ambiente. Santiago Recicla. Available online: http://www.santiagorecicla.cl/ (accessed on 30 May 2021).
  56. Glavič, P.; Lukman, R. Review of sustainability terms and their definitions. J. Cleaner Product. 2007, 15, 1875–1885. [Google Scholar] [CrossRef]
  57. Ministerio del Medio Ambiente. Economía Circular. Available online: https://mma.gob.cl/economia-circular/ (accessed on 1 September 2021).
  58. Average per Capita Generation of Municipal Solid Waste Worldwide in 2016, by Region. Available online: https://www.statista.com/statistics/916618/global-per-capita-generation-of-municipal-solid-waste-by-region/ (accessed on 1 September 2021).
  59. Blazquez, C.; Paredes-Belmar, G. Network design of a household waste collection system: A case study of the commune of Renca in Santiago, Chile. Waste Manag. 2020, 116, 179–189. [Google Scholar] [CrossRef]
  60. Pontificia Universidad Católica. Estudio Caracterización de Residuos Sólidos Domiciliarios en la Region Metropolitana; UCV: Valparaíso, Chile, 2006. [Google Scholar]
  61. Chile and Canada Partner to Reduce Emissions from the Waste Management Sector. Available online: https://www.ccacoalition.org/en/news/chile-and-canada-partner-reduce-emissions-waste-management-sector (accessed on 23 August 2021).
  62. Chile–Developing a Legal Framework for EPR in Chile. Available online: https://prevent-waste.net/wp-content/uploads/2020/09/Chile.pdf (accessed on 28 August 2021).
  63. Rojas, A.; Yabar, H.; Mizunoya, T.; Higano, Y. The Potential Benefits of Introducing Informal Recyclers and Organic Waste Recovery to a Current Waste Management System: The Case Study of Santiago de Chile. Resources 2018, 7, 18. [Google Scholar] [CrossRef] [Green Version]
  64. AVINA. Politicas Publicas Para la Inclusion de los Recicladores de Base al Sistema de Gestion de Residuos Municipales en Chile; AVINA: Santiago, Chile, 2013. (In Galician) [Google Scholar]
  65. Hutchison, I.P.G.; Ellison, R.D. Mine Waste Management: A Resource for Mining Industry Professionals, Regulators and Consulting Engineers. United States, 1992. Available online: https://www.osti.gov/biblio/6715101-mine-waste-management-resource-mining-industry-professionals-regulators-consulting-engineers (accessed on 10 August 2021).
  66. Ministerio de Energía. Energías Renovables. Available online: http://www.energia.gob.cl/energias-renovables (accessed on 31 May 2021).
  67. Sociedad Nacional de Minería. Fundamentos y Desafíos para el Desarrollo Minero. 2017. Available online: https://www.sonami.cl/v2/centro-de-documentacion/publicaciones-tecnicas/ (accessed on 31 May 2021).
  68. SERNAGEOMIN, n.d. Cierre de Faenas Mineras. Available online: https://www.sernageomin.cl/cierre-de-faenas-mineras/ (accessed on 31 May 2021).
  69. Ministerio Del Medio Ambiente, 2018c. Norma de Emisión Para Fundiciones de Cobre y Fuentes Emisoras de Arsénico. Available online: https://www.leychile.cl/Navegar?idNorma=1057059 (accessed on 11 August 2021).
  70. Fundación Chile. Desde el Cobre a la Innovación. Roadmap Tecnológico 2015–2035. Available online: http://programaaltaley.cl/wp-content/uploads/2016/04/Roadmap-Tecnologico-Alta-ley.pdf (accessed on 12 August 2021).
  71. Mine Waste Management: A Resource for Mining Industry Professionals, Regulators and Consulting Engineers. Available online: https://www.nsenergybusiness.com/news/top-five-copper-mining-countries/ (accessed on 6 July 2021).
  72. Copper Mining and Processing: Processing Copper Ores. Available online: https://superfund.arizona.edu/resources/learning-modules-english/copper-mining-and-processing/processing-copper-oreshttps://www.mwen.info/docs/imwa_1999/IMWA1999_Wiertz_403.pdf (accessed on 6 July 2021).
  73. Schlesinger, M.; King, M.; Sole, K.; Davenport, W. Extractive Metallurgy of Copper (Fifth). Sociedad Nacional de Minería, 2017. Fundamentos y desafíos para el desarrollo minero. Available online: https://www.elsevier.com/books/extractive-metallurgy-of-copper/schlesinger/978-0-08-096789-9 (accessed on 6 July 2021).
  74. Roadmap Tecnológico de la Minería. Available online: https://corporacionaltaley.cl/?page_id=952&lang=en (accessed on 6 July 2021).
  75. SERNAGEOMIN, 2018. Preguntas Frecuentes sobre Relaves. Available online: https://www.sernageomin.cl/preguntas-frecuentes-sobre-relaves/ (accessed on 6 July 2021).
  76. Moskalyk, R.R.; Alfantazi, A. Review of copper pyrometallurgical practice: Today and tomorrow. Miner. Eng. 2003, 17, 893–919. [Google Scholar] [CrossRef]
  77. Minería Chilena, 2009. Relaves Espesados a la Vanguardia. Available online: https://www.mch.cl/reportajes/relaves-espesados-a-la-vanguardia/ (accessed on 6 July 2021).
  78. El Ovallino. Tecnosuelos: La Alternativa que Busca “Reverdecer” los Relaves Mineros. 2019. Available online: http://www.elovallino.cl/economia/tecnosuelos-alternativa-que-busca-reverdecer-relaves-mineros (accessed on 6 July 2021).
  79. Zongjie, L.; Junrui, C.; Zengguang, X.; Yuan, Q.; Jing, C. A Comprehensive Review on Reasons for Tailings Dam Failures Based on Case History. Adv. Civil Eng. 2019, 2019, 4159306. [Google Scholar]
  80. Palacios, J.; Sánchez, M. Wastes as resources: Update on recovery of valuable metals from copper slags. Miner. Process. Extract. Metall. 2011, 120, 218–223. [Google Scholar] [CrossRef]
  81. Sánchez, M.; Sudbury, M. Reutilisation of primary metallurgical wastes: Copper slag as a source of copper, molybdenum and iron–brief review of test work and the proposed way forward. In Proceedings of the Third International Slag Valorisation Symposium, Leuven, Belgium, 19–20 March 2013. [Google Scholar]
  82. Forti, V.; Baldé, C.P.; Kuehr, R.; Bel, G. The Global E-waste Monitor 2020: Quantities, flows and the circular economy potential. United Nations University (UNU)/United Nations Institute for Training and Research (UNITAR)—Co-Hosted SCYCLE Programme, International Telecommunication Union (ITU) & International Solid Waste Association (ISWA), Bonn/Geneva/Rotterdam. Available online: http://ewastemonitor.info/ (accessed on 10 September 2021).
  83. Magalini, F.; Khetriwal, D.S.; Huisman, J.; Nanorom, I.C. Electronic Waste (E-Waste) Impacts and Mitigation Options in the Off-grid Renewable Energy Sector. 2016. Available online: https://assets.publishing.service.gov.uk/media/58482b3eed915d0b12000059/EoD_Report__20160825_E-Waste_Study_Final-31.08.16.pdf (accessed on 10 September 2021).
  84. Solving the E-Waste Problem. Available online: https://www.step-initiative.org/ (accessed on 10 September 2021).
  85. Tsydenova, O.; Bengtsson, M. Chemical hazards associated with treatment of waste electrical and electronic equipment. Waste Manag. 2011, 31, 45–58. [Google Scholar] [CrossRef]
  86. Cayumil, R.; Khanna, R.; Ikram-Ul-Haq, M.; Rajarao, R.; Hill, A.; Sahajwalla, V. Generation of copper rich metallic phases from waste printed circuit boards. Waste Manag. 2014, 34, 1783–1792. [Google Scholar] [CrossRef]
  87. Cayumil, R.; Khanna, R.; Rajarao, R.; Mukherjee, P.S.; Sahajwalla, V. Concentration of precious metals during their recovery from electronic waste. Waste Manag. 2016, 57, 121–130. [Google Scholar] [CrossRef]
  88. Cayumil, R.; Ikram-Ul-Haq, M.; Khanna, R.; Saini, R.; Mukherjee, P.S.; Mishra, B.K.; Sahajwalla, V. High temperature investigations on optimising the recovery of copper from waste printed circuit boards. Waste Manag. 2018, 73, 556–565. [Google Scholar] [CrossRef]
  89. Ministerio del Medio Ambiente. Chao Bolsas Plásticas. Available online: http://chaobolsasplasticas.cl/ (accessed on 6 July 2021).
Figure 1. An overview of MSW disposal and treatment in the USA.
Sustainability 13 11644 g001
Figure 2. A schematic representation of iron and steelmaking processes.
Sustainability 13 11644 g002
Figure 3. A schematic representation of copper extraction routes for oxide and sulfide ores [72].
Sustainability 13 11644 g003
Table 1. Global generation of various wastes.
Type of WasteGeneration per Capita (kg/Capita/Day)
Industrial waste12.73
Agricultural waste3.35
Construction and demolition waste1.68
Municipal solid waste0.74
Hazardous waste0.32
Medical waste0.25
Electronic waste0.02
Table 2. Typical sources and compositions of MSW.
Waste SourcesWaste GeneratorsTypical Wastes
ResidentialSingle and/or multi-family dwellings, apartment blocks, high-rise buildings.Food wastes, paper, cardboard, plastics, yard wastes, furniture, glass, metals, bulky items, consumer electronics, whitegoods, batteries and household hazardous wastes
Commercial institutes, shopping malls and organizations Shops, stores, hotels, restaurants,
markets, offices, schools, hospitals, government organisations
Paper, cardboard, plastics,
food wastes, glass, wood, special wastes, metals,
hazardous wastes
Municipal servicesStreet cleaning, landscaping, parks, other recreational areas, beaches, wastewater treatmentGeneral wastes from parks, street sweepings, landscape
and tree trimmings, other recreational areas, beaches, sludge.
Table 3. Generation of MSW by region (2016), and their projection by 2050 [3].
RegionGeneration of MSW (2016) (Million Tonnes)Projection (2050)
(Million Tonnes)
East and Asia Pacific468714
Europe and Central Asia392490
South Asia334661
North America289396
Latin America and the Caribbean231369
Sub-Saharan Africa174516
Middle East and North Africa129255
Table 4. Typical factors influencing MSW generation.
Global FactorsLocal Factors
DemographicsPopulation, population density, age, gender, occupation, expenditure on groceries; household count, household density,
household type and size, income level, energy consumption.
EconomicsGross domestic product, consumer price index, economic growth, employment/unemployment and waste budget.
TechnologyManufacturing standards, engineering issues, inefficient equipment and facilities.
Legislation & AdministrationPolicies, laws, enforcement level, management institutions, disposal fees, recycling programmes and amounts recycled
SocialAwareness, literacy levels, public cooperation, cultural practices, urbanisation, tourist attractions, political stability.
Consumer behaviourConsumption demand and patterns, cooking activity, lifestyles, disposal patterns.
Table 5. Global steel production (in million tonnes) in 2020. Contributions from the top five steel producing countries are shown.
Global
Production
#1#2#3#4#5
ChinaIndiaJapanUSARussia
1877.51064.8100.383.272.771.6
Table 6. Global aluminium production (in thousand tonnes) in 2019. Contributions from the top five aluminium producing countries are shown.
Global
Production
#1#2#3#4#5
ChinaIndiaRussiaCanadaU.A.E
64,00035,8003700360029002700
Table 7. Global copper mining (in million tonnes) in 2020; contributions from top five copper mining countries are shown [71].
Global
Production
#1#2#3#4#5
ChilePeruChinaD R CongoU.S.A
205.72.21.71.31.2
Publisher’s Note: MDPI stays neutral with regard to jurisdictional claims in published maps and institutional affiliations.

