Article

Impact of an Innovative Solution for the Interruption of 3-D Point Thermal Bridges in Buildings on Sustainability

by
Rastislav Ingeli
1,*,
Jozef Gašparík
2 and
Lucia Paulovičová
2
1
Department of Building Structures, Faculty of Civil Engineering, Slovak University of Technology, Radlinského 11, 813 68 Bratislava, Slovakia
2
Department of Building Technology, Faculty of Civil Engineering, Slovak University of Technology, Radlinského 11, 813 68 Bratislava, Slovakia
*
Author to whom correspondence should be addressed.
Sustainability 2021, 13(21), 11561; https://doi.org/10.3390/su132111561
Submission received: 9 September 2021 / Revised: 3 October 2021 / Accepted: 14 October 2021 / Published: 20 October 2021
(This article belongs to the Special Issue Sustainable Materials for Thermal and Noise Insulation of Buildings)

Abstract

:
During the design of the external cladding, it is possible to use different materials and compositions. One of these possibilities is also a ventilated facade, which consists of a supporting structure, a thermal insulation, a supporting grid, an air gap for ventilation and a cladding layer. The construction of the supporting grid in the ventilated facade must be mechanically anchored into the supporting structure of the external cladding. This mechanical anchoring causes 3-D point thermal bridges in the external cladding itself. Therefore, the aim of this work is to assess and analyze the influence of these 3-D point thermal bridges on transmission heat losses through the external cladding. A Finite Element Mesh analysis has been used for this analysis. Different types of external cladding compositions were modeled in the simulation program, and the effect on the heat transfer coefficient was determined. In addition to the analysis of the existing anchoring systems, an innovative solution has been suggested that is more economical and easier to implement. The results show that the application of anchors and their number impacts significantly on the thermal properties of the envelope. The difference between the anchoring element with a thermal insulation pad and the patented method is minimal. This is a 1.29% difference. The last variant was a proposal (patent) that the anchoring element is only plastic-coated and thus its thermal engineering properties are improved, which is manifested mainly in heat conduction but also from the radiant point of view, as plasticizing the emissivity changes. Compared to the perimeter cladding without the ap-plication of an anchoring element, the heat loss increases by 29.37%. In addition to the energy savings, there are also financial savings. While the plastic pads costs about EUR 0.3, the plastic coating (patent) represents a price of around EUR 0.03. If we had a building with 10,000 m2 of wall area where 6 pieces of anchors per 1 m2 are applied, the savings would be EUR 16,200. Such savings are already significant. The conclusion of this work is that these point thermal bridges have a significant impact on the overall transmission heat loss coefficient and therefore they have overall heat demand and energy demand.

Graphical Abstract

1. Introduction

When designing buildings, it is essential to assess the energy performance of buildings [1,2,3]. It is necessary that buildings should have as low energy consumption as possible because this contributes to cost reduction as well as to reducing CO2 production [4]. One of the most important factors is the correct design of the external cladding compositions, which defines the heat-exchange of the building envelope. The perimeter shell includes various elements that form thermal bridges. The thermal bridge can be characterized as a part of the building structure, where the internal surface temperature changes significantly compared to the surrounding internal surfaces. This can be caused by a change in the thickness of the building structure, the various size of the inner surface that receives heat and the outer surface that transfers heat (for example: corners of walls, roofs, floors, etc.). If a thermal bridge is constructed in the structure of a heated building, then, in winter, its temperature on the inner surface will be lower than the temperature on other common interior surfaces. On the contrary, the temperature on the outer surface of the thermal bridge will again be more elevated than in an ordinary place. This is because in the place of the thermal bridge, the structure has a higher thermal conductivity than in another ordinary place of the building structure. The building envelope must protect the entire heated interior of the building so that the influence of thermal bridges is eliminated at all critical points, or at least sufficiently eliminated. Thermal bridges can be caused by modifying the material or the geometry of the structures. In addition to the fundamental types of the thermal bridges, modern types are also being created, using individual architectural modern designs. These are mainly anchoring elements that are part of a light perimeter cladding or ventilated façade. As it is shown, point thermal bridge effects in cladding systems can constitute a significant part of buildings’ thermal balance. Neglecting their presence can lead to significant underestimation of actual heat flows, which can account for 5% to almost 20% of total heat flows through the building envelope, depending mostly on the thermal transmittance of the load-bearing wall [5]. In the case of façade renovations, these systems have become a very attractive alternative to external thermal insulation composing systems (ETICS). Condensation issues in most varieties of such systems are very limited since an air cavity which allows “breathing” separates the insulation material from the external cover. These anchoring elements can be additionally used for the local attachment of the various elements such as railings, billboards, awnings, shelters, pergolas and the others. Therefore, it is necessary to devote significant attention to this issue, as it has an impact on the indoor environment but also on the overall heat loss and thus on the overall energy efficiency of buildings [6]. It should be pointed out that the use of different calculation methods of thermal bridges, provided in standards [7,8], can lead to different energy performance classes of a building and to percentage gaps on the energy requirements in the heating season, calculated to be more than 20% [9]. The Standard EN ISO 13786 [10] requires a dynamic calculation for the evaluation of building performance but refers to Standard EN ISO 10211 [11] to perform steady-state thermal bridges calculations. Martin et al. [12]. underline this contradiction. There are solutions to reduce losses through thermal bridges, but they are not always applied. To design these solutions, it is important to be able to estimate these losses correctly and the inertia. In 1989, HASSID proposed and simplified model to account for lateral heat transfers caused by thermal bridges for homogeneous walls [13] and multilayer walls [14]. The model is based on the integration of the two-dimensional conduction equation. It led to a simple expression to incorporate thermal bridge effects in steady-state calculation tools. There are many numerical tools to characterize the thermal behavior of 2-D or 3-D elements. Several mathematical methods are implemented to solve the equations that describe heat transfers: finite elements method, electric analogs border element method [15]. All the above facts lead to the confirmation of the importance of the analysis of individual anchoring elements, which form the local point 3-D thermal bridges on buildings. A simplified steady state calculation method is used for the given calculation. The dynamic method was not used. The computational part is mainly used for verification with the experimental model and determination of the thermal conductivity of the proposed anchor modification.

2. Thermal Bridges

In most cases, inhomogeneous structures represent thermal bridges, and their thermal properties can be significantly reduced [16]. Inhomogeneous structures, which are composed of several substances with numerous thermal properties, represent a thermal bridge caused by a change in the thermal properties of the peripheral shell. Thermal bridges cause materials with high thermal conductivity, and they can reduce the local thermal resistance of the perimeter shell. This is exceptionally significant for higher thermal insulation thicknesses [17]. In some cases, thermal bridges can account for up to 3-D% of the final energy consumption [18]. The accumulation of materials is furthermore of considerable importance for thermal bridges [19]. A simplified calculation of inhomogeneous structures, where the thermal resistance for the infill and the frame is calculated, is acceptable for wood frame structures. However, it cannot be used for many of the more complex technologies introduced in the market. In addition, architecture is becoming more complex, and the result is an increase in the use of frame elements. Studies carried out for the California Energy Commission [20] have shown that the frame factor (area of opaque structures where the frame is made of solid wood) for the walls of residential buildings is almost 27%. The resulting value of thermal resistance of frame structures, whose thermal resistance at the place of filling thermal insulation is R = 2.6 m2. W/K is in the range from 1.5 to 1.6 m2. W/K. By including the frame structure, the thermal resistance is reduced by 35 to 40%. This would mean that houses built in this way would require approximately 10–12% more energy than those using a simplified calculation, without including frame structures [21]. Theodosiou et al. [5] carried out 3-D heat transfer simulations of cladding systems for building facades, showing that neglecting the point thermal bridge effect in these kinds of systems can lead to a significant underestimation (from 5% to 20%) of the actual heat flows. As can be seen, the problem of inhomogeneous constructions in the scientific field itself is elementally solved all over the world. When calculating the energy balance of a building, it is necessary, among other inputs, to know the thermal properties of building structures, which form the envelope of heated spaces. If the package includes an inhomogeneous structure, it must be taken into account when calculating the thermal resistance [22,23,24]. In addition to thermal bridges, the cladding also has an effect on heat losses [25,26].

Point Thermal Bridges

Heat flows through point thermal bridges can be accessed through 3-D finite element modeling since their complex nature does not permit simpler approaches, which are usually assumed with linear thermal bridges [27,28,29]. The heat flow through the building element of course is not only determined by the thermal conductivity of the material but also by the thermal flow rates existing at the particular surfaces, i.e., the heat transfer. This is the transfer resistance known from the standards, formerly also referred to as transition coefficients. These transition coefficients are nothing else than the surface-related conductance values of the boundary layers existing between the ambient air/outside air and the element surface. If the temperature difference is given, the heat flow can be calculated simply by multiplying the surface-related conductance value by the temperature difference as follows:
q = U . δ θ
where:
  • q Heat flow in W/m2;
  • U  heat transfer coefficient in W/ (m2. K).
Since, as already assumed above, the heat flow can be assumed as being constant, it is possible with the correlation given according to Equation (2) to evaluate the existing temperature at any point. This correlation is documented in EN ISO 10211: 2008-04 as follows:
q = θ θ s R s
where:
  • q Heat flow in W/m2;
  • θ  the inside or outside temperature in K;
  • θ s  the temperature of the interior or exterior surface in K;
  • R s  the interior or exterior heat transfer resistance in m2. K/W.
Various architectural elements are applied in buildings, which can create thermal bridges due to their fixation. These can be linear thermal bridges or point thermal bridges. Determining the temperature on the inner surface from a 3-D calculation, if only two environments are included and the subsoil is not part of the geometric model, then the surface temperature can be expressed in a dimensionless form. In this paper, we focus mainly on point thermal bridges, which we analyze for the individual variants of anchoring elements. The value of the point loss factor is calculated according to the following relation [8]:
χ = L 3 D i = 1 N i U i A i j = 1 N j Ψ j l j ,
where:
  • L3D is the linear thermal transmittance determined from the 3-D calculation of a 3-D building structure separating the two environments in W/K;
  • Ui is the heat transfer coefficient of a 1D building structure separating two environments in W/ (m2. K);
  • Ai area over which the value applies Ui in m2;
  • Ψj linear loss coefficient W/(m. K);
  • lj the length of the geometric model over which the value applies Ψj in m;
  • Nj number of 2D building structures;
  • Ni number of 1D building structures.
When determining the point loss factor, it is necessary to state exactly which dimensions were used, because for some types of thermal bridges, the values of the linear loss factor depend on this choice.

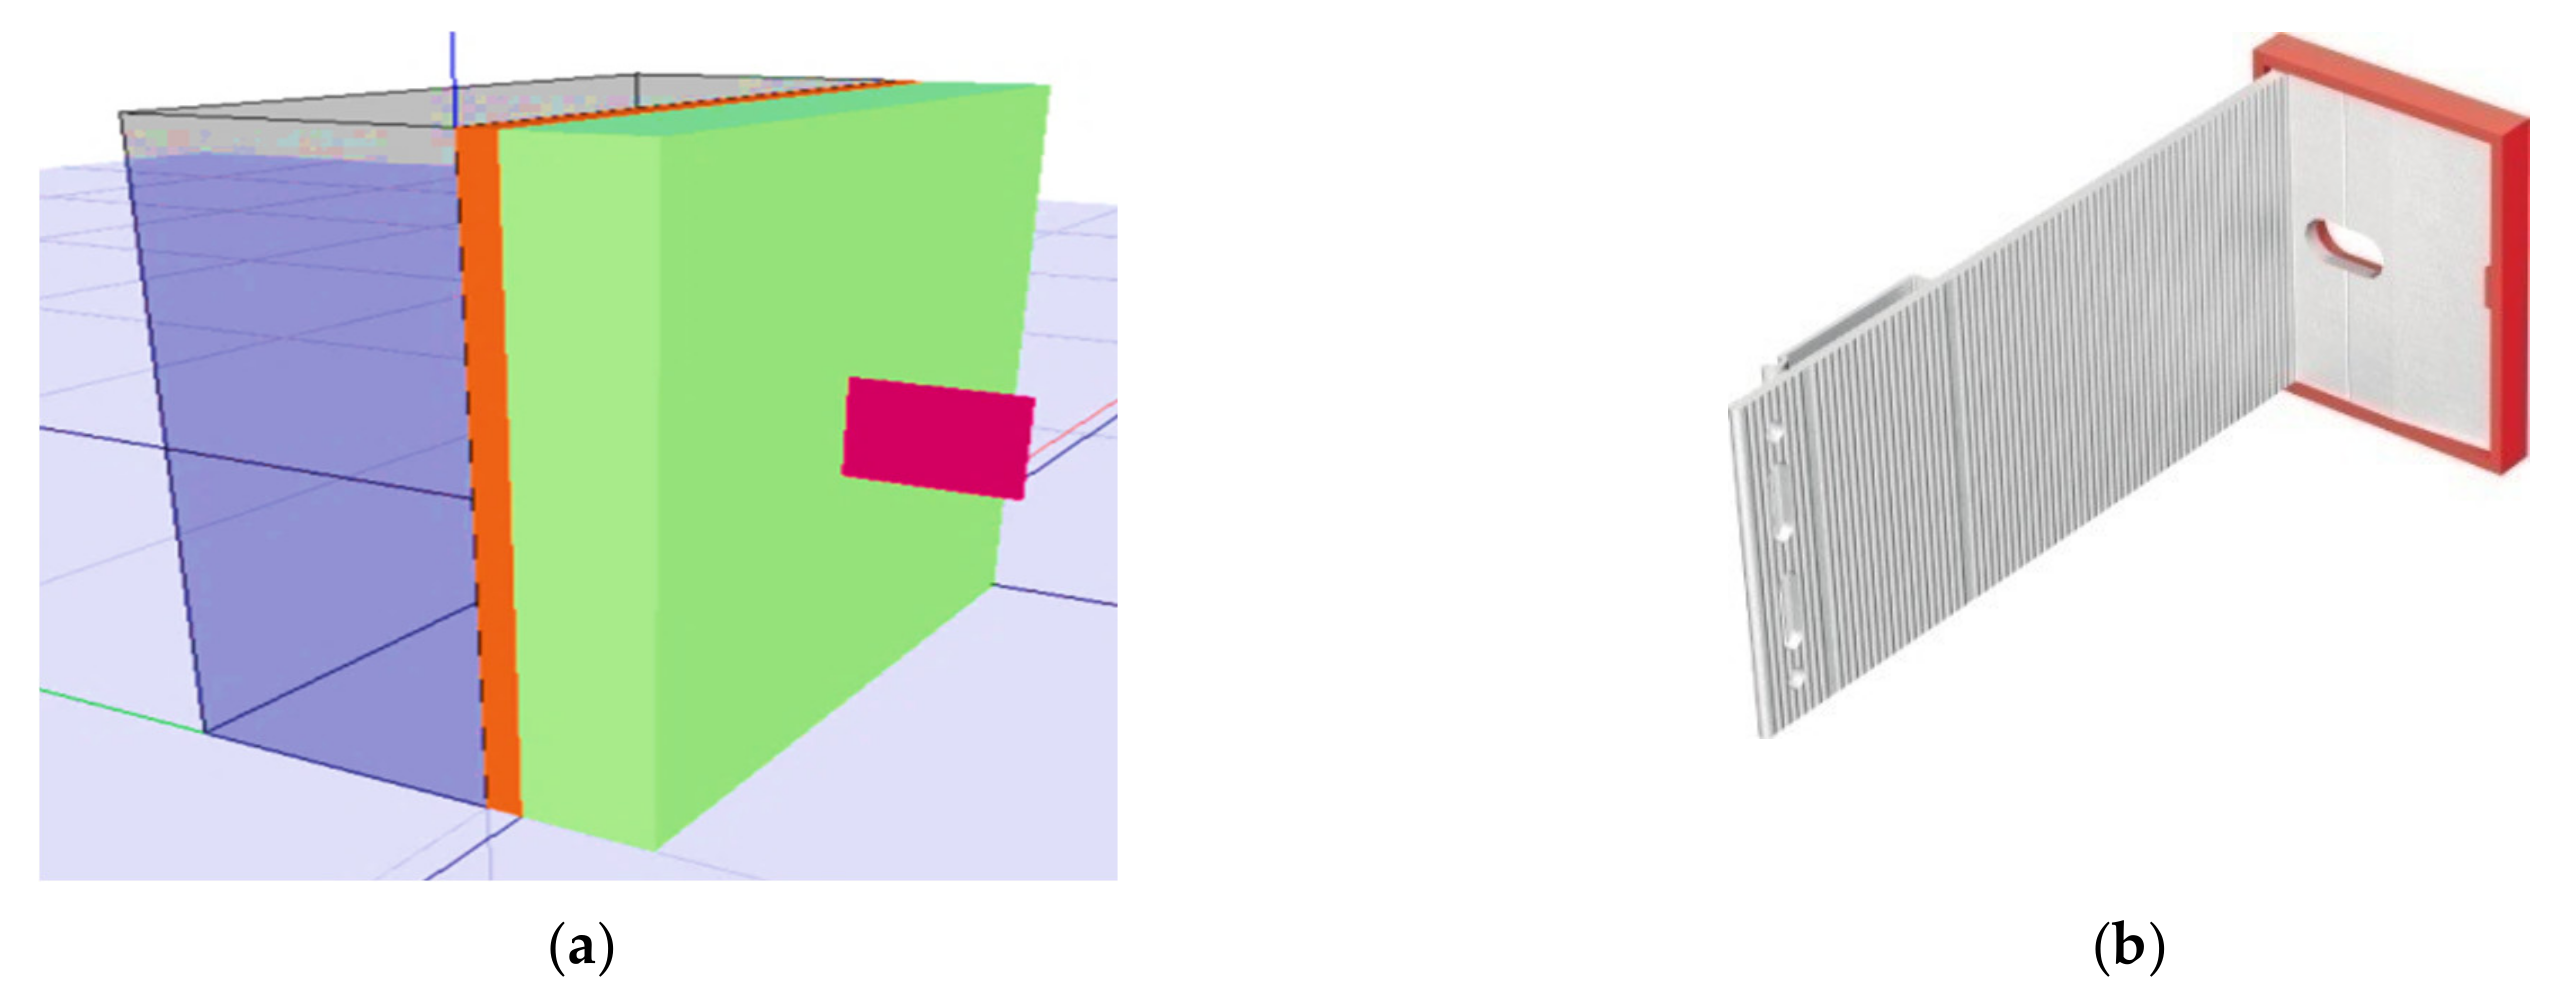
3. Calculation Method for the Analysis of Point Thermal Bridges

Ventilated facades represent a significant architectural element that is currently widely utilized in the creation and the implementation of buildings. It is a construction that is diffusely open and ensures the flow of moisture through the building envelope from the interior to the exterior. The composition of the ventilated façade (Figure 1) is characterized by the fact that the outer surface of such a façade is formed by the cladding. The surface of the facade can form, e.g., wood and materials based on wood or metal (noble alloys, aluminum, copper, stainless steel, concrete, glass, ceramic tiles, stone, plastics and others).
The ventilated façade is based on the principle of an air gap between the thermal insulation and the external façade cladding. For the system to work properly, it is necessary for air to flow into the gap. The ventilated gap system has a positive effect on the course of humidity. The ventilation gap is usually part of diffusely open constructions [26,27]. In the case of ventilated thermal insulation systems, the thermal insulation is attached to the load-bearing wall or inserted between the grates. The construction of the grate is typically made of aluminum, galvanized steel, or wood. The choice of material for the grate is influenced by the applicable fire regulations. The design of the grate depends on the selected type and format of the facade cladding. The primary disadvantage of such systems is that there are 3-D point bridges on the surface, which are formed by the anchoring elements themselves (Figure 2). Therefore, the designer must take into account the effect of thermal bridges in the calculation by increasing the insulation thickness. When calculating, it is necessary to consider the thermal insulation properties of the insulated wall.

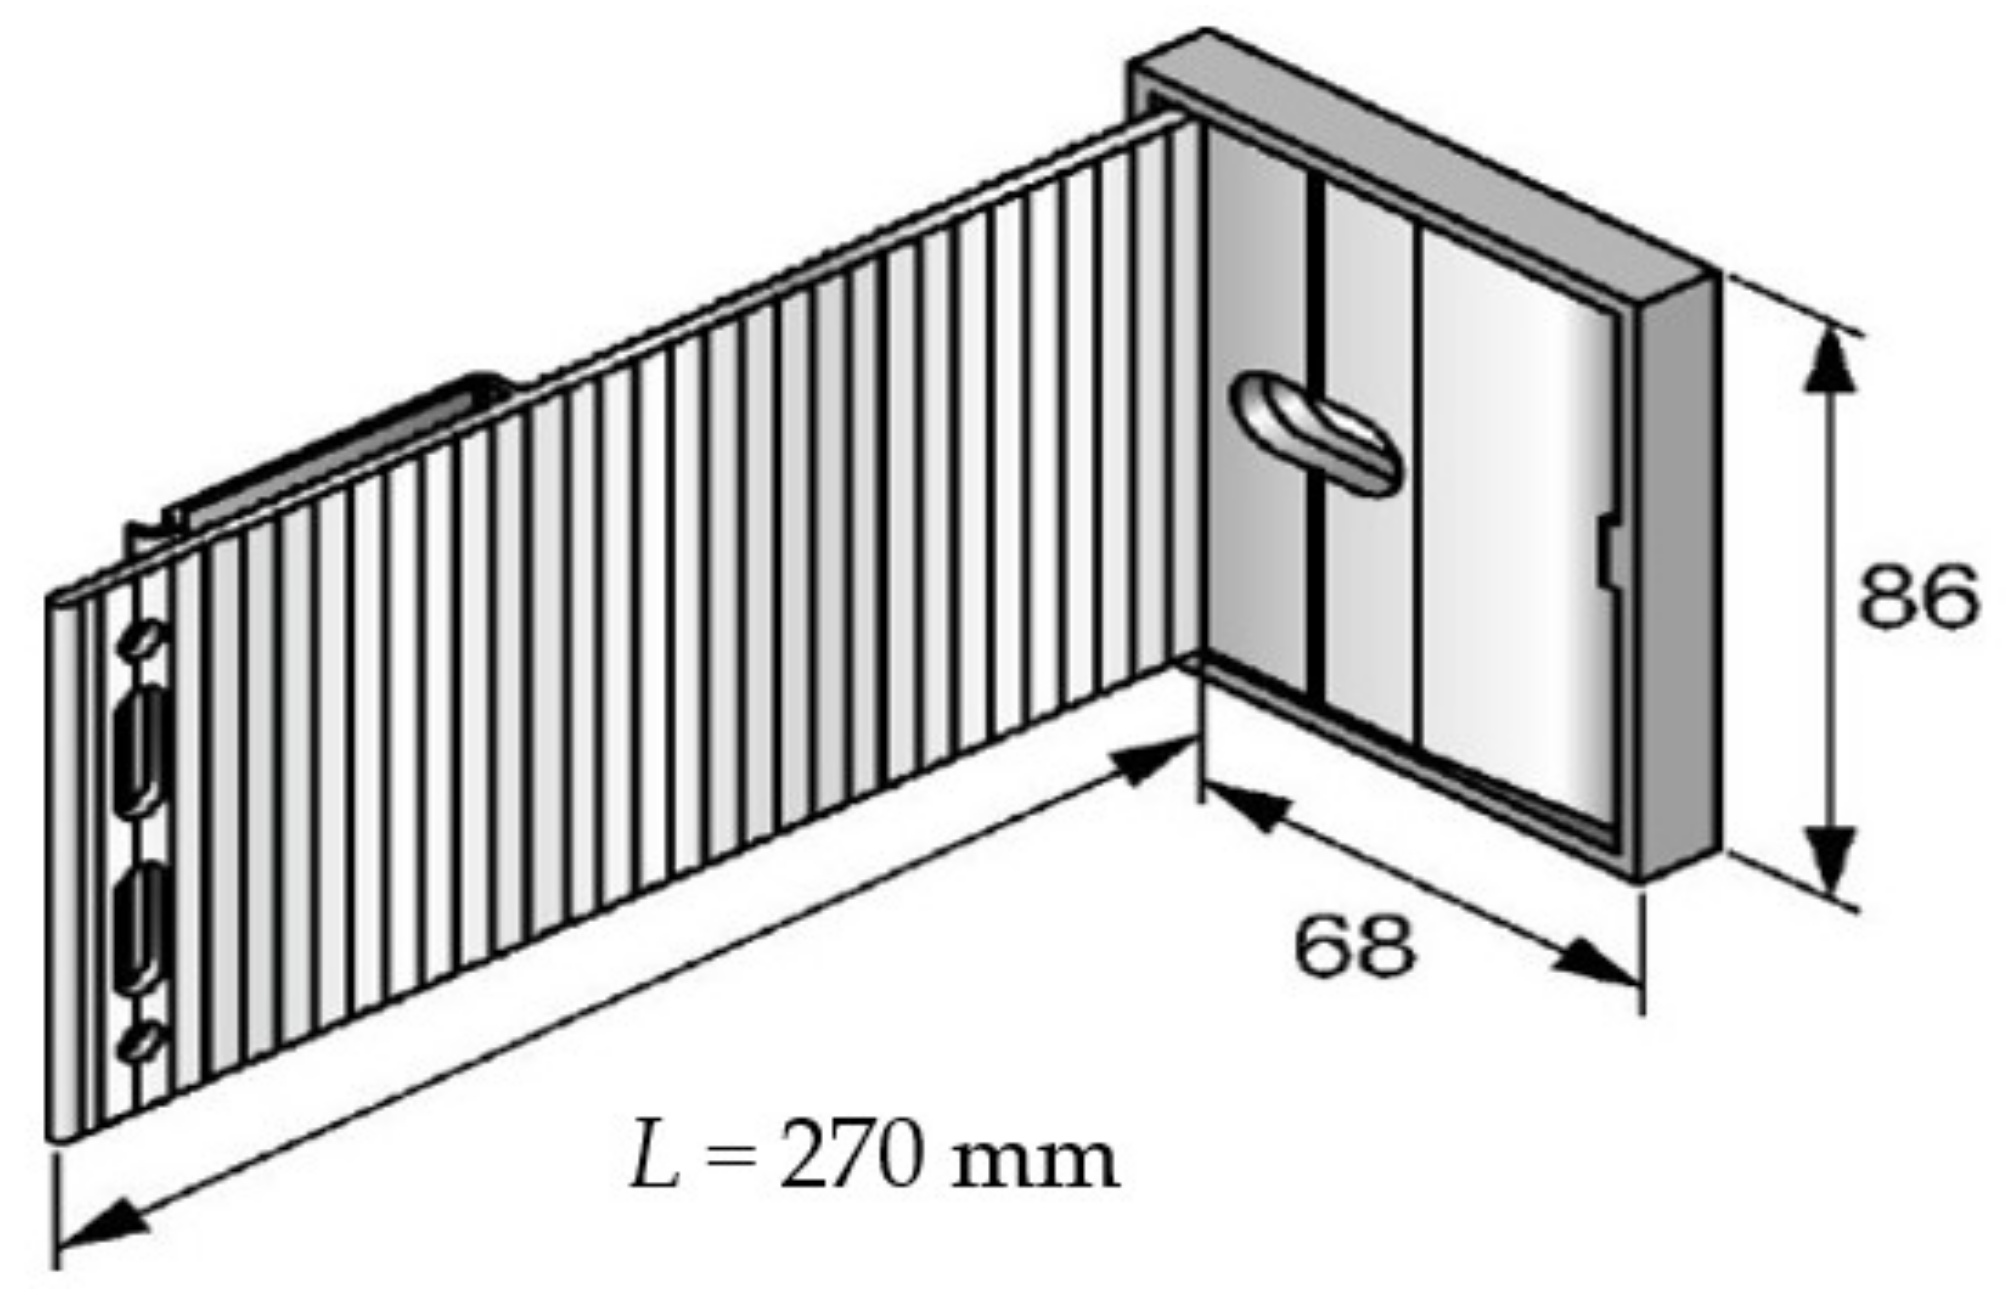
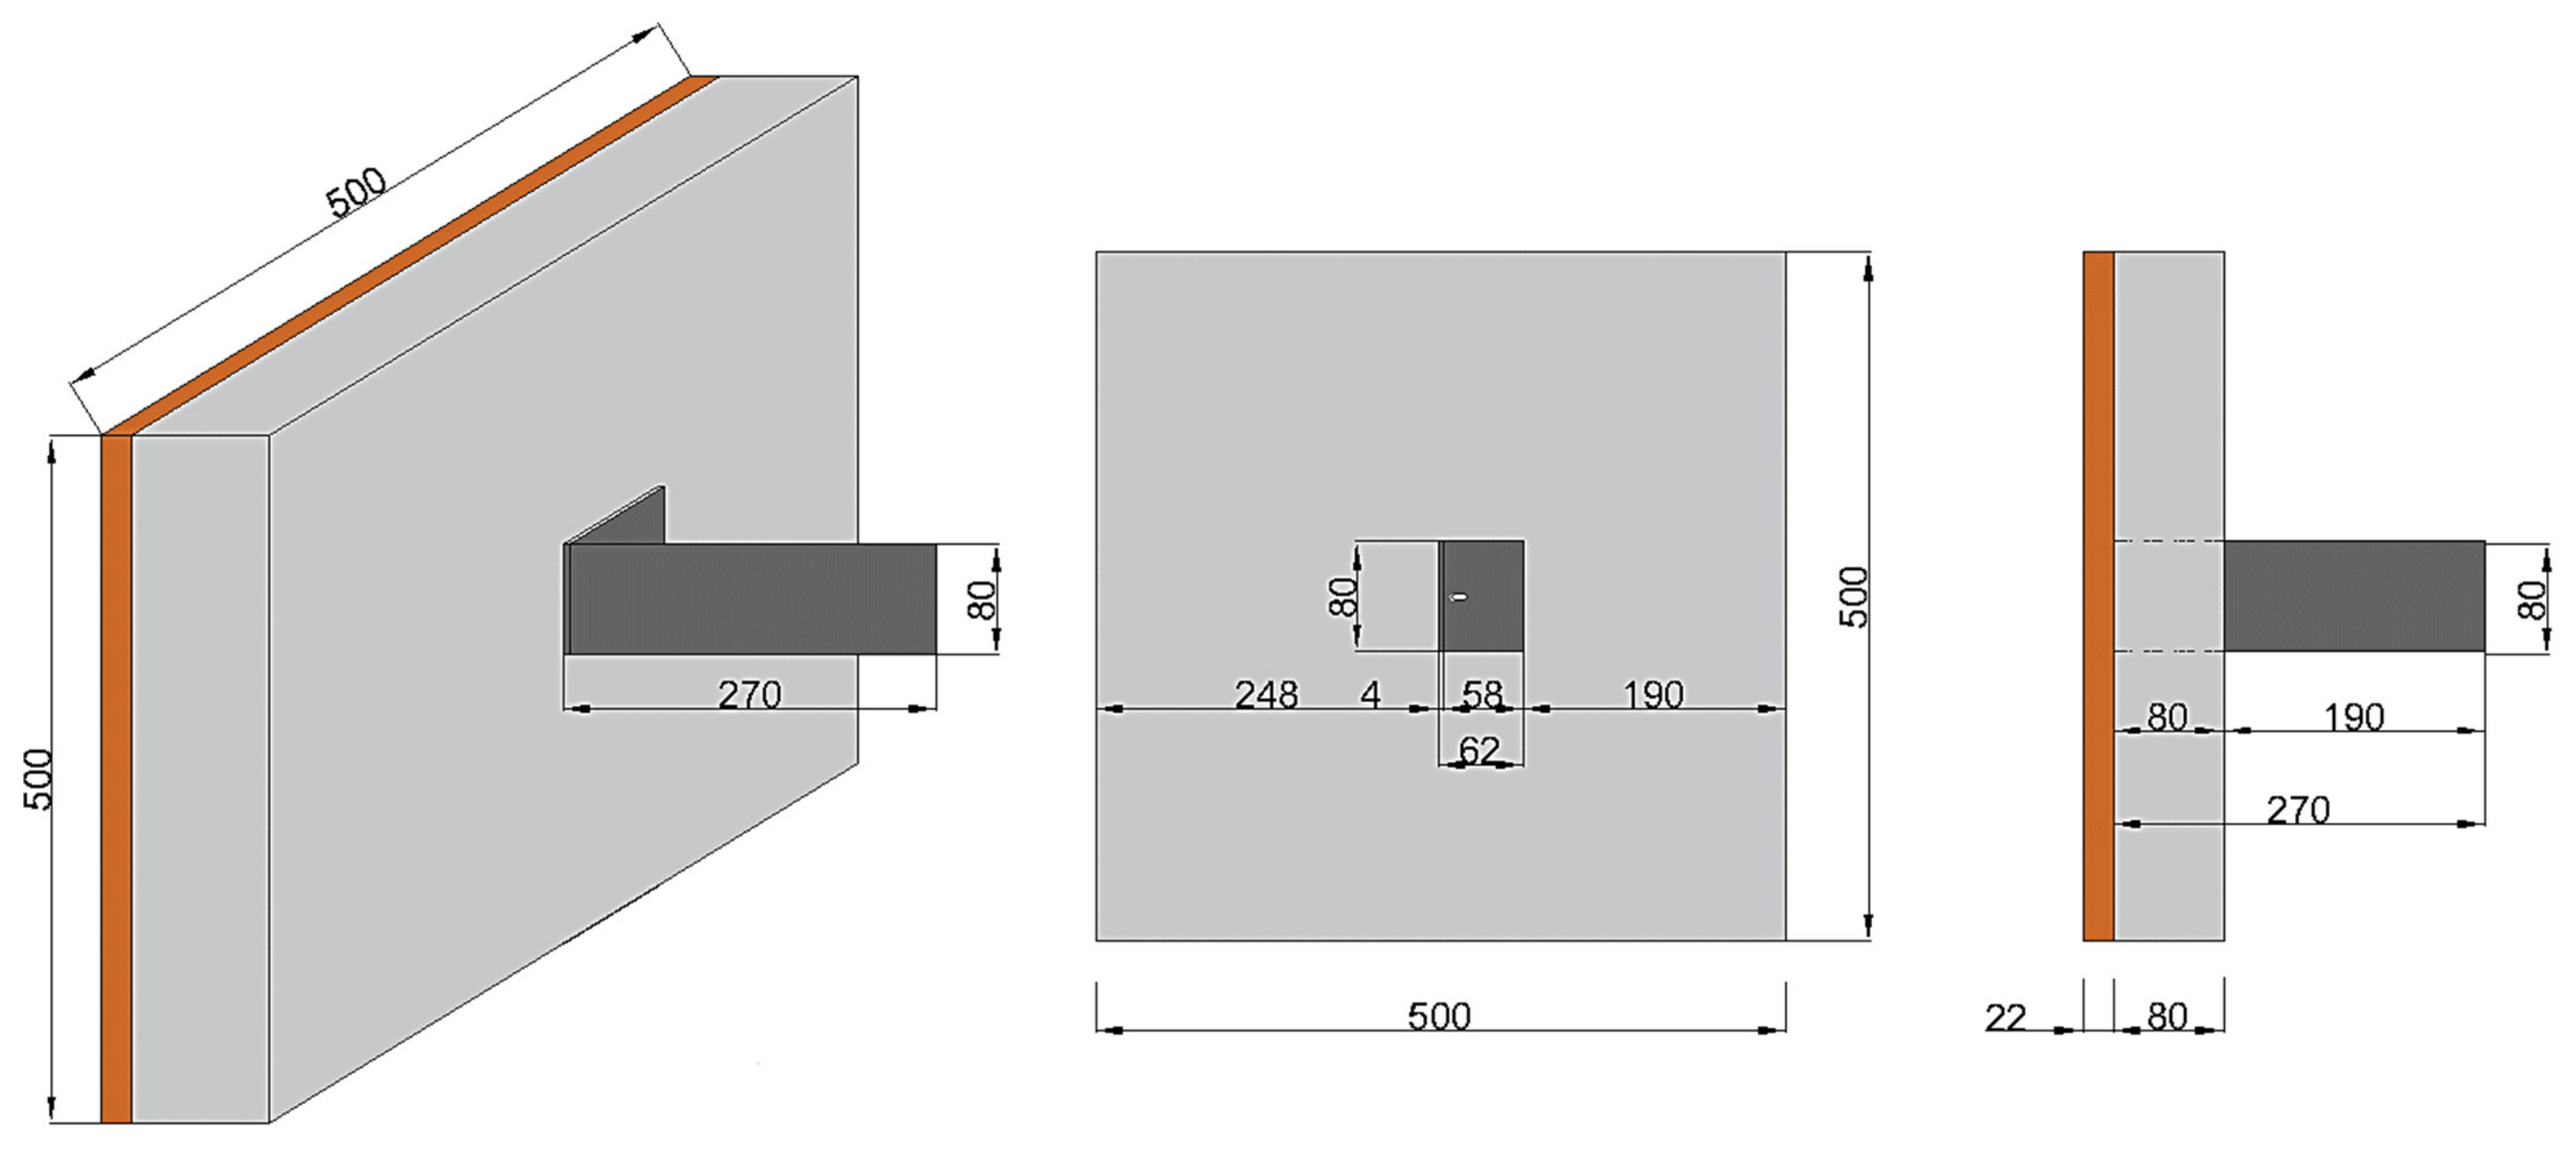
3.1. Description of Samples Used in the Calculation Method of Point Thermal Bridges

The main goal of the calculation method was to determine the different heat fluxes of the three variants of the design solution of the mechanical anchoring of the load-bearing gratings, which are part of the ventilated facades. These variants are considered: (1) an anchor without modifications to eliminate the thermal point 3-D bridge, (2) an anchor without modification to eliminate the thermal point 3-D bridge and (3) an anchor with modification to eliminate the thermal point 3-D bridge. There are various producers of such anchoring systems, but a system from the HILTI company was chosen for the given analysis because this system is the most used in our market. At present, high demands are placed on the thermal-technical properties of the peripheral shells, which form the heat-exchange cover and consequently, the anchoring elements already cause a significant effect on the thermal-technical properties themselves. HILTI anchors (Figure 3) are currently one of the best manufacturers on the market and are providing various dynamic options and special technical support. Their quality is determined by excellent static and mechanical properties. Their choice was influenced by the fact that their systems are used in all major buildings. These anchoring elements are included in anchor brackets, of which there are several types (approx. 15 types of anchor brackets). One type of anchoring brackets was chosen for the given experiment, which is the most used in our market as it is a quality technical and economical solution. It is an anchoring bracket marked MFT-MFI M.
As we can see in the previous figure, the total length of the anchor was from 40 mm to 270 mm. The total length depends on the thickness of the thermal insulation and the thickness of the ventilated layer. Until 2012, this system of anchoring brackets was used (Figure 3). At this time, the thermal technical requirements for perimeter cladding were not so strictly set yet. The heat transfer coefficient was UN = 0.32 W/ (m2. K) according to our standard [31]. With the increasing demands on the energy efficiency of buildings, the requirements for the elimination of heat losses through the passage of heat through the heat exchange envelope also increased. Therefore, it was necessary to eliminate all the thermal bridges, whether the linear or the point thermal bridges. Due to the more demanding thermal engineering requirements after 2016, these anchoring brackets had to be modified to eliminate the point thermal bridges, which also increase heat losses due to heat transfer. The heat transfer coefficient after 2016 is UN = 0. 22 W/ (m2.K) according to our standard [31]. These anchor brackets were supplemented with polypropylene pads (Figure 4). This solution is economically less advantageous because it is another built-in element. In addition, with such a solution, there is also a more significant initial investment for the anchoring console.
Therefore, an innovative technical solution of the anchoring console was developed, which is the patent of one of the authors (Figure 5). A more detailed description is given in Section 4.
The thermal properties were used from the manufacturers of the given materials and are shown in the following Table 1.
The selected boundary conditions correspond to the conditions that were considered in the experimental measurement. The interior temperature θi = 23.05 °C, and the exterior temperature θe = −15.22 °C. The resistance to heat transfer through the structure is Rsi = 0.13 m2. K/W a Rse = 0.04 m2. K/W. These temperatures characterize the steady-state temperature during the measurement of the heat flux in the climate chamber (Figure 17). The thermal conductivity of a plastic-coated anchor is not easy to measure. Various devices from the Department of Materials Engineering at the Faculty of Civil Engineering in Bratislava were also used. To determine the thermal conductivity, it would be necessary to measure only the material itself in a climate chamber. The climate chamber was first used in the 1970s [32]. Homogeneous samples and later inhomogeneous constructions were solved first [33]. This author developed general rules for the construction of the chamber climate and also proposed a procedure for assessing heat loss. Among other things, the surface materials of the individual samples are also important [34]. In addition to the material used to plasticize the anchor, the thickness of the plastic applied to the anchor certainly has a significant effect. This will be the subject of further investigation. The description of individual variants is shown in Table 2.
This work is only about interpreting the results from the measurement of individual samples, which are used only to compare the results and the initial estimate of the impact of various adjustments on the samples. It is not a precise determination of the thermal conductivity of the fragment with the used sample but a representation of the initial influence of the proposed modifications, which eliminate thermal point 3-D bridges. As these are dry materials, the effect of moisture on thermal conductivity has not been investigated. Humidity was measured for OSB board only. The following table describes the individual variants analyzed.

3.2. Calculation Analysis of Individual Variants

The Section describes the results of the simulation analysis of variants that were used in the experimental measurement. It is mainly about monitoring the difference between the results of the heat transfer coefficient of individual variants and determining the thermal conductivity of the plastic-coated anchor, which is proposed by the author. The PSI-Therm 3-D program was used for the analysis of individual variants [35]. The PSI-Therm software is the leading Finite Element Mesh analysis tool available for the analysis of thermal bridges in construction components. This powerful design tool is validated to EN ISO 10211 [8], with automatic mesh generation in order to ensure accurate results in accordance with EN ISO 10211 [8]. The software now comes with a boundary condition database for analysis according to BR497 and Passive House conventions. Saving you the need for complicated spreadsheets and numerous external calculations, the software produces U-values, Psi-values (linear thermal transmittance) and Frsi-values (temperature factor), producing a comprehensive report in accordance with the requirements of the international standards. The finite element mesh calculation is performed in accordance with EN ISO 10211 [8]. Boundary conditions according to BR497 and Passive House are available in the boundary condition tables.

3.2.1. Hilti Anchor Analysis without Interrupting Point Thermal bridges

This is a variant where the anchor is directly anchored to the supporting OSB board without the use of modifications to break the thermal bridge. The OSB board was modeled in a simulation program PSI-Therm because such a case was considered in an experimental measurement to determine the thermal conductivity of the patented anchor. The experiment will be published in the next post. The following Figure 6 shows the model with modeled boundary conditions for the 3-D method.

3.2.2. Analysis of an Anchor from Hilti with the Break of Point Thermal Bridges—A Technical Solution from Hilti

It is a model where the anchor is directly anchored to the supporting OSB board using modifications to break the thermal bridge. The following Figure 7 shows the model with modeled boundary conditions for the 3-D method. Individual materials and their thermal properties (such as OSB board, thermal insulation, anchor, pad thermal barrier) are shown in Table 3.

3.2.3. Analysis of an Anchor from the Hilti Company with Break of Point Thermal Bridges—Technical Solution of the Author of the Article (Patent)

It is a model where the anchor is directly anchored to the supporting OSB board using a modification to break the thermal bridge by plasticizing the anchor (Figure 8).

3.2.4. Comparison of Results for Individual Variants

Table 3 shows the heat transfer coefficients for the first variant, which represents the results without the anchor and the other analyzed variants. The second variant represents the results when using the anchor without modification to eliminate the thermal bridge. The third variant represents the results when using the anchor with the modification to eliminate the thermal bridge. The fourth variant represents the results when using the anchor with the modification to eliminate the thermal bridge by plastic coating. The plastic coating itself is applied directly to the Hilti anchor. It is a complex plastic coating, where a layer is formed on the surface of the anchor, which is to reduce the thermal conductivity of the aluminum anchor. This is a break in the thermal bridge to change the emissivity of the material.

3.3. Influence of Point 3-D Thermal Bridges on Heat Losses through Heat Transfer for Different Variants of Ventilated Façade by Rockwool

This Section describes the analysis of the influence of anchors on real compositions of the perimeter shell with different compositions. It is mainly an expression of the influence of the number of anchors on the heat transfer coefficient of individual compositions and assessment according to the requirements of STN 73 0540—2: 2012, Z1: 2016 + Z2: 2019 [31]. For the given analysis, a real anchor with thermal bridge break using a plastic pad was used. The modeled 3-D detail is shown in the following figures (Figure 9). The PSI-Therm program is used for the simulation. The reinforced concrete wall was chosen for the load-bearing structure. As such a concept is used the most in practice. In order to meet the requirements for the heat transfer coefficient, a thermal insulation thickness of 140 mm was chosen. We considered two thermal conductivities of thermal insulation: (a) 0.033 W/ (m. K) and (b) 0.035 W/(m. K). These thermal conductivities represent the values of the company’s materials Rockwool.
A basic description of the selected compositions is given in Table 4.
The following Figure 10 shows the dependences of the heat transfer coefficient on the number of pieces of anchors for the individual variants described in Table 4.
As can be seen from the previous figure, the significant influence of the number of anchoring brackets on the heat transfer coefficient of the structure is mainly in the case of a reinforced concrete load-bearing structure. When using masonry structures (where the thermal conductivity of the material is about from 0.15 to 0.3 W/ (m. K)), the thermal conductivity is lower and therefore the anchoring elements would have a significantly lower effect on the total heat loss through the perimeter wall. According to standard, it is necessary to reach a maximum value of U = 0. 22 W/ (m2. K) [31]. Even when using one anchor, the given perimeter wall does not meet the current thermal engineering requirements. One possible solution is to add a thicker insulation (Figure 10) or use anchors with thermal breaks. With a thermal insulation thickness of 140 mm and the use of one anchor, the heat transfer coefficient is from 0.26 W/ (m2. K) to 0.27 W/ (m2. K). For the given analysis of the influence of point thermal bridges on the total heat losses, a real administrative building with a ventilated façade was selected (Figure 11). The building was built of monolithic reinforced concrete with a thickness of 200 mm and insulated with mineral wool hr. 180 mm, which is part of the ventilated facade. The floor area of the administrative building is 335.8 m2, and the heated volume is 1074.56 m3 (Table 5).
From the calculation of heat demand, the total heat losses through heat transfer (Table 6) and the specific heat demand for heating (Table 7) were analyzed. The given tables show the results of the influence of different numbers of anchoring brackets on heat losses.
It can be seen from the previous tables that the number of anchors has a significant effect on the total heat loss due to heat transfer as well as on the total energy need for heating. Applying three pieces of anchors will increase heat losses by heat transfer by 83.9% (Table 6). Such an increase in heat loss is no longer negligible. Energy needs for heating, when using three pieces of anchors, will increase by 33.98%. In addition to the energy savings, there are also financial savings when using Variant no. 4. This is a comparison with Variant no. 3. While the plastic pad costs about EUR 0.3 [3-D], the plastic coating represents a price of around EUR 0.03. The price is realistic directly from the company for plasticizing the anchor. Which means significant savings when using three to six pieces per square meter on major buildings with a significant area of the perimeter. The area of the perimeter wall of the selected building is 314.6 m2 (Table 5). When applying three anchors, the saving is EUR 254.82. When applying six anchors per 1 m2, the saving is EUR 509.65. If we had a building with 10,000 m2 of wall area where six pieces of anchors per 1 m2 are applied, the savings would be EUR 16,200. Such savings are already significant. The savings are calculated using only a simple method without taking into account inflation, which is unfavorable this year. This would mean that the real savings would be much greater. These calculations can be applied to other buildings whose load-bearing structure is built of reinforced concrete and ventilated facade.

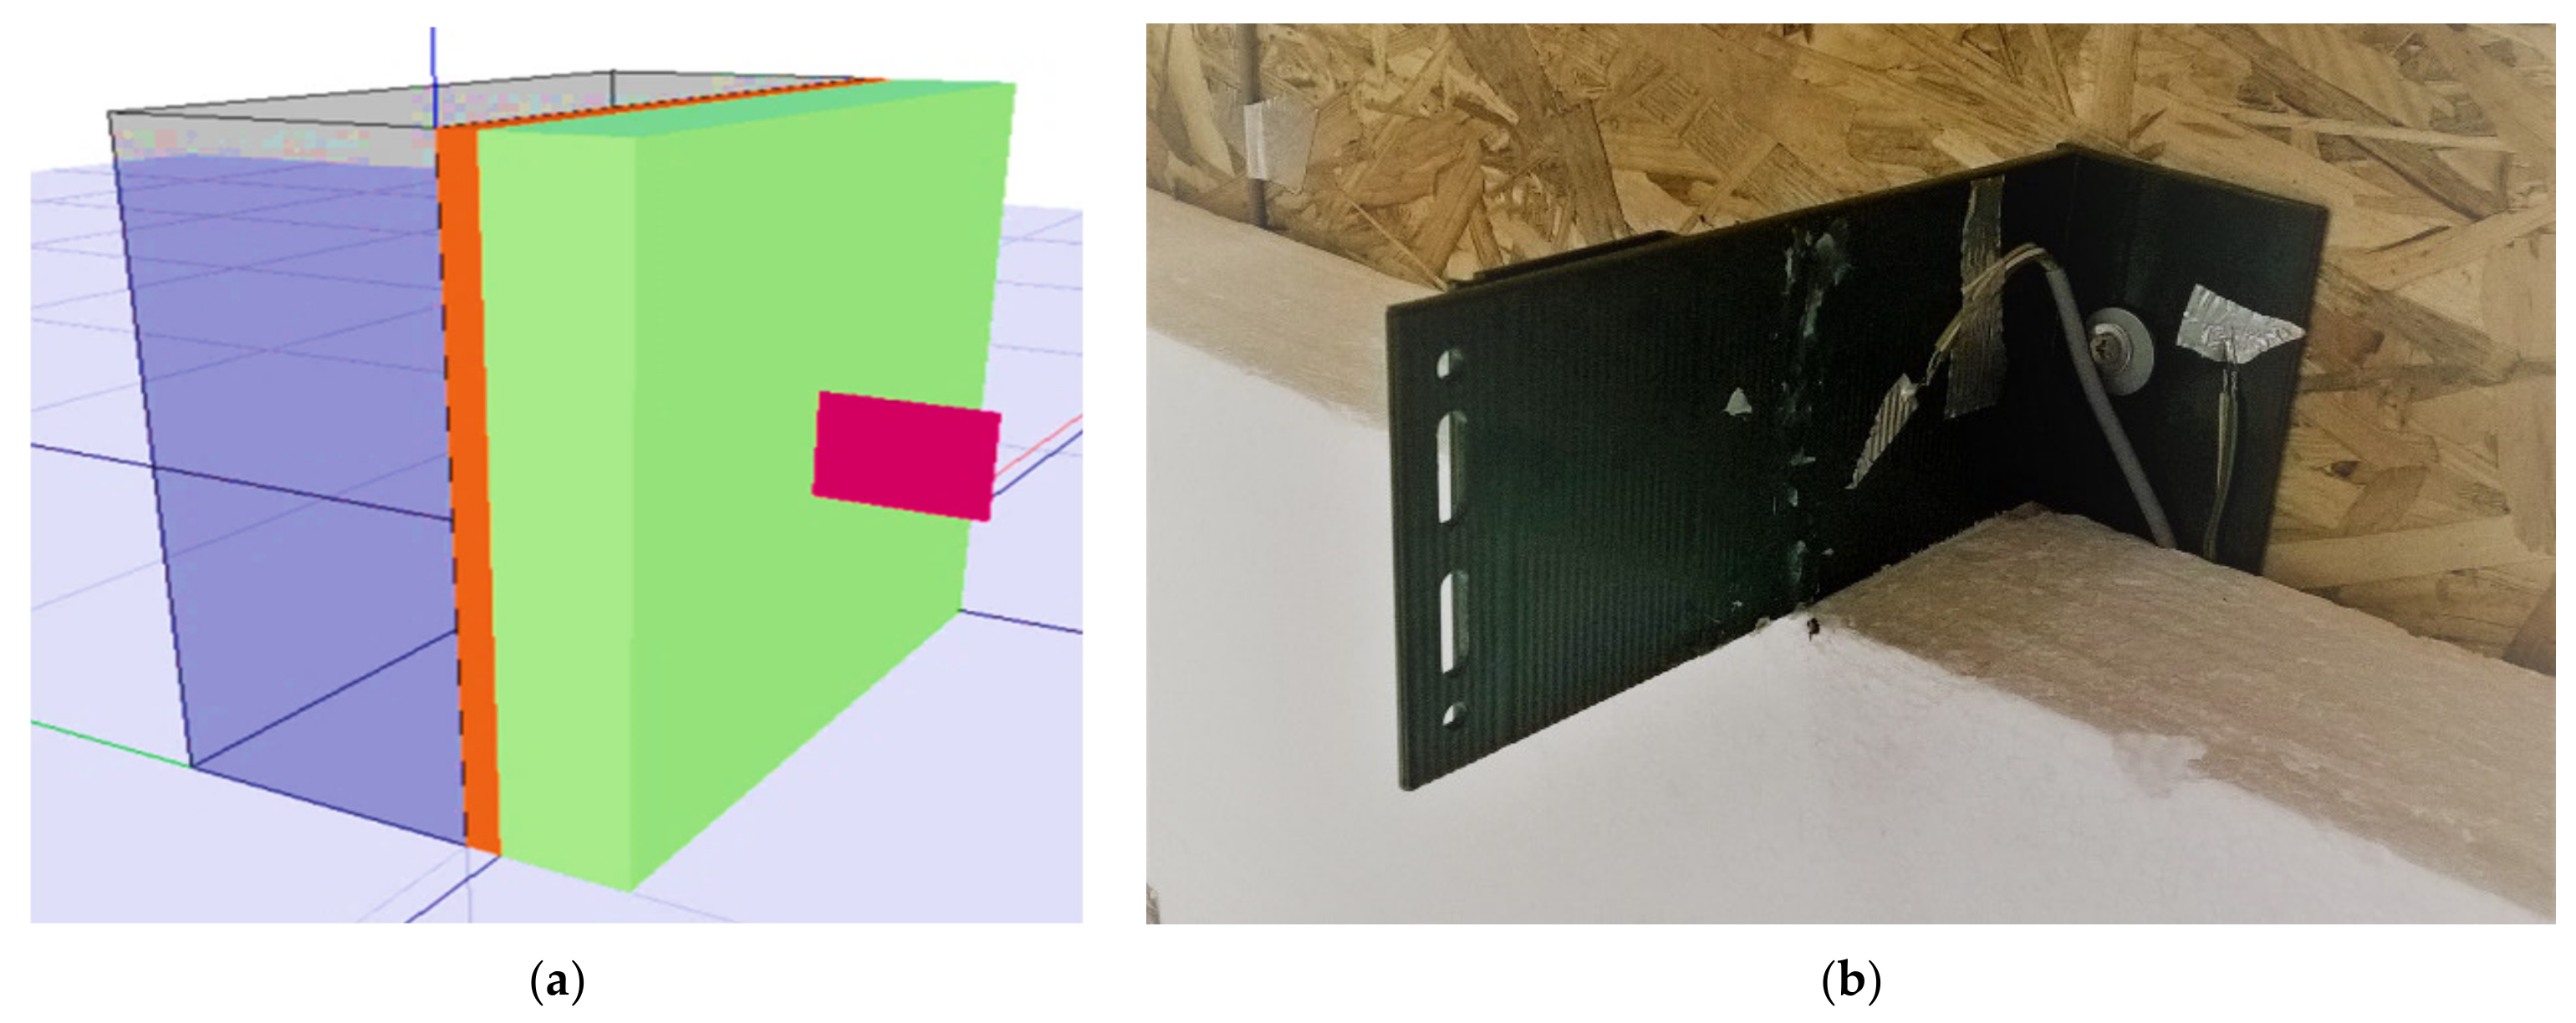
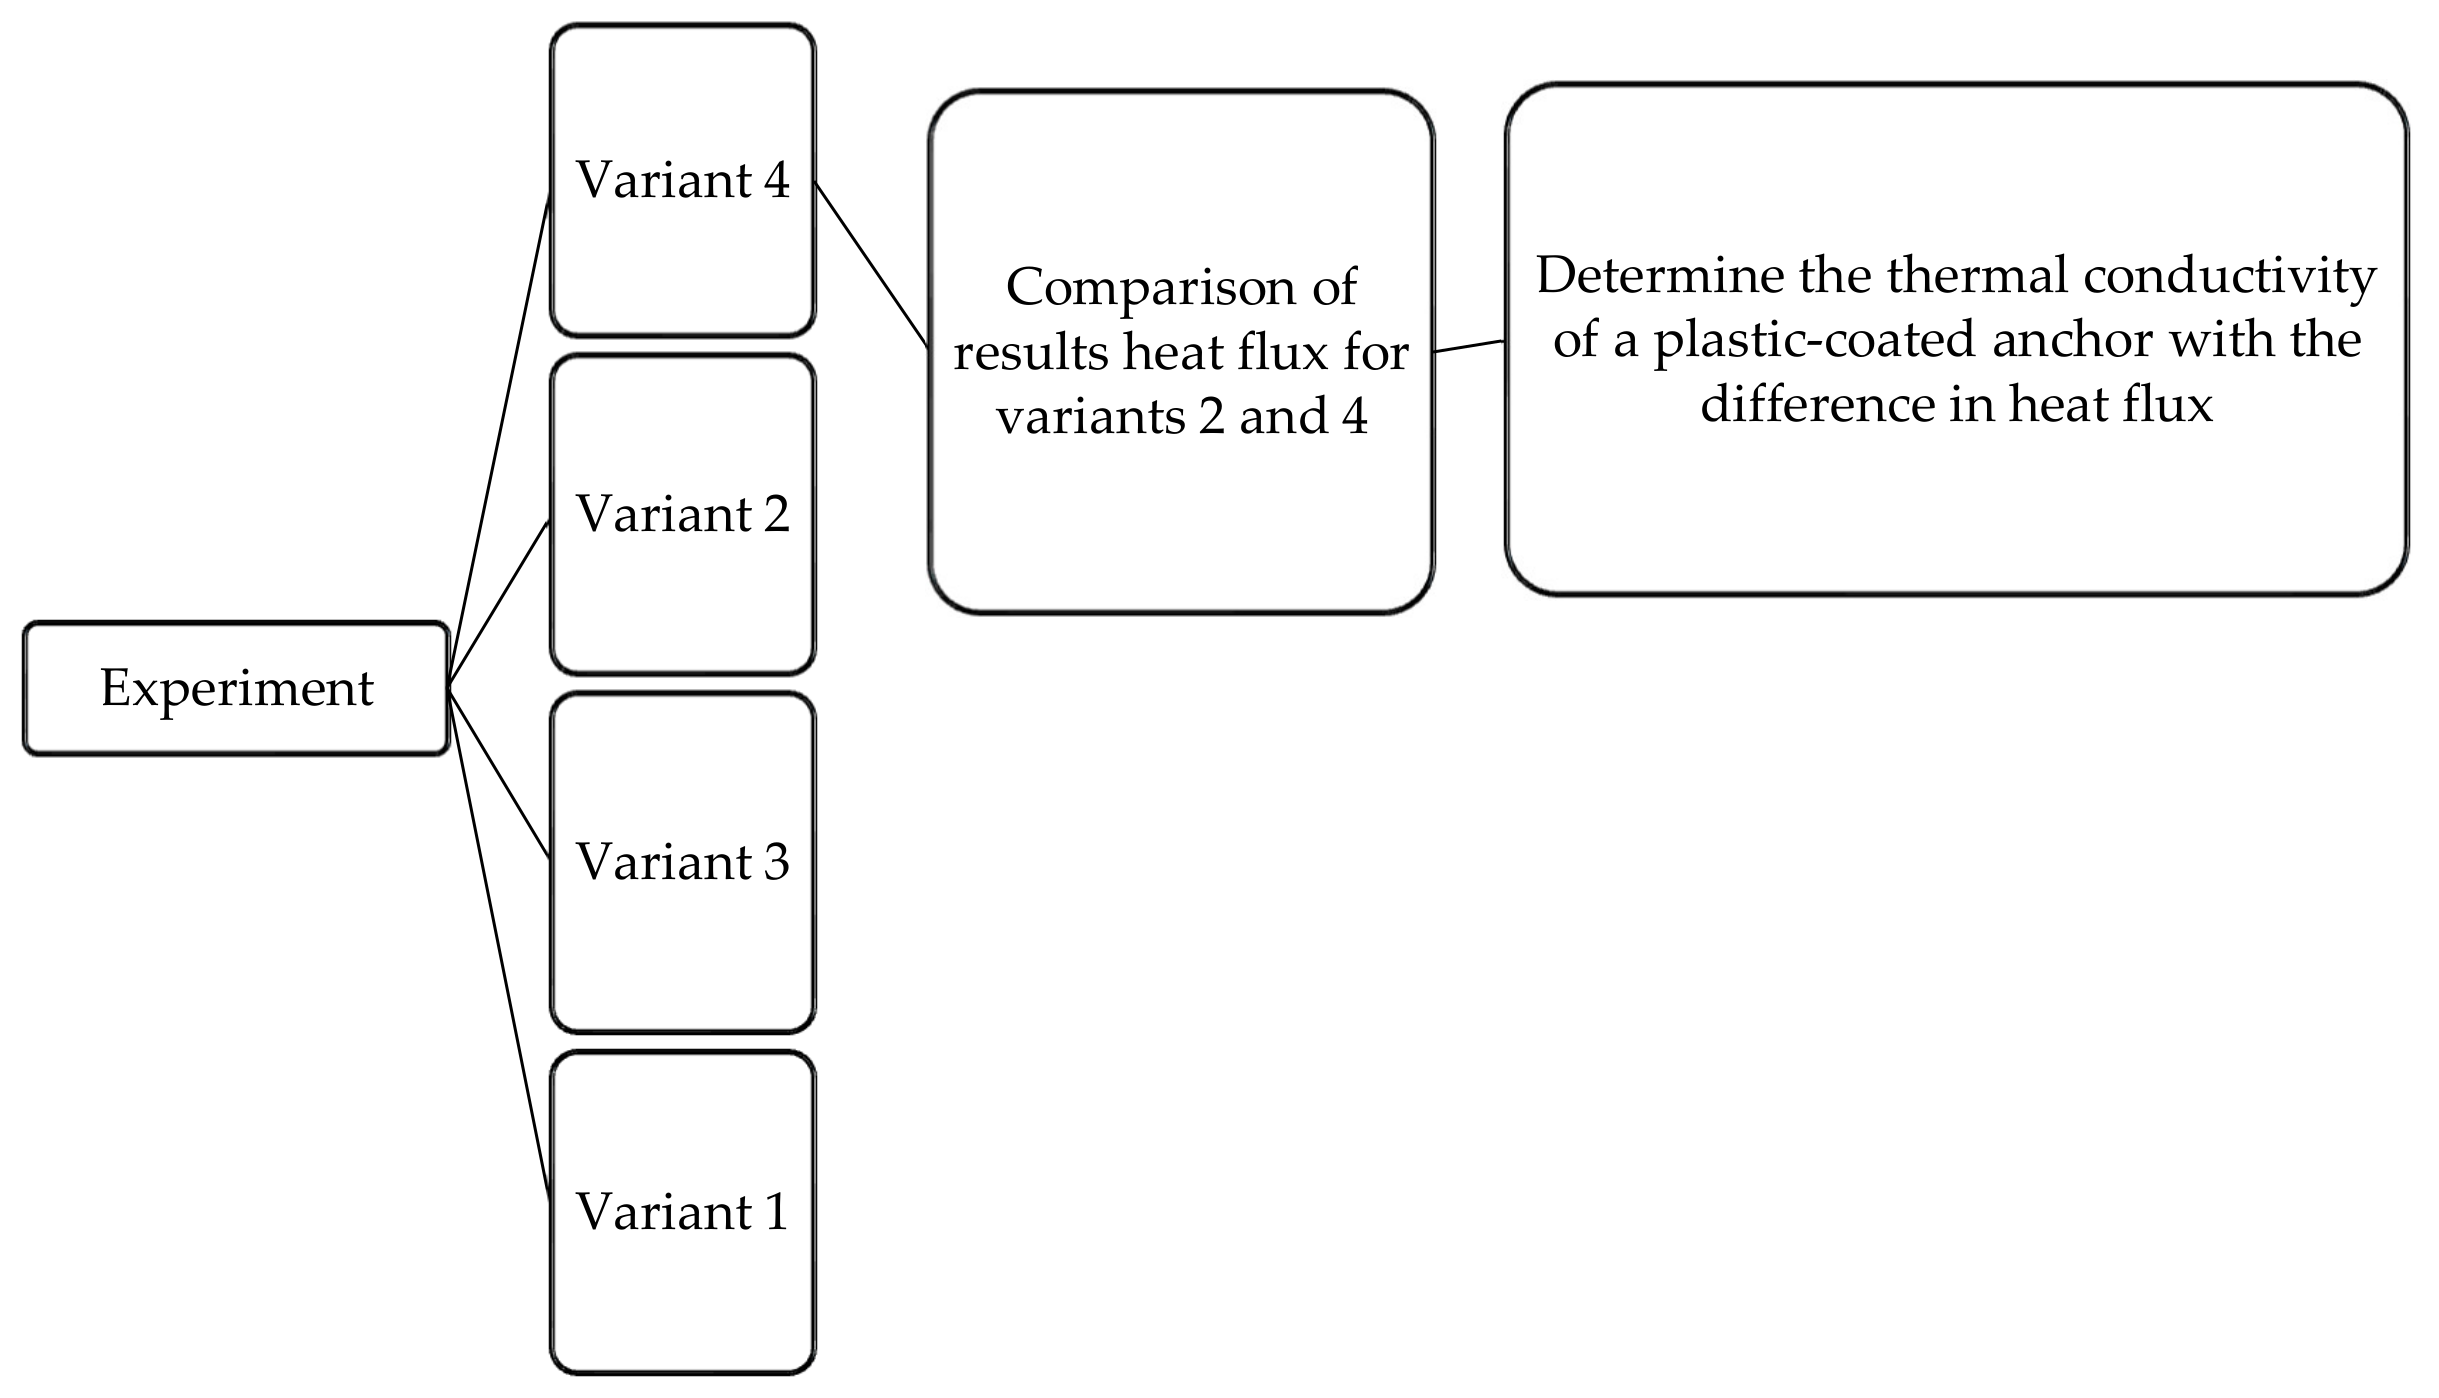
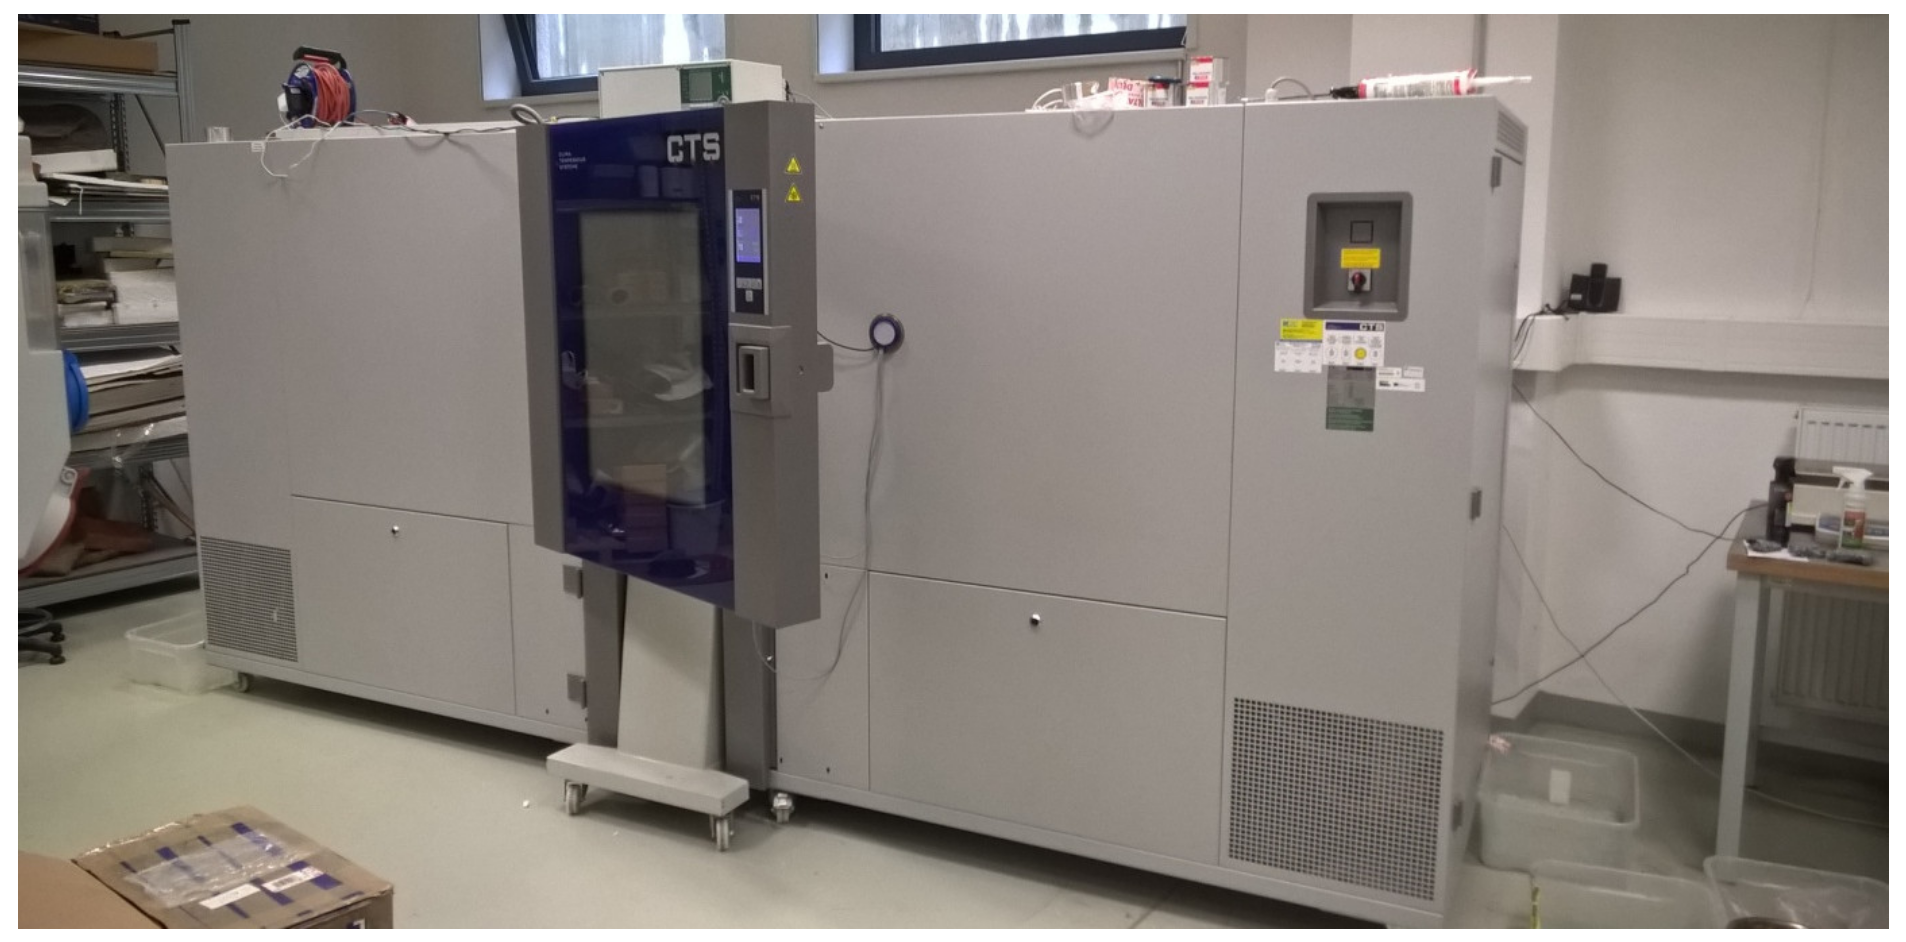
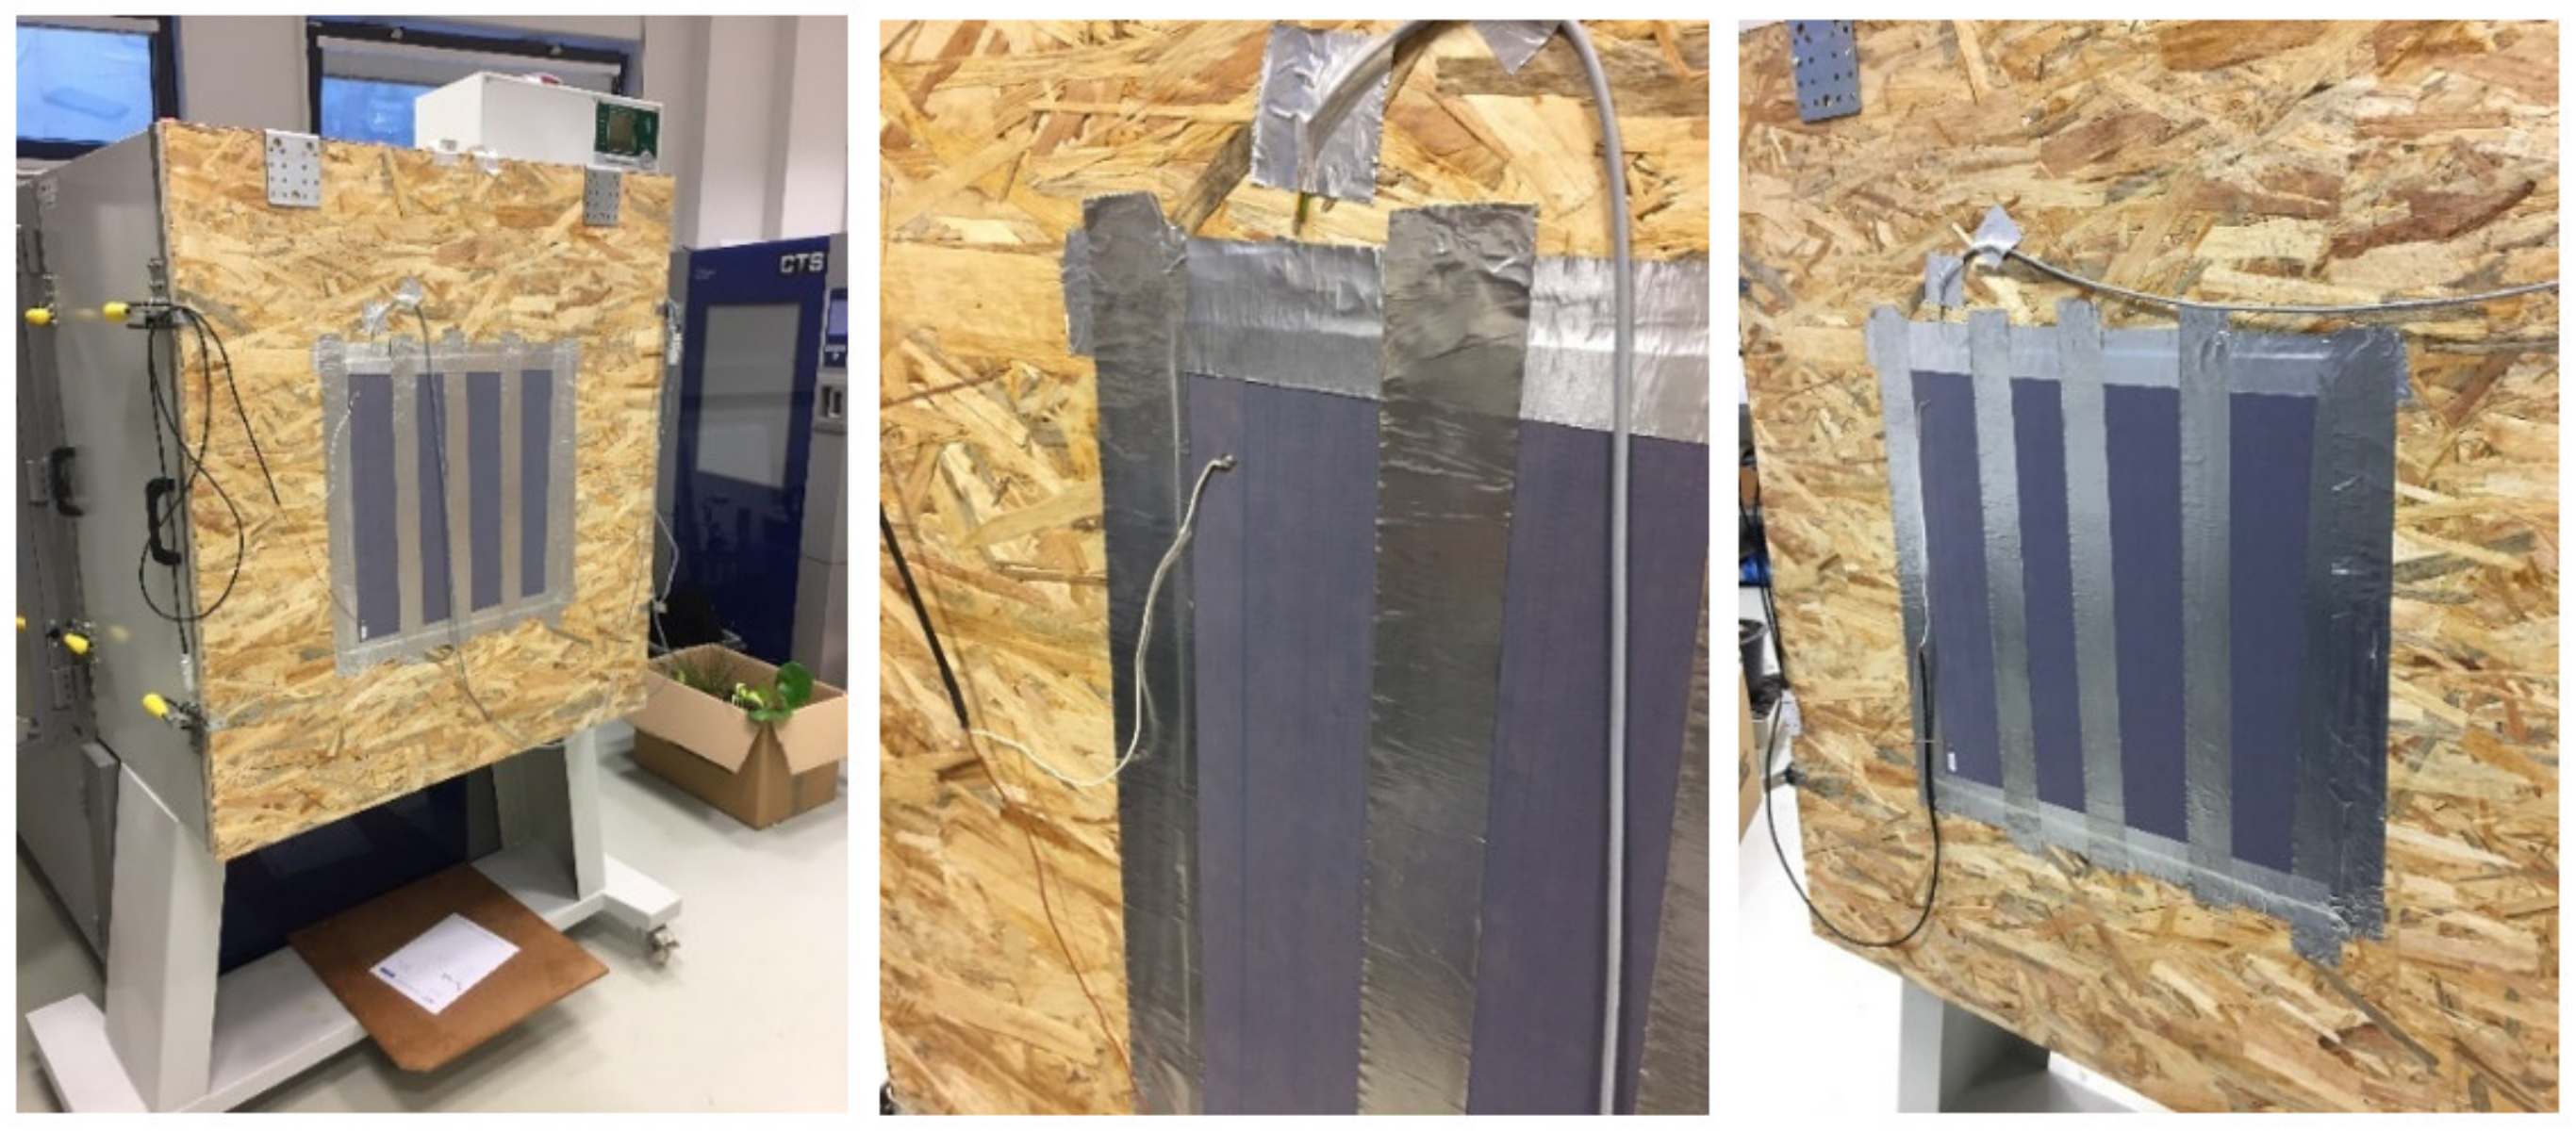
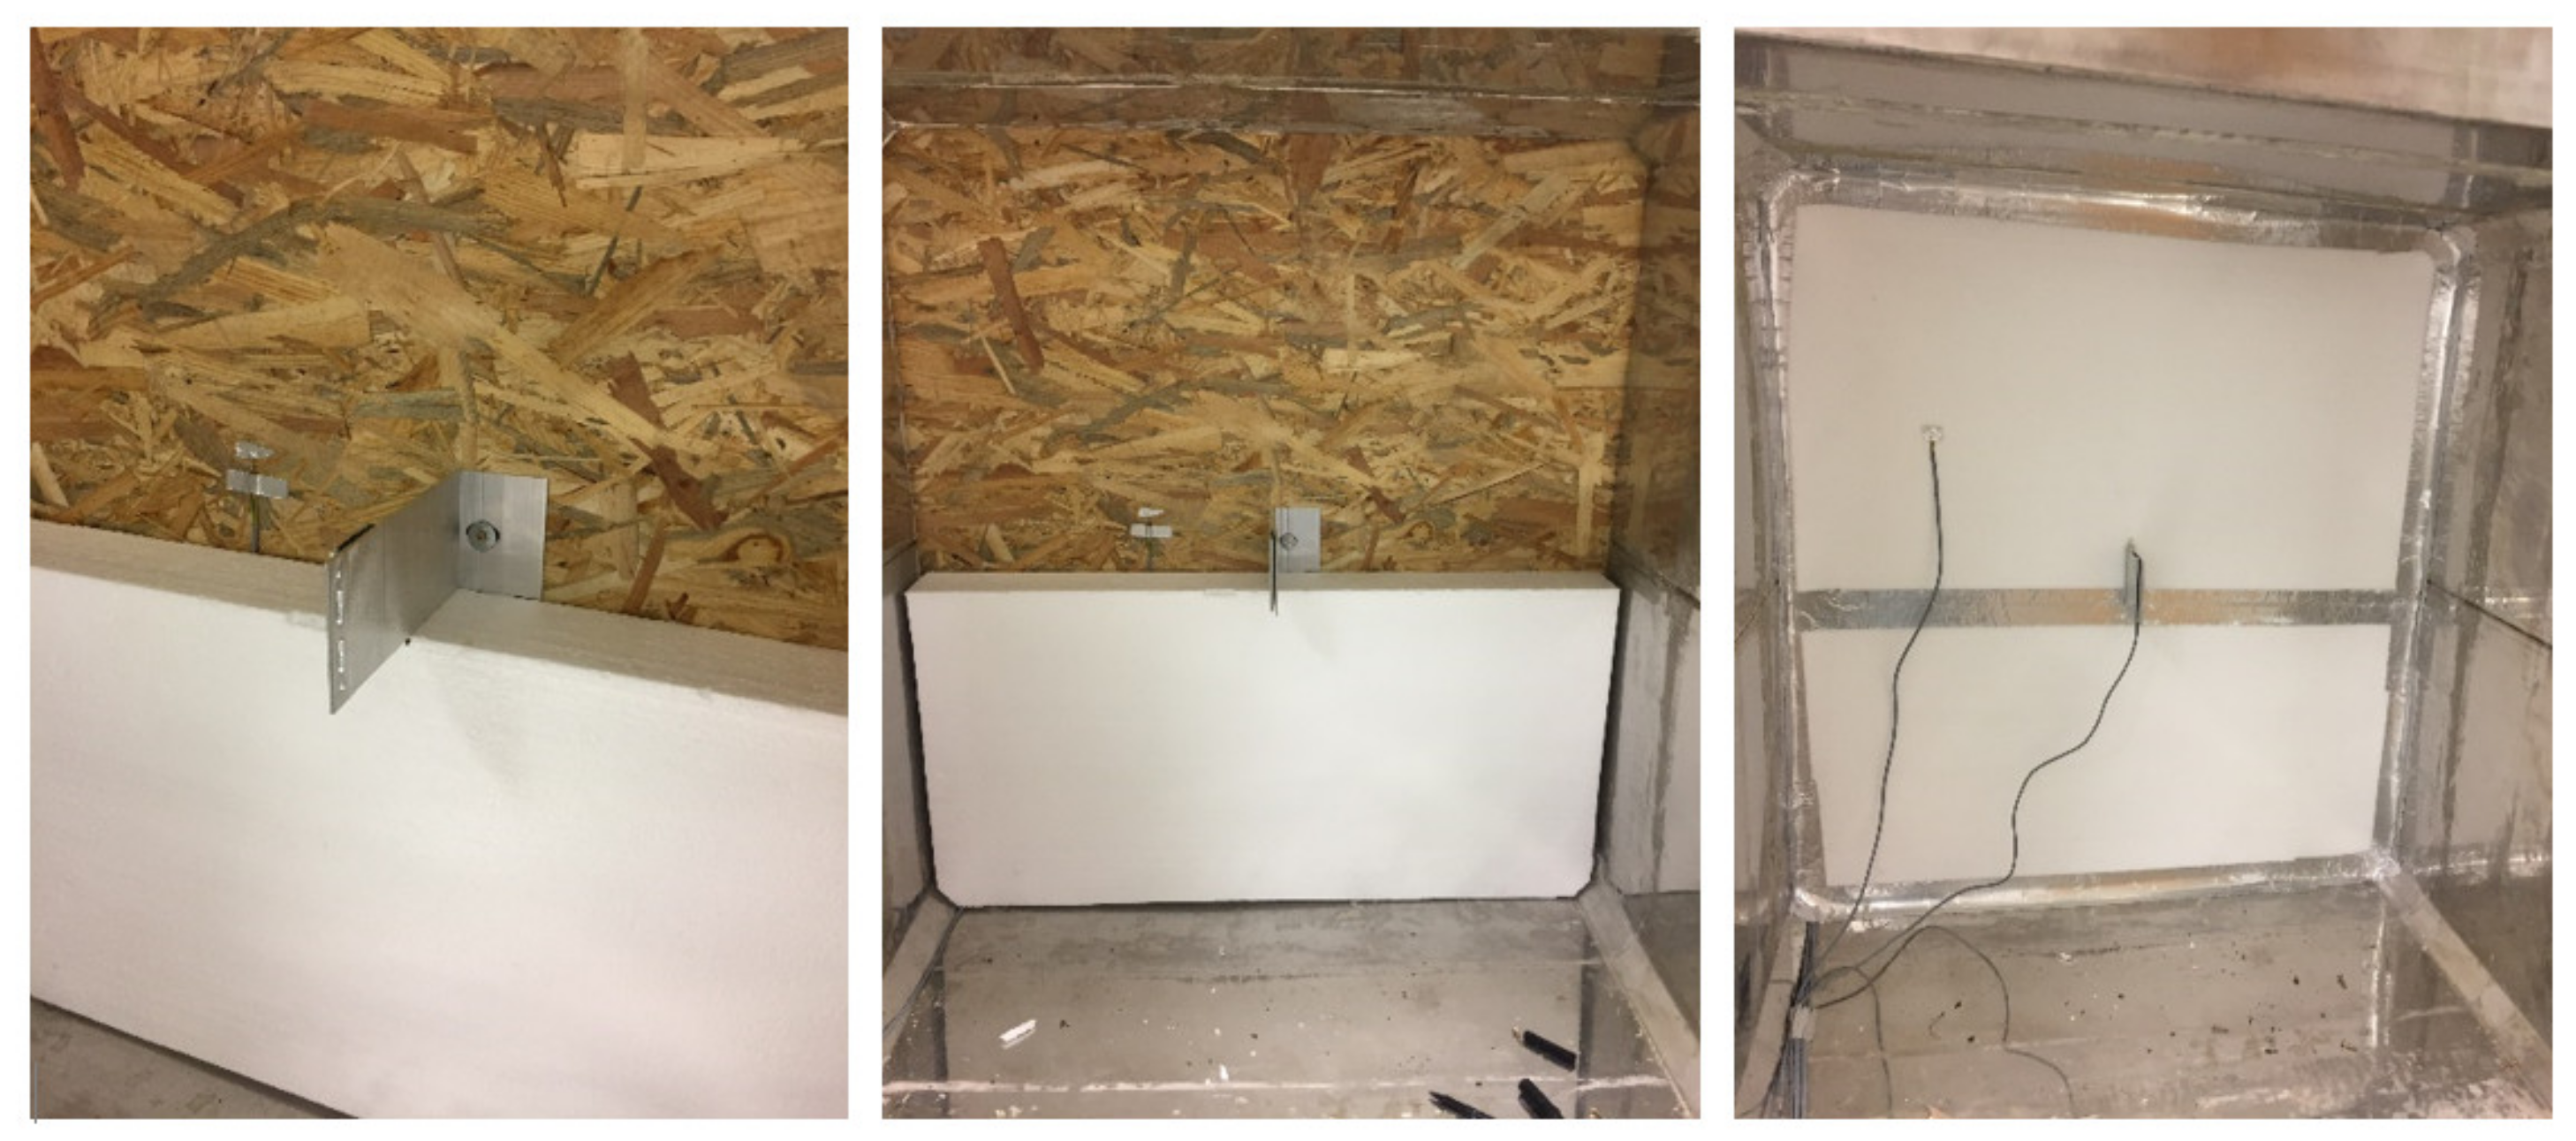
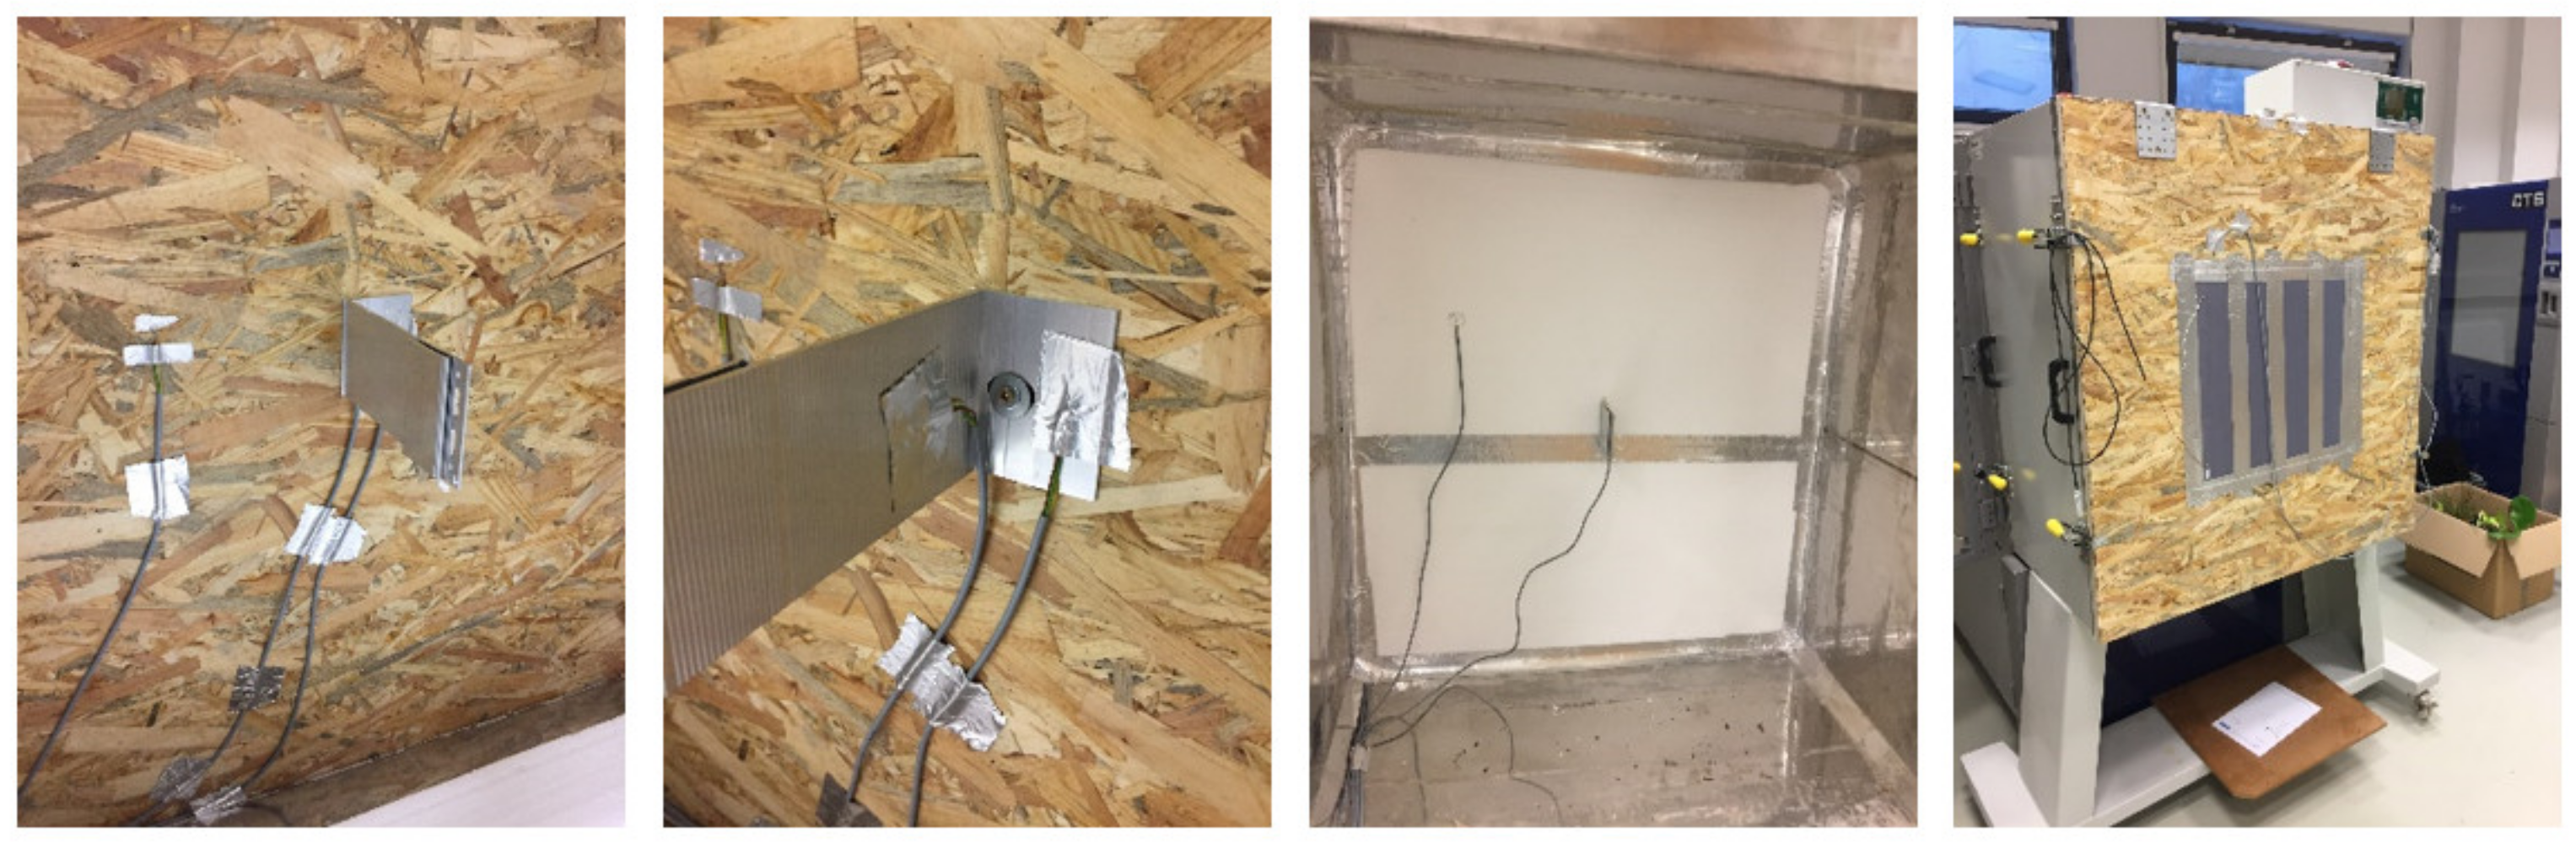
4. Experimental Method for the Analysis of Point Thermal Bridges

The main aim of the experimental measurement was to determine the different heat fluxes of the three variants of the design solution of the mechanical anchoring of the load-bearing gratings, which are part of the ventilated facades. A system from the company HILTI was chosen for the given analysis, as this system is the most utilized on the domestic market. Recently, the influence of such anchoring elements on heat losses or thermal bridges has not yet been taken into consideration. There was no such knowledge as regards building thermal engineering, but mainly there were no such thermal technical requirements for buildings, which result from the requirements for energy efficiency of buildings. At present, high demands are placed on the thermal properties of the peripheral shells, which form the heat exchange casing, and therefore the anchoring elements have a significant effect on the thermal properties themselves. One type of anchoring bracket was chosen for the given experiment, which is the most used on our market, as it is a quality technical and economical solution. It is an anchoring bracket marked MFT-MFI M (Figure 3). For experimental analysis, the selected anchor was shown in Figure 3 and described in Section 3.1. With the increasing demands on the energy efficiency of buildings, the requirements for the elimination of heat losses through the passage of heat through the heat exchange envelope have also increased. Therefore, it was necessary to eliminate all thermal bridges, whether linear or point thermal bridges. Due to the stricter thermal engineering requirements after 2016, these anchoring brackets had to be modified to eliminate point thermal bridges, which also increase heat losses due to heat transfer. These anchoring brackets have been supplemented with polypropylene pads (Figure 4). These anchoring brackets have been supplemented with polypropylene pads. This solution is economically more disadvantageous, as it is another built-in element. In addition, with such a solution, there is also a more significant initial investment in the anchoring console. Therefore, a new technical solution of the anchoring console was developed, which is the property of the author of the work. It is a plastic coating of the anchoring bracket without the use of thermal insulation pads. It is a material PE 54. PE 54 is a thermoset powder paint based on a polyester system without TGIC content, intended for outdoor use. It has very good resistance to UV radiation and yellowing. It is intended mainly for industrial use. As these are aluminum anchors, the design of the selected type of material was based on this. The PE 54 series has a wide range of applications on a variety of surfaces, including steel and aluminum. The thickness of the cured film is between 60 and 80 µm (Figure 5). The following Figure 12 shows a diagram of the experimental measurement.

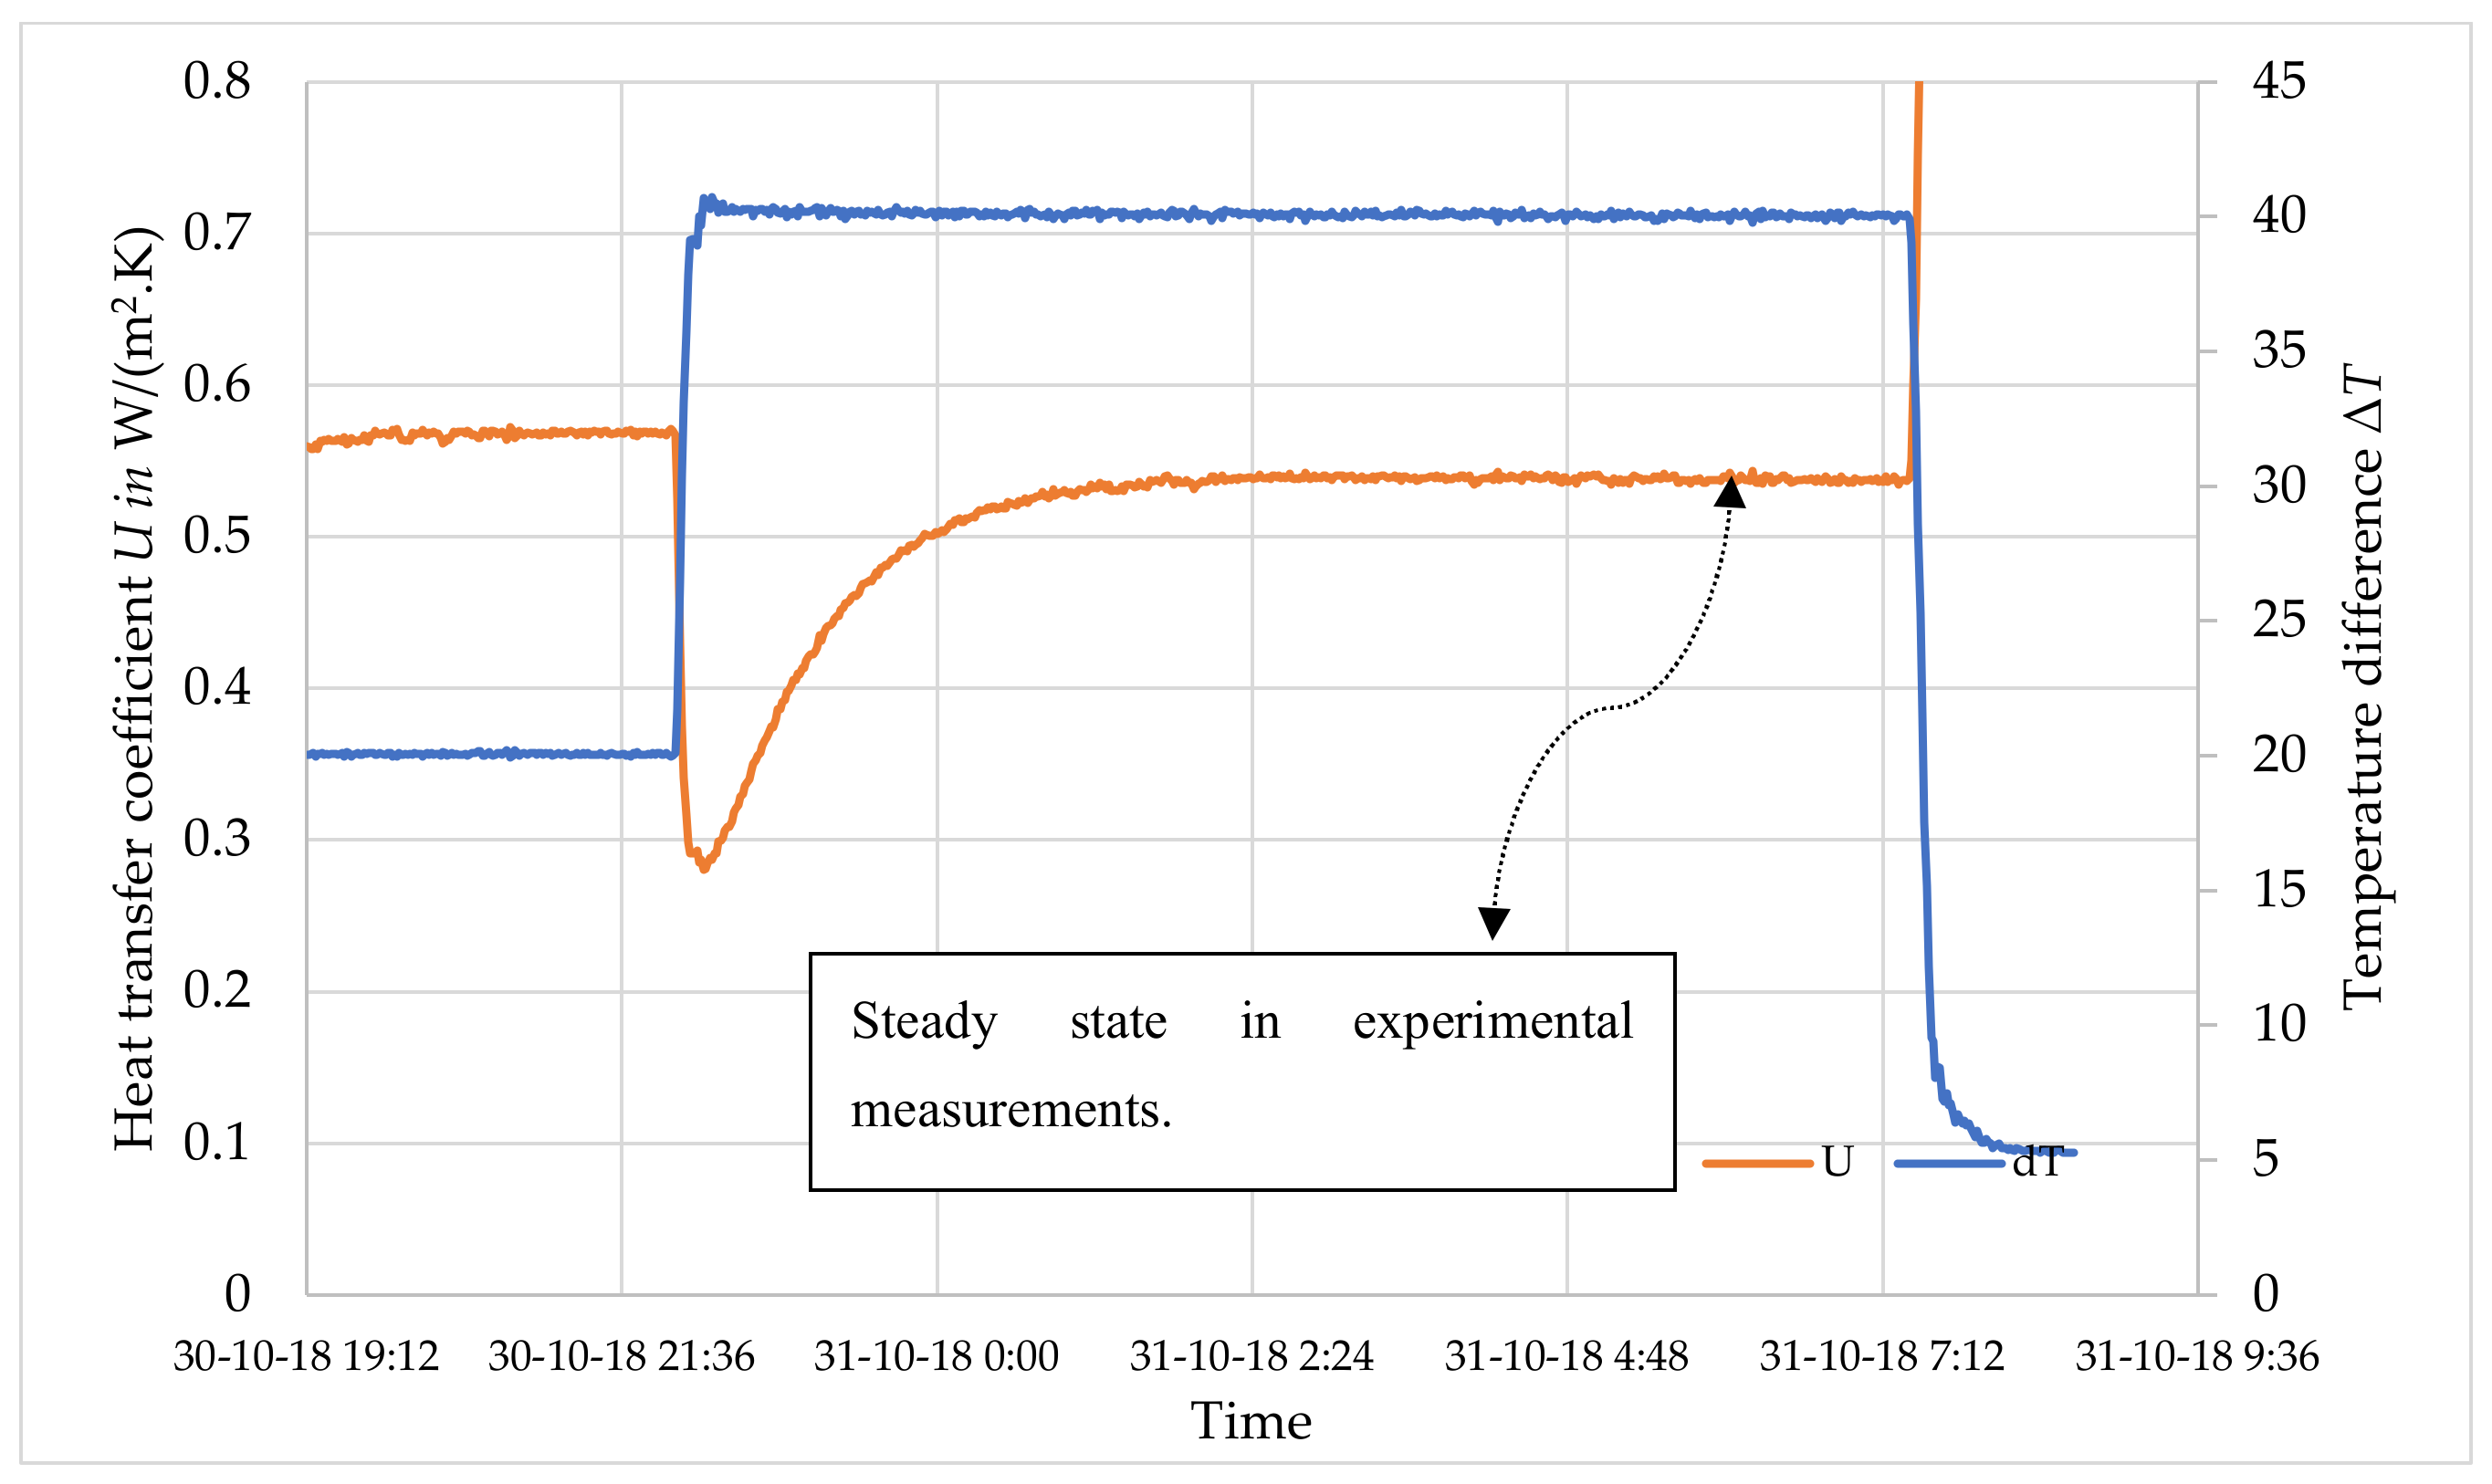
Experimental Measurements

A climate chamber (Climatic Chamber) with the production name CLIMA TEMPERATUR SYSTEME (hereinafter referred to as CTS) was used to measure the heat flux of individual samples (Figure 13).
The climate chamber consists of two chambers in which it is possible to set different boundary conditions, which are necessary for determining the heat flux of the analyzed sample. It is also possible to perform measurements on a given device with one chamber and the surrounding untreated environment or with two chambers, where the boundary conditions in both chambers are corrected. Such a measurement is more accurate. A FQA0802H plate heat flow sensor was used to measure heat flux. It is exactly type 150–2 with dimensions 500 × 500 × 0.6 mm (Figure 14). This type is especially suitable for high temperatures, especially for the construction sector, especially for insulation boards and masonry. It is used to determine the heat flux density up to max. 150 ° C. The plate sensor is composed of meanders of interconnected thermocouples embedded in the support material. Zero edge flow around the heat flux, in the case of a dense support material is ensured from a sufficient meandering edge part. A calibration value is assigned to the given plate heat flux sensor, which corresponds to the heat flux density in W/m2 at the moment when the plate emits 1 mV.
The subject of the experiment was the experimental verification of the heat flow of the HILTI MFT-MFI M anchoring bracket without the use of a modification to break the thermal bridge (Figure 3). The anchoring bracket was fixed to the OSB board 22 mm. Subsequently, the surrounding surfaces of the anchoring bracket were filled with facade polystyrene EPS F 80 mm (Figure 15). The resulting joints were filled with mineral wool so that the sample could be handled. The filled joints were then glued with AL. tape. A cutting device directly on the expanded polystyrene EPS was used to cut the polystyrene. Boundary conditions (chamber temperatures) are described in Section 3.1. The exact geometry of the sample is shown in Figure 6.
Temperature sensors were applied to the individual surfaces of the structure to monitor the surface temperature over time during the measurement of heat flow (Figure 16). These temperatures are used to analyze the course of temperatures in various analyzed samples. Temperature sensors were placed on the interior side, the interior surface, between the OSB board and the EPS polystyrene, the exterior surface, the exterior side, the console with the OSB board connection and the console in the center of the console. The thermal properties were used from the manufacturers of the given materials and are shown in the Table 1.
To determine the thermal conductivity, it would be necessary to measure only the material itself in a climate chamber. The climate chamber was first used in the 1970s (Mumaw 1974) [32]. First, homogeneous samples and, later, inhomogeneous constructions were solved (Klems 1979) [33]. This author developed general rules for the construction of the chamber climate and also proposed a procedure for assessing heat loss. Among other things, the surface materials of the individual samples are also important (Fang 2000) [34]. In addition to the material used to plasticize the anchor bracket, the thickness applied to the anchor bracket certainly has a significant effect. This will be the subject of further investigation. This work is only about interpreting the results of measuring individual samples, which are used only to compare the results and the initial estimate of the impact of various adjustments on the samples. It is not a precise determination of the thermal conductivity of the fragment with the used sample but a representation of the initial influence of the proposed modifications, which eliminate thermal point 3-D bridges. As these are dry materials, the effect of moisture on thermal conductivity has not been studied. Humidity was measured only for the OSB board using a balance and a drying oven. The Table 2 describes the individual samples analyzed. The measurement consisted of two climate chambers and a module for sample runs. Such a measurement was more accurate, as it was possible to control both sides of the boundary conditions. During the measurement, different temperature differences between the individual chambers were set in order to eliminate various errors that could occur due to different temperature differences. Many authors deal with the calibration of the chamber climate for different measuring samples, different boundary conditions, with the application of different foreign methods (Aviram 2001, Zarr 1997) [36,37]. It is a series of testing and detecting sources of potential errors that are important in inhomogeneous samples. Heat transfer coefficient for test sample no. 3 is shown in the following figure. The initial part has not yet been established, so these results cannot be used. The given figure (Figure 17) shows a part that represents the results of the measured values. The heat flux at different temperature differences was also monitored for this sample. The measurement results were not the same, which was mainly due to the heat transfer coefficients in front of the test sample surfaces. Since it is a non-homogeneous structure, we could not only calculate the thermal resistance of the sample, in the calculation only from the temperature difference on the inner and outer surface of the sample, but we had to express from measurement the whole heat transfer coefficient of the sample, which also takes into account heat transfer coefficients. Samples no. 3 and 4 were used for the experiment.
The following Table 8 shows the required measurement results, where two climate chambers with two regulated boundary conditions were used. The same procedure was performed on Variant no. 4. Results for Variant no. 4 are summarized in the following table. The following Table 8 and Table 9 also show the heat transfer coefficient, which was derived from the measured temperature difference and the measured heat flux (according to equation 1). Thus, these are the measured values of the heat transfer coefficient. Only one anchor was used in the experimental measurement. Thus, the heat transfer coefficient always considers one anchor. When applying multiple anchors, the values of the transition factor would be different. As can be seen from the previous results, the number of anchors has an impact on the heat transfer coefficient.
It can be seen from the previous tables that the aluminum anchoring bracket itself causes a thermal bridge. By applying modifications to the anchoring bracket, it is possible to achieve the elimination of the point thermal bridge. These results are based on experimental measurements of individual samples. The difference between these savings (Variant no. 3 and no. 4) is not significantly different, and therefore it would be possible to consider replacing the plastic washers by plasticizing the individual anchoring brackets. It might be possible to achieve the same elimination of the thermal bridge, also for sample No. 4 with the application of a thicker layer of plastic coating of the anchoring bracket. Still, this variant would be more economical than the production of a plastic pad. Such a solution will be further research of the author of the work, as such research requires a more detailed analysis. I emphasize that these results are mainly used to demonstrate the differences in heat fluxes for individual samples and not to accurately determine the heat transfer coefficient and other physical quantities. The main uncertainty in the measurement is the heat transfer coefficient in a given experimental measurement on the inside and outside of the sample. This risk and the elimination of this risk will be the subject of further research, which is time consuming and requires more detailed analysis. The main potential of the experiment was to design a new design solution for the anchoring bracket by plasticizing the anchoring bracket itself. This solution is the property of the author of the work. Such a solution would save money, improve the technological process, but also lead to more favorable results from a static point of view.

5. Discussion

The thermal conductivity of the plasticized anchor was determined by experimental measurements, where the heat transfer coefficients for individual samples were expressed. Based on the percentage differences between variant no. 2 (anchor without modification to eliminate thermal bridge) and Variant no. 4 (plastic-coated aluminum anchor), the thermal conductivity of the plastic-coated anchor was determined. The same samples that were used in the experimental part were simulated (Figure 6, Figure 7 and Figure 8) and the same materials as well as the same boundary conditions were considered in the given simulation. The results from the measurement and from the simulation were compared (Table 10).
In order to achieve the same value of heat flux as in the experimental measurement, the value of thermal conductivity of variant no. 4 was used by manual iteration (change of the thermal conductivity). In this way, the thermal conductivity for the plastic-coated aluminum anchor was determined. The thermal conductivity of the plastic-coated aluminum anchor is 49 W/ (m. K). Such conductivity is similar to conventional steel. The following tables (Table 11 and Table 12) shows the heat transfer coefficient results for all analyzed samples and their differences.
The theoretical analysis shows that the plastic coating of the anchor and the system solution from HILTI do not show significant differences in the heat transfer coefficient. Therefore, it can be stated that with an increased thickness of the plasticized sample, the thermal conductivity of the anchor would be reduced, which would further eliminate heat losses through the anchor and thus eliminate 3-D point thermal bridges. Such a solution is still more economical than the application of plastic pads. The analysis of the influence of plastic coating thickness on thermal conductivity will be the subject of further research. In addition to the thickness of the plastic coating of the anchor, the emissivity of the plastic anchor also influences the result. This factor will be investigated in the experimental part.

6. Conclusions

The main idea and aim of the paper were to point out the potential problem of the 3-D point thermal bridges for the heat losses of buildings, which significantly affect the overall energy classification of the building into energy class in terms of energy efficiency requirements of buildings. If they are neglected in the project preparation and not considered in the calculations in the project evaluation and subsequently taken into account in the calculations in the energy certificate during approval, there could be a problem that the building cannot be approved. The main thing is that the required energy class of the building, which is given by the requirements on energy efficiency of buildings, is unmet. This problem is not negligible, and therefore, this work also addresses this problem, as it is directly related to practice but also in the scientific field. The results show that the application of anchors and their number has significantly on thermal properties envelope. The circumferential shell alone without the use of an anchoring element has a heat transfer coefficient of 0.429 W/ (m2. K). When using one anchor element, the thermal conductivity coefficient increases to 0.585 W/ (m2. K). If we use a plastic washer for a given anchoring element, we will increase the heat transfer coefficient to the value 0.543 W/ (m2. K). This means this is an increase of 26.57% compared to the composition of the circumferential shell without the anchoring element applied. This variant is divinely available, but as it uses other material and it is a plastic pad, its value increases as significantly as its impact on the environment. The last variant was a proposal (patent) that the anchoring element is only plastic-coated and thus its thermal engineering properties are improved, which is manifested mainly in heat conduction but also from the radiant point of view, as plasticizing the emissivity changes. Compared to the perimeter cladding without the application of an anchoring element, the heat loss increases by 29.37%. The difference between the anchoring element with a thermal insulation pad and the patented method is minimal. This is a 1.29% difference. This difference is negligible as the patented modification achieves a significant economic and technological effect. While the plastic pad costs about EUR 0.3 [3-D], the plastic coating represents a price of around EUR 0.03. These costs are directly related only to plastic coating without management and logistics. The service life of the plastic coating is guaranteed by the manufacturer for 53 years without damage, which means significant savings when using six pieces per square meter on major buildings with a significant area of the perimeter. Every innovation must be technically as well as economically advantageous. This innovative solution has positive results in the technical but also the economic field. The innovative solution saves the production of materials and at the same time saves energy in buildings. These features contribute to a sustainable architecture.

7. Patents

The design of the plastic coating of the anchor is a patent of the author. It is about improving the technology and improving the thermal properties in terms of the heat loss. This patent is the intellectual property of the author, so copying it is criminal.

Author Contributions

R.I. and J.G. set up the methodology. R.I. carried out the tests. J.G. and L.P. analyzed the data. R.I. wrote the first draft of the article. L.P. and J.G. reviewed it. All authors have read and agreed to the published version of the manuscript.

Funding

This research was funded by VEGA Project, No. 1/0511/19. Thanks for supporting the realization of the experiment to VEGA Project, No. 01/0229/21.

Acknowledgments

We would like to thank the Slovak University of Technology in Bratislava for providing the opportunities and resources that have helped us to create this article.

Conflicts of Interest

The authors declare no conflict of interest.

References

  1. European Union. Energy Efficiency: Energy Performance of Buildings. Directive 2002/91/EC; European Union: Brussels, Belgium, 2002. [Google Scholar]
  2. European Union. Energy End-Use Efficiency and Energy Services and Repealing Council Directive 93/76/EEC. Directive 2006/32/EC; European Union: Brussels, Belgium, 2006. [Google Scholar]
  3. European Union. Energy Performance of Buildings. Directive 2010/31/EC; European Union: Brussels, Belgium, 2010. [Google Scholar]
  4. Tadeu, A.; Simões, I.; Simões, N.; Prata, J. Simulation of dynamic linear thermal bridges using a boundary element method model in the frequency domain. Energy Build. 2011, 43, 3685–3695. [Google Scholar] [CrossRef]
  5. Theodosiou, T.G.; Tsikaloudaki, A.G.; Kontoleon, K.J.; Bikas, D.K. Thermal bridging analysis on cladding systems for building facades. Energy Build. 2015, 109, 377–384. [Google Scholar] [CrossRef]
  6. Theodosiou, T.G.; Papadopoulos, A.M. The impact of thermal bridges on the energy demand of buildings with double brick wall constructions. Energy Build. 2008, 40, 2083–2089. [Google Scholar] [CrossRef]
  7. ISO. Thermal Bridges in Building Construction—Linear Thermal Transmittance—Simplified Methods and Default Values. UNI EN ISO 14683:2018; ISO Copyright Office: Geneva, Switzerland, 2018. [Google Scholar]
  8. ISO. Thermal Bridges in Buildings e Thermal Flows and Superficial Temperatures e Detailed Calculations, EN ISO 10211; ISO Copyright Office: Geneva, Switzerland, 2018. [Google Scholar]
  9. Magrini, A.; Magnani, L.; Pernetti, R. The effort to bring existing buildings towards the A class: A discussion on the application of calculation methodologies. Appl. Energy 2012, 97, 438–450. [Google Scholar] [CrossRef]
  10. ISO. Thermal Performance of the Building Components e Thermal Dynamic Characteristics e Methods of Calculation, EN ISO 13786; ISO Copyright Office: Geneva, Switzerland, 2008. [Google Scholar]
  11. Rockwool. 2021. Available online: https://cdn01.rockwool.sk/siteassets/rw-sk/dokumenty/cad-detaily/rw-detaily-prevetravane-fasady_sk.pdf?f=20181206102116 (accessed on 19 September 2021).
  12. Martin, K.; Erkoreka, A.; Flores, I.; Odriozola, M.; Sala, J.M. Problems in the calculation of thermal bridges in dynamic conditions. Energy Build. 2011, 43, 529–535. [Google Scholar] [CrossRef]
  13. Hassid, S. Thermal bridges in homogeneous walls: A simplified approach. Build. Environ. 1989, 24, 259–264. [Google Scholar] [CrossRef]
  14. Hassid, S. Thermal bridges across multilayer walls: An integral approach. Build. Environ. 1990, 25, 143–150. [Google Scholar] [CrossRef]
  15. Sempey, H.V.A.; Pauly, M.; Mora, L. Comparison of different methods for calculating thermal bridges: Application to wood-frame buildings. Build. Environ. 2015, 93, 339–348. [Google Scholar] [CrossRef]
  16. Kosny, J. Advances in residential wall technologies—Simple ways of decreasing the whole building energy consumption. ASHRAE Trans. 2001, 107, 421–432. [Google Scholar]
  17. Mao, G. Thermal Bridges. Efficient Models for Energy Analysis in Buildings; Department of Building Sciences, Kunglika Tekniska Högskolan: Stockholm, Sweden, 1997. [Google Scholar]
  18. Ben Larbi, A. Statistical modelling of heat transfer for thermal bridges of buildings. Energy Build. 2005, 37, 945–951. [Google Scholar] [CrossRef]
  19. Kosny, J.; Kossecka, E. Multi-dimensional heat transfer through complex building envelope assemblies in hourly energy simulation programs. Build. Environ. 2002, 34, 445–454. [Google Scholar] [CrossRef]
  20. Carpenter, S.C.; Schumacher, C. Characterization of Framing Factors for Wood-Framed Low-Rise Residential Buildings. ASHRAE Trans. 2003, 109, 101. [Google Scholar]
  21. Kosny, J. A New Whole Wall R-value Calculator, An Integral Part of the Interactive Internet-Based Building Envelope, Materials Database for Whole-Building Energy Simulation Programs. 2004. Available online: http://citeseerx.ist.psu.edu/viewdoc/download?doi=10.1.1.135.8046&rep=rep1&type=pdf (accessed on 19 September 2021).
  22. Buday, P.; Ingeli, R.; Čekon, M. Influence of Thermal Break Element Applied in Balcony Slab on Internal Surface Temperature. Adv. Mater. Res. 2014, 1057, 79–86. [Google Scholar] [CrossRef]
  23. Buday, P.; Ingeli, R. Balcony systems (isokorb) impact on energy need for heating and economic valuation. Appl. Mech. Mater. 2016, 820, 146–151. [Google Scholar] [CrossRef]
  24. Ingeli, R.; Vavrovič, B.; Čekon, M.; Paulovičová, L. Thermal Bridges Minimizing through Window Jamb in Low Energy Buildings. Appl. Mech. Mater. 2014, 899, 66–69. [Google Scholar] [CrossRef]
  25. Juráš, P. Lightweight timber-framed wall and impact of ventilated cladding on the possibility of reducing summer overheating in Central Europe. E3S Web Conf. 2020, 172, 03-D09. [Google Scholar] [CrossRef]
  26. Čurpek, J.; Čekon, M.; Hraška, J. PCM Integrated in BiPV Ventilated Facąde Concepts: Experimental Test Cell Platform and Initial Full-Scale Measurements. IOP Conf. Ser. Earth Environ. Sci. 2019, 290, 012072. [Google Scholar] [CrossRef]
  27. Sanjuan, C.; Suárez, M.J.; González, M.; Pistono, J.; Blanco, E. Energy performance of an open-joint ventilated façade compared with a conventional sealed cavity façade. Sol. Energy 2011, 85, 1851–1863. [Google Scholar] [CrossRef]
  28. Ascione, F.; Bianco, N.; de Masi, R.F.; Rossi, F.d.; Vanoli, G.P. Simplified state space representation for evaluating thermal bridges in building: Modelling, application, and validation of a methodology. Appl. Therm. Eng. 2013, 61, 344–354. [Google Scholar] [CrossRef]
  29. Ben-Nakhi, A.E. Minimizing thermal bridging through window systems in buildings of hot regions. Appl. Therm. Eng. 2002, 22, 989–998. [Google Scholar] [CrossRef]
  30. Hilti-20.11.2020. Available online: https://www.hilti.cz/c/CLS_FACADE_MOUNTING_SYSTEMS/CLS_BRACKETS/r5325 (accessed on 19 September 2021).
  31. ÚNMS, SR. Thermal Protection of Buildings. Thermal Performance of Buildings and Components. Part 2: Functional Requirements; Office for Standardization, Metrology and Testing of the Slovak Republic: Bratislava, Slovakia, 2019. [Google Scholar]
  32. Mumaw, J.R. Calibrated hot box: An effective means for measuring thermal conductance in large wall sections. In American Society for Testing and Materials, ASTM STP 544, Heat Transmission Measurements in Thermal Insulations; ASTM: West Conshohocken, PA, USA, 1974; pp. 193–211. [Google Scholar]
  33. Klems, J.H. A calibrated hot box for testing window systems—Construction calibration and measurements on prototype high-performance windows. In Proceedings of the ASHRAE/DOE-ORNL Conference on Thermal Performance of the Exterior Envelopes of Buildings, Kissimmee, FL, USA, 3–5 December 1979; pp. 338–346. [Google Scholar]
  34. Fang, X.D. A study of the U-factor of the window with a high-reflectivity venetian blind. Sol. Energy 2000, 68, 207–214. [Google Scholar] [CrossRef]
  35. Psi-Therm 2D Enterprise 2017, PLUS Psi-Therm 3D 2017. Available online: https://www.psitherm.uk/psi-features/psi-therm-3D-features (accessed on 19 September 2021).
  36. Zarr, R.R.; Burch, D.M.; Faison, T.K.; Arnold, C.E.; O’Connell, M.E. Calibration of the NBS calibrated hot box. J. Test. Eval. 1997, 15, 167–177. [Google Scholar]
  37. Aviram, D.P.; Fried, A.N.; Roberts, J.J. Thermal properties of a variable cavity wall. Build. Environ. 2001, 36, 1057–1072. [Google Scholar] [CrossRef]
Figure 1. Example of a ventilated façade concept. (a) Anchoring a suspended façade; (b) the principle of operation of a ventilated façade [11].
Sustainability 13 11561 g001
Figure 2. Example point thermal ventilation of the façade. (a) Aluminum anchor with a plastic pad; (b) method of attaching the tile [30].
Sustainability 13 11561 g002
Figure 3. Analyzed anchor HILTI MFT-MFI M. (a) Application of the anchoring element to the perimeter wall; (b) anchor dimensions in millimeters [30].
Sustainability 13 11561 g003
Figure 4. Analyzed anchor with polypropylene pad HILTI MFT-MFI M—the size of the anchor with pad in millimeters [30].
Sustainability 13 11561 g004
Figure 5. Analyzed HILTI MFT-MFI M anchor with surface plastic coating. (a) Display of plastic-coated anchor; (b) dimensions of the plastic anchor in millimeters [30].
Sustainability 13 11561 g005
Figure 6. Analyzed model with dimensions 0.5 × 0.5 m with anchor.
Sustainability 13 11561 g006
Figure 7. Analyzed model with dimensions 0.5 × 0.5 m with anchor. (a) Variant shown also with boundary conditions; (b) Display of boundary conditions and anchors.
Sustainability 13 11561 g007
Figure 8. Analyzed model with dimensions 0.5 × 0.5 m with anchor. (a) Variant shown also with boundary conditions; (b) Display of a Variant 4 from an experimental measurement.
Sustainability 13 11561 g008
Figure 9. View of a 3-D model of load-bearing part with anchors. (a) The structure; (b) plastic pad for thermal bridge break and anchors from HILTI.
Sustainability 13 11561 g009
Figure 10. Dependence of the heat transfer coefficient of the structure for a thermal insulation thickness of 140 mm and 200 mm.
Sustainability 13 11561 g010
Figure 11. Real administrative building with ventilated facade.
Sustainability 13 11561 g011
Figure 12. Diagram of the experimental measurement.
Sustainability 13 11561 g012
Figure 13. A climate chamber (Climatic Chamber) with the production name CLIMA TEMPERATUR SYSTEME (hereinafter referred to as CTS).
Sustainability 13 11561 g013
Figure 14. Plate heat flow sensor.
Sustainability 13 11561 g014
Figure 15. Sample no. 2. anchor without thermal bridge interruption.
Sustainability 13 11561 g015
Figure 16. Temperature sensors applied to sample.
Sustainability 13 11561 g016
Figure 17. Dependence of heat transfer coefficient on temperature difference.
Sustainability 13 11561 g017
Table 1. Thermal technical properties of used materials.
Material NumberMaterial DescriptionThermal Conductivity λ in W/ (m. K)Comment
1.OSB board hr. 22 mm0.20Data were used from the material manufacturer.
2.Anchor—from HILTI160Data were used from the material manufacturer.
3.Pad thermal barrier—Hilti.0.117Data were used from the material manufacturer.
4.Polystyrene foam EPS F0.039Data were used from the material manufacturer.
5.Plastic coated anchor49 1Patented application of the author of this work.
1 Thermal conductivity was expressed from experimental measurements—Section 4.
Table 2. Description of individual simulated variants.
VariantDescriptionVariant ImageComment
1.Variant without the use of an anchoring element No anchor was used in the given variant.
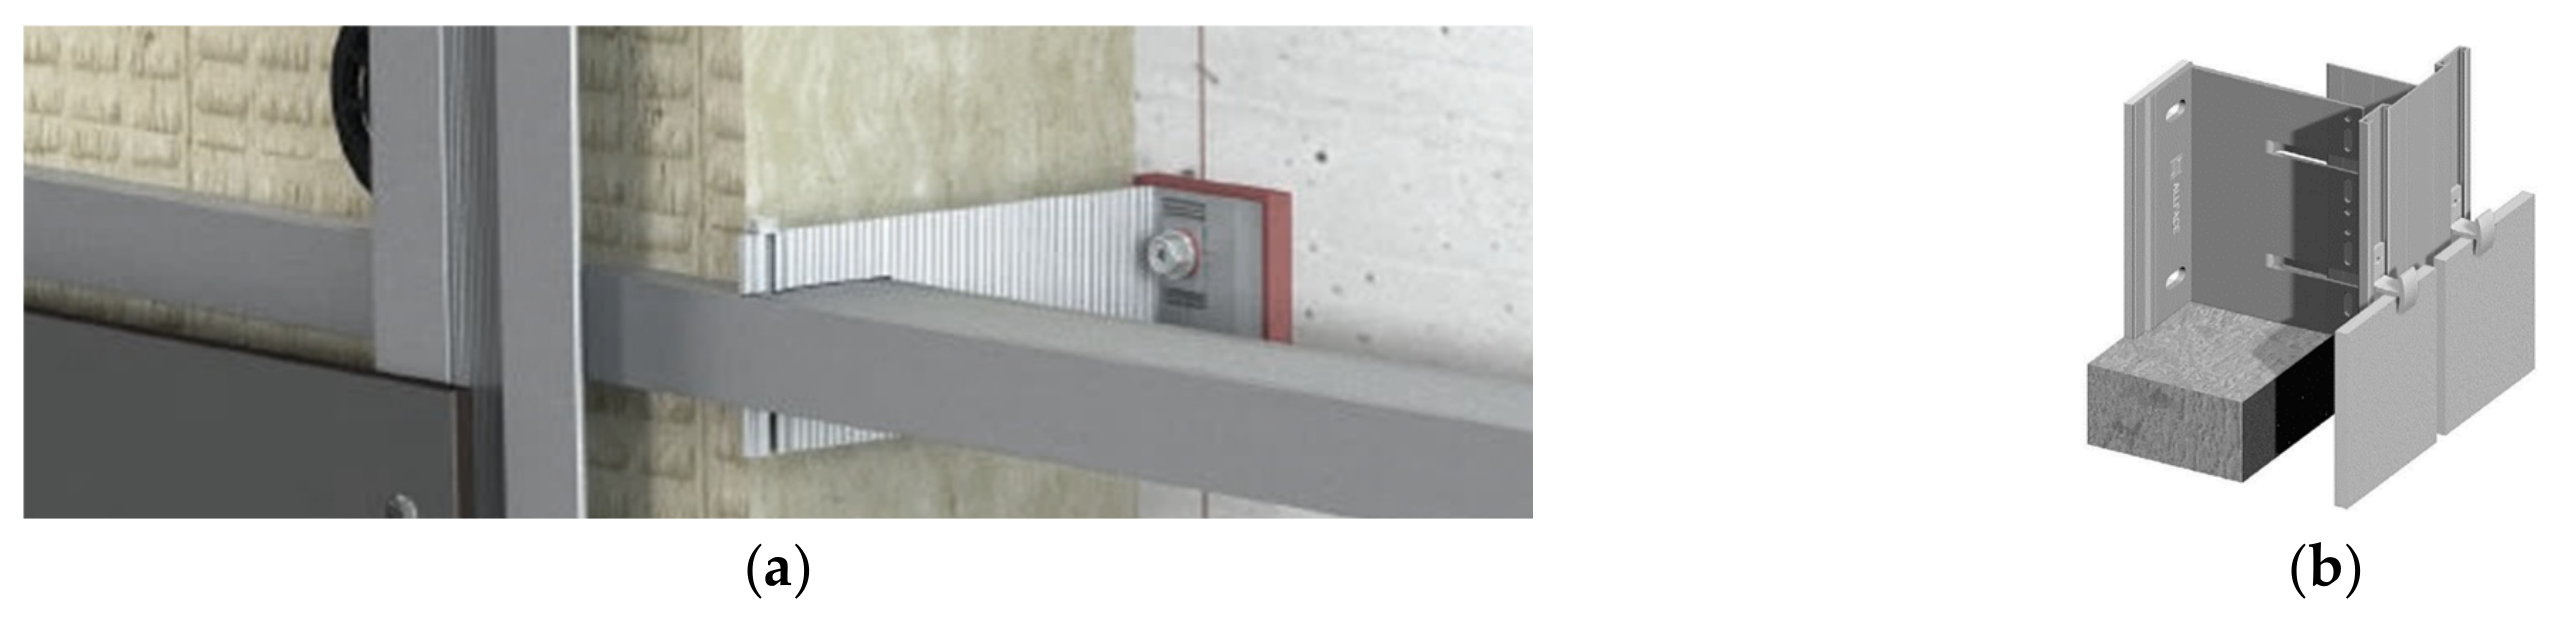
2.Anchor without modifications to eliminate the thermal point 3-D bridge. Sustainability 13 11561 i001The anchor material is made of aluminum with high thermal conductivity.
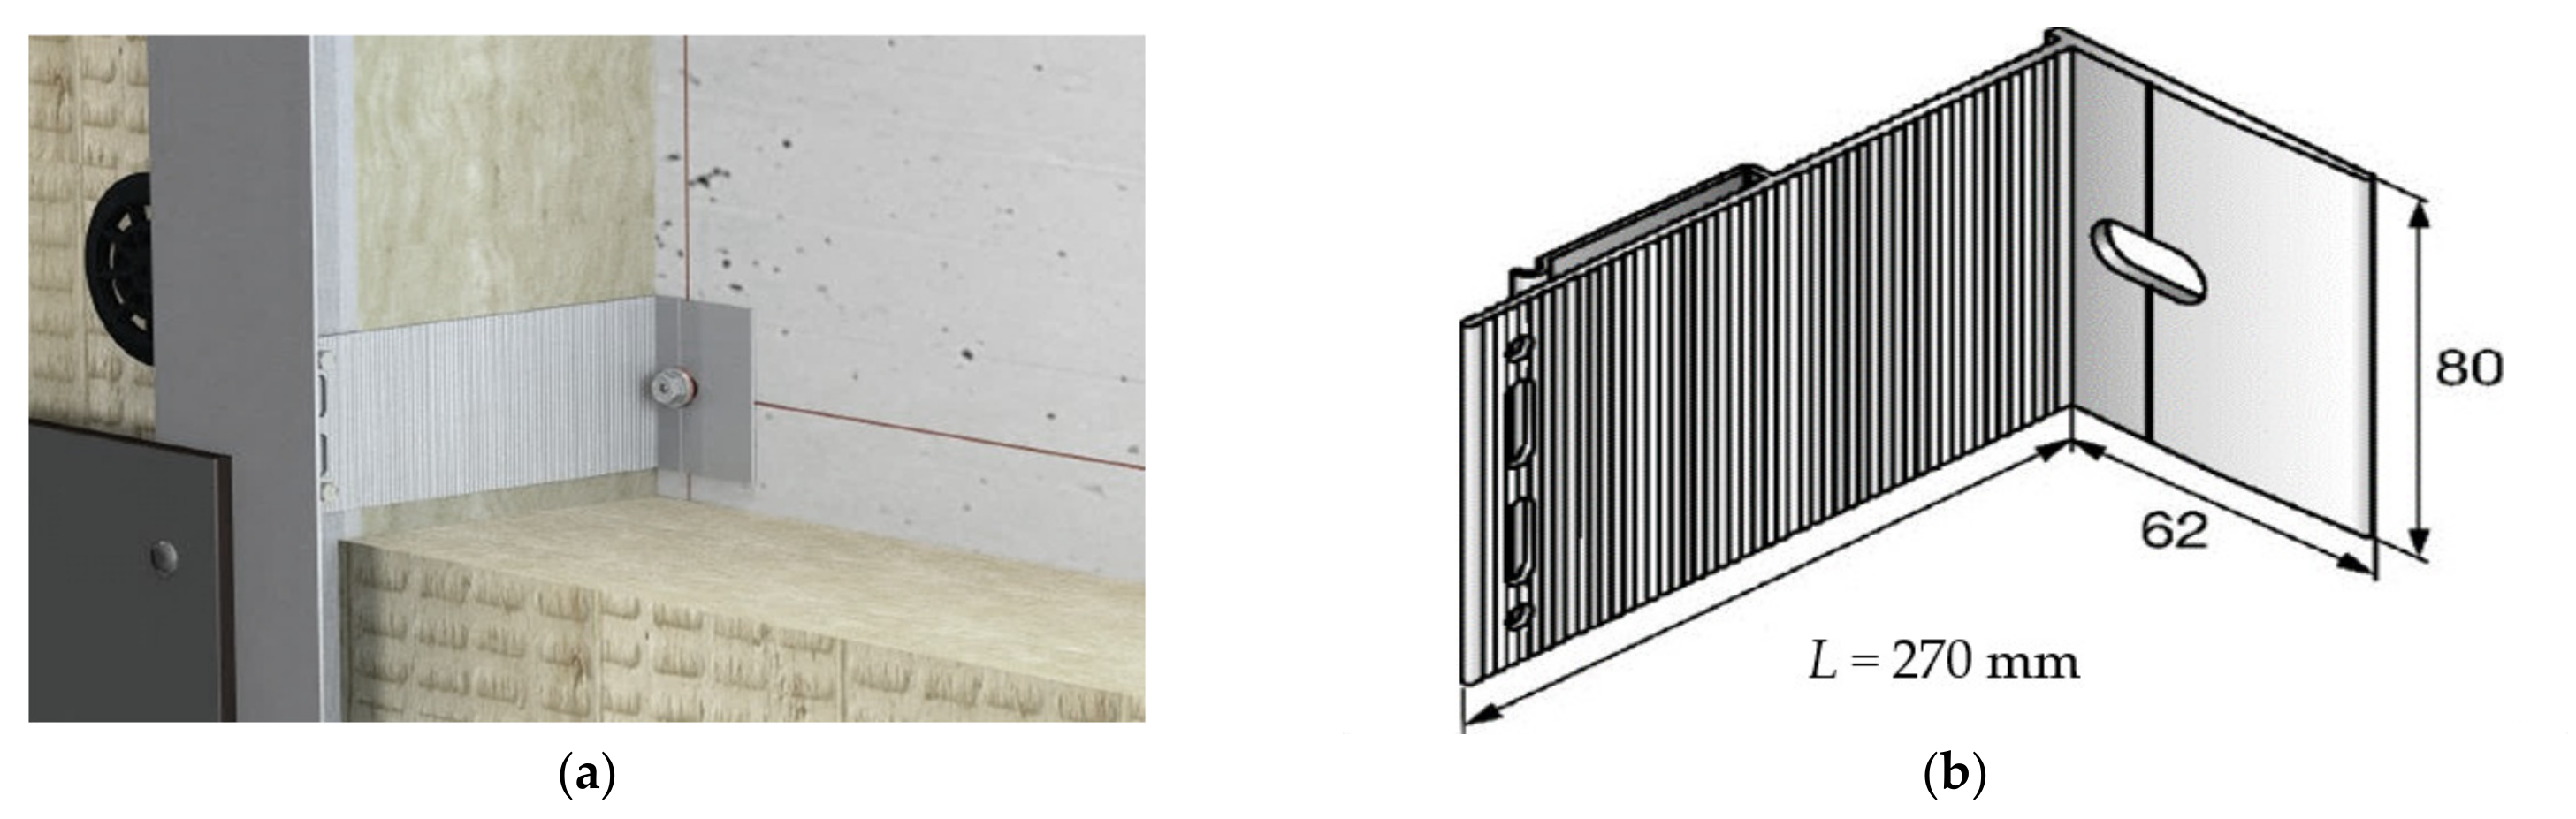
3.Anchor with modification to eliminate thermal point 3-D bridge. Sustainability 13 11561 i002The anchor material is made of aluminum with high thermal conductivity and with the interruption of the thermal bridge by means of a pad.
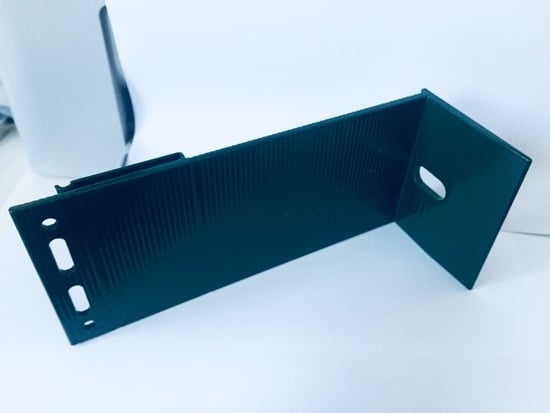
4.Anchor with modification to eliminate thermal point 3-D bridge. Sustainability 13 11561 i003The anchor material is made of aluminum with high thermal conductivity and with interruption of the thermal bridge by means of plastic coating of the anchor. This proposal is the property of the author of the work.
Table 3. Heat transfer coefficient—simulated values.
VariantHeat Transfer Coefficient U in
W/ (m2. K).
The Difference between the Simulated Values Relative to the Variant no. 1 in %Comment
1.0.4290-
2.0.58536.36%This is a calculation of the increase from the value of the first variant (0.429–100% and 0.585–136.36%). Increase the heat transfer coefficient is 36.36%
3.0.54326.57%This is a calculation of the increase from the value of the first variant (0.429–100% and 0.543–126.57%). Increase the heat transfer coefficient is 26.57%
4.0.55029.37%This is a calculation of the increase from the value of the first variant (0.429–100% and 0.550–129.37%). Increase the heat transfer coefficient is 29.37%
Table 4. Description of selected compositions of the ventilated facade used on a real building.
VariantDescription of the Supporting StructureThermal InsulationThermal Insulation Thickness in mmNumber of Anchors
1.Reinforced concrete structure (λ = 1.58 W/ (m. K)) 200 mmThermal insulation (λD = 0.033 W/ (m. K))140, 2000, 1, 2, 3
2.Reinforced concrete structure (λ = 1.58 W/ (m. K)) 200 mmThermal insulation (λD = 0.035 W/ (m. K))140, 200 0, 1, 2, 3
Table 5. Description of the analyzed building.
Geometry of the BuildingValues
Total floor area A in m2 335.8
Total built-up volume V in m31074.56
Construction height h in m3.2
Total heat exchange envelope in m2693
Shape factor0.64
Area of wall in m2314.6
Table 6. Influence of the number of anchors on heat losses.
Number of AnchorsHeat Loss in W/KPercentage Increase to 0 Number of Anchors in%
0 54.74-
170.1628.16
287.4659.77
3100.6783.90
Table 7. Influence of the number of anchors on the energy need for heating.
Number of AnchorsEnergy Need for Heating in kWh/ (m2. a)Percentage Increase to 0 Number of Anchors in%
0 34.81-
139.4813.41
243.5325.05
346.6433.98
Table 8. Results from experimental measurements.
VariantDescription of the VariantsHeat Flow q in W/m2Temperature Difference ΔT Heat Transfer Coefficient U in W/ (m2. K)
2.Anchor without modification to eliminate thermal point 3-D bridge.2.3238.6160.578
3.Anchor with modification to eliminate thermal point 3-D bridge.20.70338.5530.537
4.Anchor with modification to eliminate thermal point 3-D bridge.21.05238.7440.543
Table 9. Heat transfer coefficient of analyzed variants.
VariantHeat Transfer Coefficient U in
W/ (m2. K).
The Difference between the Calculated Values Relative to the Variant n. 3 in%
2.0.578-
3.0.537-
4.0.5431.117 *
* Increase the heat transfer coefficient in%.
Table 10. Comparison of heat transfer coefficients between experimental measurement and simulation.
VariantHeat Transfer Coefficient U in
W/ (m2. K) from Experimental Measurement
Heat Transfer Coefficient U in
W/ (m2. K) from 3-D Simulation
Increase the Heat Transfer Coefficient in%
3.0.5370.5431.117 *
4.0.5430.5501.289 *
* Increase the heat transfer coefficient in%.
Table 11. Heat transfer coefficient of analyzed variants.
VariantHeat Transfer Coefficient U in
W/ (m2. K).
The Difference between the Calculated Values Relative to the Variant n. 1 in%The Difference between the Calculated Values Relative to the Variant n. 2 in%
1.0.4290-
2.0.58536.36 *-
3.0.54326.57 *7.73 *
4.0.55029.37 *6.36 *
* Increase the heat transfer coefficient in%.
Table 12. Heat transfer coefficient of analyzed variants.
VariantHeat Transfer Coefficient U in
W/ (m2. K).
The Difference between the Calculated Values Relative to the Variant n. 1 in%The Difference between the Calculated Values Relative to the Variant n. 3 in%
1.0.4290-
2.0.58536.36 *-
3.0.54326.57 *-
4.0.55029.37 *1.29 *
* Increase the heat transfer coefficient in%.
Publisher’s Note: MDPI stays neutral with regard to jurisdictional claims in published maps and institutional affiliations.

