Abstract
Comfort temperature and sleep quality involving 20 participants were determined in two cases: Case A (arbitrary, controlled air-conditioner setting) and Case B (adjustment of 3 °C higher than the setting of Case A with cool bed linen). Data of indoor thermal comfort and electricity consumption were collected every night throughout the measurement period. Questionnaires on thermal comfort and sleep quality were distributed twice a night for a duration of three nights for each case; the first night was for respondents’ adaptation and the following two nights were for measurement. The sleep quality of the respondents was objectively measured using a commercially available activity tracker. Results found that most respondents were thermally comfortable in both cases, with 39% lower energy consumption reported for Case B compared to Case A. The thermal conditions of Case B were found to be more tolerable than those of Case A. Most respondents reported to have a calm and satisfied sleep for both cases. Comfort temperature and Sleep Efficiency Index (SEI) were found to be maintained in both cases.
1. Introduction
Thermal comfort is essential in everyday life. Since the early days, people have been finding ways to ensure that their living conditions, with adaptation to local climate, are thermally comfortable. A study by Samson et al. [1] on the Tanzanian indigenous hunter-gatherer people, the Hadza, revealed that the early humans perhaps used the domicile hut as their living spaces to increase the thermal consistency of their living environment. In the ancient Malay Archipelago where Malaysia is now located, the unique traditional design of the Malay house is found to be promoting airflow across the entire living area, which is very important for the hot and humid climate of South East Asia (Nik Hassin et al. [2]).
In the modern era, the usage of mechanical devices has become a necessity in archiving thermal comfort whether in hot or cold environments. For a tropical climate such as Malaysia, the usage of air conditioners (AC) has seen a steady increase in the recent years. According to the survey data from the Department of Statistics Malaysia [3], 22.3% of households in 2010 owned air conditioners, which is an increase of 16.2% from the year 2000. Most of the usage occurs in bedrooms, which indicates that air conditioners are mainly used during sleeping hours [4,5]. This usage pattern contributes to the larger power demand for households at nighttime compared to the daytime. For example, Ranjbar et al. [6] conducted a survey in a low-cost public apartment building in an urban area of Kuala Lumpur, Malaysia, and reported that seven out of ten houses were equipped with AC in bedrooms; they also found that the peak demand occurred between 22:00 and 07:00 due to AC usage during the sleeping period. In addition, Mekhilef et al. [7] reported that the average usage of AC overnight was 1086 kWh, higher than the daytime AC usage of 730 kWh per year in a high-rise residential building in Kuala Lumpur. Kubota et al. [8] conducted a survey on energy consumption and AC usage in terrace houses in Johor Bahru, Malaysia, and found that 80% of the respondents switched on the AC by 23:00 and that more than 50% of them continued to use AC until 05:00. In the study by Ono et al. [9] that involved multiple dwellings in Kuala Lumpur, AC usage was found to be mostly frequent at nighttime, including the sleeping period. The usage pattern is not only found in Malaysia but also in other countries during the summer seasons. Lan et al. [10] reviewed past studies on AC usage in bedrooms; they reported that high AC usage in bedrooms during summer in Shanghai, China, and Hong Kong. In addition, they pointed out the importance of further studies to reduce AC usage during the sleeping period. From these studies, there is no doubt that most of the AC usage in the residential dwellings occurs during nighttime and during sleeping hours. Further investigating the usage during these hours and strategies in reducing the usage would be useful in reducing the energy consumption by households during these hours.
Regarding AC usage patterns in residential buildings, Sekhar [11] pointed out that people living in hot and humid climates prefer to have low AC temperature settings. In fact, the questionnaire survey by Ekasiwi et al. [12] reported that the average AC temperature during sleeping hours was 22 °C for residential buildings in Kuala Lumpur. This is lower than what is recommended by the Malaysian government, which is 24 °C [13]. The behaviour is also found in other countries such as Japan. Muro [14] obtained the setpoint temperature by gender in Japan through a survey and found that male respondents preferred a lower setpoint temperature (average of 26.5 °C) than female respondents (average of 27.2 °C). A low setpoint temperature of cooling during sleeping hours will increase the electricity consumption and may induce sleep disorder and health deterioration. For example, Lin and Deng [15] reported that around 60% of respondents experienced sleep disorder with the AC in operation. Ekasiwi et al. [12] also found that 27% of respondents in Kuala Lumpur had symptoms related to the low temperature living. Haskell et al. [16] found that rapid eye movement (REM) sleep and stage 2 sleep at 21 °C decrease compared to sleep conditions at the thermoneutral temperature. Similar results were found by Candas et al. [17], Palca et al. [18] and Sagot et al. [19]. Thus, promoting a higher setpoint temperatures for sleep would be beneficial in improving sleep quality and other health problems related with low temperature living.
On the other hand, clothing and bedding type or insulations are also found to affect both thermal comfort and sleep quality. Lin and Deng [20,21] studied thermal comfort in sleeping environments by measuring the total insulation of the bedding system commonly used in the subtropics and established a thermal comfort model for sleeping environments. Jaafar and Croxford [22] and Jaafar [23] studied the effect of different covers (blanket and comforter) on the thermal neutrality of occupants in Malaysia. The study found that occupants who slept with a comforter had thermal neutrality of 2.3 °C lower compared to the blanket users. Shin et al. [24] conducted a study on different sleepwear fabrics under different ambient temperatures during a sleep period. Okamoto-Mizuno et al. [25] studied the effects of different materials used as a bedsheet and a bed pad in Japan; they found that the cotton bedsheet and the polyester bed pad improve the sleep quality significantly compared to the linen bedsheet and bed pad.
Although the study of thermal comfort and sleep quality is still limited, the available previous studies are beneficial in selecting the suitable and practical methodology for the present study. An easy (and the oldest) approach in evaluating both thermal comfort and sleep quality is using a questionnaire survey. The questionnaire survey such as the ASHRAE 7-point scale [26] is widely used in studies of thermal comfort, especially in waking up state. Sleep quality evaluation using a questionnaire survey is also widely used in the form of Pittsburgh Sleep Quality Index (PSQI) and its variations. Both of these questionnaires are adopted in a study by Zhang et al. [27] which also found that the most satisfactory operative temperature was at 24.2 °C, with subjects having a lower neutral temperature and a broader accepted temperature range during sleep. In addition, Imagawa and Rijal [28] also adopt the questionnaire surveys in investigating the thermal comfort, sleep quality, and behaviour of occupants in the bedrooms of Japanese houses during the hot and humid season. The study found that the mean comfort temperature during the hot and humid season is between 26.4 and 27.1 °C. Questionnaire surveys are also used in a study by Kim and Kum [29], who investigated the thermal comfort during sleep during summer in Korea. The study concludes that the sleep quality is the best at 26 °C and worst at 30 °C. The same approach is also adopted in studies by Liu et al. [30] and Wang et al. [31] which found that the best sleep quality is at the indoor operative temperature of 15.8 °C.
The use of a subjective questionnaire survey, especially in evaluating sleep quality have its own limitations, as pointed out by Lan and Lian [32]. Thus, some studies have adopted the use of an objective sleep quality measurement device, such as an electroencephalogram (EEG) device to capture vital signs. For example, Lan et al. [33] conducted experiments on the thermal comfort of occupants during sleep periods at three air temperatures, i.e., 23 °C, 26 °C, and 30 °C, using an EEG device to evaluate sleep quality. The study found that the air temperature greatly effects sleep quality, with a large difference in neutral temperature between the waking up state and sleeping state. Pan et al. [34] conducted experiments with a similar evaluation method for three different air temperatures, i.e., 17 °C, 20 °C, and 23 °C, and found that the temperature of 23 °C provides the best sleep quality of all three temperatures. While the EEG is a very accurate device in capturing vital signs related to the sleep stages, it is also a very expensive and sophisticated device. Apart from the use of EEG, a simpler device in measuring sleep quality in the form of a wrist wearable device could also be used. A study by Tsuzuki and Mori [35] adopted the use of a wrist actigraphy device in evaluating sleep quality of occupants in 22 Malaysian houses. The study found that the sleep quality decreases with increased air temperature and air velocity. Commercially available wrist wearable devices such as a Garmin or Polar activity tracker are also found accurately measure sleep data, as pointed out in studies by Brooke et al. [36], Lee et al. [37] and Spielmanns et al. [38]. Therefore, the combined use of a questionnaire survey and a wrist wearable device in evaluating both thermal comfort and sleep quality could be explored.
With this background, this study intends to find an effective alternative to prevent excessive use of AC during the respondents’ sleep period without impairing their sleep quality. Specifically, the authors focused on a special type of bed linen which was developed to alleviate the difficulty of sleeping in the hot summer of Japan and examined whether the use of this product could contribute to the increase in the cooling setpoint temperature without deteriorating the sleep quality of the respondents in Malaysia. To the authors’ knowledge, these study combinations have not been conducted by other researchers prior to this study. For these purposes, experiments of thermal comfort and sleep qualities of 20 respondents were conducted in air-conditioned bedrooms in Kuala Lumpur under two conditions: the first is the condition wherein respondents freely adjusted the cooling setpoint temperature; the second is the condition in which the cool bed linen was placed on the top of the bedsheet and the setpoint temperature was 3 °C higher than that of the previous case. The thermal comfort is evaluated using a questionnaire survey and the sleep quality is evaluated using both questionnaire survey and sleep data recorded from a Garmin activity tracker.
2. Materials and Methods
2.1. Field Survey
The field survey was conducted at the Business and Advanced Technology Centre (BATC) building located in the Universiti Teknologi Malaysia Kuala Lumpur (UTMKL) campus, from 10 November 2017 until 9 January 2018. The BATC is a two-storey building, as shown in Figure 1a,b. It offers accommodation for the public or students and has a floor area of 2461.3 m2. Two guest rooms at the BATC with split system AC units were utilised to conduct the field study. The guest rooms were designated as rooms A and B, as shown in Figure 1a, and both are located on the second floor of the BATC. The layouts of rooms A and B with floor areas of 10.1 m² and 10.6 m² are provided in Figure 1c,d, and e respectively. Figure 1e shows the example of the setup of the room wherein the sensors were placed near the head pillow on the bed. The placement of the sensors is based on the study by Crawshaw et al. [39] which showed that a human head has a high concentration of thermoreceptors. The instrument rig was placed within 0.5 m from the edge of the bed.
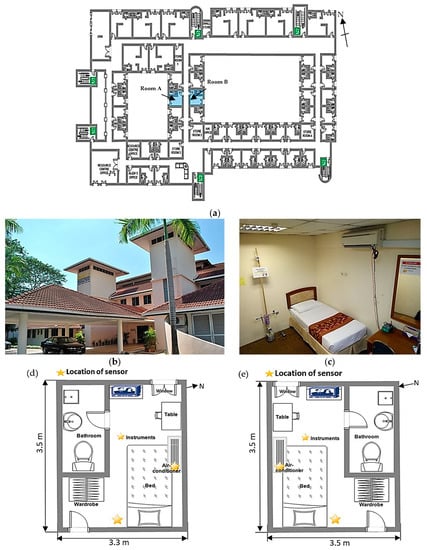
Figure 1.
Details of the measurement site: (a) the floor plan of the second floor of the BATC building with the locations of the investigated rooms; (b) the BATC building; (c) an example of the sensor setup in the room; (d,e) the layouts of the investigated rooms A and B, respectively, and (e).
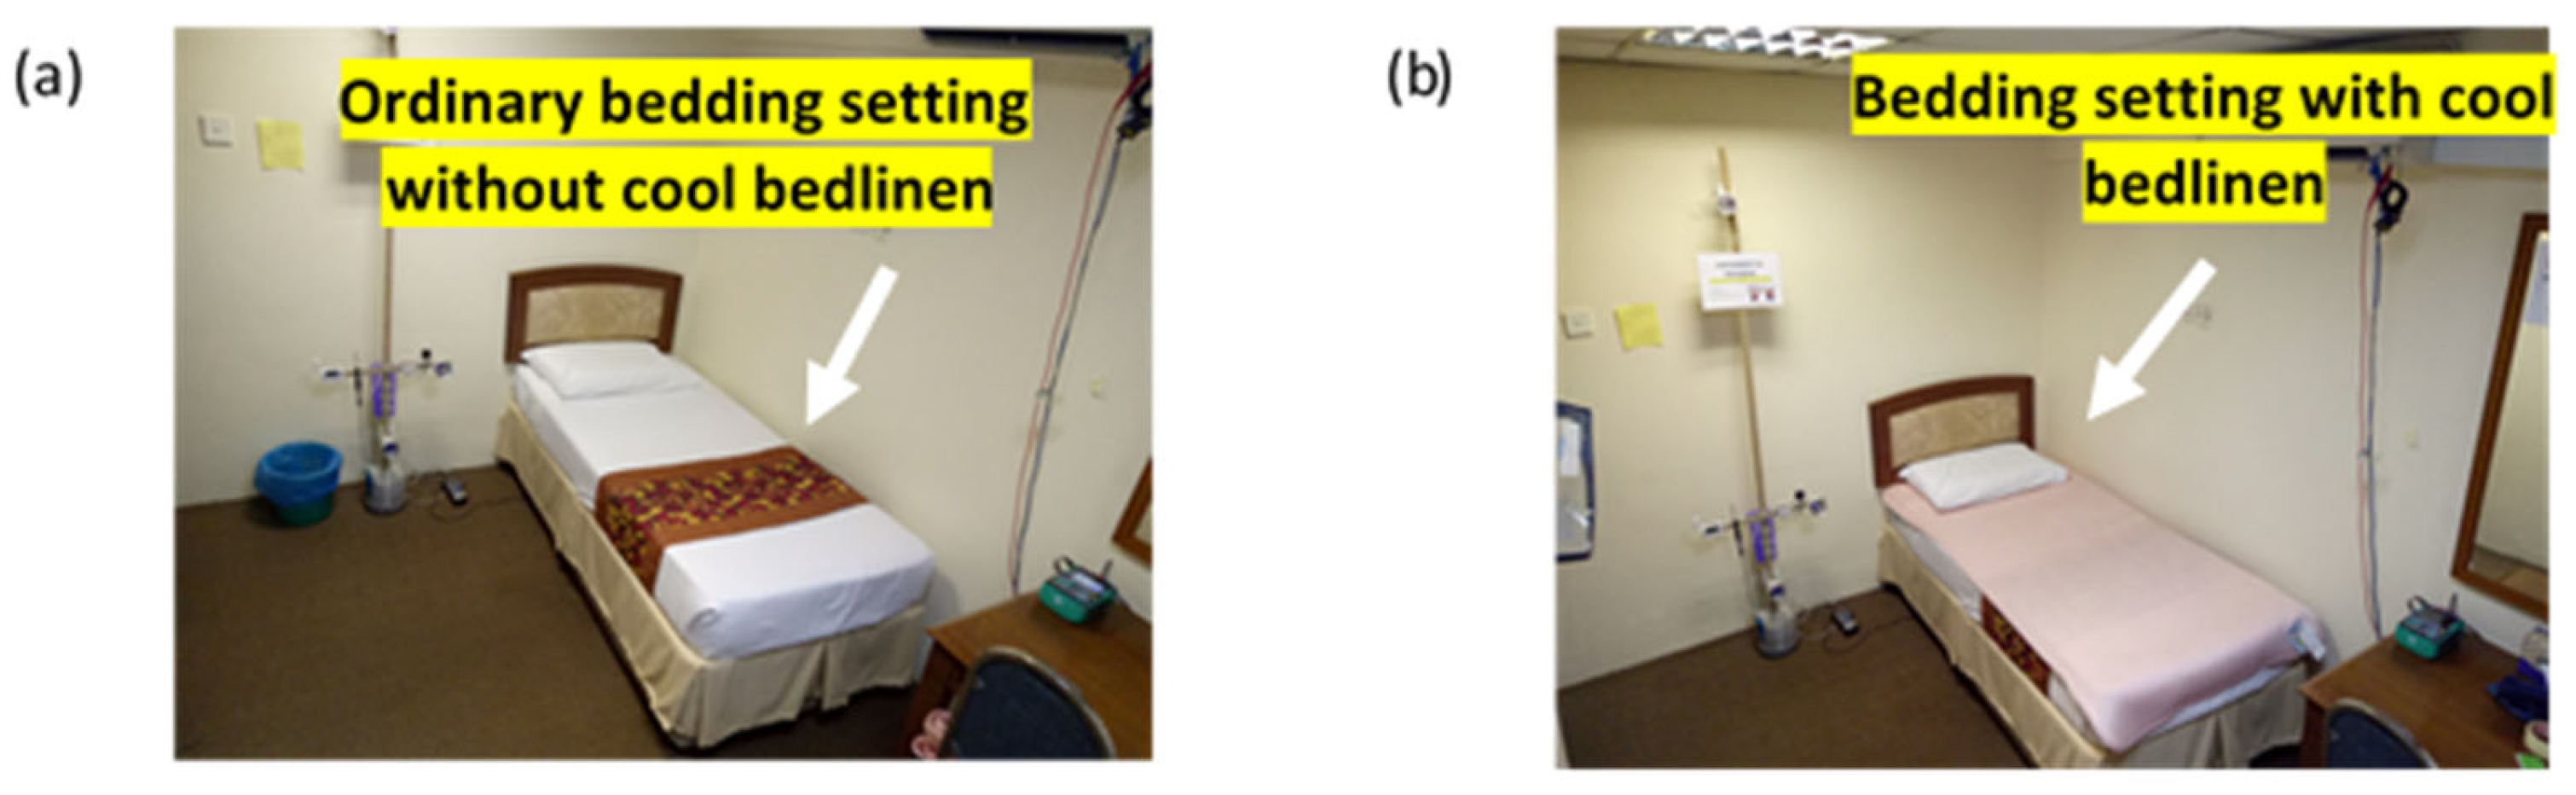
Two cases, Case A and Case B, were adopted in this study, as depicted in Figure 2. Case A refers to the usual situation, in which a respondent was allowed to freely decide the AC setpoint temperature based on his/her preference. An ordinary bedspread made of 100% cotton was used by all respondents throughout the duration of measurement. Blankets were also provided if needed by the respondents. Other additional bedding material including a simple sheet, a light duvet, and a cooling sheet were not provided nor worn by the respondents in this study. In the second case (Case B), the AC temperature was set 3 °C higher than the respective setpoint set by the respondent in Case A. Respondents were reminded not to alter the temperature settings throughout the night. The 3 °C difference of the setting temperatures between the two cases was determined from our preliminary study as the thermal perception was found to be affected after at least a 3 °C change in the setpoint temperature. Furthermore, Lan et al. [33] and Pan et al. [34] also incorporated the 3 °C temperature difference, although their studies were conducted in different climate conditions. To compensate for this higher setting temperature, the bedding was replaced with a special “cool” bed linen composed of 70% polyethylene, 20% polyester and 10% nylon on the outer fabric, 95% back polyester and 5% nylon mesh in the lining, and 100% polyester in core padding, produced by a Japanese company. The “cool” bed linen covered the bed without covering the pillow.
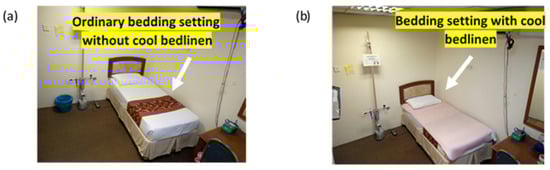
Figure 2.
Bedding used in the adaptive cooling cases investigated in this study: (a) ordinary bedding employed in Case A and (b) cool bed linen used in Case B.
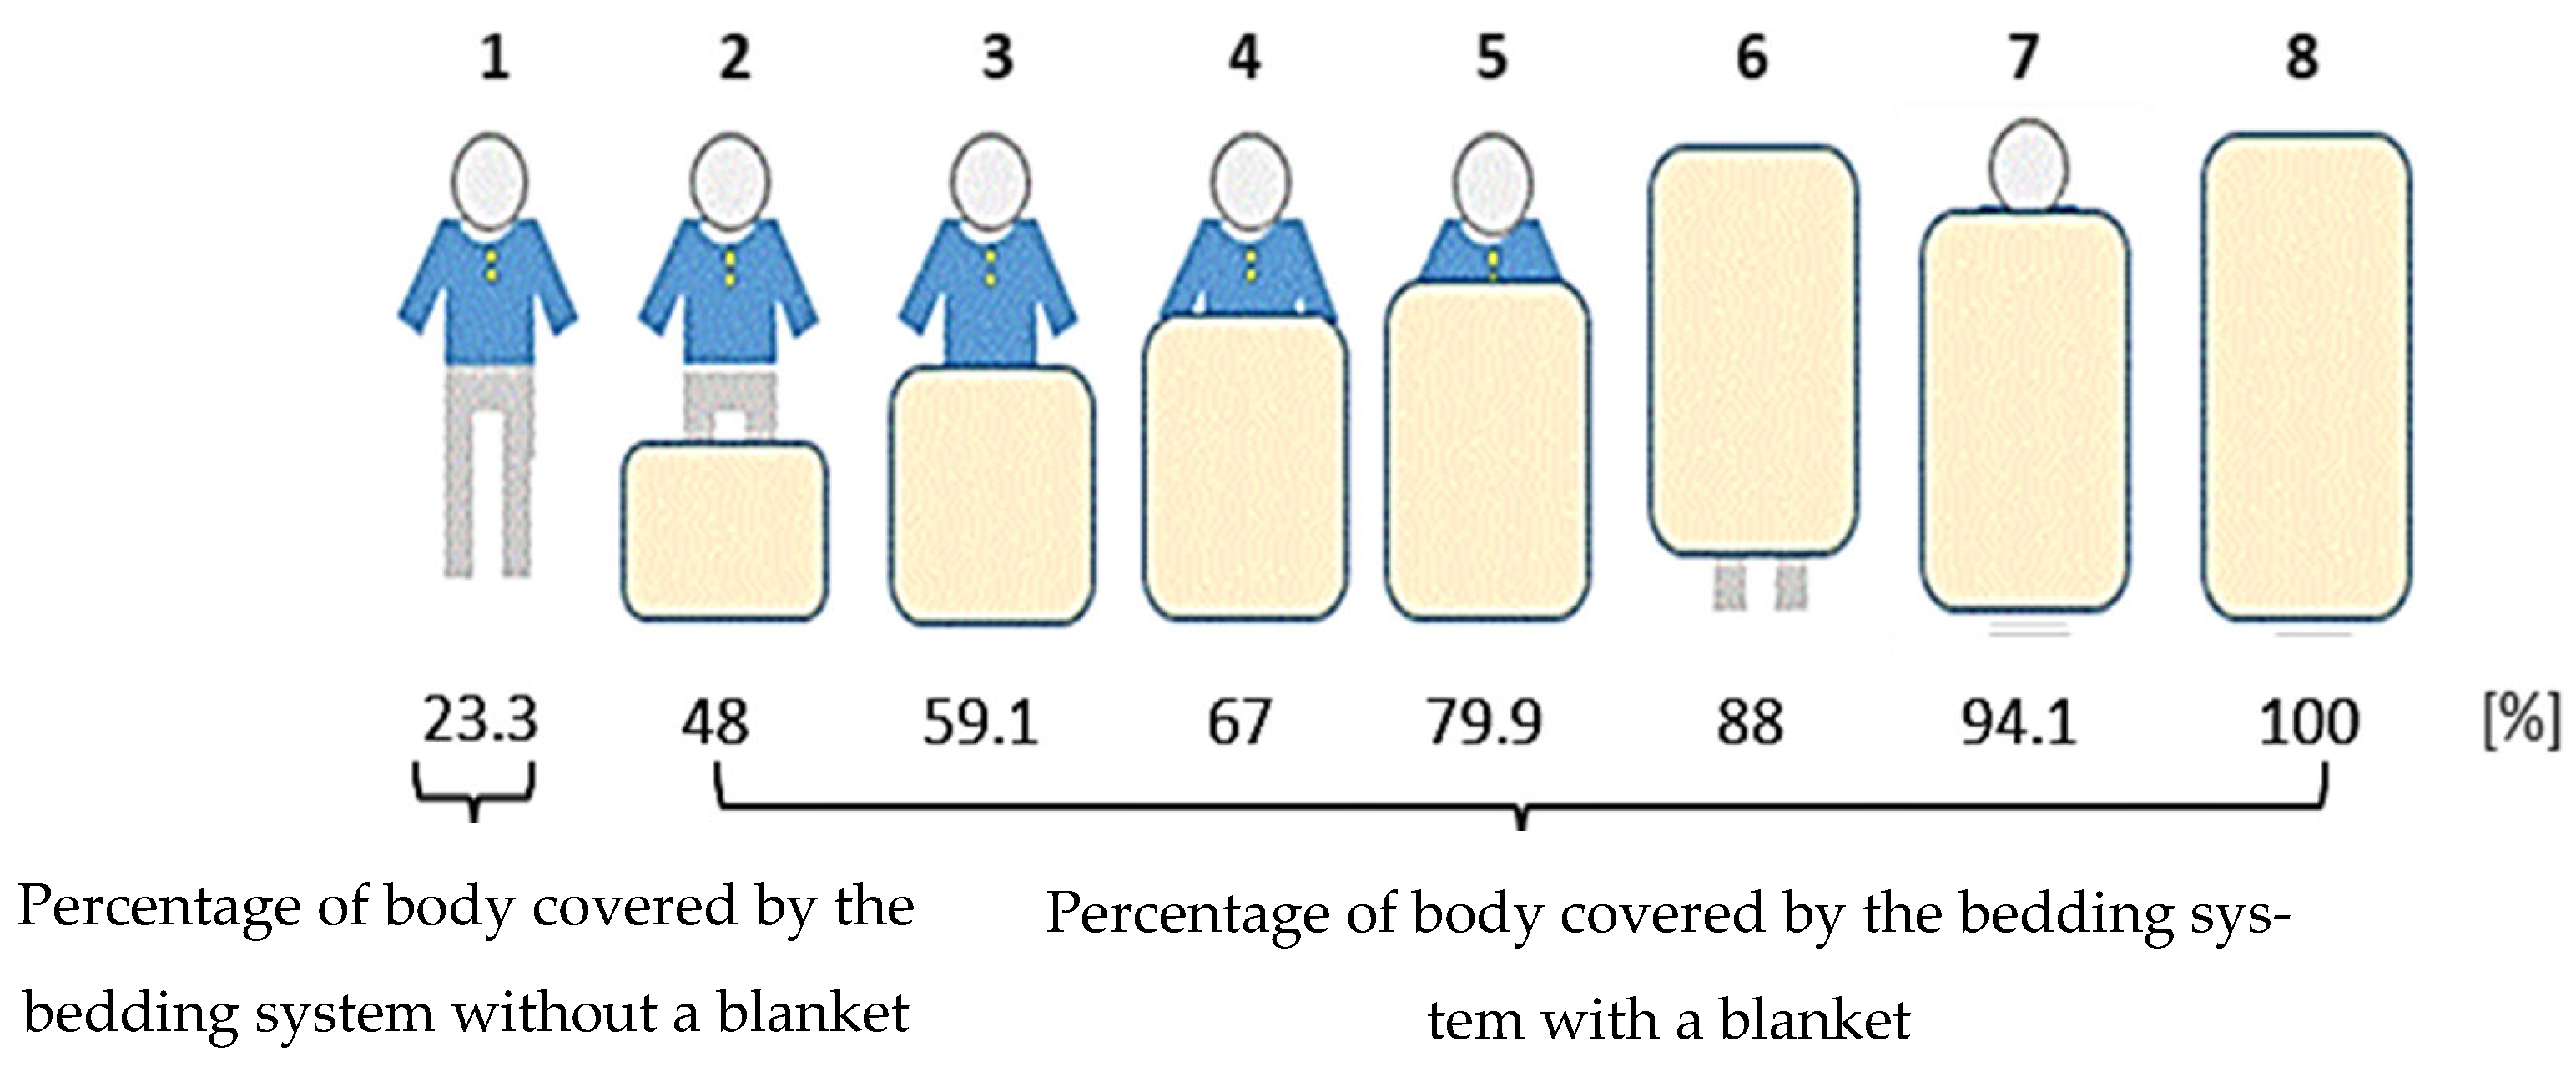
The indoor thermal conditions were measured continuously during the measurement period, and the questionnaire was distributed simultaneously. The respondents were required to sleep in the same room for three consecutive nights with each case while the field survey was conducted. The selected number of nights (i.e., three) was based on the study by Shin et al. [24]; one adjustment night was considered and followed by consecutive nights for measurement. A study by Tsukuzi et al. [40] also used two nights as measurement nights while a study by Lan et al. [41] only used one night as measurement night for each case. On the first night, the respondents could adjust and adapt to the room conditions. During the adjustment night, the respondents were free to set the AC temperature as they desired. Subsequently, on the second and third nights, the measurement was performed and the measured data obtained were utilised for the sleep quality analysis. The respondents wore similar types of clothing for all nights with a CLO value of 0.29. The type of beddings was similar for all nights throughout the study, except the use of the “cool” bed linen in Case B. No socks were allowed to be worn by the respondents. However, the respondents were free to cover their bodies using the provided blanket. The percentage of covering and the corresponding insulation value were evaluated using the respondents’ information in the questionnaire for which they were asked to make a selection, as shown in Figure 3; the respondents were instructed to fill up this information after waking up. This type of evaluation on blanket coverage was also used in the study by Tsuzuki et al. [42]. The total insulation values were determined according to the American Society of Heating, Refrigerating and Air-Conditioning Engineers (ASHRAE) Fundamental Handbook Chapter 9, representing the added insulation values of sleepwear and blanket within a 25% margin of error [43]. The effect of hand covering was not evaluated in this study. For the thermal comfort analysis, the data from all three nights were used since the data did not show large variations. A total of 20 respondents, comprising 10 males and 10 females aged between 23 and 35 years (mean 24.7 ± 2.7 years) with mean body mass index (BMI) of 23.5 ± 5.7, participated in this study. In total, 120 votes were collected from the 20 respondents in both cases. The breakdown of the measurement nights is shown in Table 1. The selected number of respondents are comparable with other thermal comfort studies such as the study by Lan et al. [33], Pan et al. [34] and Okamoto-Mizuno et al. [25], which ranged between 8 and 20 respondents. All respondents who participated in this study were ensured to be healthy and free from sleeping disorders, chronic diseases and long-term medication.
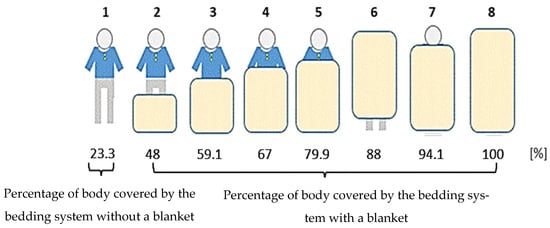
Figure 3.
Percentage of the body surface covered by the bedding system. Adapted from ref. [20].

Table 1.
Description of each case by night in this study.
2.2. Indoor Thermal Variables
Four indoor environmental variables were measured: air temperature (Ta), globe temperature (Tg), relative humidity (RH), and air velocity (Va). All of these variables were measured in 1 min intervals at 0.7 m above the floor, which was the same as the height of the bed. In addition, Ta was measured at 0.4 m (near the floor) and 2 m (near the ceiling). The additional sensors at the heights of 0.4 m and 2 m were to measure the Ta profiles to observe the temperature variation by height in the investigated rooms. Each instrument was installed on a stand, as depicted in Figure 4a,b. In addition, each respondent wore a sleep quality device, as shown in Figure 4c. The sleep monitoring device measured the total duration of sleep and total time awake in minutes based on the movement of the arms. The AC power consumption was also measured using the electricity consumption measurement device, shown in Figure 4d. All of the instruments were calibrated, and all of the sensors were tested before data collection. The specifications of the instruments are summarised in Table 2. Both the mean radiant temperature (Tmrt) and operative temperature (Top) were calculated using the expression provided in ASHRAE Standard 55 Handbook [43]. The outdoor air temperature (To) was obtained from the weather station located on the roof of the Malaysia-Japan International Institute of Technology building in the UTMKL campus. The information about this weather station can be found in Swarno et al. [44,45].
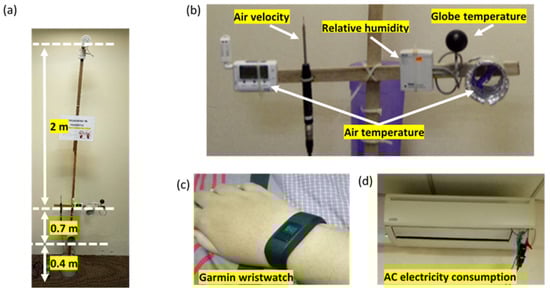
Figure 4.
Setup of instruments in the investigated rooms: (a) sensor-holding stand, (b) sensors used to measure the indoor thermal conditions at the level of the bed, (c) a respondent’s hand with a Garmin wristwatch, and (d) configuration used to measure the AC electricity consumption.
Table 2.
Specifications of the instruments used in this study.
2.3. Objective Sleep Assessment
Each respondent wore a Garmin watch activity tracker for the objective sleep quality assessment which includes Sleep Period Time (SPT) and Wake After Sleep Onset (WASO) that are needed to estimate Sleep Efficiency Index (SEI). The Garmin watch was selected due to its wide availability in retail shops. The study by Brooke et al. [36] also found that the Garmin watch is one of the most accurate devices for SPT measurement compared to other wearable activity trackers.
2.4. Subjective Sleep Assessment through Questionnaire
Each respondent answered the questionnaire twice each night. The questionnaire, which was printed on paper, was filled out manually by the respondent. The first and second surveys were conducted 10 min before the participant went to sleep and immediately after he or she woke up, respectively. The respondents were also reminded and clarified on the procedures before the start of the study. All of the respondents were in good health and took no medications during the field survey. The questionnaire consisted of two types of surveys: thermal comfort and sleep quality surveys. The thermal comfort survey included the thermal sensation, preference, and acceptability; air movement sensation and acceptability; skin moisture sensation and preference; and overall comfort of the respondents. The thermal comfort survey was designed based on the work by Damiati et al. [46], Zaki et al. [47], Mustapa et al. [48], Khalid et al. [49], and Imagawa and Rijal [28]. The thermal sensation was assessed by using the ASHRAE 7-point scale [26]. Meanwhile, the thermal acceptance, thermal preference, and overall comfort were assessed on 2-, 5-, and 6-point scales, respectively. The air movement sensation was evaluated by using a 4-point skin moisture sensation scale. The details of all of the scales used in the thermal comfort survey are provided in Table 3.
Table 3.
Scales used in the thermal comfort survey.
The sleep quality survey addressed the subjective perceptions of the respondents regarding their sleep quality. The survey consisted of five questions addressing sleep calmness, sleep satisfaction, sufficiency of sleep, total number of times waking up during the night, and reason for waking up, as presented in Table 4. The sleep calmness scale, ranging from “very calm” to “very restless”, is based on the study by Åkerstedt et al. [50]. For the other four questions, the scales in the sleep quality survey were based on a previous study [51]. The insulation values of clothes were estimated based on ASHRAE Standard 55 [26]. Meanwhile, the insulation of the bedding system was estimated based on observations of the investigated bedrooms. In general, a bedding system consists of a single bed, a conventional mattress, a 100% cotton bedspread, and a blanket. However, it is necessary to consider the percentage of the body surface covered by the bedding, since it could affect human comfort. Therefore, the insulation value of the bedding system and the percentage of the body surface of each respondent covered by the bedding system were determined based on the study by Lin and Deng [20]. As mentioned, the percentage of covering was evaluated using the respondents’ information from the questionnaire after waking up. The different percentages of the body surface area covered by the bedding system are shown in Figure 3. The figure illustrates the different bedding placements on the body of the respondent, each corresponding to the percentage of the body surface area covered by the bedding and the bed, obtained from McCullough et al. [52]. For example, picture 1 depicts 23.3% of the body surface area being in contact with the bedding system and without being covered by a blanket; picture 3 depicts 59.1% of the body surface area being in contact with the bedding system, with the blanket covering half of the body. The respondent’s adaptive action of adjusting the blanket coverage was evaluated in this study. Thus, for Case B, since the insulation value of the “cool” bed linen could not be determined from the available documents, the insulation value from the “cool” bed linen was neglected for simplicity and the similar bedding insulation value of Case A was assumed.
Table 4.
Scales used in the sleep quality survey.
3. Results
3.1. Outdoor and Indoor Thermal Conditions
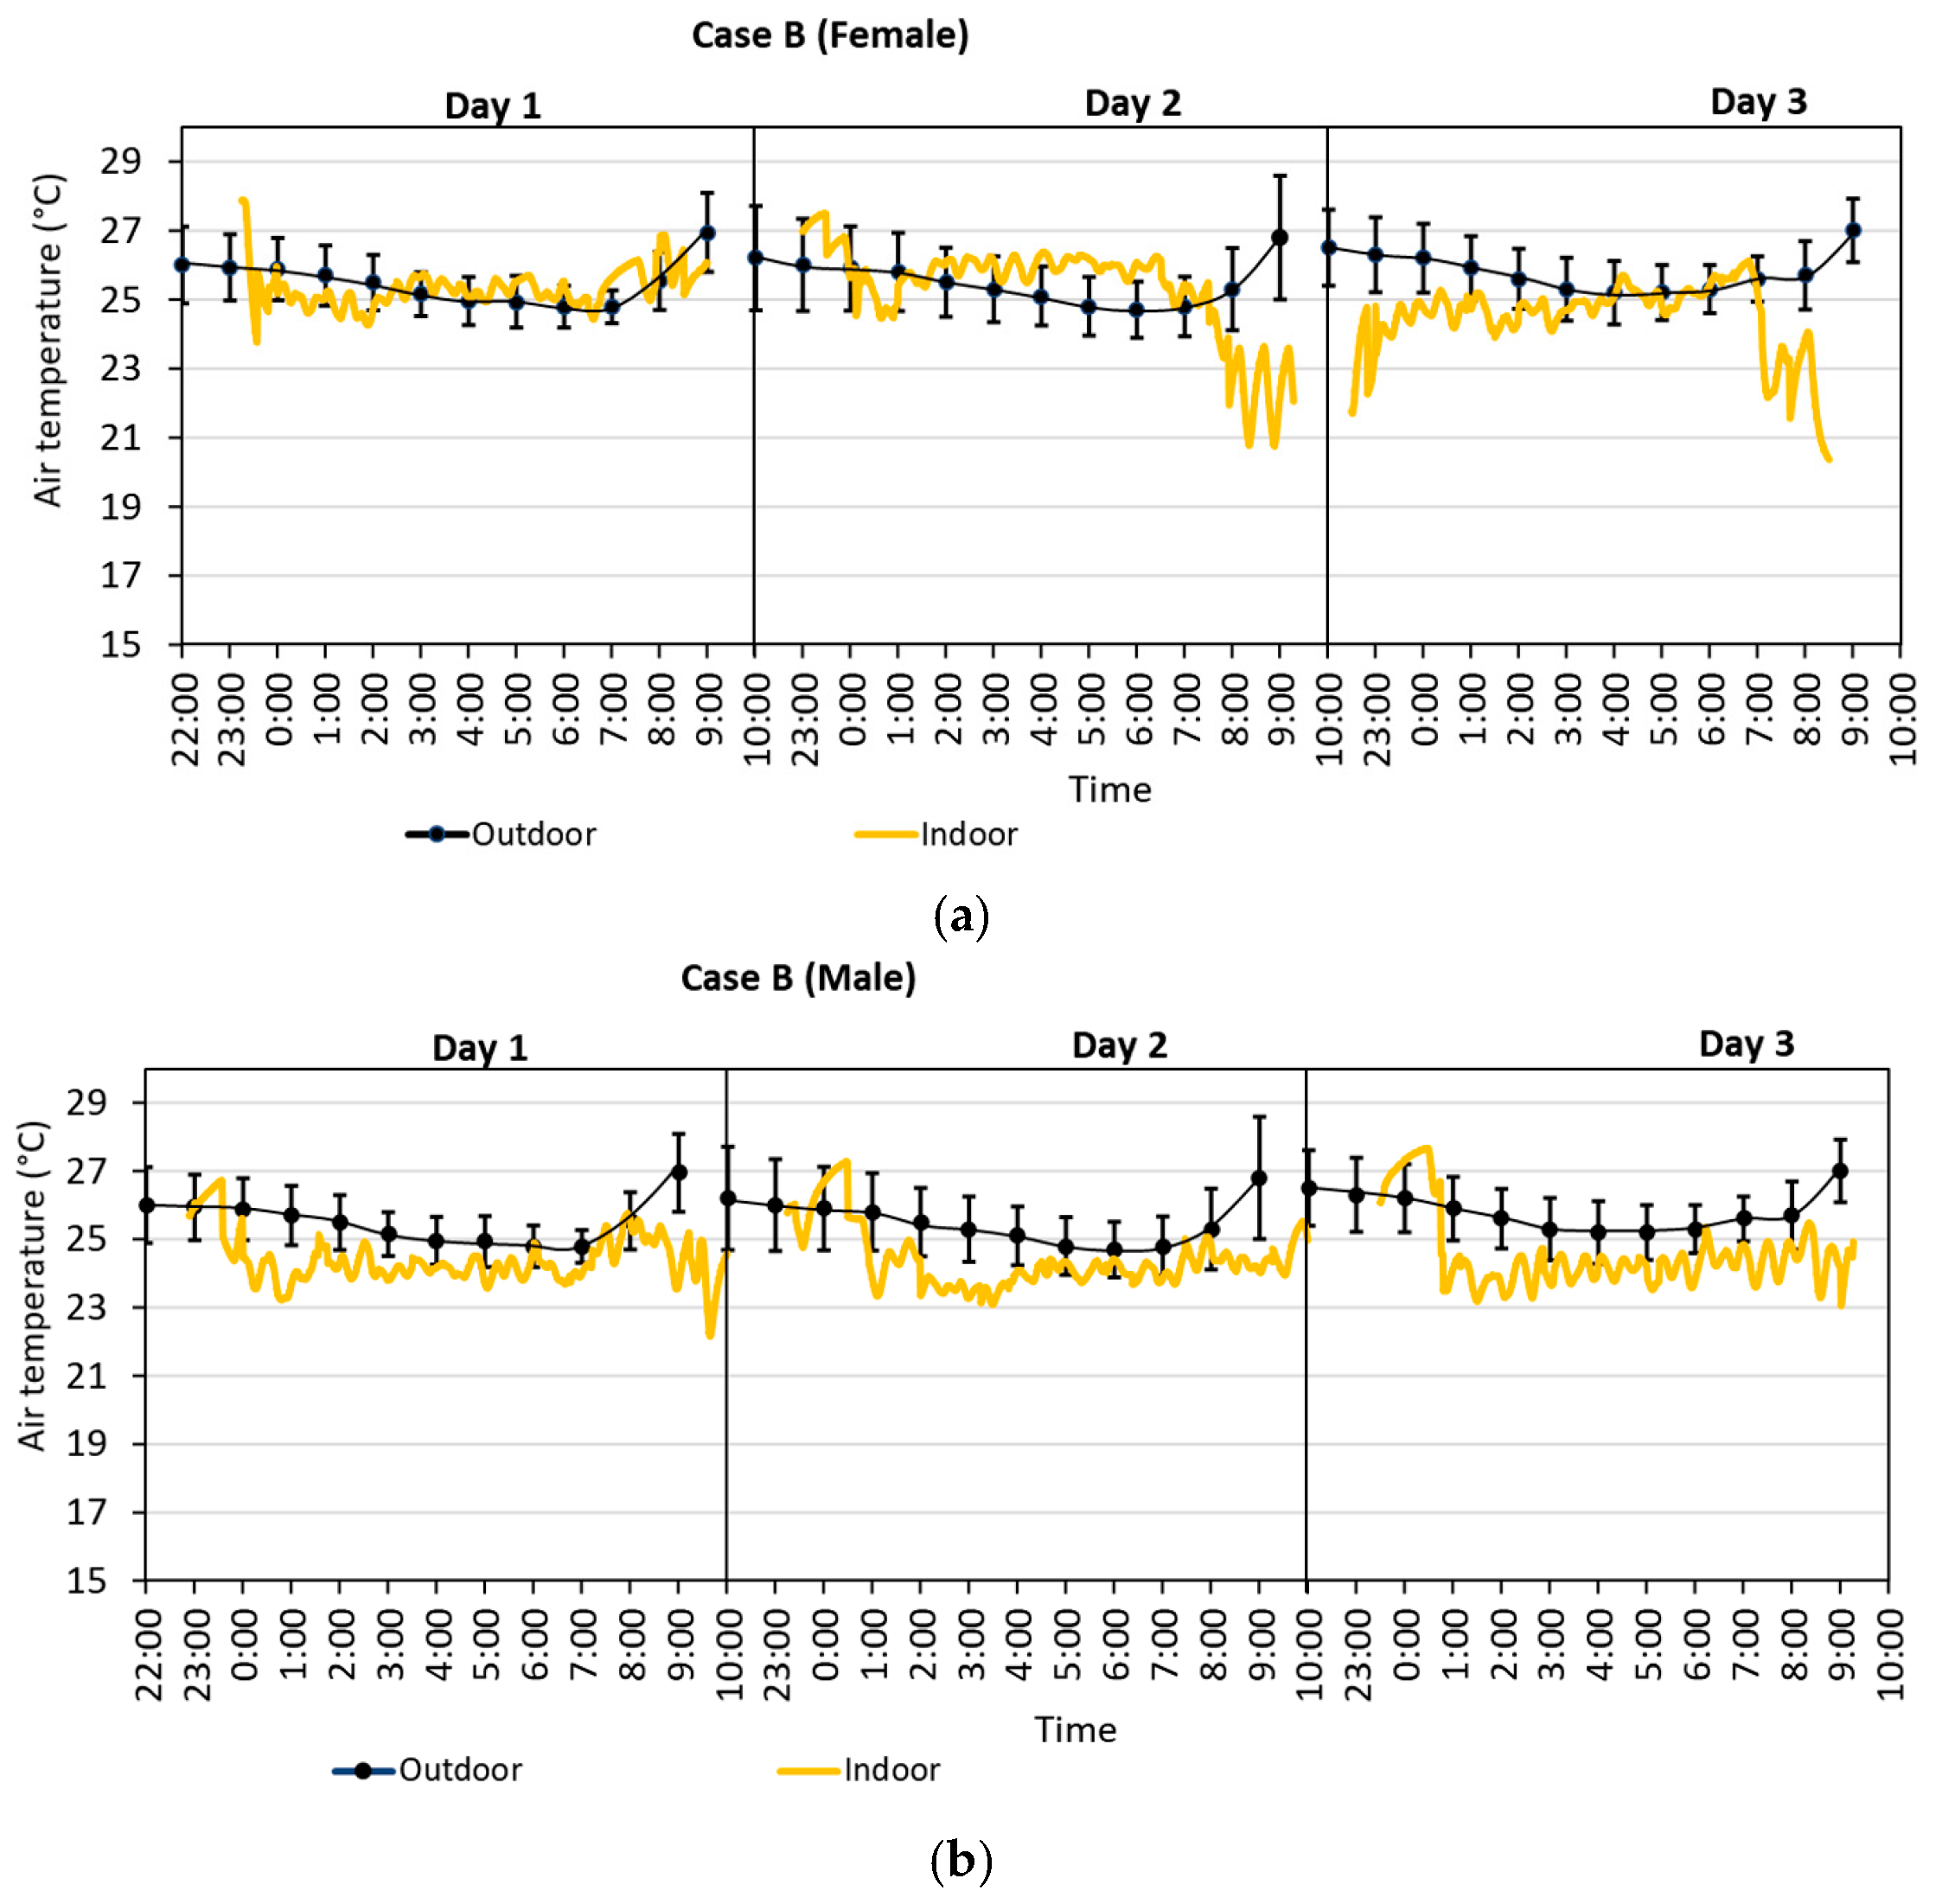
This section presents the outdoor and indoor thermal conditions obtained from the field measurements. Table 5a,b show the temperature settings for each case for all respondents. On average, male respondents have lower setpoint temperature compared to female respondents. Figure 5 and Figure 6 show the variations of indoor air temperature (Ta) and the mean To during the period of sleeping by gender in both cases during the field survey. The mean To during the sleeping period from 22:00 to 10:00 in Case A ranged from 24 to 29 °C, and the averages of mean Ta were 22.0 °C and 23.3 °C for the male and female respondents, respectively. This wide range of indoor temperature clearly indicates the diverse preference of respondents toward the AC setpoint temperature. In contrast, the averages of mean Ta during the sleeping period in Case B were 24.2 °C and 25.3 °C for the male and female respondents, respectively; this is higher by about 2 °C than that of Case A for both genders. In other words, the realised indoor air temperature was not equal to the AC setpoint temperature. The difference between the setpoint temperature and the realised indoor air temperature could be due to a few factors. First, the AC units in both rooms are not equipped with heating elements or heat pump mode. Thus, the AC-supplied air temperature would be limited to its outdoor air temperature. Secondly, the AC units installed could be undersized for the rooms. For the given room size, the suggested cooling requirement according to Energy Star [53] is around 6000 BTU or 1.8 kW. Moreover, the performance of the AC units in the rooms might be affected by wear and tear since both AC units are quite aged. Furthermore, the AC units might not be very well maintained throughout their lifetimes, resulting in decreased performance.
Table 5.
(a) Temperature settings for each case for female respondents. (b) Temperature settings for each case for male respondents.
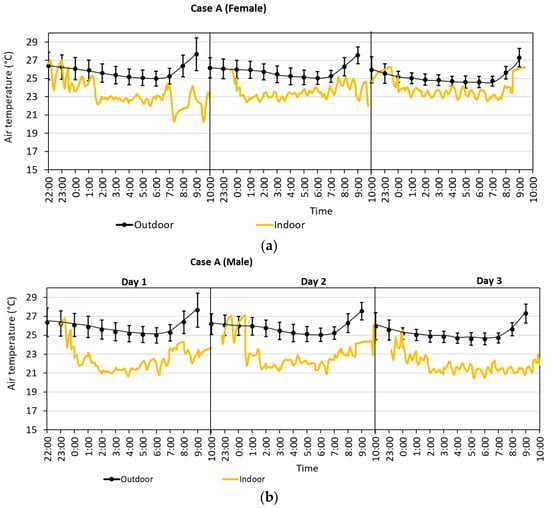
Figure 5.
Variations of mean Ta for (a) female and (b) male respondents in Case A.
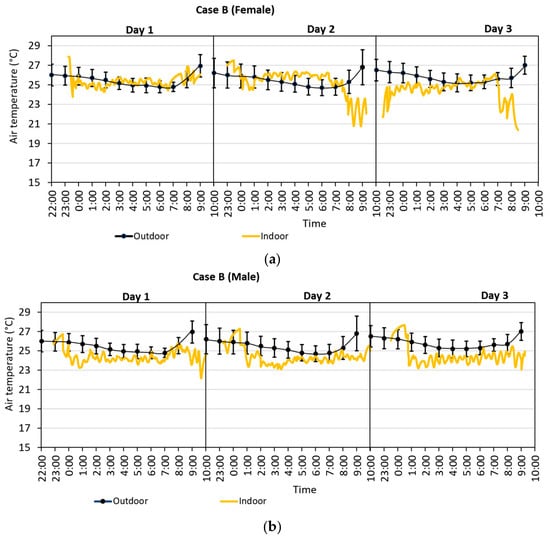
Figure 6.
Variations of mean Ta for (a) female and (b) male respondents in Case B.
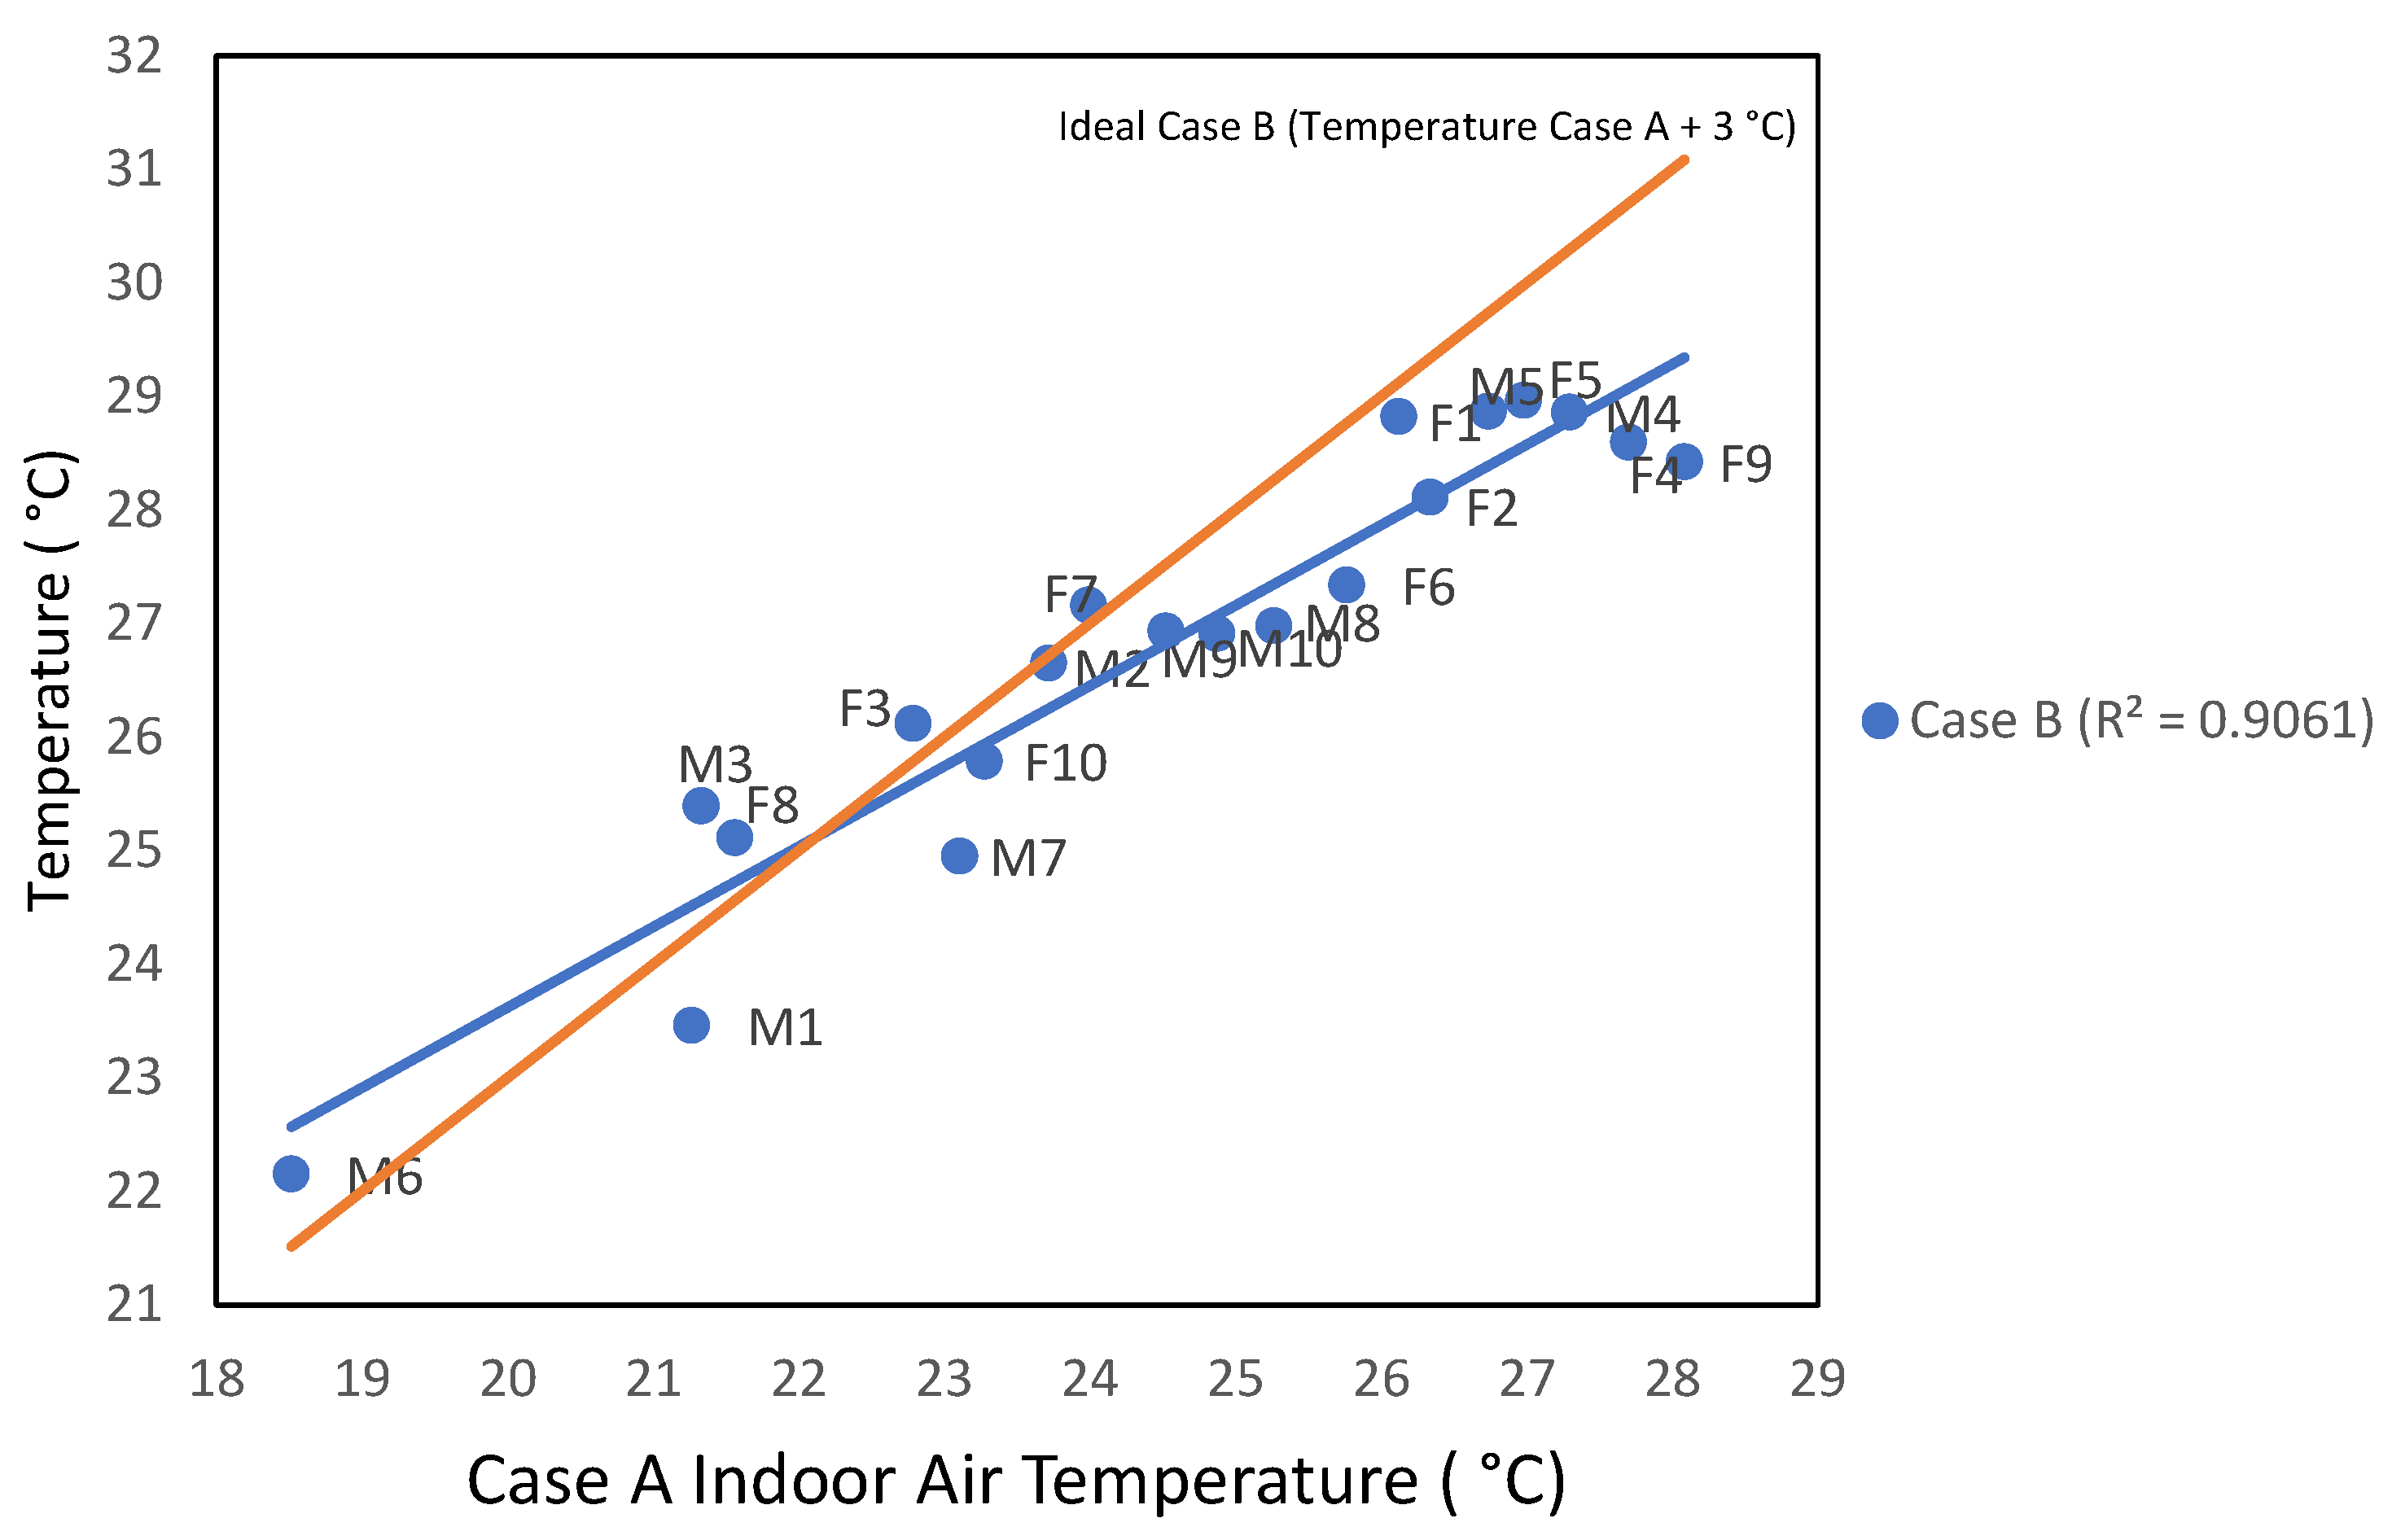
In Figure 7, the average air temperature measure for Case B was compared with the ideal air temperature of Case B, which is 3 °C higher than the average air temperature measured for Case A. This comparison was intended to observe a 3 °C difference in the indoor air temperature. However, the measured air temperature was not 3 °C higher as intended. The difference in the measured air temperature is discussed earlier. This difference was most visible for respondents that had initially set a relatively high temperature in Case A. This shows the limits of the typical AC units equipped without a heating element as the maximum air temperature that could be provided by a typical AC unit is limited to the outdoor air temperature. For example, a typical AC set at 30 °C would not be able to supply air temperature at 30 °C if the outdoor air temperature is 28 °C.
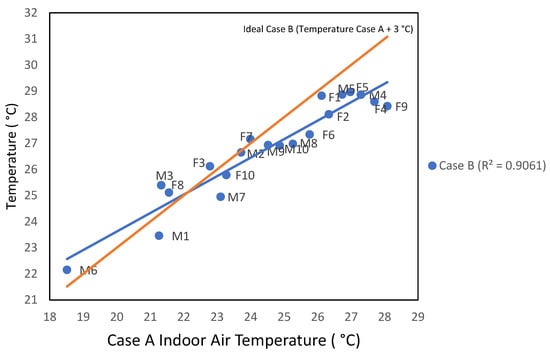
Figure 7.
Comparison between the measured temperature of Case B and the ideal temperature of Case B for each respondent.
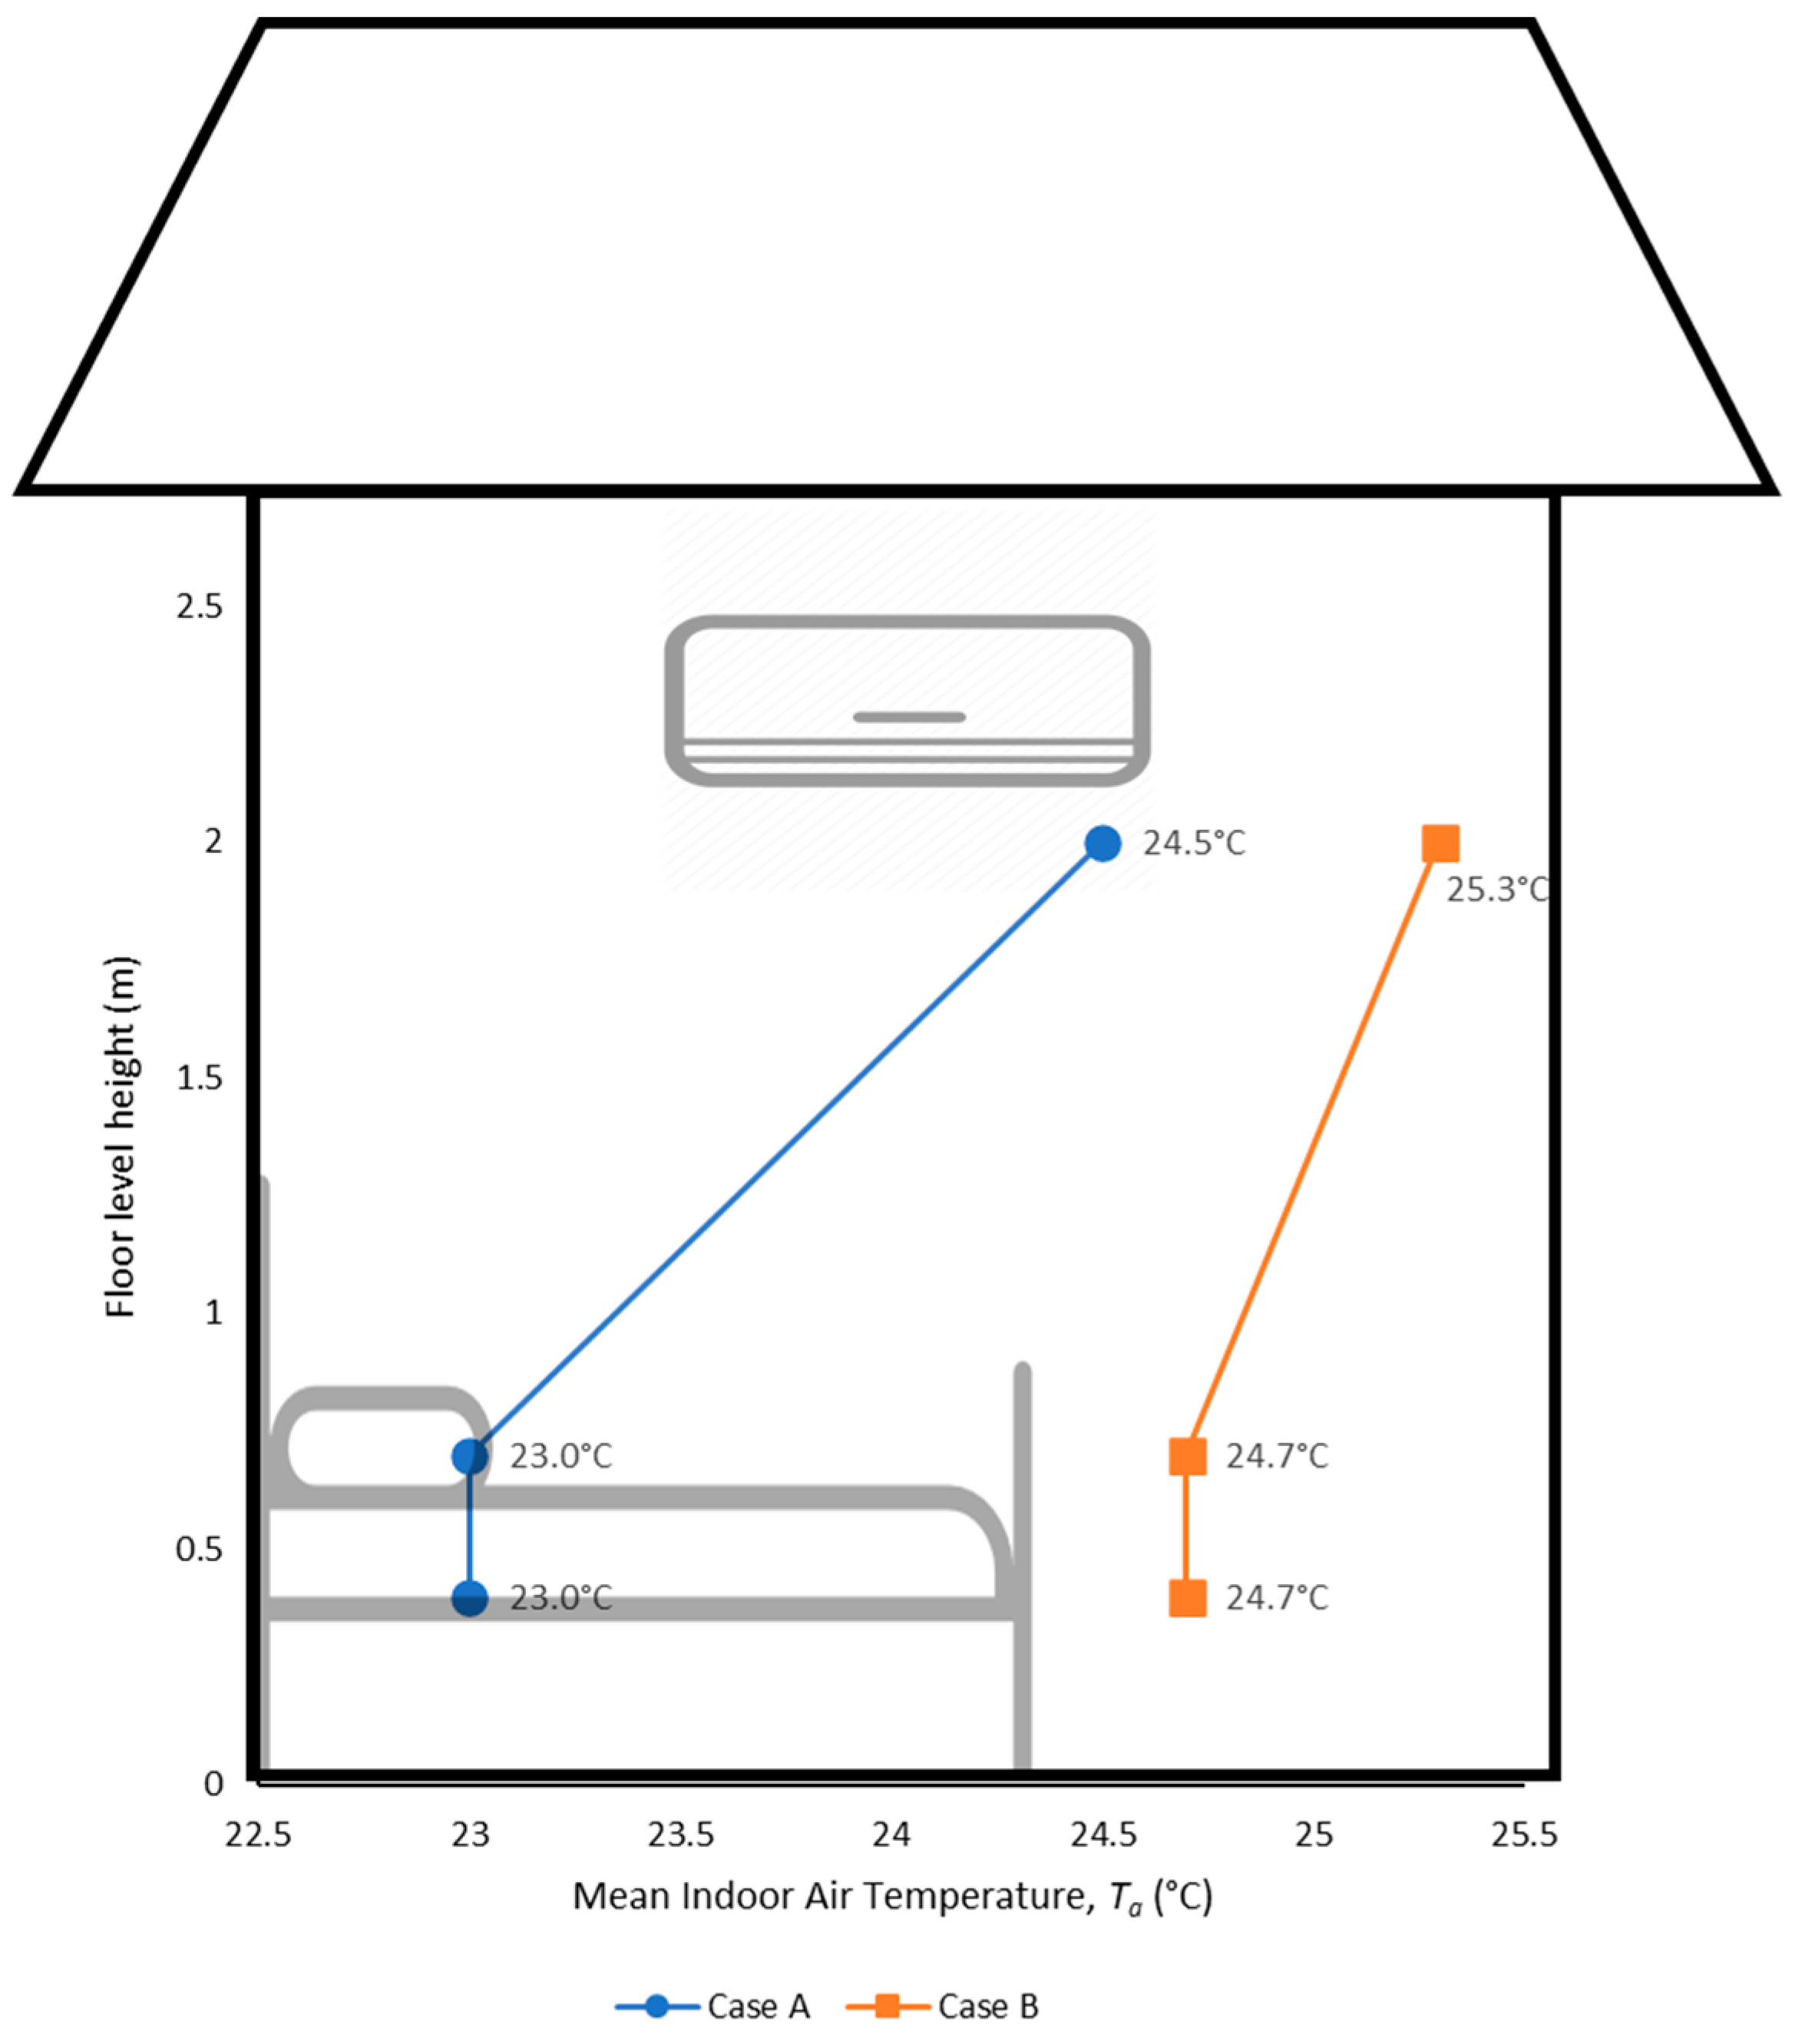
The mean outdoor and indoor thermal measurements during the sleeping period are presented in Table 6 and Table 7. For both cases, the data obtained were averaged from 10 min before each respondent went to sleep until he or she woke up in the morning. The results show that Ta at 2 m was approximately 1 °C higher than those at 0.7 m and 0.4 m. The illustration of the mean air temperature distribution according to the floor height for both cases is in the Figure 8. This was due to the presence of warmer air, which tends to rise as it is less dense than colder air. Meanwhile, Ta is identical at 0.7 m and 0.4 m. Since 0.7 m was the height of the bed, Ta at 0.7 m is considered for the subsequent analysis and comparison. The mean Ta at 0.7 m was 1.7 °C higher in Case B than in Case A.
Table 6.
Mean values of outdoor and indoor thermal conditions during the survey.
Table 7.
Mean values of outdoor and indoor thermal conditions during the survey.
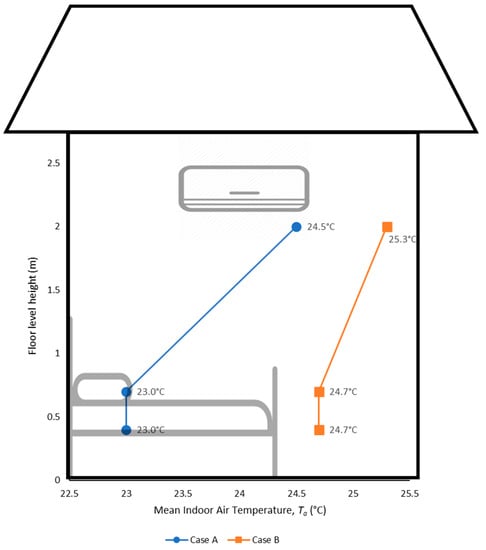
Figure 8.
Illustration of mean air temperature distribution according to the floor height.
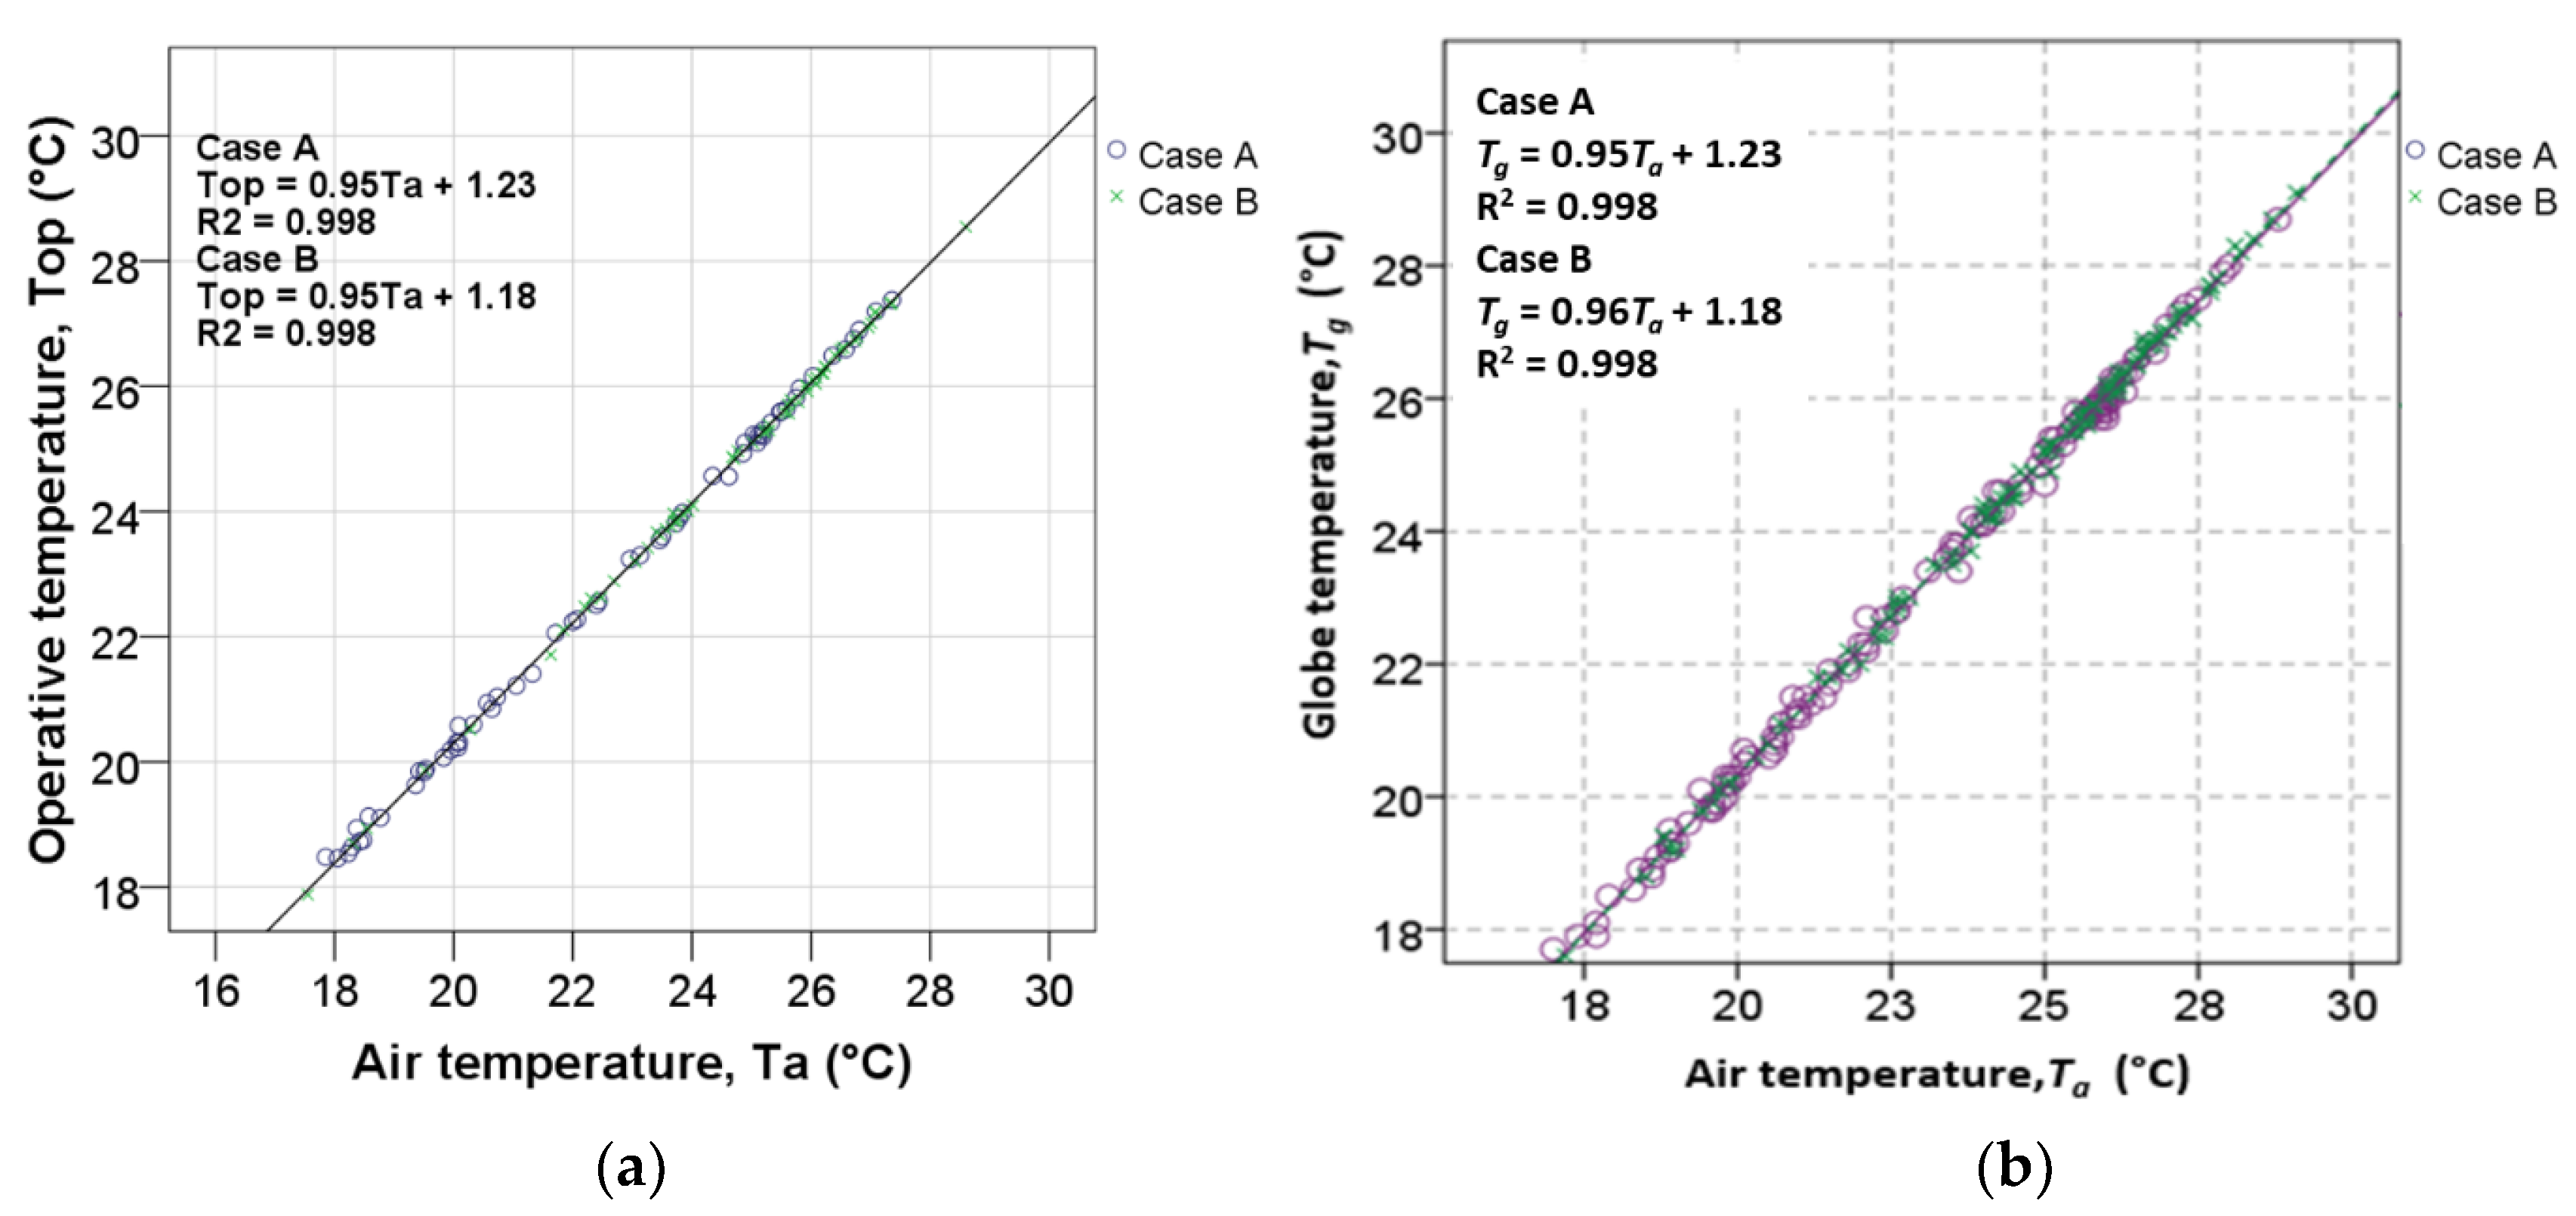
The correlations of Ta with the globe temperature (Tg) and operative temperature (Top) were also determined and found to be highly statistically significant for both cases, as shown in Figure 9. It was necessary to analyse the correlations of these thermal indices with Ta since Tg was affected by heat radiation, whereas Top was estimated by using Tg. According to the correlation analysis results, no radiation existed in the investigated rooms during the field survey, since Tg is similar to the measured Ta. In this study, Top is used for the subsequent analysis and discussion.
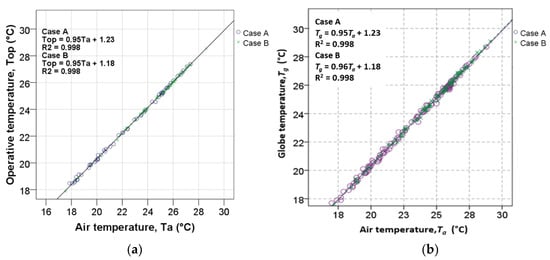
Figure 9.
Correlation between (a) Ta and Top and (b) Ta and Tg.
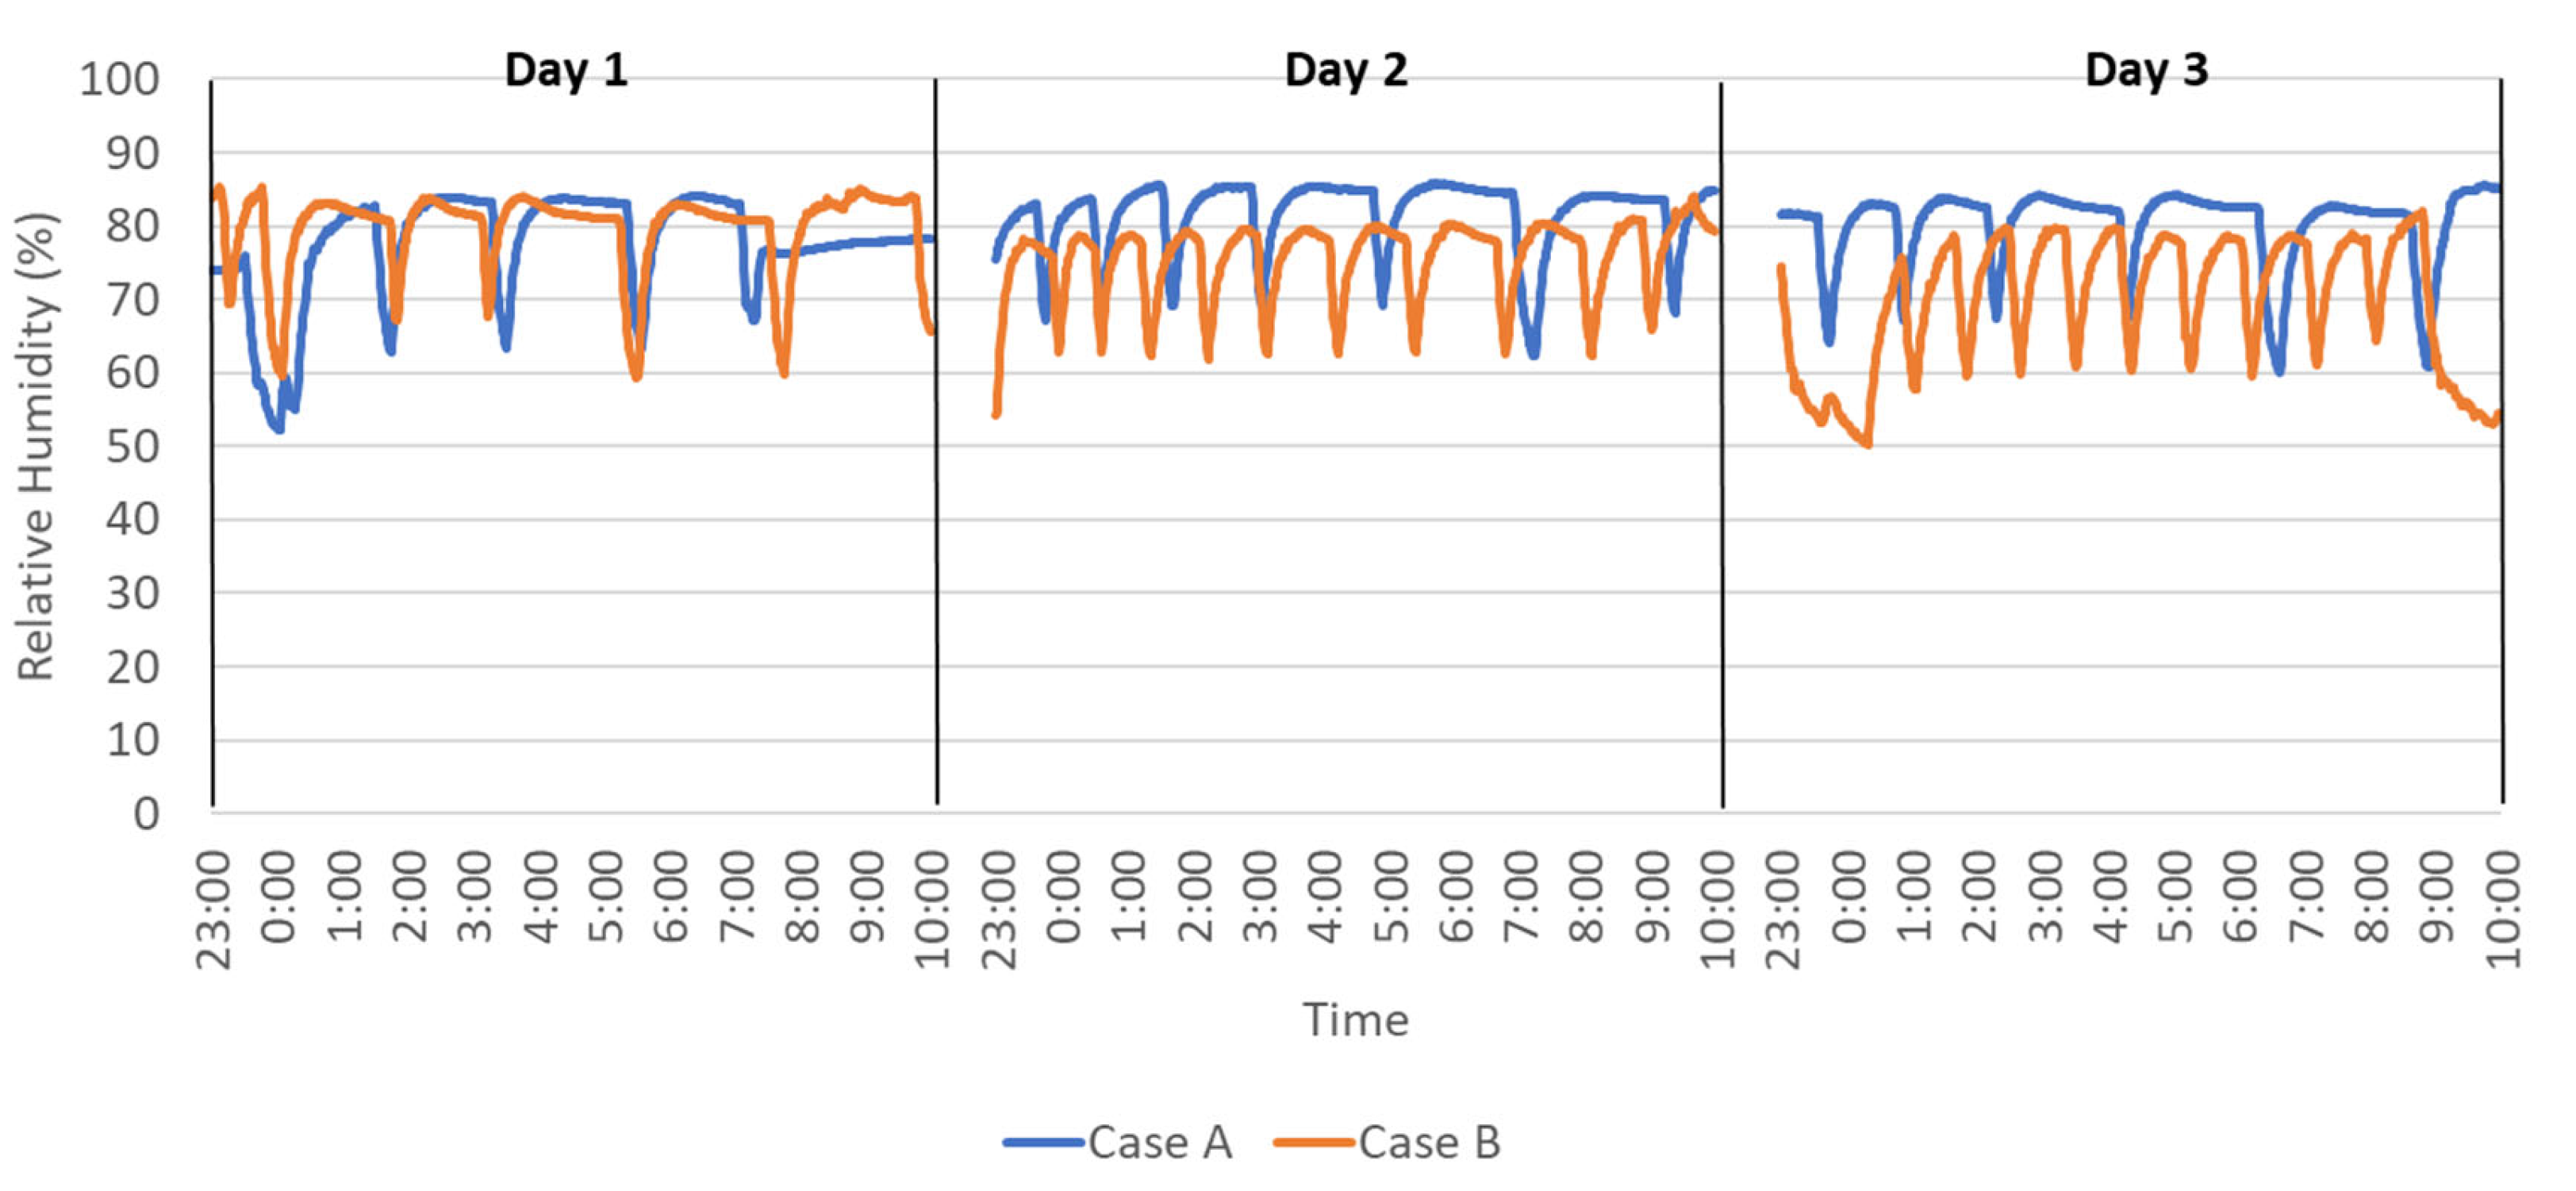
In Table 7, the highest RH was 74% for Case B and 68% for Case A. Meanwhile, the mean absolute humidity (AH) was 14.8 g/kgDA for Case B and 12.5 g/kgDA for Case A. These values are higher than the upper AH limit of 12 g/kgDA specified in ASHRAE Standard 55 [26]. Figure 10 shows the Relative Humidity (RH) for one of the respondents (F1). The graph shows that there is a very similar pattern of RH between each case. As there are no relative humidity control mechanisms, this study is unable to further evaluate the effect of relative humidity to the respondents. This approach was also seen in other combined thermal comfort and sleep quality studies that did not use a controlled climate chamber, such as Zhang et al. [27] and Tsang et al. [54]. A study by Rijal et al. [55] also concludes that the humidity has very little effect on the comfort temperatures of respondents.

Figure 10.
Evolution of relative humidity, RH (%) for each night for respondent F1.
In Table 7, the mean air velocity (Va) is almost low and almost the same with both cases. These Va values are normal for an indoor setting [46]. The very similar air velocity between both cases eliminates the effect of air velocity to the sleep quality of the respondents. This is also supported by studies by Morito et al. [51] and Akiyama et al. [56], who reported that small air velocity difference resulted in no effects in amount of time during each sleep stage and Total Wake After Sleep Onset (WASO), respectively. However, it is acknowledged that a higher airflow difference between each set of data could result in more visible effects on the sleep quality and thermal comfort of a room occupant, as mentioned in the study by Lan et al. [57].
3.2. Correlation between AC Power Consumption and Ta
The mean AC power consumption was compared with the temperature difference (∆T) between To and Ta for each respondent and both cases, as shown in Figure 11. The figure shows that a low value of Ta resulted in increased AC power consumption. As expected, the AC power consumption was found to be increasing as the difference between indoor and outdoor temperatures increases. In addition, the overall AC power consumption was decreased with Case B. The difference between the mean AC power consumption results obtained for the two cases is 0.16 kW or a 39% reduction in energy consumption in Case B. According to Ranjbar et al. [6], the average AC electricity consumption constitutes a significant portion of the total electricity consumption, and the peak AC demand occurs during the sleep period at night.
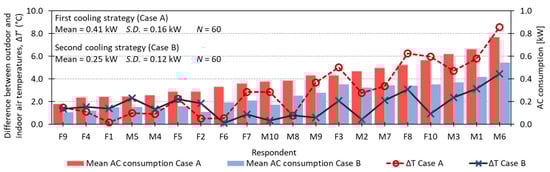
Figure 11.
Comparison of the mean AC power consumption with the mean ΔT of each respondent for both cases. F and M indicate female and male respondents, respectively.
3.3. Subjective Evaluations
3.3.1. Distribution of Votes
This section discusses the subjective evaluations of the respondents according to the questionnaire. Table 8 summarises the subjective evaluations for both cases. It indicates that the mean thermal sensation vote (TSV) ranges from −1 to 1 with both cases and that the respondents could accept the present conditions of both cases. This conclusion is confirmed by the thermal acceptance (TA), which has a mean of 1.0 for both cases. Meanwhile, the mean thermal preference (TP) in both cases is close to “0—no change” with the value at exactly 0 in Case B. This shows that the cool bed linen provided adequate thermal conditions even with the higher air temperature in Case B. In addition, it was essential to determine the overall comfort of the respondents to assess whether they were satisfied with the indoor thermal environment. The mean overall comfort (OC) values are near “5—comfortable” for both cases. Thus, it can be said that the majority of the participants were comfortable overall. The air movement sensation (AMS) shows that most of the respondents voted “2—weak airflow” inside the rooms for both cases. Generally, the respondents could accept the air movement in the rooms, as shown by the fact that the air movement acceptability (AMA) has a mean value of approximately 1.0 in both cases where AMA values of 1 and 0 are “acceptable” and “not acceptable”, respectively. This indicates that the respondents were satisfied with the air movement in the rooms for both cases. The skin moisture sensation (SMS) was also investigated. The corresponding survey question was initially intended to identify the sensations of the participants regarding the humidity of the room. However, our preliminary study revealed that the respondents did not understand the meaning of “humidity”. Thus, the question was modified by changing it to skin moisture sensation. Based on our findings, the mean SMS values for Cases A and B were −0.3 and −0.1, respectively, while the skin moisture preference (SMP) was almost “0—no change”, indicating a neutral feeling in all cases.
Table 8.
Mean and standard deviation of each subjective variable in each case.
3.3.2. TSV and TP
Table 9 shows the percentages of the TP scores corresponding to each TSV for both cases. Logically, when the respondents selected “3—cold”, “2—cool”, and “1—slightly cool”, they preferred “1—slightly warmer” or “2—much warmer” conditions. In Case A, 81.6% of the respondents reported being comfortable (voted TP of −1 to +1) and 94.9% of respondents reported being comfortable in Case B. In addition, the percentage of the respondents who preferred the ideal vote combination, which is “0—no change” of TP when describing their thermal sensation as “0—neutral”, was higher with Case B than with Case A (57.5% versus 30.8%, respectively). It seems that the respondents were more comfortable with Case B in this case. When only comparing the TP vote of “0—no change” regardless of the thermal sensation, the total vote for Case B was 75%, which was higher compared to 64.1% for Case A. This suggests that most people prefer the condition of Case B, although for some of them, the temperature was not at neutral. This finding follows the study by Shahzad and Rijal [58], which suggests that some people prefer staying in a climate with non-neutral temperature while also feeling thermally comfortable. These findings demonstrate that the respondents were satisfied with the thermal conditions in the room and did not want to change the conditions.
Table 9.
Percentages of TSV corresponding to each TP value for each case.
3.4. Comfort Temperature Using Griffiths’ Method
The comfort temperature (Tc) was estimated using the Griffiths’ method [59,60]. On the other hand, applying linear regression for adaptive behaviour can be misleading when estimating Tc [59,61]. Therefore, the Griffiths’ method was selected to predict Tc for each individual based on the TSV, using the following equation:
where T can be Ta, Tg or Top (°C), TSV is the thermal sensation vote, 0 indicates the neutral condition, and α is the constant rate at which the thermal sensation changes with the room temperature. When TSV = 0 in Equation (1), the comfort temperature is equal to the substituted T.
In applying the Griffiths’ method, α values of 0.25, 0.33, and 0.50 were previously employed by Mustapa et al. [48] and Humphreys et al. [61] for the 7-point TSV. Here, the comfort temperature was estimated by using these α values to validate the Griffiths’ comfort temperature. Table 10 presents the descriptive statistics of the mean comfort temperatures corresponding to each constant, using Tca, Tcg, and Tcop. Humphreys et al. [61] suggested that α values greater than 0.40 are more reliable. Consequently, α = 0.50 was used to estimate the comfort temperature based on Top, which is consistent with other studies [48,62,63]. The comfort temperatures estimated using the Griffiths’ method for both cases (24.7 °C and 25.2 °C for Cases A and B, respectively) are close to the mean Top, as shown in Table 5. Thus, α = 0.50 was adopted to estimate the comfort temperature. Considering the thermal adaptation in each climate, the comfort temperature is related to the indoor temperature [64,65]; therefore, Top was used to validate the Griffiths’ comfort temperature in this study.
Table 10.
Comfort temperatures obtained using the Griffiths’ method.
The estimated mean comfort operative temperature (Tcop) was compared with the mean temperature when TSV was “0—neutral” and OC was “5—comfortable” or “6—very comfortable”, as shown in Table 11. The values of Tcop determined by using the Griffiths’ method are comparable to the mean Top values obtained earlier for both cases as shown in Table 7. In this study, the estimated comfort temperature was within the range recommended by the Malaysian government, which is 24–26 °C [13].
Table 11.
Mean and standard deviation of Tcop for given votes.
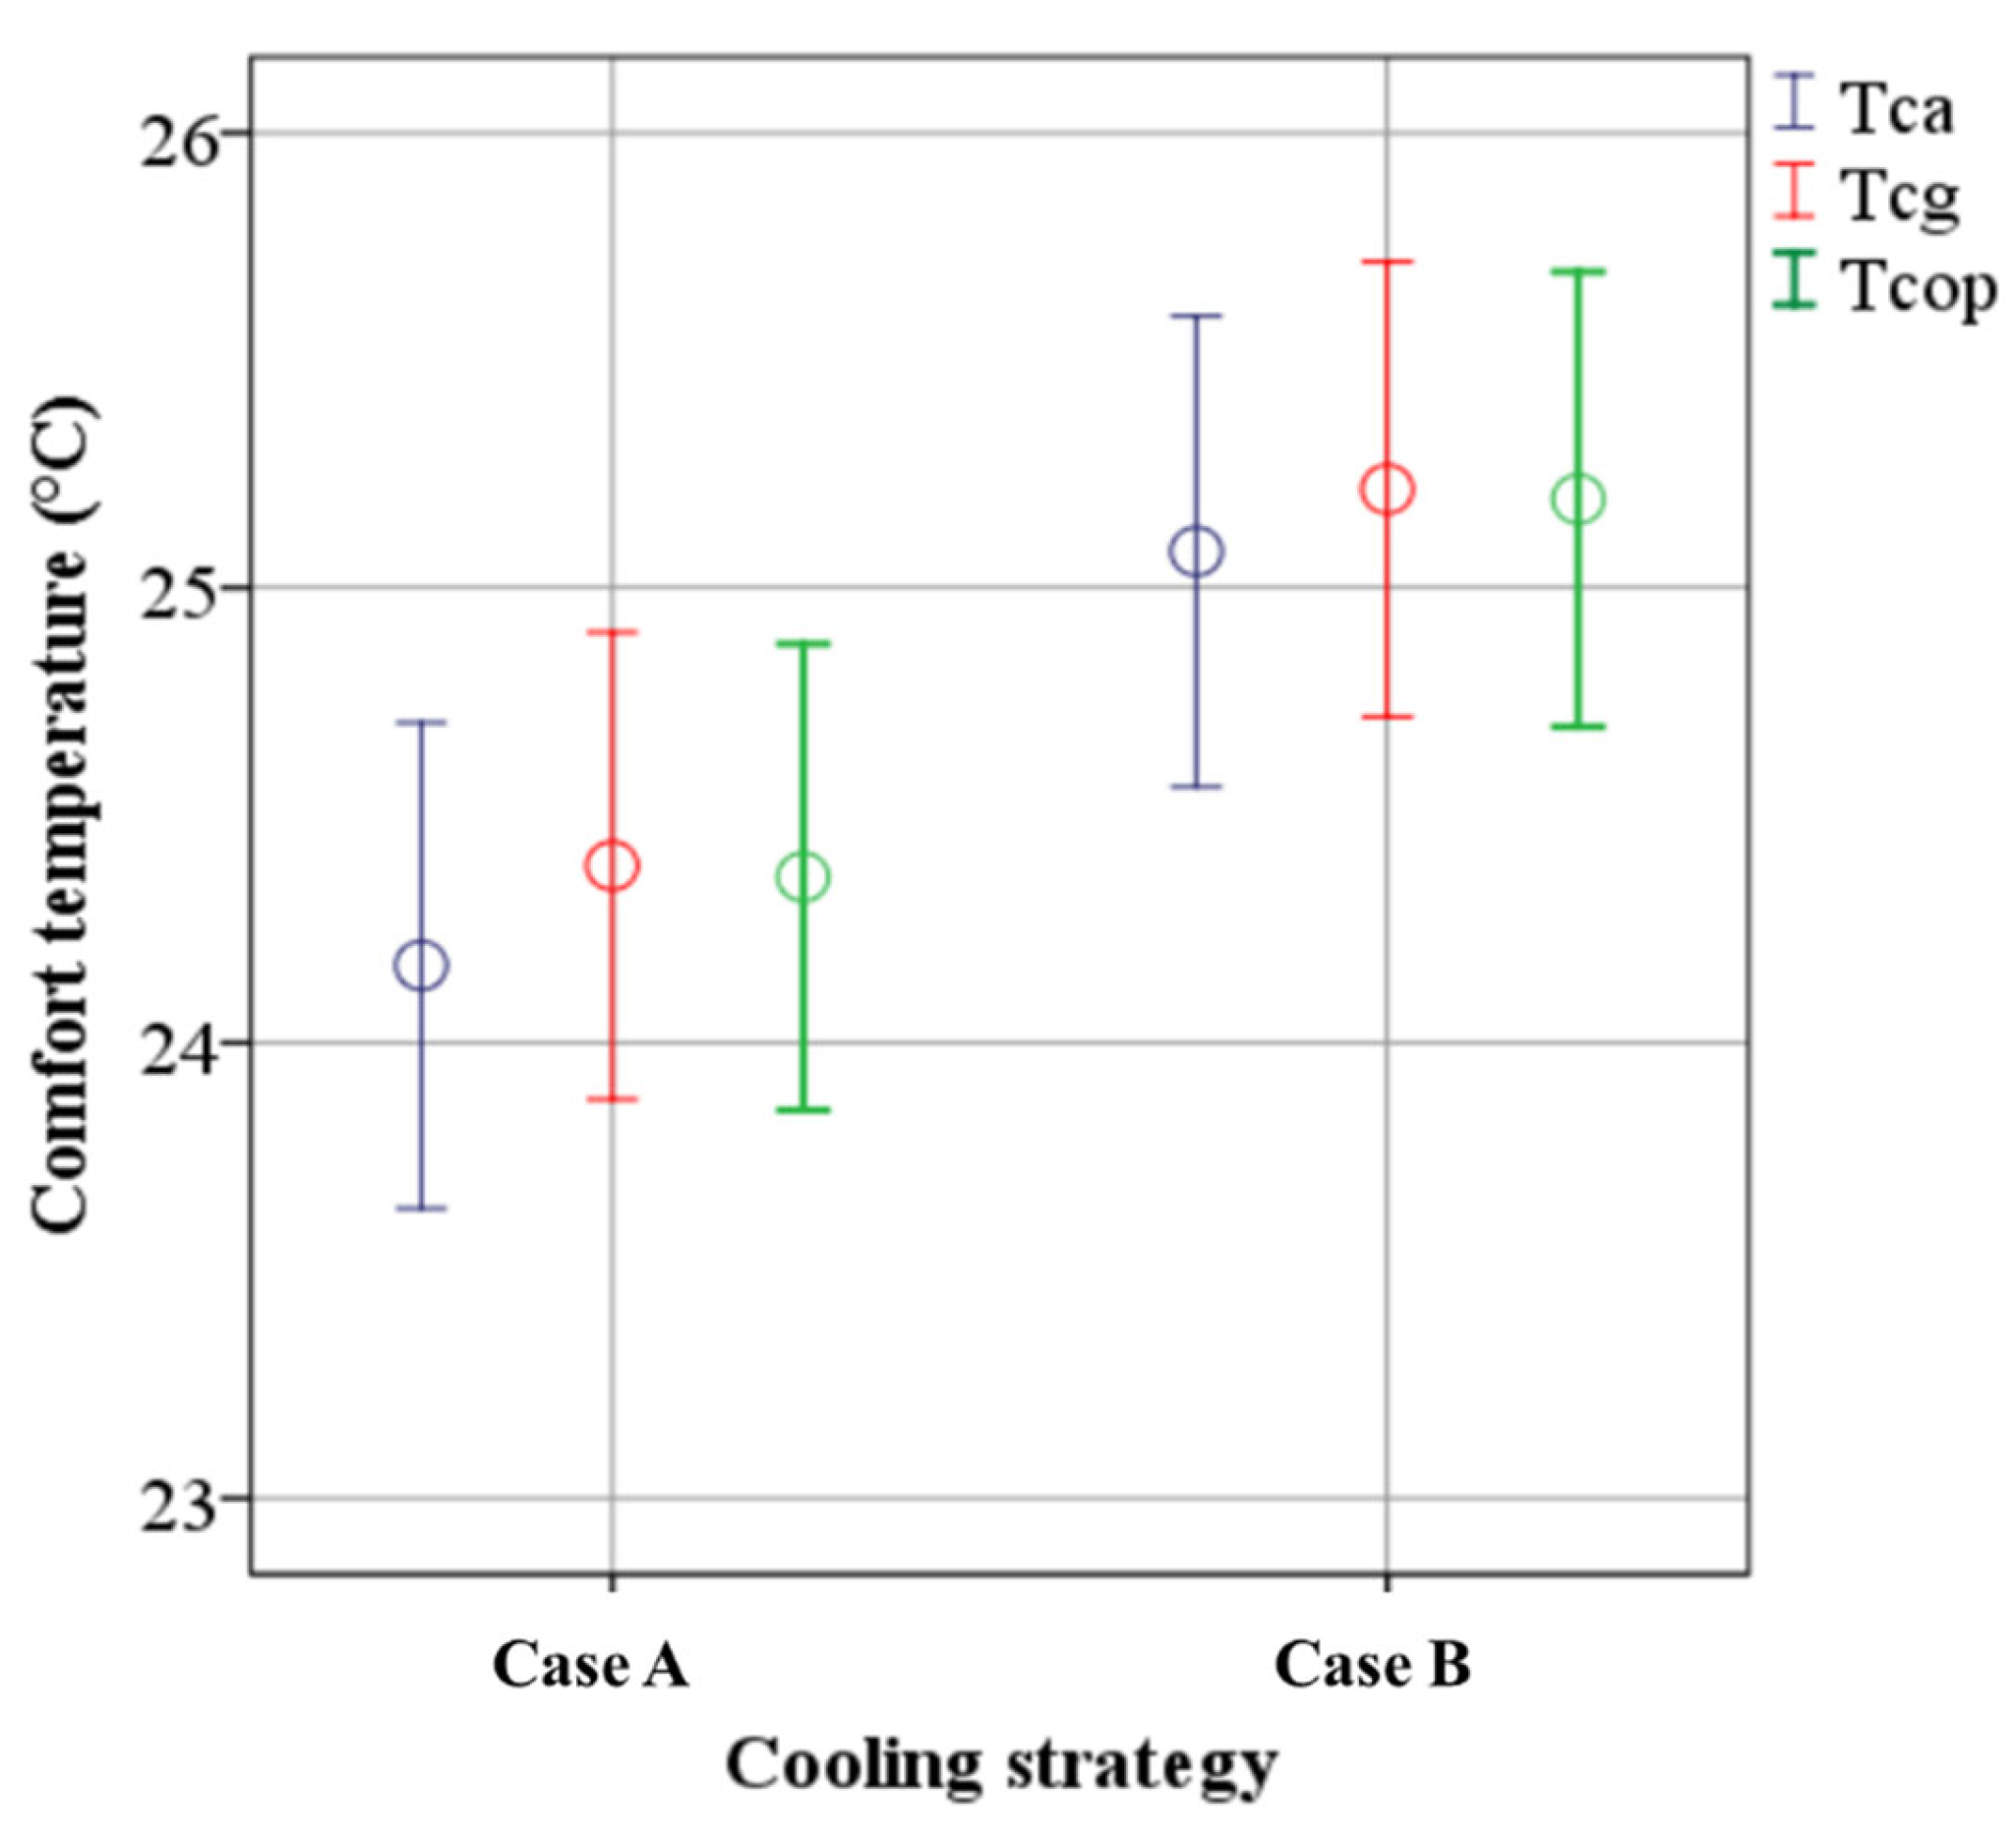
Figure 12 shows the estimated mean comfort ranges of the three thermal indices, Tca, Tcg, and Tcop, along with the error bars for each case. The error bars represent the mean ± 2 standard error. The estimated values of Tca, Tcg, and Tcop obtained by the Griffiths’ method are about 1 °C higher for Case B than for Case A. The cool bed linen used in Case B could have influenced the respondents in adapting to the indoor thermal conditions even though the AC temperature was set 3 °C higher than in Case A. Furthermore, the obtained values of Tca, Tcg, and Tcop imply that the comfort level was almost similar in both conditions.
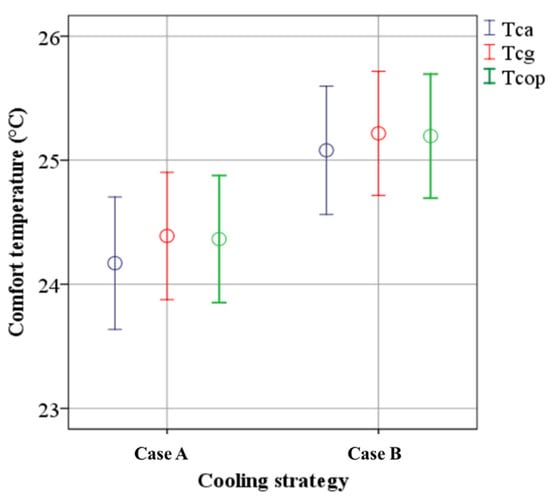
Figure 12.
Mean comfort temperatures and 95% confidence intervals (mean ± 2 S.E.) for both cases based on the Griffiths’ method.
3.5. Clothing and Bedding Insulation
The insulation provided by clothing helps reduce body heat loss and assists the body in maintaining a proper heat balance in hot conditions. Clothing can be classified according to its insulation value, which affects thermal sensation while sleeping. Figure 13 shows the values of mean and standard deviation of the clothing, bedding, and total insulation for both genders and both cases. The mean bedding insulation of the female respondents is 1.9 CLO for Case A and 1.8 for Case B, which is higher than the male respondents. The standard deviation for bedding insulation of the female respondents is 0.3 CLO for Case A and 0.4 CLO for Case B while for the male respondents, the standard deviation is 0.5 CLO for both cases. Consequently, the total insulation value is higher for the female respondents than for the male respondents, since the mean clothing insulation values are similar for both genders. The mean total insulation values of the male and female respondents were found to be significantly different between the two cases (Case A: t = 2.38, N = 30, p = 0.021; Case B: t = 3.06, N = 30, p = 0.003); this could be because the female respondents are more sensitive to indoor thermal conditions than the male respondents. This finding is in agreement with that of Pan et al. [66], who observed that the mean skin temperature of the female respondents could change more rapidly than that of the male respondents, indicating that the former is more sensitive to the ambient temperature than the latter. Thus, a higher ambient temperature is needed for the female respondents so as to balance heat transfer. In addition, the total insulation values for the male and female respondents were lower in Case B than in Case A. The respondents might feel more comfortable with the thermal conditions of the rooms and altered the percentages of their bodies covered by the bedding in response to the current room temperature although the AC temperature was set according to their preferences (in Case A) without accounting for the suitability of the setting for thermal comfort throughout the night.
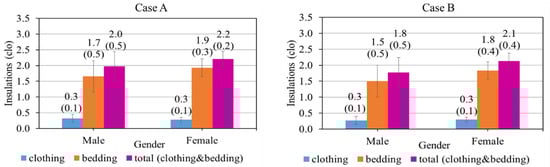
Figure 13.
Mean and standard deviation of the insulation values for the male and female respondents in each case.
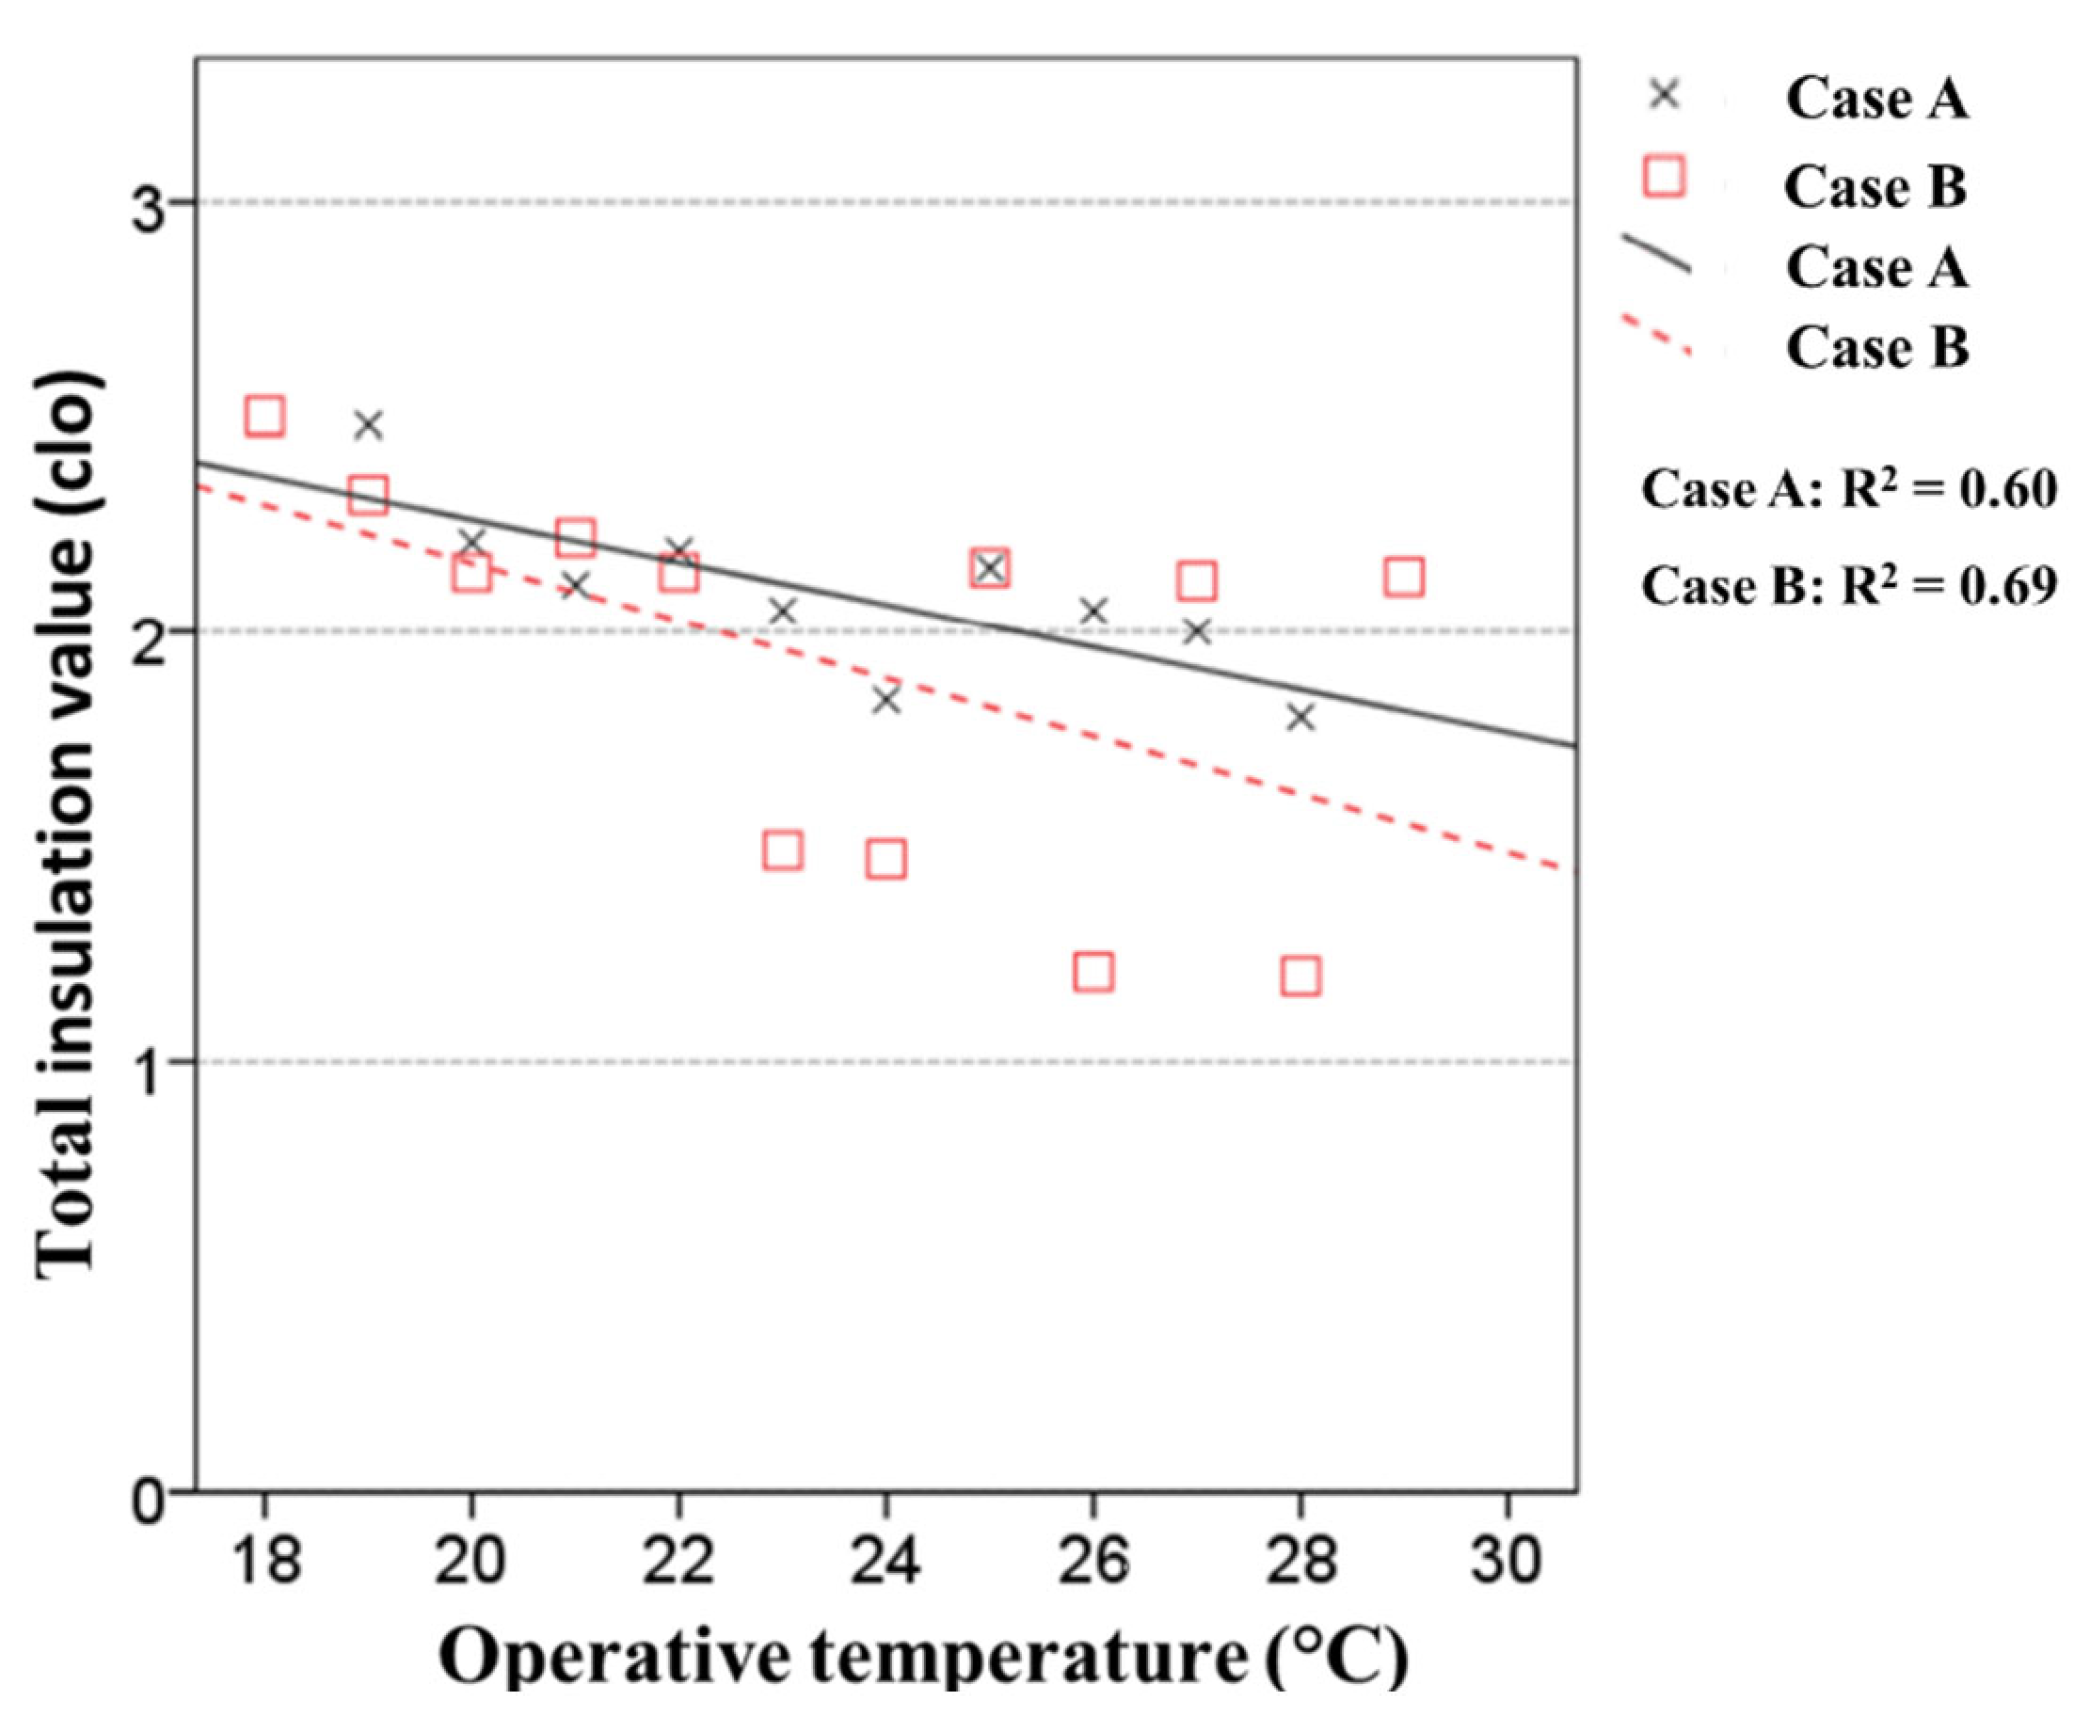
One of the factors that influenced the clothing insulation during sleeping was the indoor thermal environment. The mean total insulation values of the respondents for each day and Top are shown in Figure 14; the figure shows that the total insulation value decreases with increasing Top. Based on this result, it was determined that the weighted least squares regression for both cases was statistically significant.
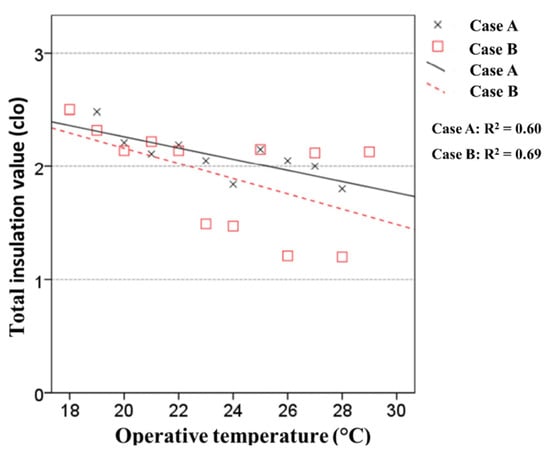
Figure 14.
Correlation between the total insulation value and Top (°C).
The weighted least squares regressions for Cases A and B, respectively, are as follows:
where is the total insulation value (clo), R2 is the coefficient of determination, N is the number of samples, S.E. is the standard error of the regression coefficient, and p is the significance level of the regression coefficient.
The respondents tended to wear less clothing to insulate their bodies during the sleeping period as they noticed that the indoor temperature was high. This behaviour agrees well with the clothing insulation value, which significantly influences the indoor temperature for sleeping [21]. People may try to attain comfort by wearing minimal clothes while sleeping. Clothing insulation is influenced by human sensitivity to indoor thermal conditions and thus can be predicted based on the indoor temperature [59]. However, besides clothing, it is necessary to consider the variation in the percentage of the body surface covered by bedding, such as a blanket, which could affect the sensitivity to indoor thermal conditions during the sleeping period.
3.6. Sleep Quality
This section describes the sleep quality of the respondents. To analyse sleep quality, the second and third nights of measurements were only considered, since the first night was intended for adjustment so that the respondents could adapt to the room conditions.
3.6.1. Sleep Quality Evaluations
Table 12 shows the distribution of sleep quality based on the questionnaire surveys for both cases. The mean values of the variables are quite similar. For both cases, the respondents generally voted “4—fairly calm” for sleep calmness and “4—fairly” for sleep satisfaction. The votes for sleep calmness were found to be statistically insignificant, which indicates that the votes are independent between both cases. Meanwhile, the respondents woke up once on average and tended to select “4—urgent urination” as the reason for waking up in both cases. However, it should be noted that our study involved only subjects who were in good health during the field measurements. In addition, Table 13 shows the percentages of votes of each value for each sleep quality parameter. Based on this table, the highest percentages of votes for the total number of times waking up during the night, which was “1—once”, are 32.5% and 42.5% for Cases A and B, respectively. Similarly, “6—other” received the highest percentages of votes as the reason for waking up in both cases. Based on the justifications of the respondents, their reasons for waking up included presence of mosquitos, sudden awakening from sleep, having nightmares, and performing night prayers for the Muslim respondents. The votes for the reason of waking up and the number of times of waking up at night were found to be statistically insignificant, which means that most subjects would probably be waking up at least once regardless of the environment.
Table 12.
Mean and standard deviation of each sleep quality parameter based on the questionnaire for both cases.
Table 13.
Percentages of votes of each value for each sleep quality parameter for both cases.
Thus, it is more accurate to validate the mean values of the sleep quality parameters using the percentages of votes for each sleep quality value since the considerations could be different. In addition, “2—feeling cold” was the second most common reason for waking up in Case A. This finding seems compatible with the results of a survey conducted in Hong Kong during summer; in the survey, up to 25% of the respondents reported waking up because of low indoor air temperature [15]. However, the cooling strategy adopted in Case B, namely the installation of cool bed linen and increasing the AC temperature setting by 3 °C can reduce the likelihood of waking up due to feeling cold.
Based on the sleep calmness and sleep satisfaction results obtained in this study, the respondents seemed calmer and more satisfied with their sleep in such indoor thermal conditions as opposed to the findings of Lan et al. [33] for which the intended temperature was 23 °C. For the sleep satisfaction results, no vote was obtained for “2—not much satisfaction” in Case B, whereas 3 votes of a total of 40 votes (7.5%) were obtained in Case A. It can be concluded that the respondents in this study were satisfied with their sleep in the given thermal environment and obtained enough sleep during the measurement period, although the votes were found to be statistically insignificant from the p-value.
3.6.2. Sleep Efficiency Index (SEI)
The mean values of the sleep quality variables for each case are shown in Table 13. The SEI (%) was calculated by using Equation (4) [35]:
where SPT is the total duration of sleep and WASO is total time awake, as recorded by the Garmin wristwatch. Meanwhile, the time in bed (TIB) refers to the duration from the primary sleep period during which each participant was trying to sleep in bed until he or she woke up, according to our manual record. The mean TIB was 6 h 57 min for Case A and 6 h 29 min for Case B. The TIB was found to be statistically significant, as presented in Table 14, indicating that the added cool bed linen affected the duration of the primary sleep. Meanwhile, the mean SPT values with Cases A and B were 6 h 35 min and 6 h 7 min, respectively. Table 14 also shows that the SPT was found to be statistically significant, reflecting that the addition of cool bed linen affected the duration of sleep. These results reflect the respondent’s sleep duration of Cases A and B when referring to TIB and SPT, while the WASO values of the respondents decrease with Case B. The WASO was found to be statistically significant, as presented in Table 14.
SEI = (SPT − WASO)/SPT
Table 14.
Mean and standard deviation of each sleep variable for both cases.
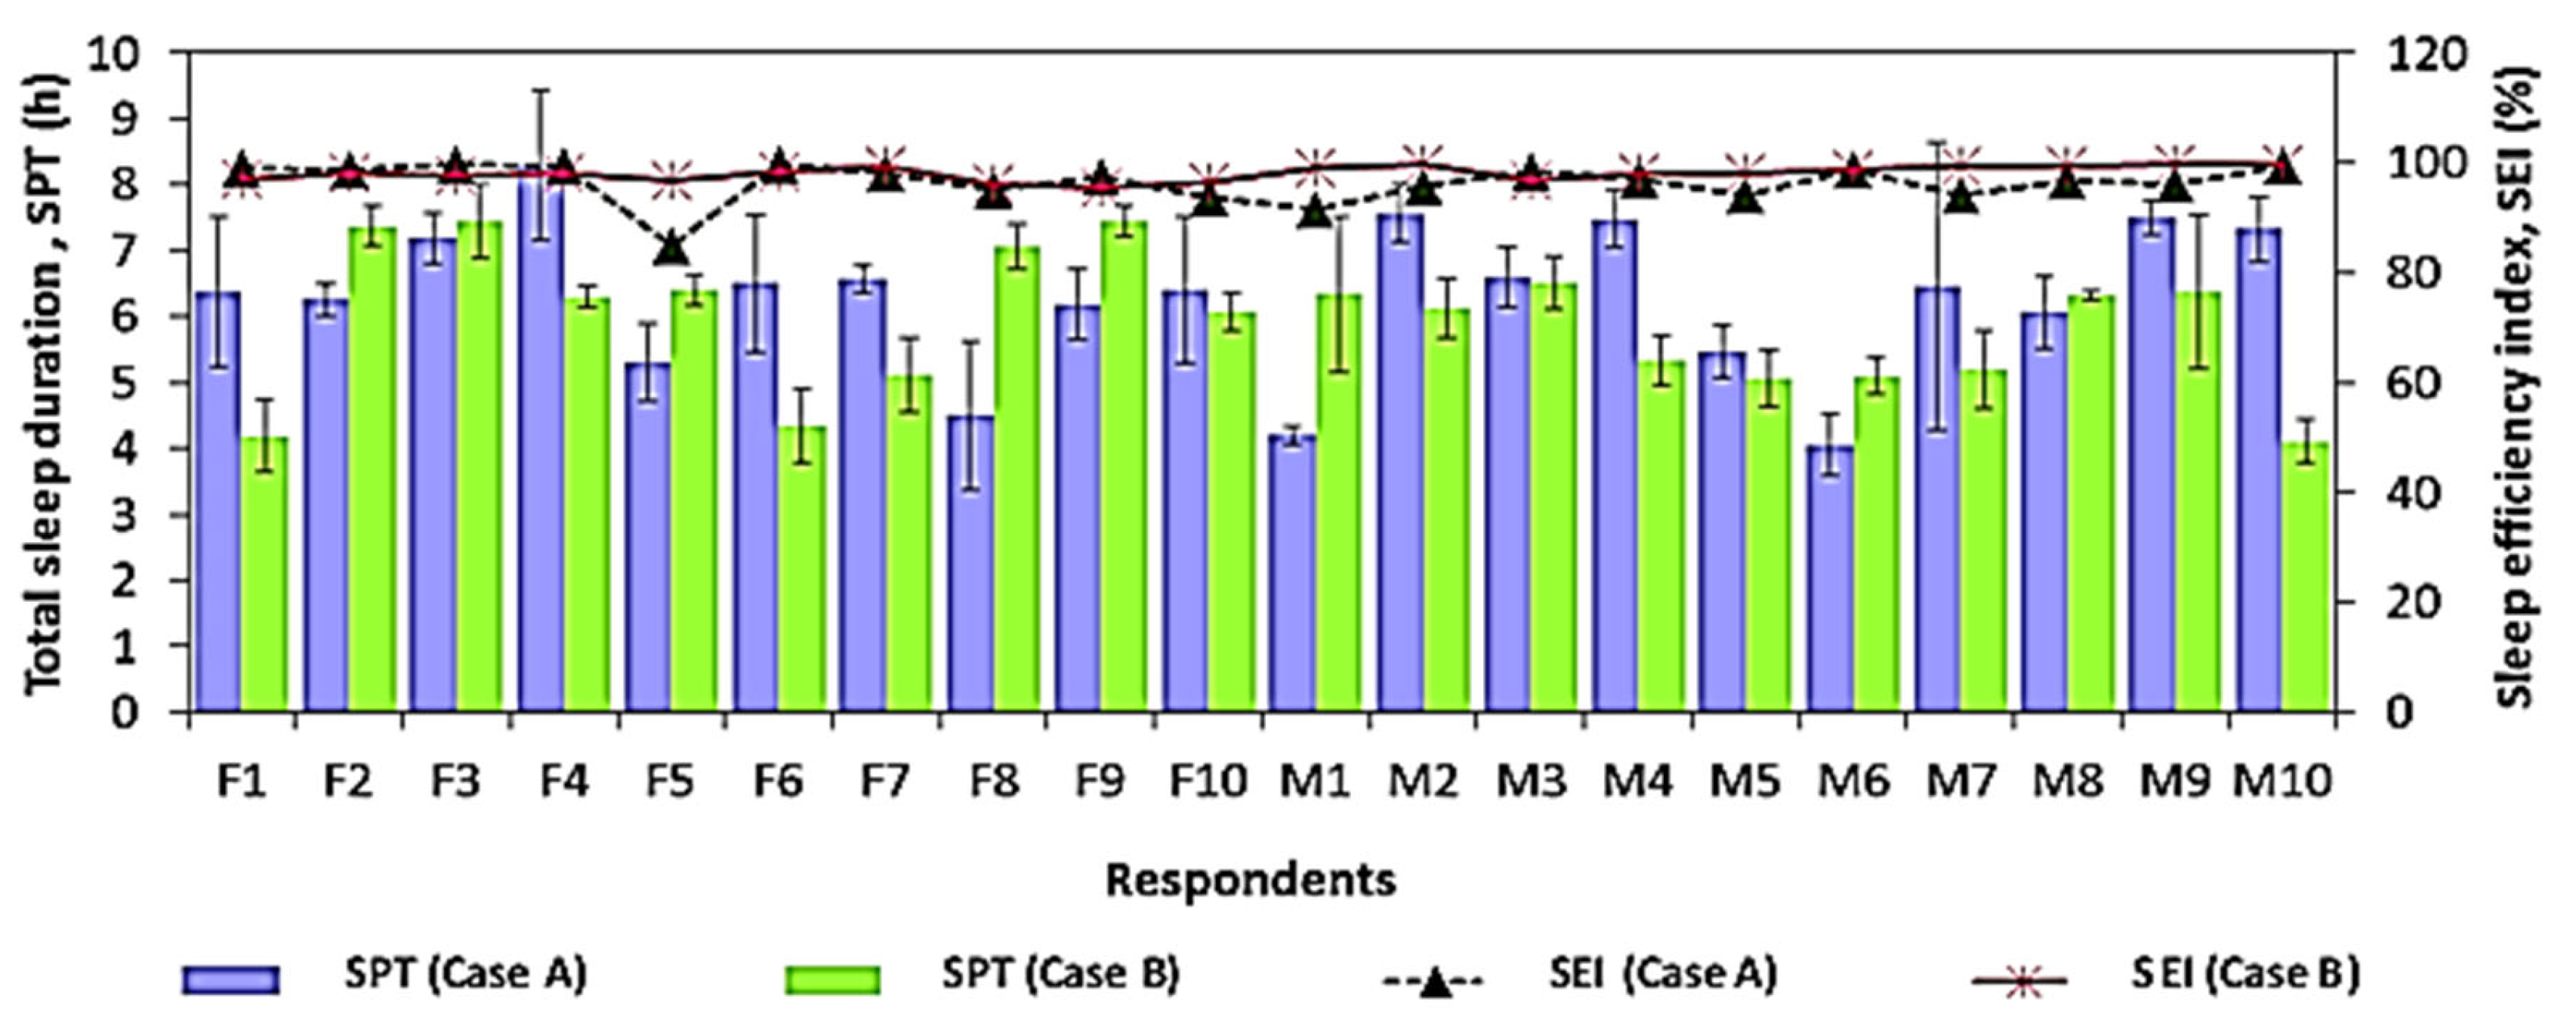
Figure 15 illustrates the mean values of SPT and SEI with both cases for the individual respondents. The mean SEI is higher with Case B than with Case A. Thus, the values of the sleep variables improved with the use of cool bed linen in Case B even though the AC temperature setting was increased by 3 °C from that in Case A which was without the cool bed linen. A sample t-test was conducted to compare the SEI between the two cases (Table 13), and it was found that the two strategies were statistically significant. Specifically, the mean for SEI of Case B was 2% higher than that of Case A. This could imply that the sleep quality in both cases is comparable with slightly better sleep quality in Case B. Thus, the higher temperature settings in Case B with the added cool bed linen maintained the sleep quality of the respondents compared to Case A.

Figure 15.
Mean values of SPT and SEI of both cases for each respondent.
3.7. Study Limitations
The limitations of this study should be noted. To begin, the study was conducted in guest rooms and not the respondents’ own rooms. While one adjustment night was already considered for the study, some people might still need more nights to adjust to the new sleeping environment. Furthermore, the respondents might be subjected to sequence effects since the study was conducted for three consecutive nights for each case; this was not considered in the present study. In addition, while the study focused on the setpoint temperature as the reference temperature, the reading and the results of the study were based on the observed indoor air temperature, which might be different from the setpoint temperature. Thus, in some cases where the outdoor temperature was lower than the setpoint temperature, the AC compressor would have difficulty in achieving the setpoint temperature. This is because the AC units in both rooms were not equipped with heating elements. Moreover, since the measurement took place in two rooms with the total number of 20 respondents each at different times, the outdoor condition tended to vary between each set of data. In addition, as the study was fully conducted in the field, the study does not consider the simulation of the indoor environmental condition as a method in predicting comfort. Moreover, this study did not specify balancing between thermal resistance and heat storage as it was not the main objective of the study; such parameters will be considered in future studies.
Since the study was performed in Kuala Lumpur, Malaysia, where the climate is hot and humid, the behavioural regulation mode may only be suitable in areas with the similar climate. This study also did not focus on the thermal insulation value as the output. However, the insulation values estimated in the study were used as reference in the results of the corresponding thermal comfort and sleep quality, as shown in Figure 13 and Figure 14. The estimation of the total thermal insulation value was based on ASHRAE Standard 55 Handbook [43] and this could be different from the actual insulation value experienced by the respondents.
4. Conclusions
In this study, the possibility of preventing excessive AC use during sleeping hours was examined for 20 respondents under two conditions, namely Case A (freely adjusted setpoint temperature) and Case B (a setpoint temperature of 3 °C higher than that of Case A with cool bed linen). The conclusions of the field study can be summarised as follows:
- The average of observed indoor temperature during the sleep period in Case B was about 2 °C higher than that in Case A. On the other hand, the subjective evaluations by respondents showed that 94.9% of the respondents provided votes within the comfortable range in Case B, while 81.6% did so in Case A, indicating that they were satisfied with the thermal conditions in the rooms.
- By installing the cool bed linen and setting the AC temperature at 3 °C higher, the electricity consumption of the air conditioning unit was reduced, leading to energy savings of up to 39%. The cool bed linen usage compensates the higher setpoint temperature while maintaining the similar comfort level as in Case A (the original setpoint temperature).
- The estimated comfort temperature in Case B was about 1 °C higher than in Case A. This result implies that in both cases, the comfort level was maintained, demonstrating that the cool bed linen installed in Case B compensated the increase in the setpoint temperature from that of Case A.
- Based on the clothing insulation during sleeping hours, the respondents could tolerate the indoor thermal conditions in Case B. Thus, the use of the cool bed linen in Case B provided comfortable sleeping conditions to the respondents.
- From the sleep quality survey, most of the respondents experienced calmness while sleeping and were satisfied with their sleep; this was evidenced by the collected data of sleep calmness ratings of “4—fairly calm” and “5—very calm” and sleep satisfaction ratings of “4—fairly” and “5—fully”, both of which received the highest percentages of votes for Cases A and B. Furthermore, the respondents were found to wake up at least once at night regardless of the sleep conditions. In fact, the respondents’ reasons for waking up were unrelated to the ambient temperature. In addition, the Sleep Efficiency Index of each respondent was higher for Case B than that for Case A. This result indicates that the settings of Case B led to a slightly better sleep quality of the respondents. Thus, the higher temperature settings in Case B with the added cool bed linen maintained the sleep quality of the respondents relative to Case A.
In summary, the use of the cool bed linen with the increased AC setpoint temperature by 3 °C maintained the sleep quality of the respondents, and they were satisfied with the thermal conditions in the rooms. This cooling strategy also produced significant energy savings by reducing the dependency on AC usage. This strategy can be easily applied in residential settings since it does not require any additional technology to be implemented. More field studies should be conducted, especially in regions of tropical climate, because the number of available studies on thermal comfort in sleeping environments is limited. The present study only considered 20 respondents; therefore, it is recommended that future studies increase the number and diversity of respondents and that the studies be conducted in respondents’ dwellings so that the results will capture the thermal comfort requirements for a wider variety of respondents and thermal adaptations.
Author Contributions
Conceptualisation, S.A.Z.; methodology, S.A.Z. and F.N.H.S.; validation, S.A.Z., M.F.R. and F.N.H.S.; formal analysis, S.A.Z., M.F.R. and F.N.H.S.; investigation, S.A.Z., M.F.R. and F.N.H.S.; resources, S.A.Z.; data curation, S.A.Z., M.F.R. and F.N.H.S.; writing—original draft preparation, F.N.H.S.; writing—review and editing, S.A.Z., M.F.R. H.B.R., A.H. and F.Y.; visualisation, S.A.Z., M.F.R. and F.N.H.S.; supervision, S.A.Z.; project administration, S.A.Z.; funding acquisition, S.A.Z. All authors have read and agreed to the published version of the manuscript.
Funding
This research was supported by the Takasago Thermal Engineering Co. Ltd. research grant (Vot number 4B364) and the Industry-International Incentive Grant (Vot number 01M46) from Universiti Teknologi Malaysia.
Data Availability Statement
The data presented in this study are available on request from the corresponding author.
Conflicts of Interest
The authors declare no conflict of interest. The funders had no role in the design of the study; in the collection, analyses, or interpretation of data; in the writing of the manuscript, or in the decision to publish the results.
References
- Samson, D.R.; Crittenden, A.N.; Mabulla, I.A.; Mabulla, A.Z. The evolution of human sleep: Technological and cultural innovation associated with sleep-wake regulation among Hadza hunter-gatherers. J. Hum. Evolution. 2017, 113, 91–102. [Google Scholar] [CrossRef]
- Nik Hassin, N.S.F.; Misni, A. Assessing the Thermal Performance of Negeri Sembilan Traditional Malay House towards Sustainable Practice. Environ. Behav. Proc. J. 2019, 4, 289–295. [Google Scholar] [CrossRef]
- Department of Statistics. Report on Characteristics of Household 2010; Department of Statistics: Kuala Lumpur, Malaysia, 2014.
- Kubota, T.; Chyee, D.T.H.; Ahmad, S. The effects of night ventilation technique on indoor thermal environment for residential buildings in hot-humid climate of Malaysia. Energy Build. 2009, 41, 829–839. [Google Scholar] [CrossRef]
- Zaki, S.A.; Hagishima, A.; Fukami, R.; Fadhilah, N. Development of a model for generating air-conditioner operation schedules in Malaysia. Build. Environ. 2017, 122, 354–362. [Google Scholar] [CrossRef]
- Ranjbar, N.; Zaki, S.A.; Yusoff, N.M.; Yakub, F.; Hagishima, A. Short-term measurements of household electricity demand during hot weather in Kuala Lumpur. Int. J. Elect. Comput. Eng. 2017, 7, 1436–1443. [Google Scholar] [CrossRef]
- Mekhilef, S.; Saidur, R.; Said, S.M.; Hong, P.H.; Islam, M.R. Techno-economic evaluation of energy efficiency measures in high rise residential buildings in Malaysia. Clean Tech. Environ. Pol. 2014, 16, 23–35. [Google Scholar] [CrossRef]
- Kubota, T.; Jeong, S.; Toe, D.H.C.; Ossen, D.R. Energy consumption and air-conditioning usage in residential buildings of Malaysia. J. Int. Dev. Coop. 2011, 17, 61–69. [Google Scholar]
- Ono, T.; Hagishima, A.; Tanimoto, J.; Sheikh, A.Z.; Naja, A.H. Statistical analysis of air conditioning peak loads of multiple dwellings. In E3S Web of Conferences; EDP Sciences: Ulis, France, 2019; Volume 111. [Google Scholar]
- Lan, L.; Tsuzuki, K.; Liu, Y.F.; Lian, Z.W. Thermal environment and sleep quality: A review. Energy Build. 2017, 149, 101–113. [Google Scholar] [CrossRef]
- Sekhar, S.C. Thermal comfort in air-conditioned buildings in hot and humid climates–why are we not getting it right? Indoor Air 2016, 26, 138–152. [Google Scholar] [CrossRef]
- Ekasiwi, S.N.N.; Majid, N.H.A.; Hokoi, S.; Oka, D.; Takagi, N.; Uno, T. Field survey of air conditioner temperature settings in hot, humid climates, part 1: Questionnaire results on use of air conditioners in houses during sleep. J. Asian Archit. Build. Eng. 2013, 12, 141–148. [Google Scholar] [CrossRef] [Green Version]
- Department of Standard Malaysia. Energy Efficiency and Use of Renewable Energy for Residential Buildings—Code of Practice; MS2680: 2017; Malaysia Standard: Cyberjaya, Malaysia, 2017.
- Muro, K. Questionnaire Surveys on Heating/Cooling Equipment Use And Clothing Worn Within Homes. Tech. Rep. Archit. Inst. Jpn. 2018, 24, 253–258. [Google Scholar] [CrossRef]
- Lin, Z.; Deng, S. Aquestionnaire survey on sleeping thermal environment and bedroom air conditioning in high-rise residences in Hong Kong. Energy Build. 2006, 38, 1302–1307. [Google Scholar] [CrossRef]
- Haskell, E.H.; Palca, J.W.; Walker, J.M.; Berger, R.J.; Heller, H.C. The effects of high and low ambient temperatures on human sleep stages. Electroencephalogr. Clin. Neurophysiol. 1981, 51, 494–501. [Google Scholar] [CrossRef]
- Candas, V.; Libert, J.P.; Muzet, A. Heating and cooling stimulations during SWS and REM sleep in man. J. Therm. Biology. 1982, 7, 155–158. [Google Scholar] [CrossRef]
- Palca, J.W.; Walker, J.M.; Berger, R.J. Thermoregulation, metabolism, and stages of sleep in cold-exposed men. J. Appl. Physiol. 1986, 61, 940–947. [Google Scholar] [CrossRef] [PubMed]
- Sagot, J.C.; Amoros, C.; Candas, V.; Libert, J.P. Sweating responses and body temperatures during nocturnal sleep in humans. Am. J. Physiol.-Regul. Integr. Comp. Physiol. 1987, 252, R462–R470. [Google Scholar] [CrossRef] [PubMed]
- Lin, Z.; Deng, S. A study on the thermal comfort in sleeping environments in the subtropics-Measuring the total insulation values for the bedding systems commonly used in the subtropics. Build. Environ. 2008, 43, 905–916. [Google Scholar] [CrossRef]
- Lin, Z.; Deng, S. A study on the thermal comfort in sleeping environments in the subtropics-developing a thermal comfort model for sleeping environments. Build. Environ. 2008, 43, 70–81. [Google Scholar] [CrossRef]
- Jaafar, M.F.Z.B.; Croxford, B. Adapting to technology: The case of air conditioning use in Malaysian homes. In Proceedings of the Conference: Adapting to Change: New Thinking on Comfort, WINDSOR 2010. Network for Comfort and Energy Use in Buildings, Windsor, UK, 9–11 April 2010. [Google Scholar]
- Jaafar, M.F.Z.B. Domestic Air Conditioning in Malaysia: Night Time Thermal Comfort and Occupants Adaptive Behaviour. Doctoral Dissertation, University of London, London, UK, 2008. [Google Scholar]
- Shin, M.; Halaki, M.; Swan, P.; Ireland, A.H.; Chow, C.M. The effects of fabric for sleepwear and bedding on sleep at ambient temperatures of 17 c and 22 c. Nat. Sci. Sleep 2016, 8, 121. [Google Scholar] [CrossRef] [PubMed] [Green Version]
- Okamoto-Mizuno, K.; Mizuno, K.; Matsuura, N.; Matsuo, A.; Iwata, A.; Jojima, E.; Shirakawa, S. Effects of Bed Pad and Bed Sheet on Sleep Onset Period During Napping Under Mild Humid Heat Exposure. J. Jpn. Res. Assoc. Text. End-Uses 2013, 54, 218–225. [Google Scholar] [CrossRef]
- ASHRAE. ANSI/ASHRAE Standard 55-2017: Thermal Environmental Conditions for Human Occupancy, American Society of Heating; Refrigerating and Air-Conditioning Engineers, Inc.: Atlanta, GA, USA, 2017. [Google Scholar]
- Zhang, N.; Cao, B.; Zhu, Y. Indoor environment and sleep quality: A research based on online survey and field study. Build. Environ. 2018, 137, 198–207. [Google Scholar] [CrossRef]
- Imagawa, H.; Rijal, H.B. Field survey of the thermal comfort, quality of sleep and typical occupant behaviour in the bedrooms of Japanese houses during the hot and humid season. Archit. Sci. Rev. 2014, 58, 11–23. [Google Scholar] [CrossRef]
- Kim, D.G.; Kum, J.S. Evaluation of thermal comfort during sleeping in summer-part I: On results of questionnaire before and after sleep. Korean J. Air-Cond. Refrig. Eng. 2005, 17, 404–409. [Google Scholar]
- Liu, Y.; Song, C.; Wang, Y.; Wang, D.; Liu, J. Experimental study and evaluation of the thermal environment for sleeping. Build. Environ. 2014, 82, 546–555. [Google Scholar] [CrossRef]
- Wang, Y.; Liu, Y.; Song, C.; Liu, J. Appropriate indoor operative temperature and bedding micro climate temperature that satisfies the requirements of sleep thermal comfort. Build. Environ. 2015, 92, 20–29. [Google Scholar] [CrossRef]
- Lan, L.; Lian, Z. Ten questions concerning thermal environment and sleep quality. Build. Environ. 2016, 99, 252–259. [Google Scholar] [CrossRef]
- Lan, L.; Pan, L.; Lian, Z.; Huang, H.; Lin, Y. Experimental study on thermal comfort of sleeping people at different air temperatures. Build. Environ. 2014, 73, 24–31. [Google Scholar] [CrossRef]
- Pan, L.; Lian, Z.; Lan, L. Investigation of sleep quality under different temperatures based on subjective and physiological measurements. HVACR Res. 2012, 18, 1030–1043. [Google Scholar]
- Tsuzuki, K.; Mori, I. Indoor thermal environment of bedroom during sleep in Malaysia. AIP Conf. Proc. 2017, 1892, 160004. [Google Scholar]
- Brooke, S.M.; An, H.S.; Kang, S.K.; Noble, J.M.; Berg, K.E.; Lee, J.M. Concurrent validity of wearable activity trackers under free-living conditions. J. Strength Cond. Res. 2017, 31, 1097–1106. [Google Scholar] [CrossRef]
- Lee, J.M.; Byun, W.; Keill, A.; Dinkel, D.; Seo, Y. Comparison of wearable trackers’ ability to estimate sleep. Int. J. Environ. Res. Public Health. 2018, 15, 1265. [Google Scholar] [CrossRef] [PubMed] [Green Version]
- Spielmanns, M.; Bost, D.; Windisch, W.; Alter, P.; Greulich, T.; Nell, C.; Storre, J.H.; Koczulla, A.R.; Boeselt, T. Measuring sleep quality and efficiency with an activity monitoring device in comparison to polysomnography. J. Clin. Med. Res. 2019, 11, 825. [Google Scholar] [CrossRef] [Green Version]
- Crawshaw, L.I.; Nadel, E.R.; Stolwijk, J.A.J.; Stamford, B.A. Effect of local cooling on sweating rate and cold sensation. Pflügers Archiv. 1975, 354, 19–27. [Google Scholar] [CrossRef]
- Tsuzuki, K.; Okamoto-Mizuno, K.; Mizuno, K.; Iwaki, T. Effects of airflow on body temperatures and sleep stages in a warm humid climate. Int. J. Biometeorol. 2008, 52, 261–270. [Google Scholar] [CrossRef] [PubMed]
- Lan, L.; Lian, Z.W.; Qian, X.L.; Dai, C.Z. The effects of programmed air temperature changes on sleep quality and energy saving in bedroom. Energy Build. 2016, 129, 207–214. [Google Scholar] [CrossRef]
- Tsuzuki, K.; Mochizuki, Y.; Maeda, K.; Nabeshima, Y.; Ohata, T.; Draganova, V. The effect of a cold environment on sleep and thermoregulation with insufficient bedding assuming an emergency evacuation. Energy Build. 2020, 207, 109562. [Google Scholar] [CrossRef]
- American Society of Heating, Refrigerating and Air-Conditioning Engineers. ASHRAE Handbook: Fundamentals, SI; ASHRAE, Inc.: Atlanta, GA, USA, 2005. [Google Scholar]
- Swarno, H.A.; Zaki, S.A.; Yusup, Y.; Ali, M.S.M.; Ahmad, N.H. Observation of diurnal variation of urban microclimate in Kuala Lumpur, Malaysia. Chem. Eng. Trans. 2017, 56, 523–528. [Google Scholar]
- Swarno, H.A.; Zaki, S.A.; Hagishima, A.; Yusup, Y. Characteristics of wind speed during rainfall event in the tropical urban city. Urban Clim. 2020, 32, 100620. [Google Scholar] [CrossRef]
- Damiati, S.A.; Zaki, S.A.; Rijal, H.B.; Wonorahardjo, S. Field study on adaptive thermal comfort in office buildings in Malaysia, Indonesia, Singapore, and Japan during hot and humid season. Build. Environ. 2016, 109, 208–223. [Google Scholar] [CrossRef]
- Zaki, S.A.; Damiati, S.A.; Rijal, H.B.; Hagishima, A.; Razak, A.A. Adaptive thermal comfort in university classrooms in Malaysia and Japan. Build. Environ. 2017, 122, 294–306. [Google Scholar] [CrossRef]
- Mustapa, M.S.; Zaki, S.A.; Rijal, H.B.; Hagishima, A.; Ali, M.S.M. Thermal comfort and occupant adaptive behaviour in Japanese university buildings with free running and cooling mode offices during summer. Build. Environ. 2016, 105, 332–342. [Google Scholar] [CrossRef]
- Khalid, W.; Zaki, S.A.; Rijal, H.B.; Yakub, F. Investigation of comfort temperature and thermal adaptation for patients and visitors in Malaysian hospitals. Energy Build. 2019, 183, 484–499. [Google Scholar] [CrossRef]
- Åkerstedt, T.; Hume, K.E.N.; Minors, D.; Waterhouse, J.I.M. Good sleep—Its timing and physiological sleep characteristics. J. Sleep Res. 1997, 6, 221–229. [Google Scholar] [CrossRef]
- Morito, N.; Tsuzuki, K.; Mori, I.; Nishimiya, H. Effects of two kinds of air conditioner airflow on human sleep and thermoregulation. Energy Build. 2017, 138, 490–498. [Google Scholar] [CrossRef]
- McCullough, E.A.; Zbikowski, P.J.; Jones, B.W. Measurement and prediction of the insulation provided by bedding system. ASHRAE Trans. 1987, 93, 1055–1068. [Google Scholar]
- The Cool Choice for Room AC. (n.d.). ENERGY STAR. Available online: https://www.energystar.gov/products/heating_cooling/air_conditioning_room (accessed on 25 March 2021).
- Tsang, T.W.; Mui, K.W.; Wong, L.T. Investigation of thermal comfort in sleeping environment and its association with sleep quality. Build. Environ. 2021, 187, 107406. [Google Scholar] [CrossRef]
- Rijal, H.B.; Humphreys, M.; Nicol, F. Adaptive thermal comfort in Japanese houses during the summer season: Behavioral adaptation and the effect of humidity. Buildings 2015, 5, 1037–1054. [Google Scholar] [CrossRef]
- Akiyama, Y.; Miyake, E.; Matsuzaki, R.; Ogata, M.; Tsuzuki, K.; Tanabe, S.I. Effect of thermal environment on sleep quality in actual bedroom in summer by sleep stages analysis. Jpn. Archit. Rev. 2021, 4, 211–221. [Google Scholar] [CrossRef]
- Lan, L.; Xia, L.; Tang, J.; Zhang, X.; Lin, Y.; Wang, Z. Elevated airflow can maintain sleep quality and thermal comfort of the elderly in a hot environment. Indoor Air 2019, 29, 1040–1049. [Google Scholar] [CrossRef]
- Shahzad, S.; Rijal, H.B. Preferred vs neutral temperatures and their implications on thermal comfort and energy use: Workplaces in Japan, Norway and the UK. Energy Procedia 2019, 158, 3113–3118. [Google Scholar] [CrossRef]
- Griffiths, I. Thermal Comfort in Buildings with Passive Solar Features: Field Studies. Report to the Commission of the European Communities; EN3S-090 UK; University of Surrey: Guildford, UK, 1990. [Google Scholar]
- Rijal, H.B.; Humphreys, M.A.; Nicol, J.F. Towards an adaptive model for thermal comfort in Japanese offices. Build. Res. Inf. 2017, 45, 717–729. [Google Scholar] [CrossRef]
- Humphreys, M.A.; Rijal, H.B.; Nicol, J.F. Updating the adaptive relation between climate and comfort indoors; new insights and an extended database. Build. Environ. 2013, 63, 40–55. [Google Scholar] [CrossRef]
- Nicol, F.; Humphreys, M. Derivation of the adaptive equations for thermal comfort in free-running buildings in European Standard EN15251. Build. Environ. 2010, 45, 11–17. [Google Scholar]
- Rijal, H.B. Investigation of comfort temperature and occupant behavior in Japanese houses during the hot and humid season. Buildings 2014, 4, 437–452. [Google Scholar] [CrossRef]
- Mui, K.W.H.; Chan, W.T.D. Adaptive comfort temperature model of air-conditioned building in Hong Kong. Build. Environ. 2013, 38, 837–852. [Google Scholar] [CrossRef]
- Nicol, F.; Roaf, S. Pioneering new indoor temperature standards: The Pakistan project. Energy Build. 1996, 23, 169–174. [Google Scholar] [CrossRef]
- Pan, L.; Lian, Z.; Lan, L. Investigation of gender differences in sleeping comfort at different environmental temperatures. Build. Environ. 2012, 21, 811–820. [Google Scholar] [CrossRef]


Publisher’s Note: MDPI stays neutral with regard to jurisdictional claims in published maps and institutional affiliations. |
© 2021 by the authors. Licensee MDPI, Basel, Switzerland. This article is an open access article distributed under the terms and conditions of the Creative Commons Attribution (CC BY) license (https://creativecommons.org/licenses/by/4.0/).