
Prediction of the Energy Self-Sufficiency Rate of Major New Renewable Energy Types Based on Zero-Energy Building Certification Cases in South Korea


Abstract
:1. Introduction
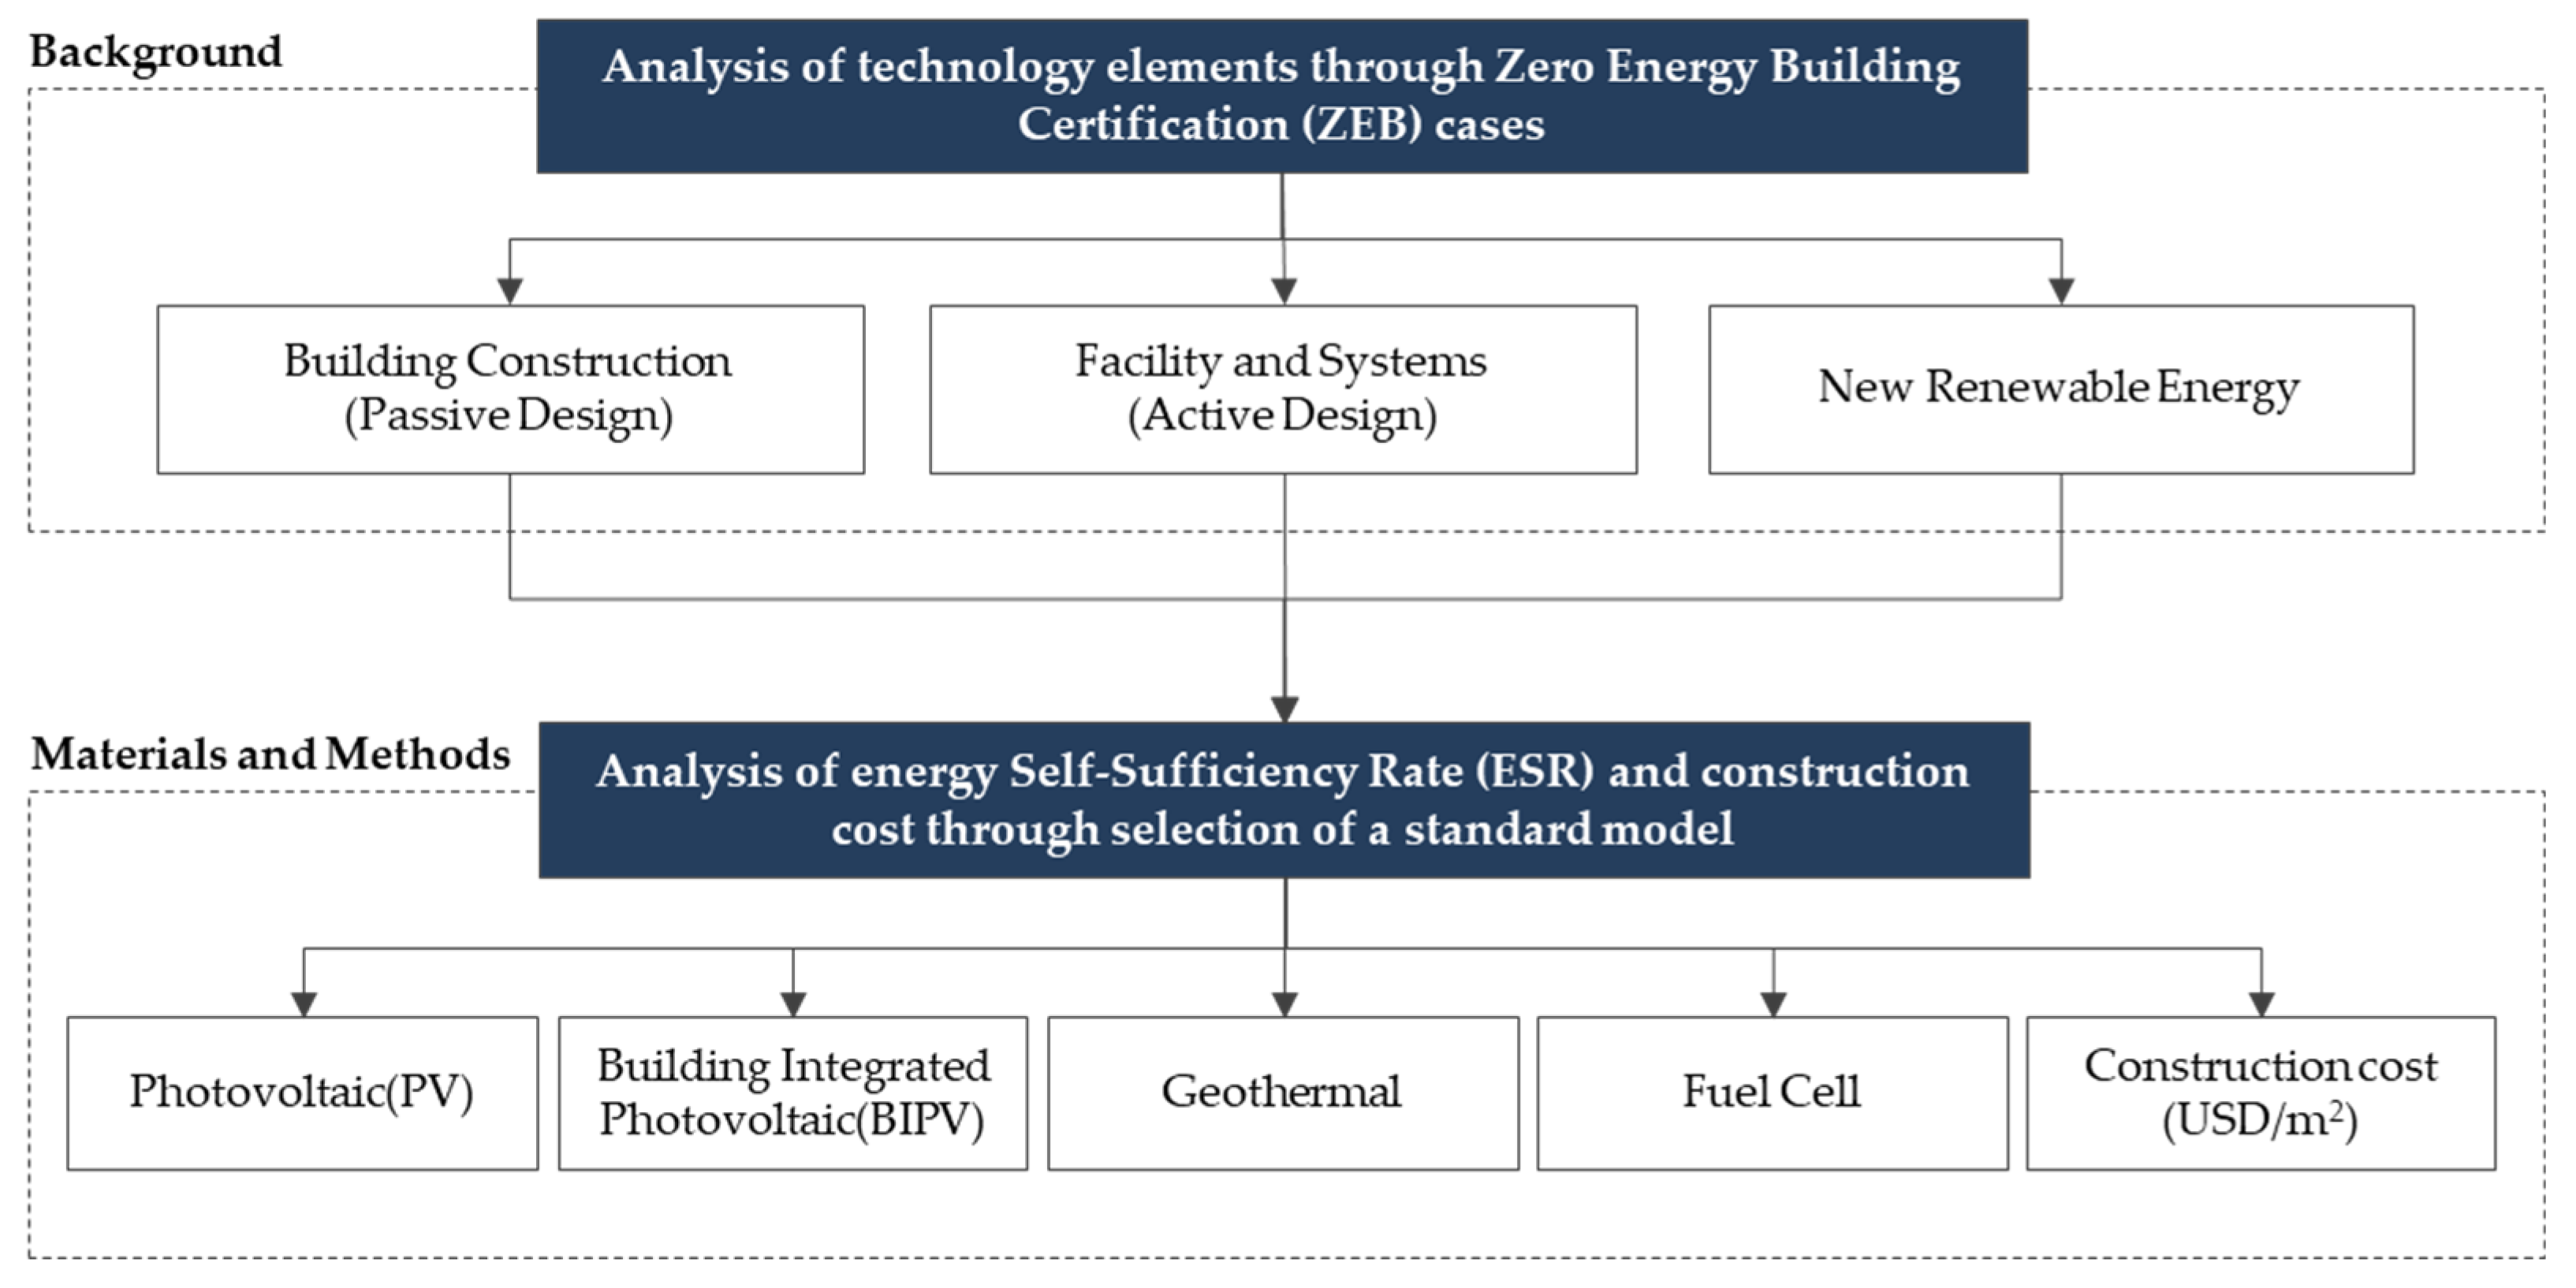
2. Background
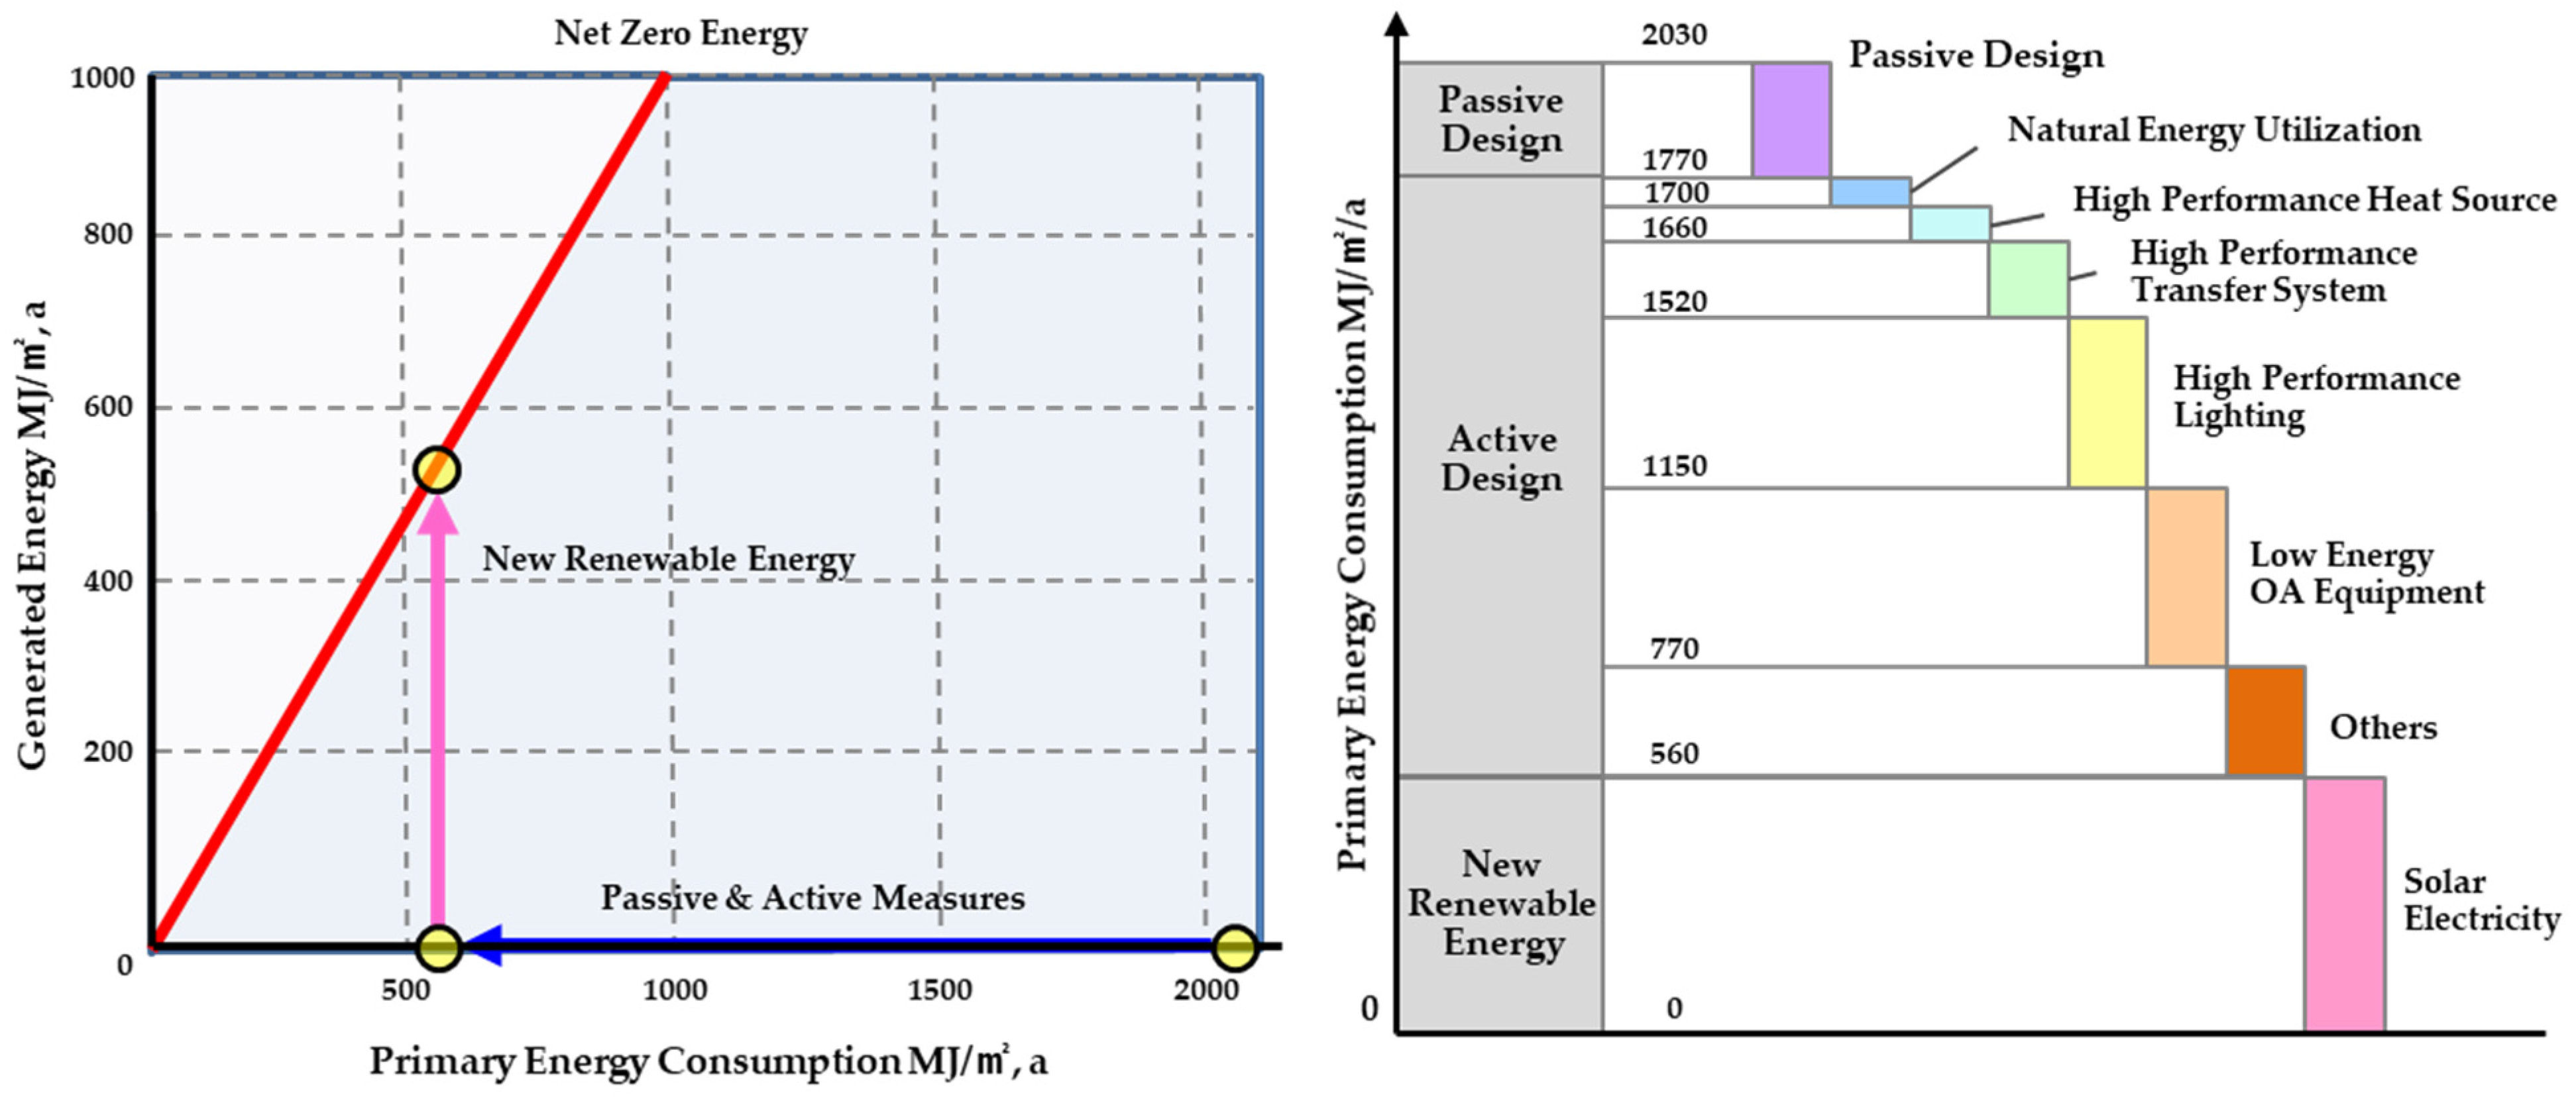
2.1. Zero-Energy Buildings
2.2. ECO2 Program
- (1)
- Σ{(New renewable energy production–energy required for new renewable energy production) × primary energy conversion coefficient}
- (2)
- Primary energy consumption per unit area + primary energy production per unit area.
2.3. Literature Review and a Comparison of the Present and Existing Studies
3. Materials and Methods
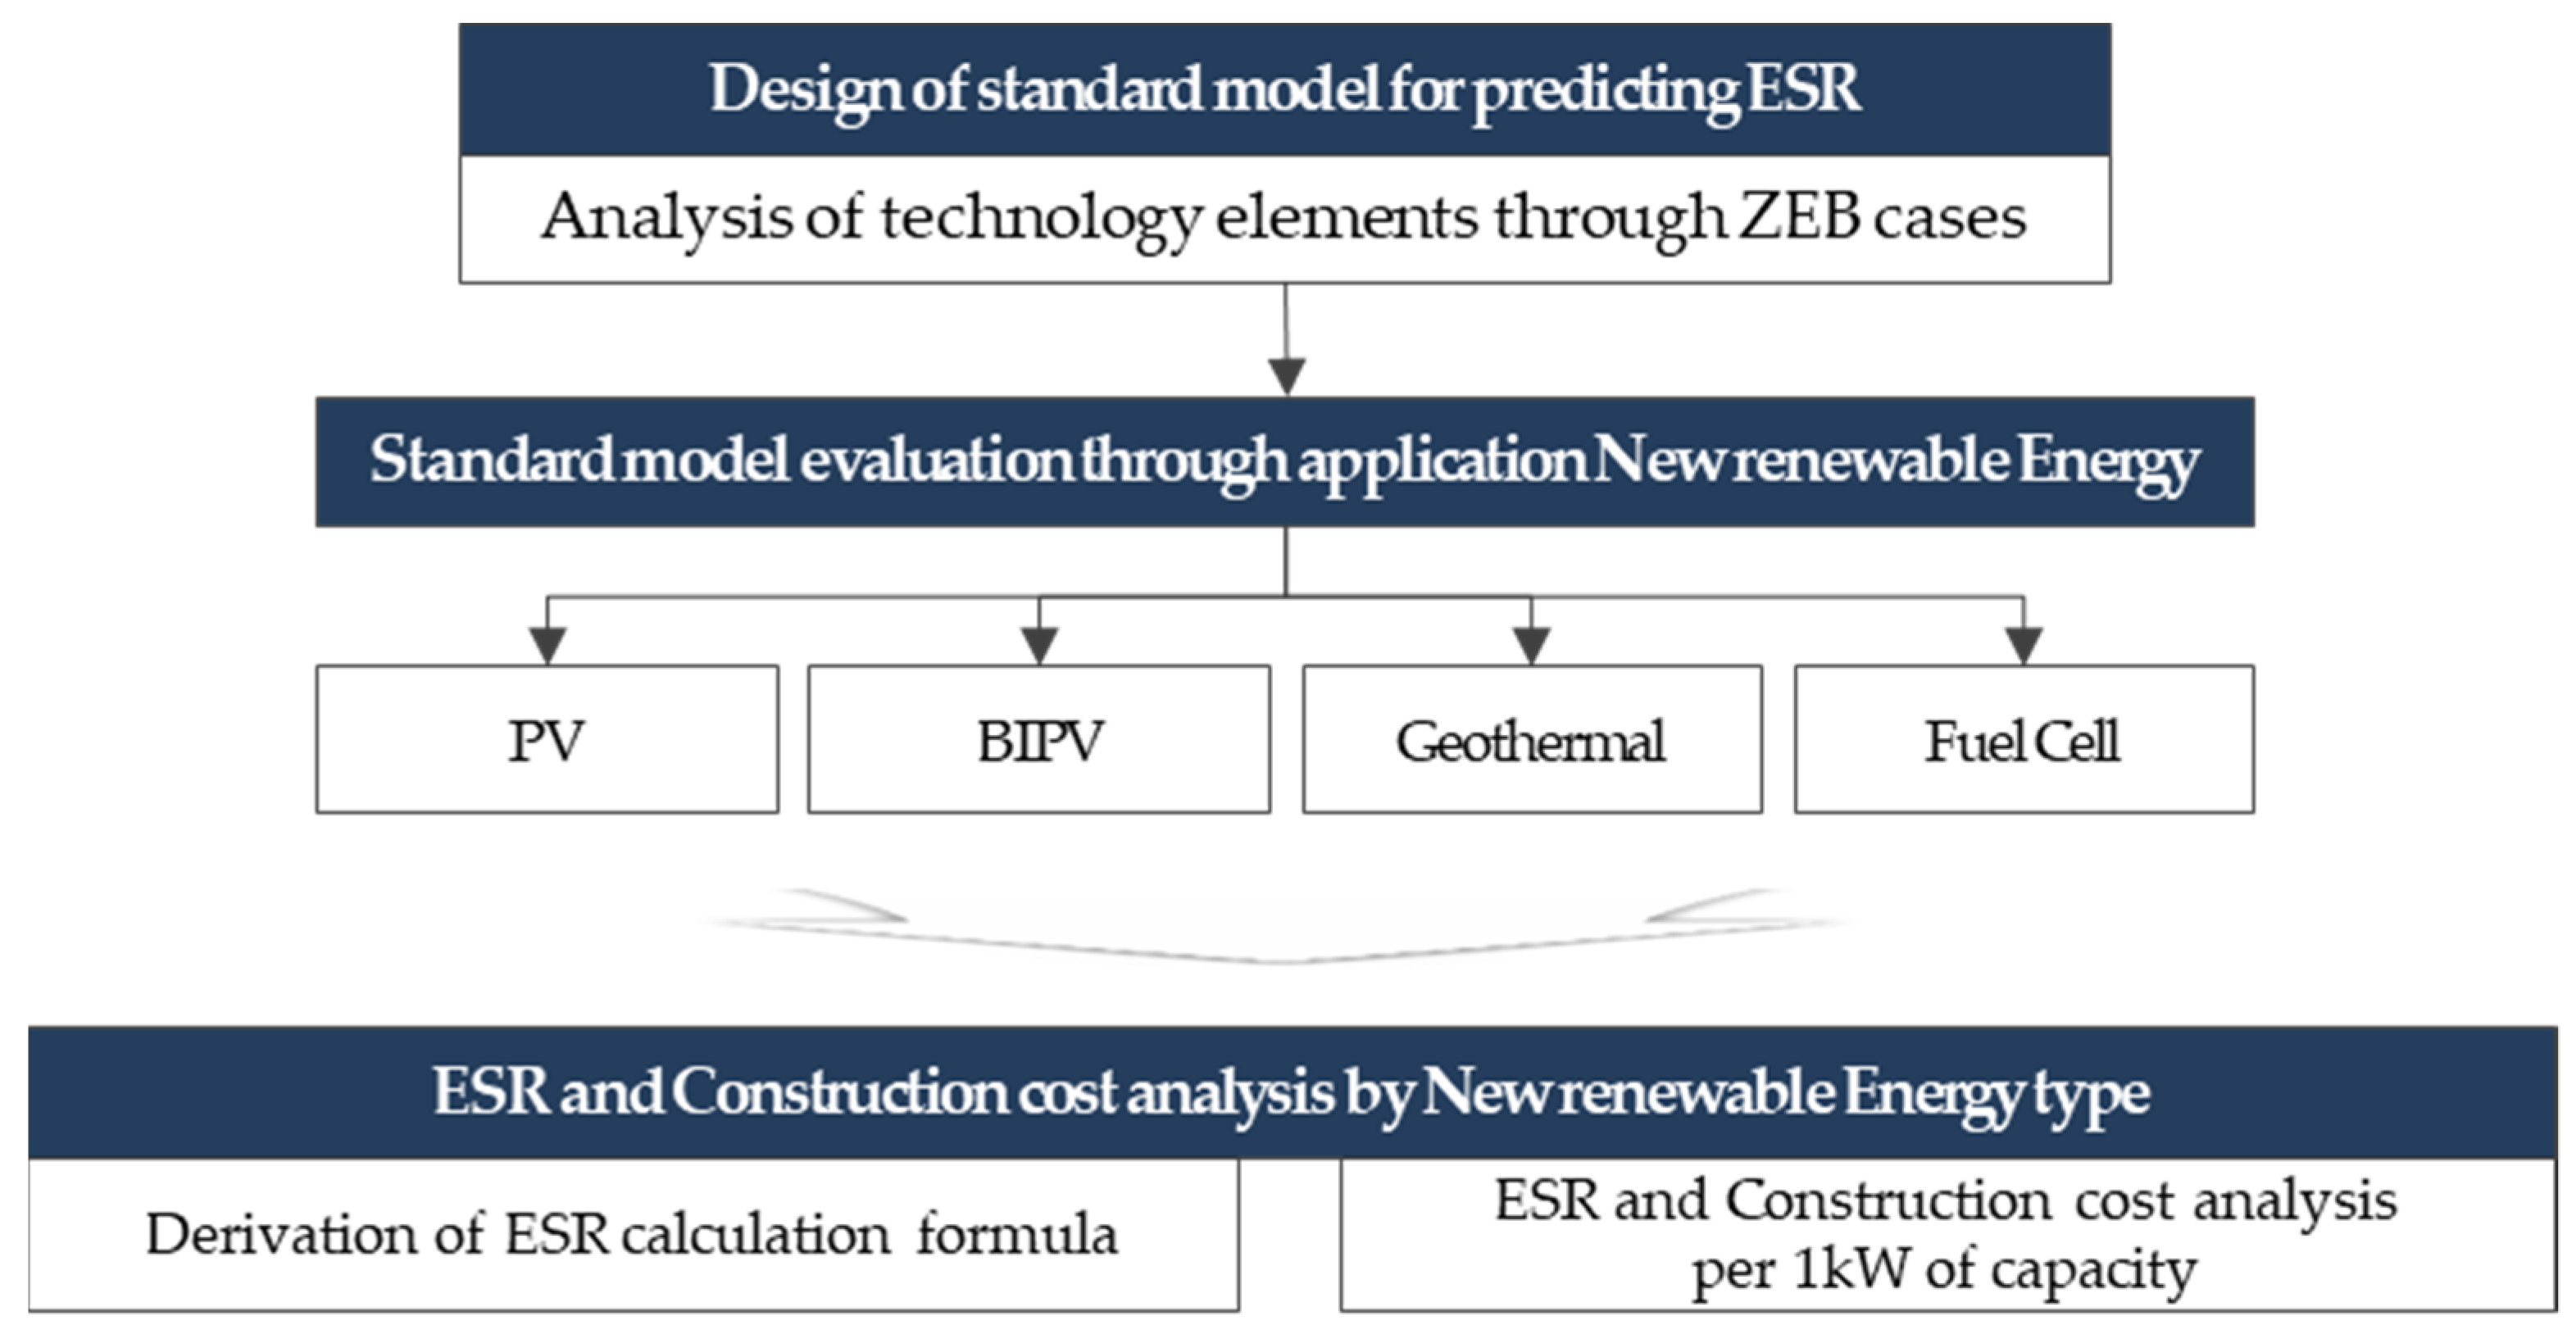
3.1. Standard-Model Design
3.2. ESR and Construction Cost Analysis
3.2.1. Photovoltaic (PV) System
3.2.2. Building Integrated Photovoltaic (BIPV) System
3.2.3. Geothermal System
3.2.4. Fuel Cell System
3.3. Derivation and Verification of the ESR Calculation Formula for Each Type of New Renewable Energy
3.3.1. Photovoltaic (PV) and Building Integrated Photovoltaic (BIPV) System
3.3.2. Geothermal System
3.3.3. Fuel Cell System
3.3.4. Total ESR Calculation
3.3.5. Verification of the ESR Formulas and Economic Analysis Based on ZEB Cases
4. Discussion
5. Conclusions
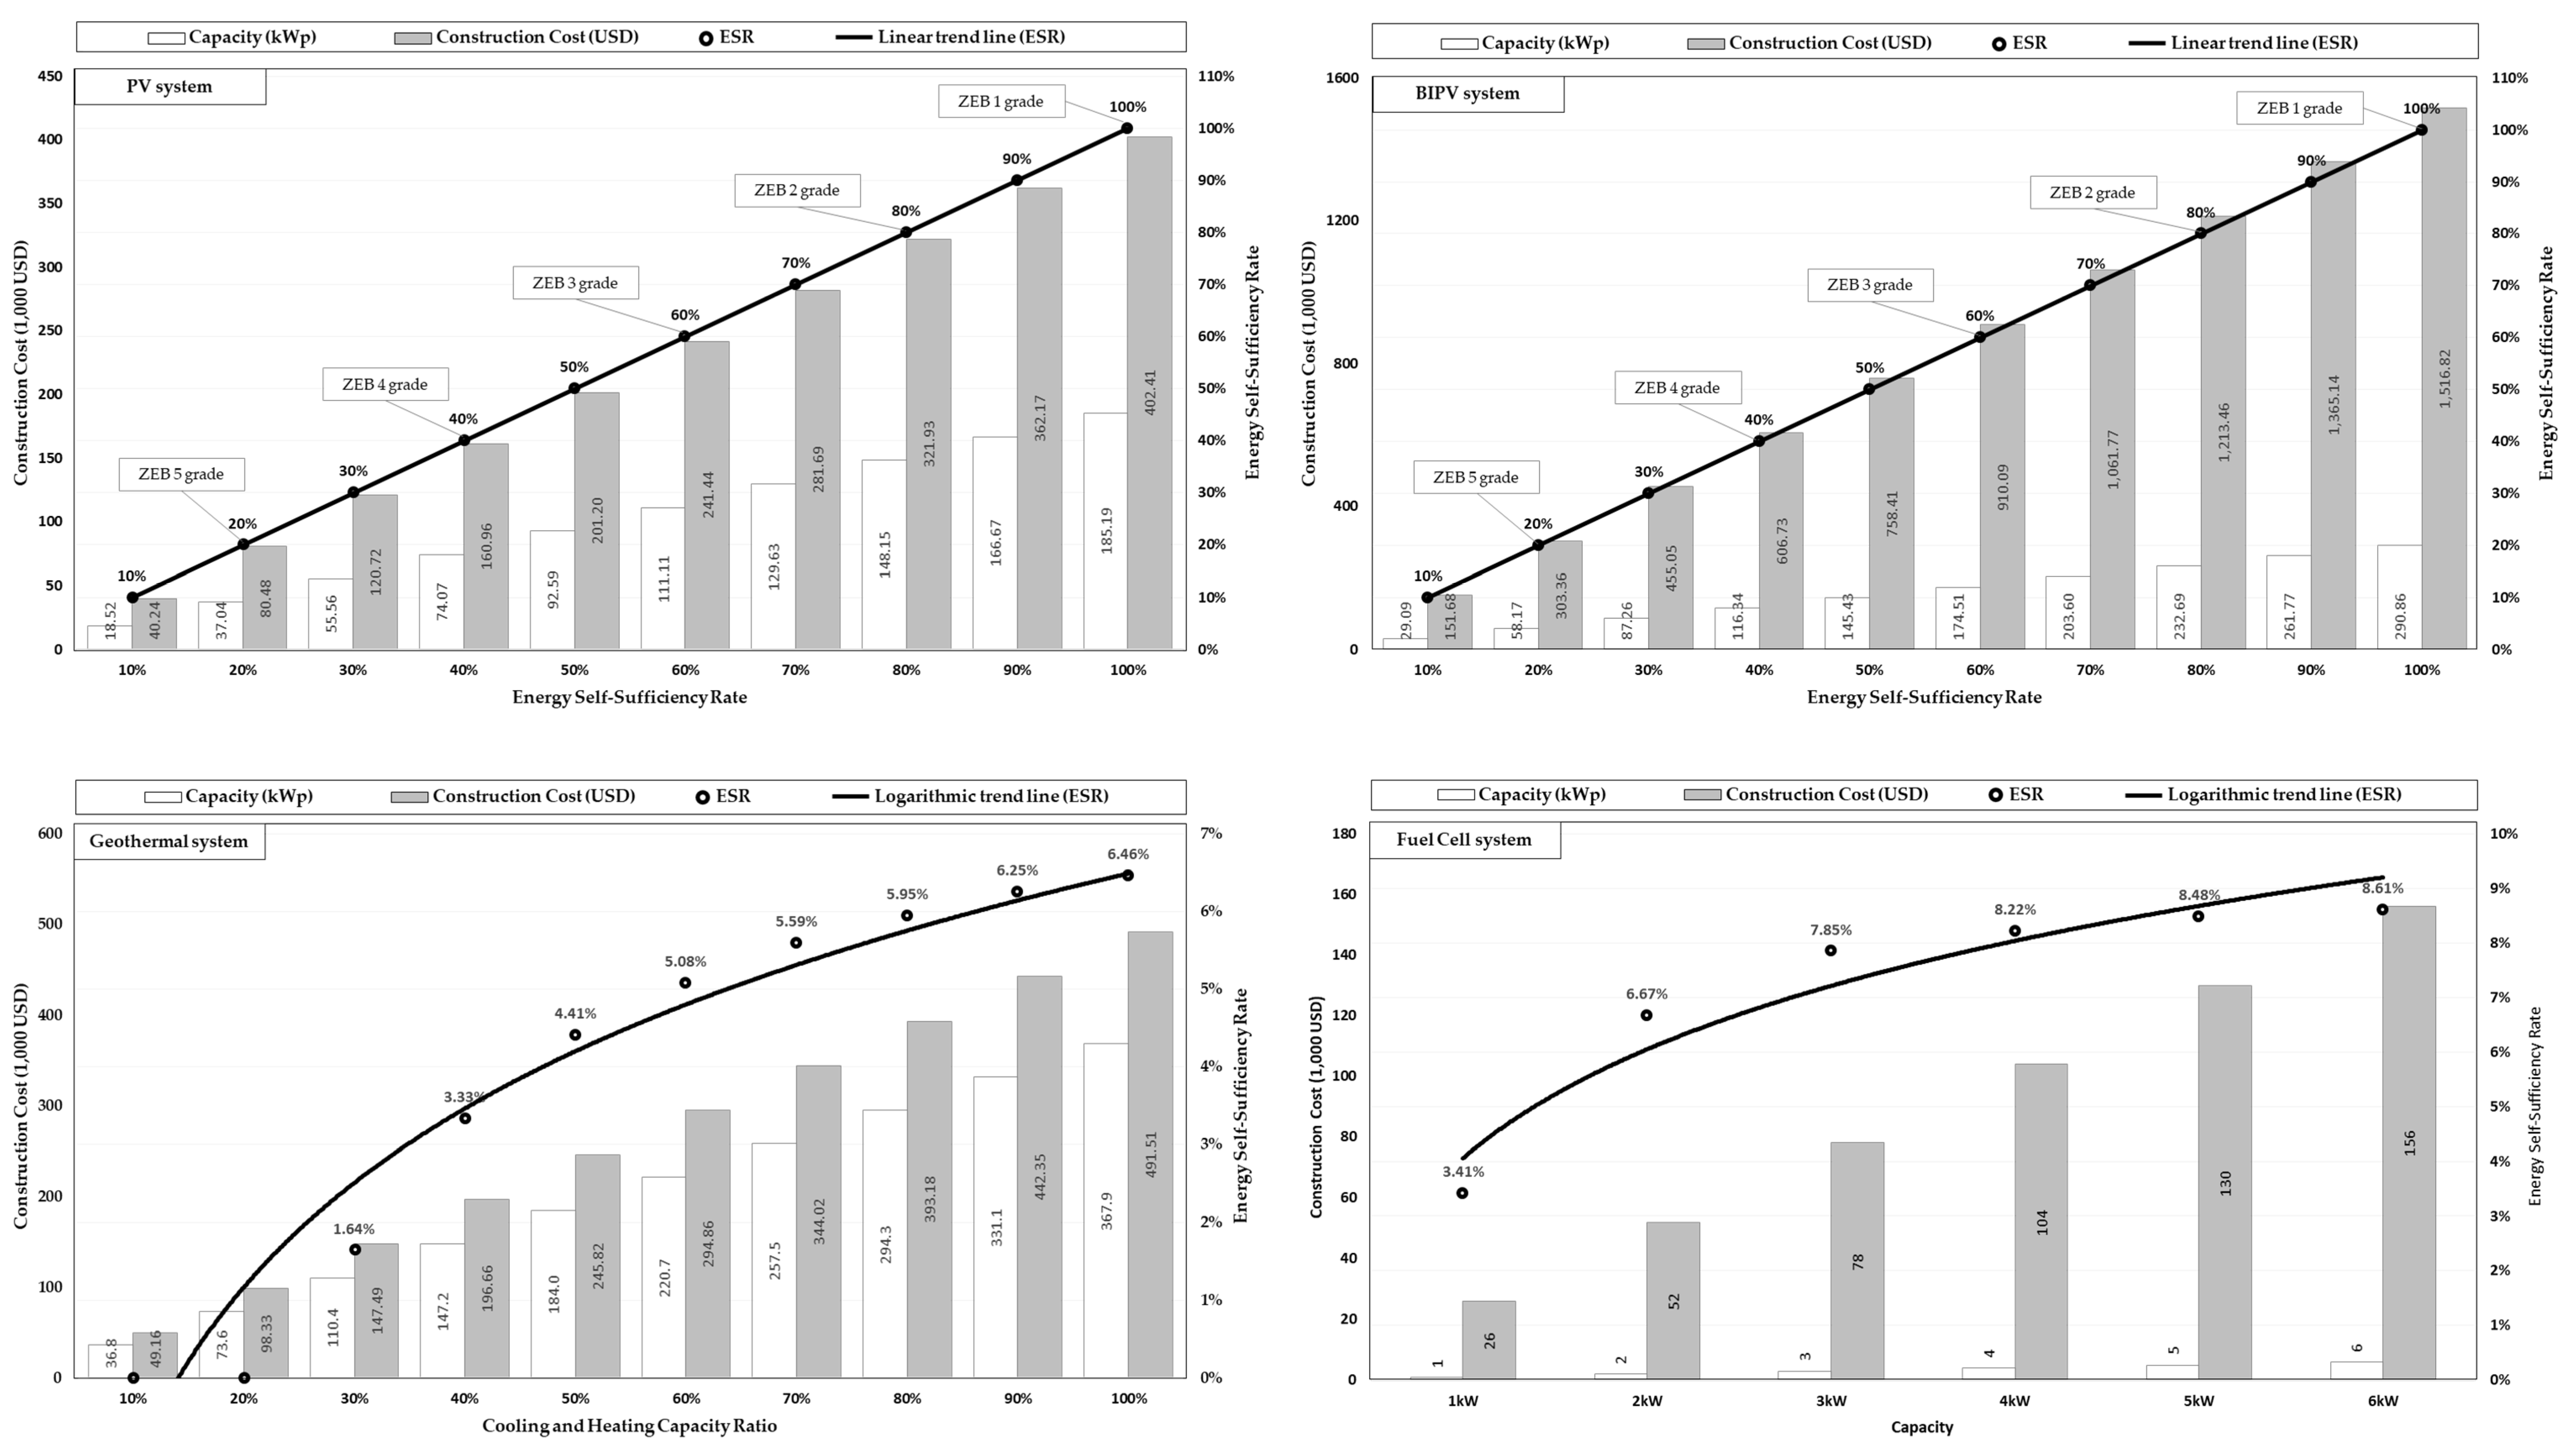
- The ESR and construction cost analysis results of the photovoltaic (PV) system indicated that the ESR per 1 kWp was 0.54%, and the construction cost was 2173 USD. The ESR displayed a constant rate of increase with the increase in capacity, and Equation (2) was derived accordingly.
- For the BIPV system, the obtained ESR per 1 kWp was 0.34%, and the construction cost was 5215 USD. The ESR displayed a constant rate of increase with the increase in capacity, and Equation (3) was derived accordingly.
- For the geothermal system, the obtained ESR per 1 kW was 0.016% and the construction cost was 1336 USD. The rate of increase of the ESR decreased with the increase in the capacity, and Equation (4) was derived using a logarithmic trendline.
- For the fuel cell system, the ESR per 1 kW was 1.46%, and the construction cost was 26,000 USD. The rate of increase of the ESR decreased with the increase in the capacity, and Equation (5) was derived using a logarithmic trendline.
- On comparing the ESR of the Korean ZEB cases with the ESR obtained using the derived formulas, the maximum ESR difference was 1.78%, and the maximum percentage error was 7.89%.
Author Contributions
Funding
Institutional Review Board Statement
Informed Consent Statement
Data Availability Statement
Conflicts of Interest
References
- Rogelj, J.; Shindell, D.; Jiang, K.; Fifita, S.; Forster, P.; Ginzburg, V.; Handa, C.; Kheshgi, H.; Kobayashi, S.; Kriegler, E.; et al. Mitigation Pathways Compatible with 1.5 °C in the Context of Sustainable Development. In Global Warming of 1.5 °C. An IPCC Special Report on the Impacts of Global Warming of 1.5 °C above Pre-Industrial Levels and Related Global Greenhouse Gas Emission Pathways, in the Context of Strengthening the Global Response to the Threat of Climate Change, Sustainable Development, and Efforts to Eradicate Poverty; Masson-Delmotte, V., Zhai, P., Pörtner, H.-O., Roberts, D., Skea, J., Shukla, P.R., Pirani, A., Moufouma-Okia, W., Péan, C., Pidcock, R., et al., Eds.; Intergovernmental Panel on Climate Change (IPCC): Geneva, Switzerland, 2018; in press. [Google Scholar]
- Rogelj, J.; Den Elzen, M.; Höhne, N.; Fransen, T.; Fekete, H.; Winkler, H.; Schaeffer, R.; Sha, F.; Riahi, K.; Meinshausen, M. Paris Agreement climate proposals need a boost to keep warming well below 2 °C. Nature 2016, 534, 631–639. [Google Scholar] [CrossRef] [Green Version]
- European Commission Climate Strategies & Targets. Available online: https://ec.europa.eu/clima/policies/strategies/2030_en (accessed on 30 June 2021).
- Haas, T.; Sander, H. Decarbonizing Transport in the European Union: Emission Performance Standards and the Perspectives for a European Green Deal. Sustainability 2020, 12, 8381. [Google Scholar] [CrossRef]
- Stokes, L.C. Short Circuiting Policy: Interest Groups and the Battle over Clean Energy and Climate Policy in the American State; Oxford University Press: New York, NY, USA, 2020; ISBN 978-0-19-007426-5. [Google Scholar]
- Park, Y.S.; Gang, G.S.; Jang, Y.U.; Kim, S.H.; Lee, H.J. The Direction and Implications of the International Community’s Carbon-Neutral Policy; Korea Institute for International Economic Policy KIEP: Sejong, Korea, 2021; Volume 1, pp. 1–15. [Google Scholar]
- Dias, B.D. Beyond Sustainability–Biophilic and Regenerative Design in Architecture. Eur. Sci. J. 2015, 11, 1857–7881. [Google Scholar]
- Savaresi, A. The Paris agreement: A new beginning? J. Energy Nat. Resour. Law 2016, 34, 16–26. [Google Scholar] [CrossRef] [Green Version]
- Korean New Deal. Available online: https://www.knewdeal.go.kr (accessed on 30 July 2021).
- Lee, J.-H.; Woo, J. Green New Deal Policy of South Korea: Policy Innovation for a Sustainability Transition. Sustainability 2020, 12, 10191. [Google Scholar] [CrossRef]
- Yoon, K. Discourse of the Post-COVID 19 New Deal in South Korea. East Asia 2021. [Google Scholar] [CrossRef] [PubMed]
- Kim, Y.; Yu, K. Study on the Certification Policy of Zero-Energy Buildings in Korea. Sustainability 2020, 12, 5172. [Google Scholar] [CrossRef]
- Zero Energy Building. Available online: https://zeb.energy.or.kr/BC/BC02/BC02_01_001.do (accessed on 30 July 2021).
- Kim, Y.; Yu, K. Study on Policy Marking of Passive Level Insulation Standards for Non-Residential Buildings in South Korea. Sustainability 2018, 10, 2554. [Google Scholar] [CrossRef] [Green Version]
- Lee, S.M.; Parn, S.H. Zero-Energy Building Integrated Planning Methodology for Office Building Considering Passive and Active Environmental Control Method. Appl. Sci. 2021, 11, 3686. [Google Scholar] [CrossRef]
- Bargues, J.L.; Vivancos, J.L.; Gisbert, P.; Guillem, M. Analysis of the Impact of Different Variables on the Energy Demand in Office Buildings. Sustainability 2020, 12, 5347. [Google Scholar] [CrossRef]
- Taherahmadi, J.; Noorollahi, Y.; Panahi, M. Toward comprehensive zero energy building definitions: A literature review and recommendations. Int. J. Sustain. Energy 2020, 40, 120–148. [Google Scholar] [CrossRef]
- Wang, S.J.; Tae, S.H.; Kim, R.H. Development of a Green Building Materials Integrated Platform Based on Materials and Resources in G-SEED in South Korea. Sustainability 2019, 11, 6532. [Google Scholar] [CrossRef] [Green Version]
- Wright, G.; Klingenberg, K. Climate-Specific Passive Building Standards; US Department of Energy, Building America Program, Office of Energy Efficiency and Renewable Energy: Washington, DC, USA, 2015.
- Hongze, L.; Fengyun, L.; Di, S.; Xinhua, Y.; Jianfei, S. Carbon Emission Intensity, Economic Development and Energy Factors in 19 G20 Countries: Empirical Analysis Based on a Heterogeneous Panel from 1990 to 2015. Sustainability 2018, 10, 2330. [Google Scholar]
- Heryadi, M.D.; Hartono, D. Energy Efficiency, Utilization of Renewable Energies, and Carbon Dioxide Emission: Case Study of G20 Countries. Int. Energy. J. 2016, 16, 143–152. [Google Scholar]
- Lim, H.S. Design and Performance Evaluation of Thermoelectric Radiant Cooling and Heating Panel. Ph.D. Thesis, Hanyang University, Seoul, Korea, 2020. [Google Scholar]
- Zero Energy Building. Available online: https://zeb.energy.or.kr/BC/BC03/BC03_06_001.do (accessed on 30 July 2021).
- Korea Energy Agency. Available online: https://building.energy.or.kr/build/CC/CCIRList.do?page=426 (accessed on 30 July 2021).
- Ministry of Land, Infrastructure and Transport. Rules for Building Energy Efficiency Rating Certification and Zero Energy Building Certification; Ministry of Government Legislation: Sejong, Korea, 2020. Available online: https://law.go.kr/lsSc.do?section=&menuId=1&subMenuId=15&tabMenuId=81&eventGubun=060101&query=%EC%97%90%EB%84%88%EC%A7%80%ED%9A%A8%EC%9C%A8%EB%93%B1%EA%B8%89#undefined (accessed on 30 July 2021).
- Korea Energy Agency. Building Energy Efficiency Rating Certification System Operational Regulations; Public Institutions: Ulsan, Korea, 2020; Available online: https://beec.energy.or.kr/BC/BC04/BC04_05_002.do?no=5 (accessed on 30 July 2021).
- Mun, J.H.; Kim, J.C. A Study on the Improvement of Energy Self-Sufficiency Rate for Obtaining Zero Energy Building Certification. J. Kor. Inst. Illum Electr. Install. Eng. 2018, 32, 27–32. [Google Scholar]
- Kim, M.R.; Lee, K.J.; Park, H.S. A study on the cases of new renewable energy applied buildings in Korea and Germany—Focused on solar and geothermal energy cases. Archit. Inst. Korea 2012, 28, 29–37. [Google Scholar]
- Sung, U.J.; Kim, S.H. Development of a Passive and Active Technology Package Standard and Database for Application to Zero Energy Building in South Korea. Energies 2019, 12, 1700. [Google Scholar] [CrossRef] [Green Version]
- Yoon, J.H. The Role and Practical Contribution of Renewable Energy Technologies in Actual Zero Energy Building. Mag. Kor. Solar Energy Soc. 2016, 14, 24–32. [Google Scholar]
- Marszal, A.J.; Heiselberg, P.; Bourrelle, J.S.; Musall, E.; Voss, K.; Sartori, I.; Napolitano, A. Zero Energy Building—A review of definitions and calculation methodologies. Energy Build. 2011, 43, 971–979. [Google Scholar] [CrossRef]
- Lee, D.Y.; Yoo, D.C.; Jo, S.Y.; Park, C.Y.; Jang, H.I. A Study on the Average Performance and Reference Model depending on Passive and Active Factor for Zero Energy Building Certification in Smart City—Focused on Education and Research Facilities and Office. J. Kor. Inst. Arch. Sustain. Environ. Build. Syst. 2020, 14, 387–400. [Google Scholar]
- Shim, H.S.; Lee, S.J. A Study on the Increase in Construction Cost for Zero Energy Building. J. Kor. Acad.-Indus. Coop. Soc. 2021, 22, 603–613. [Google Scholar]
- Kim, J.H.; Jo, S.Y.; Kim, C.M.; Jang, H.I.; Kim, S.S. Analysis of Design Parameters Affecting Zero Energy Buildings based on the Building Energy Efficiency Rating Certified Buildings—Focused on Educational Research Facilities. J. Kor. Inst. Arch. Sustain. Environ. Build. Syst. 2018, 12, 387–399. [Google Scholar]
- HANHWA Solutions. Available online: https://www.q-cells.com/en/main/products/solar_panels/G9/Q.PEAK-DUO-XL-G9.html (accessed on 30 July 2021).
- SAMSUNG. Available online: https://www.samsung.com/sec/business/dvms-outdoor/geo-water-outdoor/AM080FXWAHR1/ (accessed on 30 July 2021).
- S-Fuel Cell. Available online: http://www.s-fuelcell.com/goods/lineUp.php (accessed on 30 July 2021).
- Kim, J.Y.; Kwon, J.H.; Oh, J.G. Analysis of Zero Energy Building Certification Standards and Current Status. J. Kor. Inst. Ecolog. Arch. Environ. 2021, 21, 50–51. [Google Scholar]
- Ministry of Land, Infrastructure and Transport. Energy Saving Design Standards for Buildings; Ministry of Government Legislation: Sejong, Korea, 2017. Available online: https://law.go.kr/admRulSc.do?menuId=5&subMenuId=41&tabMenuId=183&query=%EC%97%90%EB%84%88%EC%A7%80%EC%A0%88%EC%95%BD%EC%84%A4%EA%B3%84%EA%B8%B0%EC%A4%80#liBgcolor0 (accessed on 30 July 2021).
- Kim, G.T.; Jang, M.K.; Song, I.H.; Kim, S.M. A Study on the Energy Self-sufficiency Rate Based on the Analysis of Building Energy Efficiency Rating System. J. Kor. Inst. Arch. Sustain. Environ. Build. Syst. 2017, 11, 331–341. [Google Scholar]


| ZEB Grade | Grade Criteria | Certification Status | Certification Ratio |
|---|---|---|---|
| grade 1 | ESR ≥ 100% | 27 cases | 2.26% |
| grade 2 | ESR ≥ 80% | 26 cases | 2.18% |
| grade 3 | ESR ≥ 60% | 83 cases | 6.95% |
| grade 4 | ESR ≥ 40% | 233 cases | 19.51% |
| grade 5 | ESR ≥ 20% | 825 cases | 69.10% |
| Index | Evaluation Contents |
|---|---|
| Use profile | Classified into 20 categories according to the operation plan for each zone |
| Category | Residential space, small office, large office (over 30 m2), conference room, auditorium, cafeteria, restroom, rest space (rest area, snack bar, etc.), attached space (lobby, hallway, etc.), storage room, information technology office, kitchen, hospital patient room, hotel room, classroom, lecture hall, store, exhibition room, reading room, fitness facility |
| Content | Equipment operation time, set demand amount (hot water supply, lighting, etc.), human and auxiliary equipment heat source, set temperature for cooling and heating, number of days used per month, correction coefficient for each use category |
| Energy Source | Gas | Electricity | District Heating | District Cooling |
|---|---|---|---|---|
| Primary energy conversion coefficient | 1.1 | 2.75 | 0.728 | 0.937 |
| Authors | Title | Main Contents | Differences in This Study |
|---|---|---|---|
| Lee, S.M.; Parn, S.H. | Zero-Energy Building Integrated Planning Methodology for Office Building Considering Passive and Active Environmental Control Method. | · Derive a design methodology for ZEB. · Analyze the passive technology elements. | · Analysis of passive and active technology elements through ZEB cases. · Utilization of laws and ECO2 logic that can be used in actual work. · Selection of target buildings (Small and medium-sized public office building) and standard model development. · Derivation of a major new renewable energy (PV, BIPV, Geothermal, and Fuelcell systems). · ESR and construction cost analysis and ESR prediction formula derivation. |
| Bargues, J.L.; Vivancos, J.L.; Gisbert, P.; Guillem, M. | Analysis of the Impact of Different Variables on the Energy Demand in Office Buildings. | · Minimize energy consumption. · Analyze the energy behavior of the office building. | |
| Sung, U.J.; Kim, S.H. | Development of a passive and active technology package standard and database for application to zero energy buildings in South Korea | · Propose a ZEB technology package. · Propose passive and active technology packages, modules, and material performance. | |
| Yoon, J.H.; | The Role and Practical Contribution of Renewable Energy Technologies in Actual Zero Energy Building. | · Energy consumption analysis of residential buildings. · ESR analysis of PV among the renewable energy types. |
| Technology Elements | Case-1 (a) | Case-2 (b) | Case-3 (c) | Standard Model {(a)+(b)+(c)}÷3} | |
|---|---|---|---|---|---|
| Usage | Public office building | Public office building | Public office building | Public office building | |
| Total floor area (m2) | 2803.12 | 3630.84 | 2529.01 | 2987.66 | |
| Aspect ratio of the plane | 1:2.908 | 1:1.836 | 1:1.023 | 1:1.922 | |
| Size | 4 floors above ground, 1 floor underground | 4 floors above ground, 2 floors underground | 3 floors above ground, 1 floor underground | 4 floors above ground, 1 floor underground | |
| Floor area of insulation space (m2) | 1939.58 | 2551.60 | 1755.00 | 2082.06 | |
| Floor area by use (m2) | Work space | 711.16 | 620.06 | 523.42 | 618.21 |
| Service facilities | 442.73 | 875.96 | 598.66 | 639.12 | |
| Communal area | 614.76 | 767.68 | 395.89 | 592.78 | |
| Sanitary facilities | 143.33 | 178.39 | 142.95 | 154.89 | |
| Warehouse | 27.60 | 109.51 | 94.08 | 77.06 | |
| Window-to-wall ratio | 22.26% | 26.35% | 25.54% | 24.72 | |
| Exterior wall area by direction (m2) | Eastward | 232.97 | 332.09 | 363.04 | 309.37 |
| Westward | 270.39 | 430.77 | 311.68 | 337.61 | |
| Southward | 522.87 | 521.56 | 283.40 | 442.61 | |
| Northward | 495.64 | 711.84 | 299.81 | 502.43 | |
| Window area by direction (m2) | Eastward | 21.78 | 102.97 | 110.35 | 78.37 |
| Westward | 66.92 | 79.41 | 100.49 | 82.27 | |
| Southward | 203.57 | 307.25 | 163.40 | 224.74 | |
| Northward | 143.40 | 224.75 | 103.06 | 157.07 | |
| Roof area of top floor (m2) | 694.07 | 786.27 | 590.61 | 690.32 | |
| Floor area of bottom floor (m2) | 694.07 | 786.27 | 590.61 | 690.32 | |
| Average U-value by part (W/m2·K) | Exterior wall | 0.213 | 0.214 | 0.135 | 0.187 |
| Window and door | 1.399 | 1.333 | 1.392 | 1.375 | |
| Roof | 0.170 | 0.129 | 0.083 | 0.127 | |
| Floor | 0.166 | 0.164 | 0.142 | 0.157 | |
| Cooling and heating system | EHP 102 kW GHP 302 kW | EHP 124 kW GHP 294.4 kW | EHP 91.4 kW GHP 190 kW | EHP 105.8 kW GHP 262.1 kW | |
| Hot water heating system | gas-fired water heater (84 kW) | electric water heater (34 kW) | gas-fired water heater (112 kW) | gas-fired water heater (93 kW) | |
| Primary Energy Conversion Coefficient (Gas: 1.1, Electricity: 2.75) | 92.4 kW | 93.5 kW | 123.2 kW | 103 kW | |
| Ventilation system | energy recovery ventilator(22ea) | energy recovery ventilator(25ea) | energy recovery ventilator(16ea) | energy recovery ventilator(21ea) | |
| Lighting density | 4.90 W/m2 (LED) | 4.41 W/m2 (LED) | 7.82 W/m2 (LED) | 5.71 W/m2 (LED) | |
| Primary Energy Production | PV | BIPV | Geothermal | Fuel Cell |
|---|---|---|---|---|
| 1 kWh/m2 | 1 kW, 1975 USD | 1.43 kW, 7450 USD | 62.5 kW, 38,997 USD | 0.68 kW, 9523 USD |
| Additional cost compared against PV | 1 times | 1.57 times | 19.7 times | 4.8 times |
| Capacity (kWp) | Module (ea) | Area (m2) | Primary Energy Consumption (kWh/m2) | Primary Energy Production (kWh/m2) | ESR | Construction Cost (USD) | ZEB Grade |
|---|---|---|---|---|---|---|---|
| 18.52 | 38.37 | 85.18 | 203.7 | 20.37 | 10% | 40,241 | none |
| 37.04 | 76.74 | 170.36 | 203.6 | 40.74 | 20% | 80,481 | grade 5 |
| 55.56 | 115.11 | 255.55 | 203.6 | 61.11 | 30% | 120,722 | grade 5 |
| 74.07 | 153.48 | 340.73 | 203.7 | 81.48 | 40% | 160,963 | grade 4 |
| 92.59 | 191.85 | 425.91 | 203.7 | 101.85 | 50% | 201,204 | grade 4 |
| 111.11 | 230.22 | 511.09 | 203.7 | 122.22 | 60% | 241,444 | grade 3 |
| 129.63 | 268.59 | 596.28 | 203.6 | 142.59 | 70% | 281,685 | grade 3 |
| 148.15 | 306.96 | 681.46 | 203.7 | 162.96 | 80% | 321,926 | grade 2 |
| 166.67 | 345.33 | 766.64 | 203.7 | 183.33 | 90% | 362,167 | grade 2 |
| 185.19 | 383.70 | 851.82 | 203.7 | 203.70 | 100% | 402,407 | grade 1 |
| Average | 2.07ea/kW | 2.22/kW | 203.7 | 1.1/kW | 0.54%/kW | 2173 USD/kW | - |
| Capacity (kWp) | Module (ea) | Area (m2) | Primary Energy Consumption (kWh/m2) | Primary Energy Production (kWh/m2) | ESR | Construction Cost (USD) | ZEB Grade |
|---|---|---|---|---|---|---|---|
| 29.09 | 60.27 | 133.79 | 203.6 | 20.36 | 10% | 151,682 | none |
| 58.17 | 120.53 | 267.58 | 203.7 | 40.72 | 20% | 303,364 | grade 5 |
| 87.26 | 180.80 | 401.37 | 203.6 | 61.08 | 30% | 455,046 | grade 5 |
| 116.34 | 241.06 | 535.16 | 203.7 | 81.44 | 40% | 606,728 | grade 4 |
| 145.43 | 301.33 | 668.95 | 203.5 | 101.80 | 50% | 758,410 | grade 4 |
| 174.51 | 361.59 | 802.74 | 203.8 | 122.16 | 60% | 910,092 | grade 3 |
| 203.60 | 421.86 | 936.53 | 203.8 | 142.52 | 70% | 1,061,774 | grade 3 |
| 232.69 | 482.12 | 1070.32 | 203.6 | 162.88 | 80% | 1,213,456 | grade 2 |
| 261.77 | 542.39 | 1204.11 | 203.8 | 183.24 | 90% | 1,365,138 | grade 2 |
| 290.86 | 602.66 | 1337.90 | 203.6 | 203.60 | 100% | 1,516,820 | grade 1 |
| Average | 2.07ea/kW | 2.22m2/kW | 203.7 | 0.7/kW | 0.34%/kW | 5215 USD/kW | - |
| Cooling and Heating Capacity Ratio | Capacity (kW) | Primary Energy Consumption (kWh/m2) | Primary Energy Production (kWh/m2) | ESR | Construction Cost (USD) | ZEB Grade |
|---|---|---|---|---|---|---|
| 10% | 36.8 | 218.9 | 0 | 0% | 49,165 | none |
| 20% | 73.6 | 198.8 | 0 | 0% | 98,330 | none |
| 30% | 110.4 | 195.3 | 3.2 | 1.64% | 147,494 | none |
| 40% | 147.2 | 195.1 | 6.5 | 3.33% | 196,659 | none |
| 50% | 184.0 | 195.1 | 8.6 | 4.41% | 245,824 | none |
| 60% | 220.7 | 195.1 | 9.9 | 5.08% | 294,855 | none |
| 70% | 257.5 | 195.1 | 10.9 | 5.59% | 344,020 | none |
| 80% | 294.3 | 195.1 | 11.6 | 5.95% | 393,185 | none |
| 90% | 331.1 | 195.1 | 12.2 | 6.25% | 442,350 | none |
| 100% | 367.9 | 195.1 | 12.6 | 6.46% | 491,514 | none |
| Average | - | 197.87 | 0.034/kW | 0.016%/kW | 1336 USD/kW | - |
| Capacity (kW) | Primary Energy Consumption (kWh/m2) | Primary Energy Production (kWh/m2) | ESR | Construction Cost (USD) | ZEB Grade |
|---|---|---|---|---|---|
| 1 | 199.6 | 6.8 | 3.41% | 26,000 | none |
| 2 | 196.3 | 13.1 | 6.67% | 52,000 | none |
| 3 | 193.6 | 15.2 | 7.85% | 78,000 | none |
| 4 | 192.1 | 15.8 | 8.22% | 104,000 | none |
| 5 | 191.1 | 16.2 | 8.48% | 130,000 | none |
| 6 | 190.5 | 16.4 | 8.61% | 156,000 | none |
| Average | 193.87 | 2.73/kW | 1.46%/kW | 26,000 USD/kW | - |
| Category | Case-1 | Case-2 | Case-3 | |
|---|---|---|---|---|
| Case | Total floor area | 2803.1 m2 | 3630.8 m2 | 2529.0 m2 |
| New Renewable Energy | PV 16.2 kW Fuel cell 5 kW | PV 28 kW, Geothermal 290 kW (Cooling and Heating Ratio: 70%) | PV 45 kW Fuel cell 6 kW | |
| ESR (a) | 16.75% | 22.55% | 29.10% | |
| Construction cost (c) | 165,202.6 USD | 448,284 USD | 253,785 USD | |
| Formula | ESR (b) | 16.86% | 24.33% | 28.82% |
| Construction cost (d) | 71,926.3 (PV 33.1 kW) | 74,751.2 (PV 34.4 kW) | 138,420.1 (PV 63.7kW) | |
| Error (b−a) | 0.11% | 1.78% | −0.28% | |
| Percent error ((b−a)/a) × 100) | 0.66% | 7.89% | 0.96% | |
| Construction cost saving ratio ((d−c)/d × 100) | 56.46% | 83.33% | 45.46% | |
Publisher’s Note: MDPI stays neutral with regard to jurisdictional claims in published maps and institutional affiliations. |
© 2021 by the authors. Licensee MDPI, Basel, Switzerland. This article is an open access article distributed under the terms and conditions of the Creative Commons Attribution (CC BY) license (https://creativecommons.org/licenses/by/4.0/).
Share and Cite
Wang, S.; Tae, S.; Jang, H. Prediction of the Energy Self-Sufficiency Rate of Major New Renewable Energy Types Based on Zero-Energy Building Certification Cases in South Korea. Sustainability 2021, 13, 11552. https://doi.org/10.3390/su132011552
Wang S, Tae S, Jang H. Prediction of the Energy Self-Sufficiency Rate of Major New Renewable Energy Types Based on Zero-Energy Building Certification Cases in South Korea. Sustainability. 2021; 13(20):11552. https://doi.org/10.3390/su132011552
Chicago/Turabian StyleWang, Seongjo, Sungho Tae, and Hyeongjae Jang. 2021. "Prediction of the Energy Self-Sufficiency Rate of Major New Renewable Energy Types Based on Zero-Energy Building Certification Cases in South Korea" Sustainability 13, no. 20: 11552. https://doi.org/10.3390/su132011552
APA StyleWang, S., Tae, S., & Jang, H. (2021). Prediction of the Energy Self-Sufficiency Rate of Major New Renewable Energy Types Based on Zero-Energy Building Certification Cases in South Korea. Sustainability, 13(20), 11552. https://doi.org/10.3390/su132011552