Article

A Future Study of an Environment Driving Force (EDR): The Impacts of Urmia Lake Water-Level Fluctuations on Human Settlements

by
Somayeh Mohammadi Hamidi
1,2,*,
Christine Fürst
1,
Hossein Nazmfar
2,
Ahad Rezayan
3 and
Mohammad Hassan Yazdani
2
1
Department of Sustainable Landscape Development, Institute for Geosciences and Geography, Martin Luther University Halle-Wittenberg, 06120 Halle (Saale), Germany
2
Department of Geography and Urban Planning, University of Mohaghegh Ardabili, Ardabil 009845, Iran
3
Futures Studies Department, National Research Institute for Science Policy, Tehran 009821, Iran
*
Author to whom correspondence should be addressed.
Sustainability 2021, 13(20), 11495; https://doi.org/10.3390/su132011495
Submission received: 22 August 2021 / Revised: 6 October 2021 / Accepted: 9 October 2021 / Published: 18 October 2021
(This article belongs to the Topic Climate Change and Environmental Sustainability)

Abstract

:
Lake Urmia, one of the world’s largest salt lakes, is rapidly losing water and drying up. This environmental hazard has raised concerns about the consequences and impact on the surrounding communities. In this paper, we use a futuristic view (horizon of 10 years based on medium-term planning) to identify the main environmental drivers in the surrounding settlements of the Urmia Lake basin. A qualitative method, based on cross-impact analysis, was used as a means of future research. We also used a Delphi-based expert panel method to collect data and extract the environmental impacts of Urmia Lake. After the three rounds of the Delphi process, the expert panel reached a high level of agreement (100%) on the top 17 environmental consequences. Then, these consequences were classified by driving force and dependency using the MICMAC method. The results show that reducing pasture area, soil and water salinity, groundwater decline and depletion, and destruction of surrounding agricultural lands play a significant role in environmental change in Urmia Lake. Overall, any small change in these variables may lead to fundamental changes in the entire system.

1. Introduction

Salt lakes are a significant part of the earth’s inland aquatic ecosystems and are found worldwide. These lakes play a pivotal role in determining regional climate patterns, maintaining biotic productivity and diversity, sustaining ecological and human health, and providing recreational services, minerals, and other resources [1]. Therefore, the dynamics of salt lakes are of great importance to a wide range of stakeholders [2].
The Caspian Sea is the world’s largest salt lake, accounting for 41% of all salt lake volume, and is home to a robust fishing, shipping, and mining sector. Other major hypersaline systems, such as the Great Salt Lake, offer various waterfowl habitats that can be exploited for minerals. Flamingos and other birds live in small Andean salars and lakes in the Middle East and Africa [3]. Around the world, we witness that salt lakes are shrinking. On closer inspection, environmental factors, namely almost all human activities, such as diversion of surface inflows, salinisation, mining activities, pollution, and climate change, threaten salt lakes [4]. Humans’ increased water use, particularly for agricultural irrigation, is a major contributor to lakes drying up. Agricultural water consumption in the Aral Sea 2 watershed, for example, has reduced the lake’s surface area by 74% and volume by 90% [5]. There is little doubt that, by 2025, the natural character of most of the world’s salt lakes will have changed. Several recent ‘vision’ statements clearly point in this direction. In central Asia, for example, the ‘vision’ proposed by UNESCO (2000) for the Aral Sea basin involves almost complete desiccation of the lake itself, and greatly increased ‘development’ of its catchment to support the growing populations of Kazahkstan, Uzbekistan, Turkmenistan, and other smaller states in the region [1]. Figure 1 shows the largest salt lakes in the world which are losing their water and drying up.
The drying up of salt lakes is not a new occurrence, and scientists have observed an alarming and accelerated loss in many of these essential ecosystems [7]. The Evans River diversion, for example, became the major source of pollution and particle matter in that section of the lake in 1926, creating asthma and other health concerns for nearly 40,000 people living there [8]. In a similar vein, the Utah Lake in the United States and the Aral Sea in Kazakhstan and Uzbekistan [9] have caused many disasters for the residents of these areas. The Tarim Basin, which resulted in the collapse of the Loulan Kingdom in 645 environmental consequences, is likely the oldest known direct human action that caused salt lakes to dry up [10]. Other consequences of increasing water consumption are more recent. Since 2000, the Salton Sea in California has dropped by over 7 m due to management measures that restricted water input to the lake [11].
Lake Urmia in Iran, like many other salt lakes on the continent except Antarctica, has experienced a similar fate. Nowadays, Lake Urmia exposes a salt desert that produces dust harmful to health and threatens crops and people [12]. According to similar occurrences involving Lake Aral, Lake Ebinur, and Lake Chad, the continued drying process of Urmia Lake would bring multiple social, environmental, and ecological disastrous consequences to the region [4] and pose a threat to the regional economy and human wellbeing.
The major goal of this paper is to (1) determine the environmental impacts of water-level fluctuations of Urmia Lake; (2) to identify the environmental drivers (10-year horizon) in the study area; (3) analyse the impacts of these drivers on human settlements around the lake that are directly and indirectly affected by these impacts.

2. Study Design and Methods

2.1. Model Region: Lake Urmia Basin, Iran

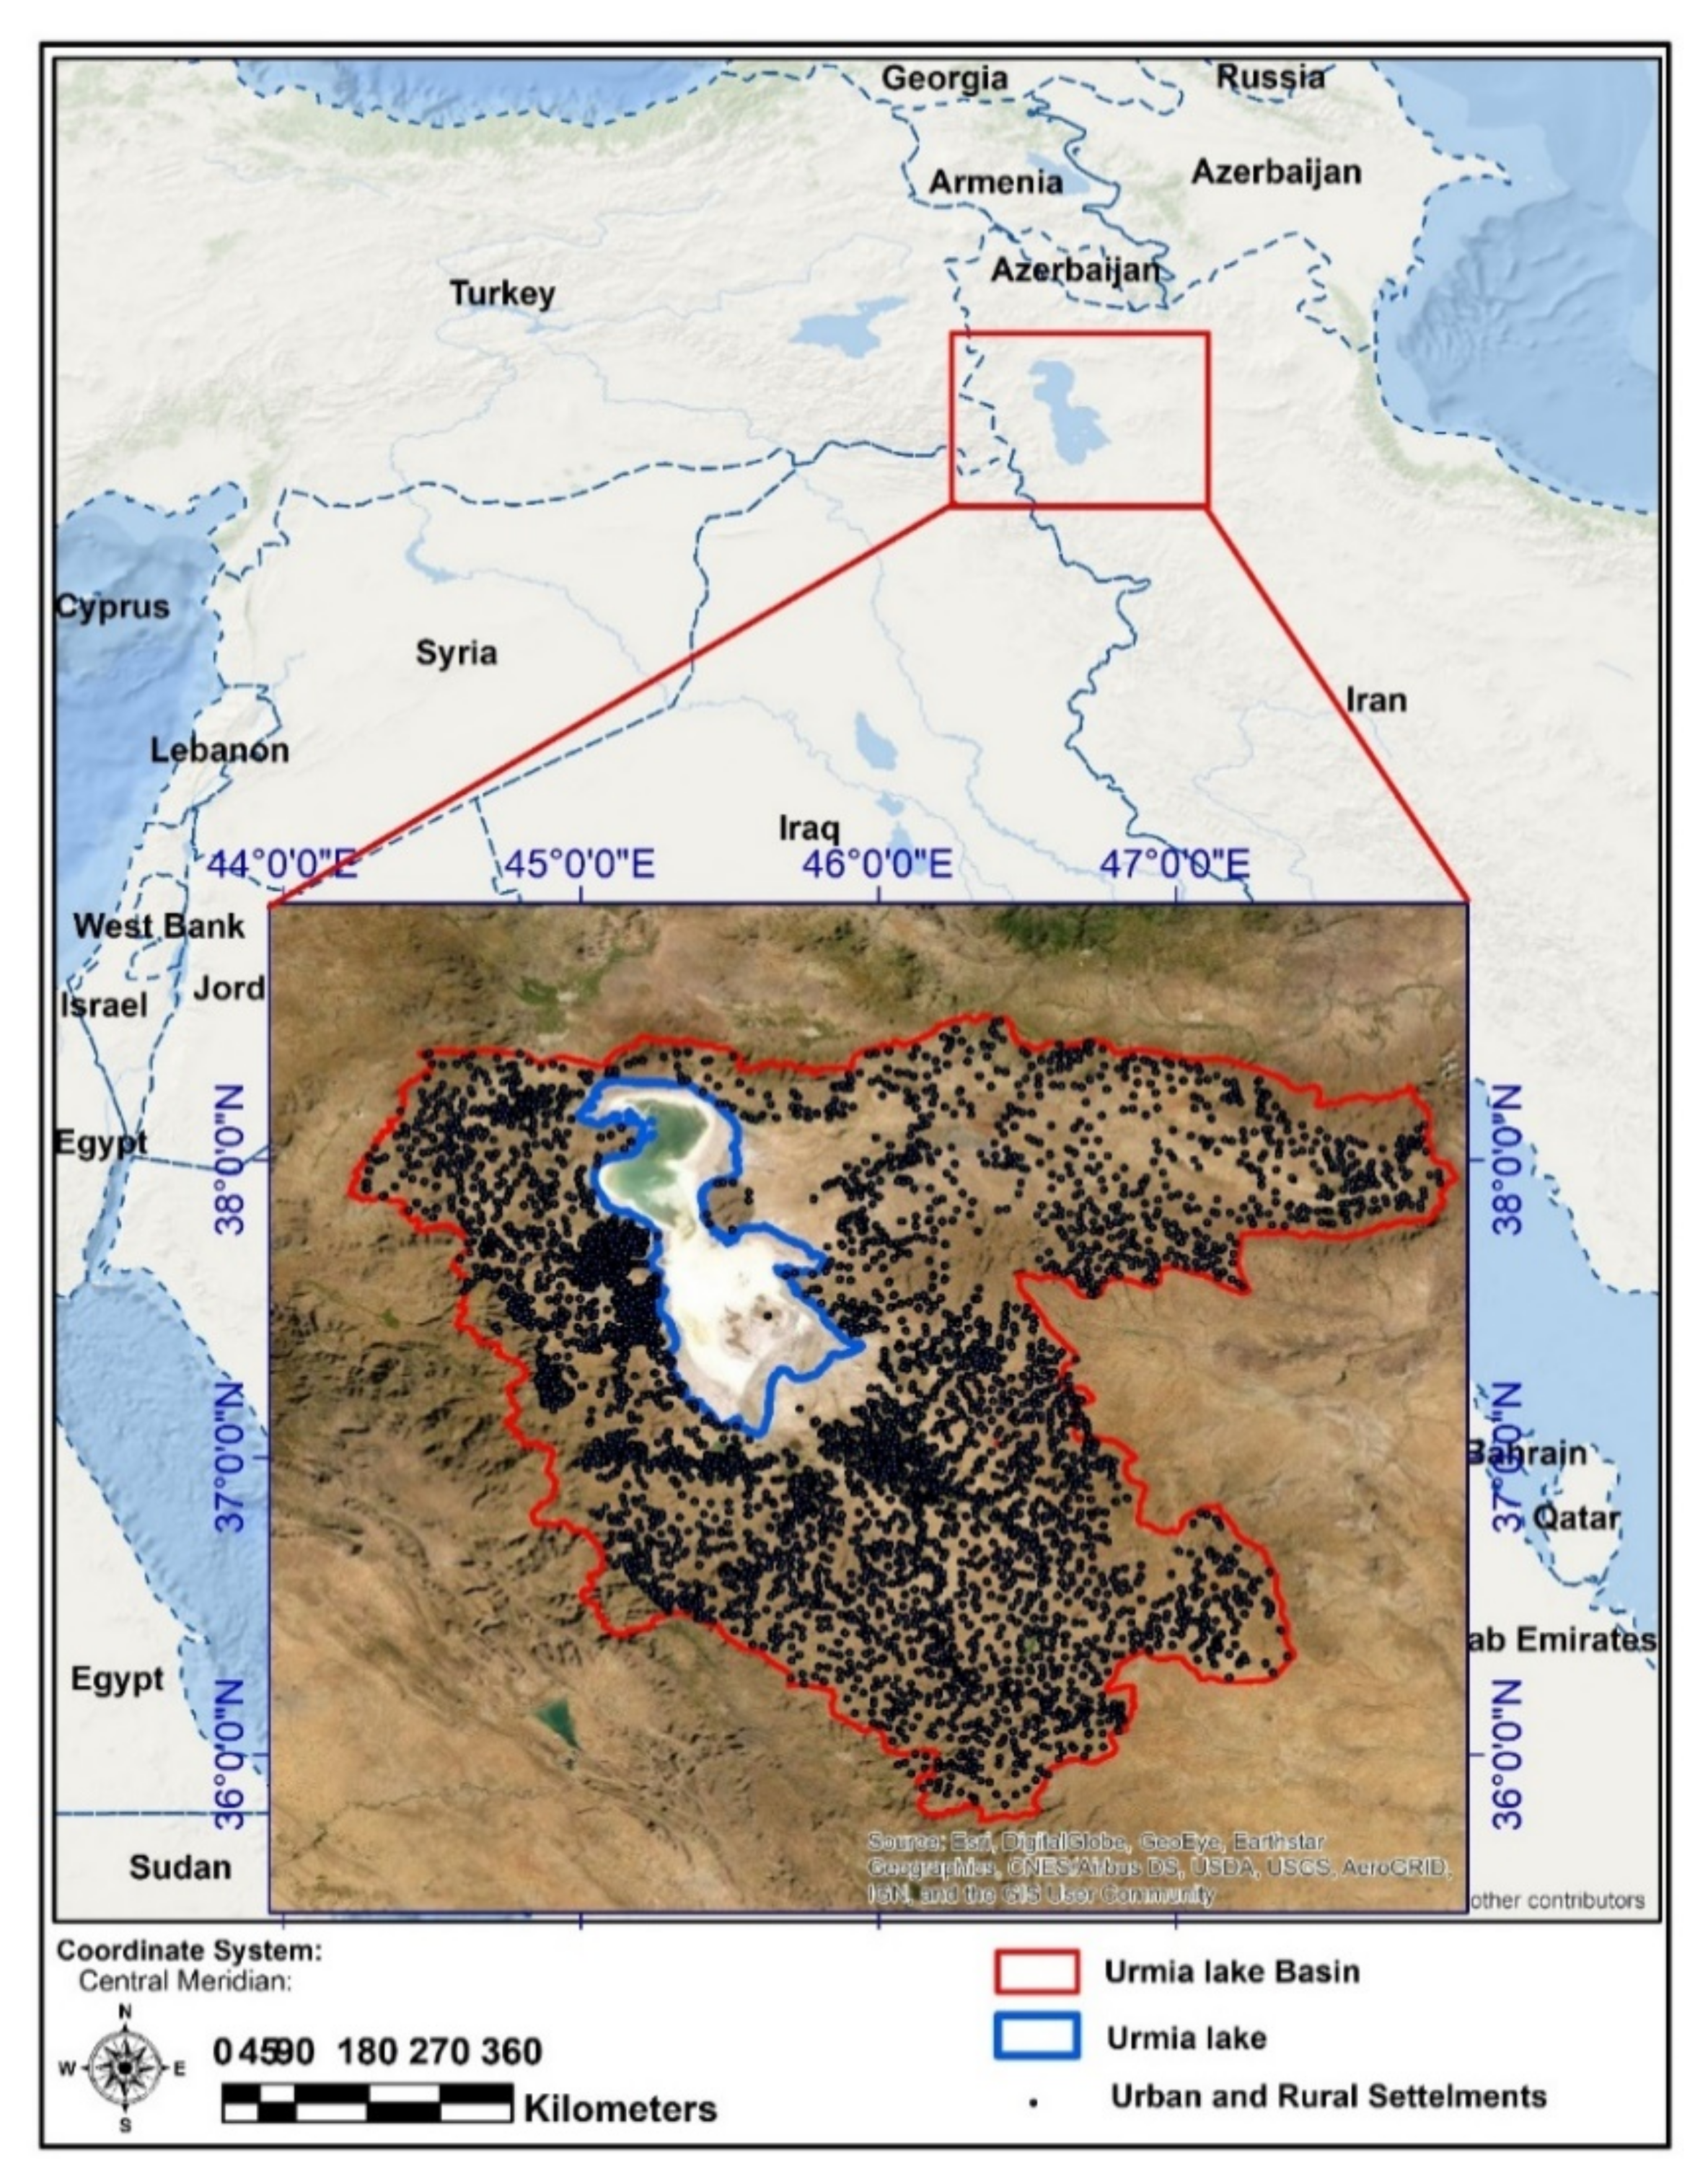
The largest hyper-saline water body in Iran, Lake Urmia, is located in northwestern Iran and encompasses around 52,000 square kilometres (Figure 2).
The lake is located in a mountainous region between three provinces: East Azerbaijan (39 percent), West Azerbaijan (51 percent), and the Southern Province of Kurdistan (10 percent). The lake’s mean annual precipitation ranges between 240 and 272 mm [13], with approximately 77 percent of the precipitation falling between December and May each year. Precisely speaking, it is the largest lake in the Middle East and the third largest salt lake globally [14], at 140 km long, 55 km wide, and 16 m deep [15].
After two decades (2000–2020) of intensive agricultural development, construction of reservoirs, and reduced river flows, the water level of Lake Urmia in northwestern Iran decreased by 6.5 m from a historical maximum of 1278 m in 2000 to 1271.5 m in July 2020, during which time the lake lost almost 45% of its area and 85% of its volume [16]. Figure 3 shows the trend of lake water depletion from 1975 to 2018.
The water area of Urmia Lake was estimated to be 5412 km2 in 1975. UL’s surface area decreased by more than 5000 km2 between 1995 and 2014, despite the lake’s water surface area growing after that. According to the Urmia Lake Restoration Program report (ULRP), in 2016, the increase in rainfall in the whole basin, especially in some stations, was about 43% compared to the long-term average) [17]. The water surface area increased by 1490 km2 in 2016, whereas the salt body shrank by 348 km2. In August 2018, the lake’s water surface area was estimated to be 1624 km2 (1852 km2) [18].
In the Urmia lake basin (Refare to Figure 2), more than 36 cities and 3150 villages have more than 5 million inhabitants (in this study, we have assumed these settlements to be an integrated system, whether or not environmental impacts have disrupted the system). Important demographic characteristics of the population within the ecological zone (a zone or area characterized by extensive but relatively homogeneous natural vegetation formations) [1], which is subject to an increasing old-age dependency ratio, a decreasing gender dependency ratio as a result of male labor migration, rising unemployment, and rapidly rising literacy [19]. Table 1 shows Urmia Lake’s key ecological, hydrological, climate, social, and economic data characteristics.
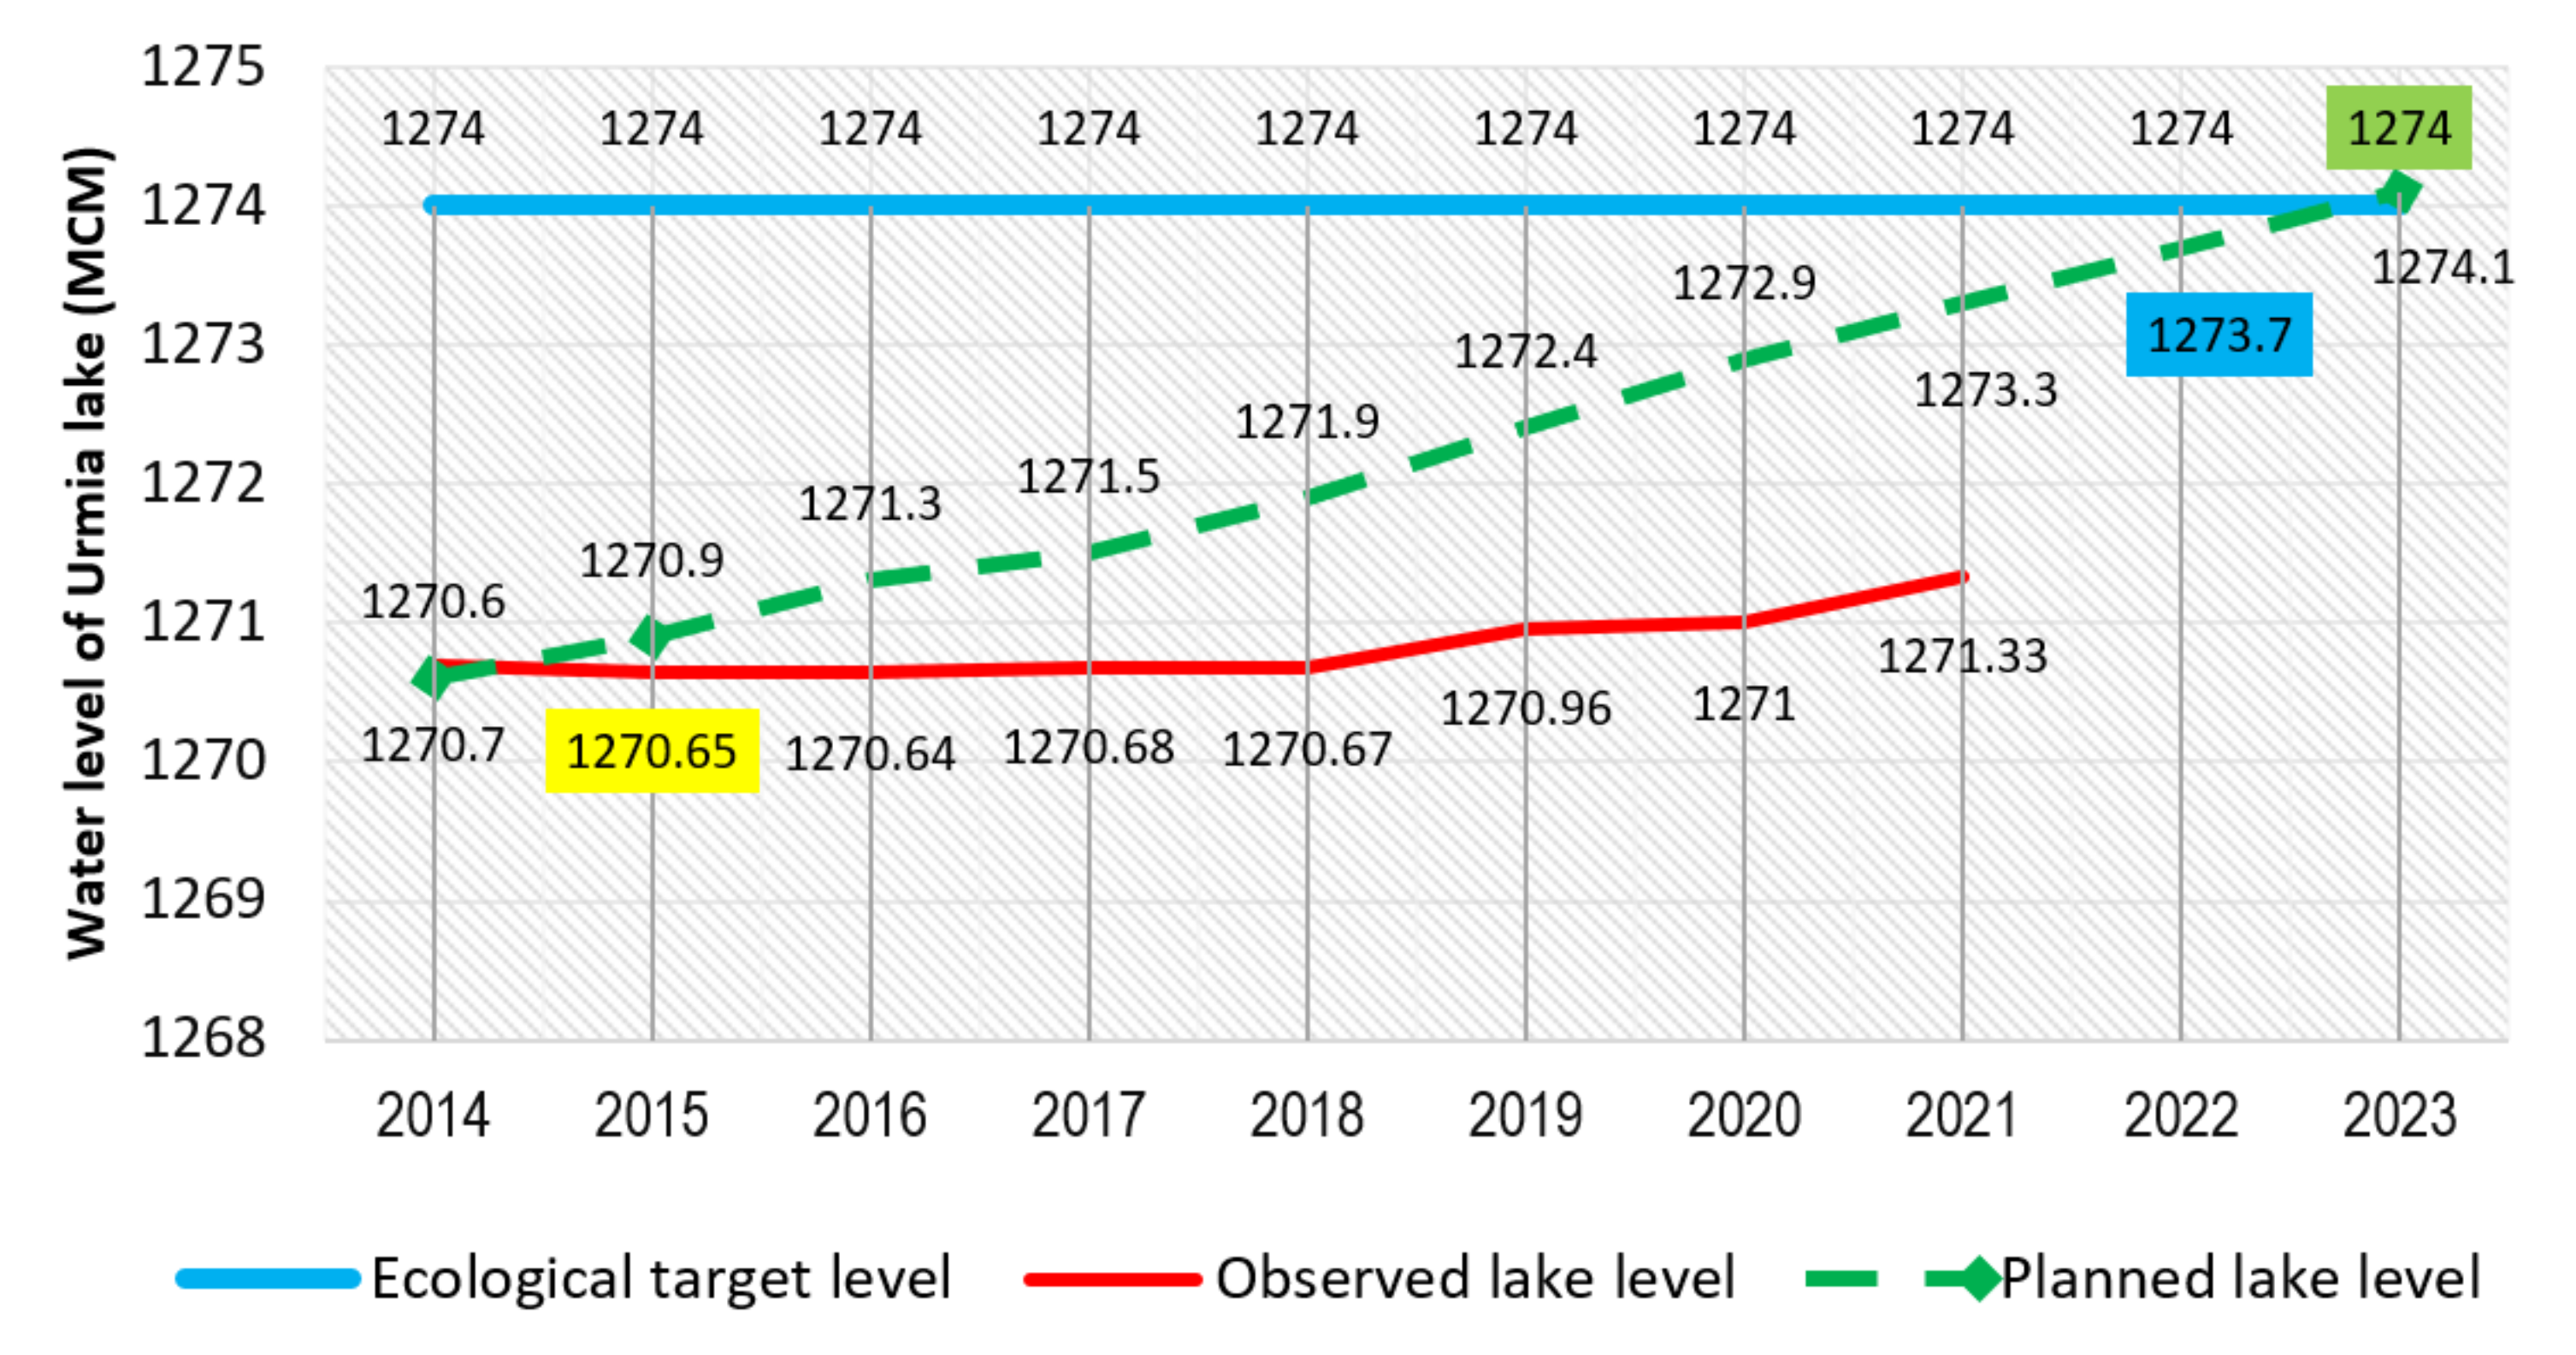
One of the most important government programs to address the declining lake levels was the Urmia Lake Restoration Program. ULRP was launched in 2013 under the responsibility of the Ministry of Energy and in cooperation with the Ministry of Agriculture and the Iranian Ministry of Planning and Budget Organization to apply integrated solutions in the field of lake basin management and present several solutions at Sharif University of Technology. As Figure 4 shows, the vision of the ULRP is to reach ecological level (1274MCM).
According to Figure 4, Lake Urmia restoration program has been planned in three steps, as follows: (1) the stabilisation period (2014–2016)—the main goal in this period is to stabilise Lake Urmia’s level and implement projects to reduce the potential impacts of the persistence of Lake Urmia; (2) the restoration period (2016–2022)—the main objective of this period is to implement all solutions for the lake’s water supply and gradually increase its level (1273MCM); and (3) final restoration (2023)—the expected purpose of this period is to stabilise the lake’s restoration conditions and create the necessary conditions for the final restoration and sustainable maintenance of lake conditions (1274.1 MCM).

2.2. Methodology

This study is based on cross-impact analysis, which falls under the category of cross-impact analysis approaches. The most popular methods are Gordon’s cross-impact method, SMIC, BASICS, MICMAC, KSIM, and the cross-impact balance approach [20]. Accordingly, this study used the Delphi Survey for data collection and MICMAC for analysis due to the qualitative database.

2.2.1. Delphi Survey: Foresight Desirability

Foresight departs from probabilistic prediction by fostering a notion of the future as variously imagined, shaped, and influenced through strategic planning and intervention [21]. Opening up foresight processes implies the advantage of integrating valuable sources of knowledge more effectively and systematically to make future decisions based on comprehensible facts [22]. Foresight methods allow individuals and organisations to imagine different future scenarios and plan for greater future resilience [23]. Consequently, foresight can identify benefits and constraints in terms of innovative solutions [24]. There are many methods of foresight or predicting the future. One of the leading tools in foresight is the Delphi method. Delphi is defined as a means of organizing a group communication process to allow a group of people to address a difficult problem as a whole. Through the four features of Delphi: (1) anonymity; (2) feedback; (3) statistical aggregation of group responses; and (4) iteration, experts can achieve more objective results, such as more objective probability estimates [23]. Delphi and other expert panel methods for planning the future are also widely used in environmental studies [25]. We performed a three-round Delphi study between November 2019 and June 2020, comprising three overarching phases, as follows:
  • Round 1: In the first Delphi round, key experts were identified. There are no clear guidelines on the number of participants included in studies that use Delphi questioning as the sample is purposively selected, depending on the problem being studied [26]. Some studies have used 15 participants, while others have used 60 [27]. In this paper, the target panel of experts included 35 people (Table 2). They were selected based on published papers (also five people who have worked on the Aral Sea); recommendations by other scientists; and consultations with directors of scientific institutions, such as the Lake Urmia restoration program (ULRP), the Urmia Lake research Institute, and Urmia and Tabriz Universities. Except for five people (X11, 12, 13, 15, and 17), all experts had local knowledge (village level) and regional knowledge (research across districts).
Due to the dispersion of experts, at first, a meeting was held in cooperation with the Lake Urmia Restoration Centre with committee members led by a futurist. In this meeting, members discussed the environmental consequences of Lake Urmia in the future. Then, a questionnaire was sent to other experts. The questionnaire included an open-ended question that was in the spirit of brainstorming. In this question, the experts were asked, “What will be the environmental impact of drying up Lake Urmia? (with a 10-year horizon)”. A total of 35 (100% response rate) completed the first round. Subsequently, all responses were coded using the qualitative technique of grounded theory (open and axial coding). Coding of the open-ended questions of the questionnaire resulted in the identification of 80 general concepts, and axial coding took the form of 62 categories and 35 main outcome indicators.
  • Round 2: The second round was conducted with experts at Urmia Lake Restoration Centre. Nine experts (25.71% response rate) participated in the second round. In this round, the results of the first round were discussed. Finally, 17 environmental consequences were selected, which were agreed upon by the panel members.
  • Round 3: The third round was also via email. We emailed 17 environmental consequences (which had been agreed upon in Round 2) to all 35 participants, and 27 experts participated in Round 3 (77.14% response rate). After applying some changes by the respondents, the results of the expert responses were summarized in Table 3.

2.2.2. Cross-Impact Analysis: MICMAC

From a collection of variables first determined by a committee of experts, the MICMAC technique of structural analysis tries to find the most essential variables inside a system and their role [28]. The three steps of MICMAC are as follows:
  • Definition of system variables—the system variables are determined using expert opinions, brainstorming, and a literature review. At this point, the result is a jumbled list of consequenses.
  • Identification of the relationships among the variables—the second stage is to specify the link between the variables after they have been identified. Table 4 shows the matrix of direct influence (MDI) is the name given to this matrix. Each MDIi j cell illustrates how much variable I influences variable j. For this purpose, the initial matrix was forwarded to experts for classification. Five members (14.29%) of the expert panel participated in this step. The grading was carried out as follows.
Influences range from 0 to 3, with the possibility to identify potential influences:
0: No influence;
1: Weak;
2: Moderate influence;
3: Strong influence;
P: Potential influences.
3.
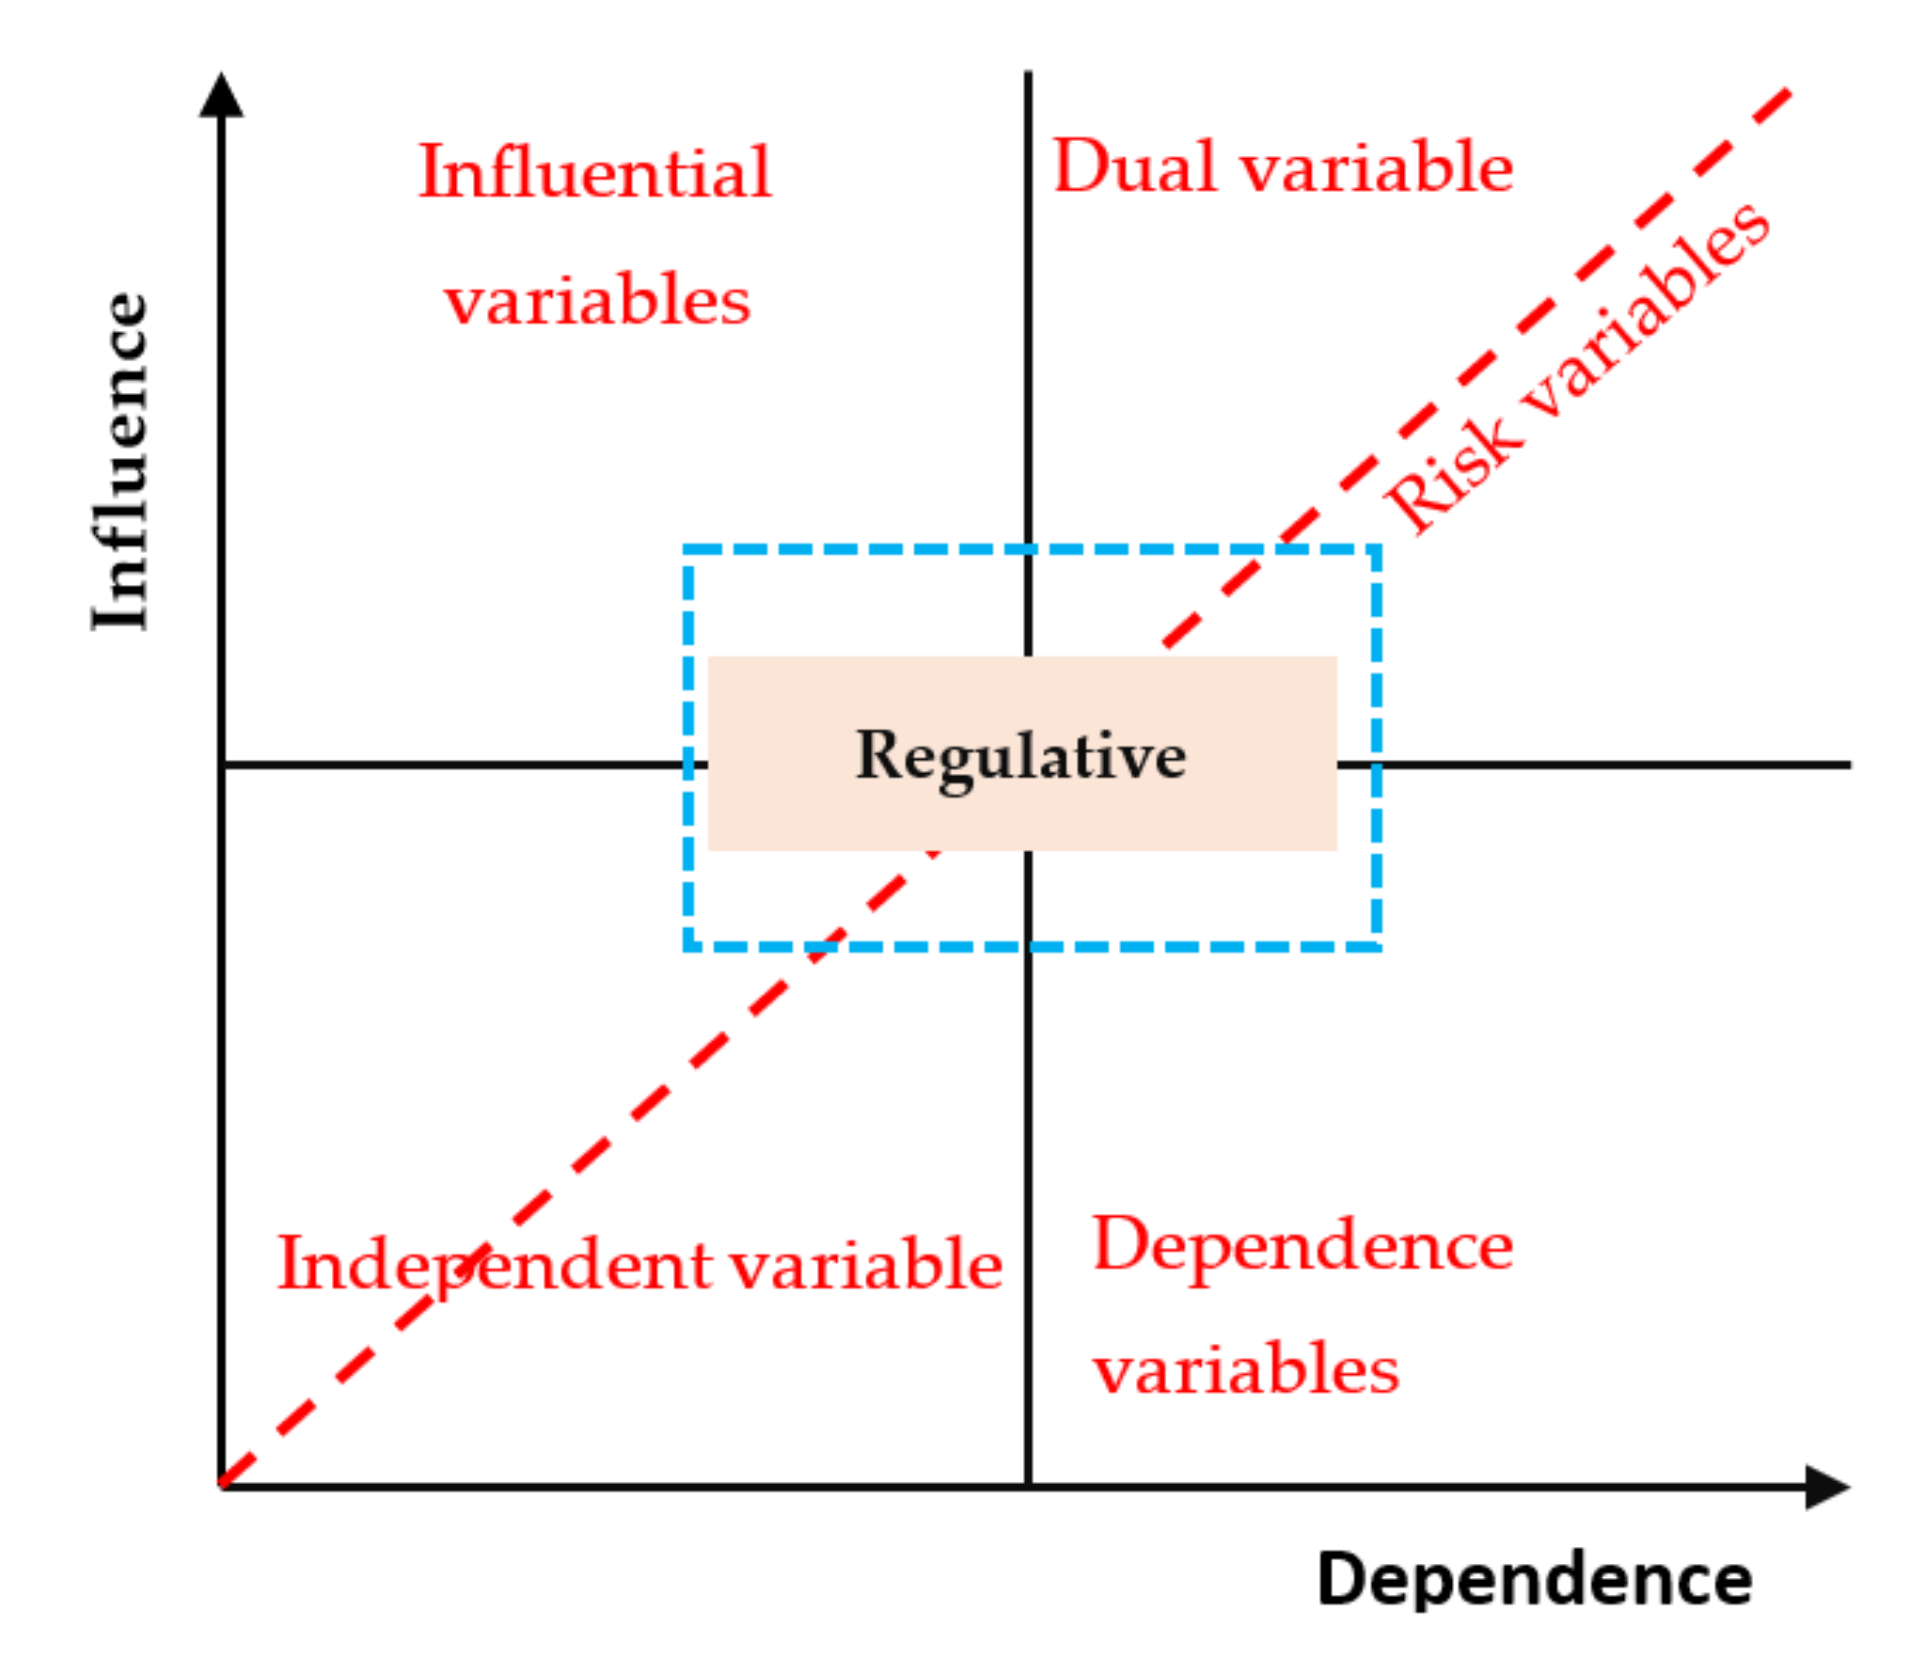
Identification of key variables—in the final step, the results from the use of the MICMAC software establish influence–dependence (Figure 5) and indirect (Figure 3) relations between variables into grids [29].
The MICMAC analysis is used to cluster consequences based on their type. Clustering is performed based on the driving and dependency power of each barrier [30]. Figure 5 shows the output of MICMAC and how to distribute the variables.
The results are discussed in the following section.

3. Results

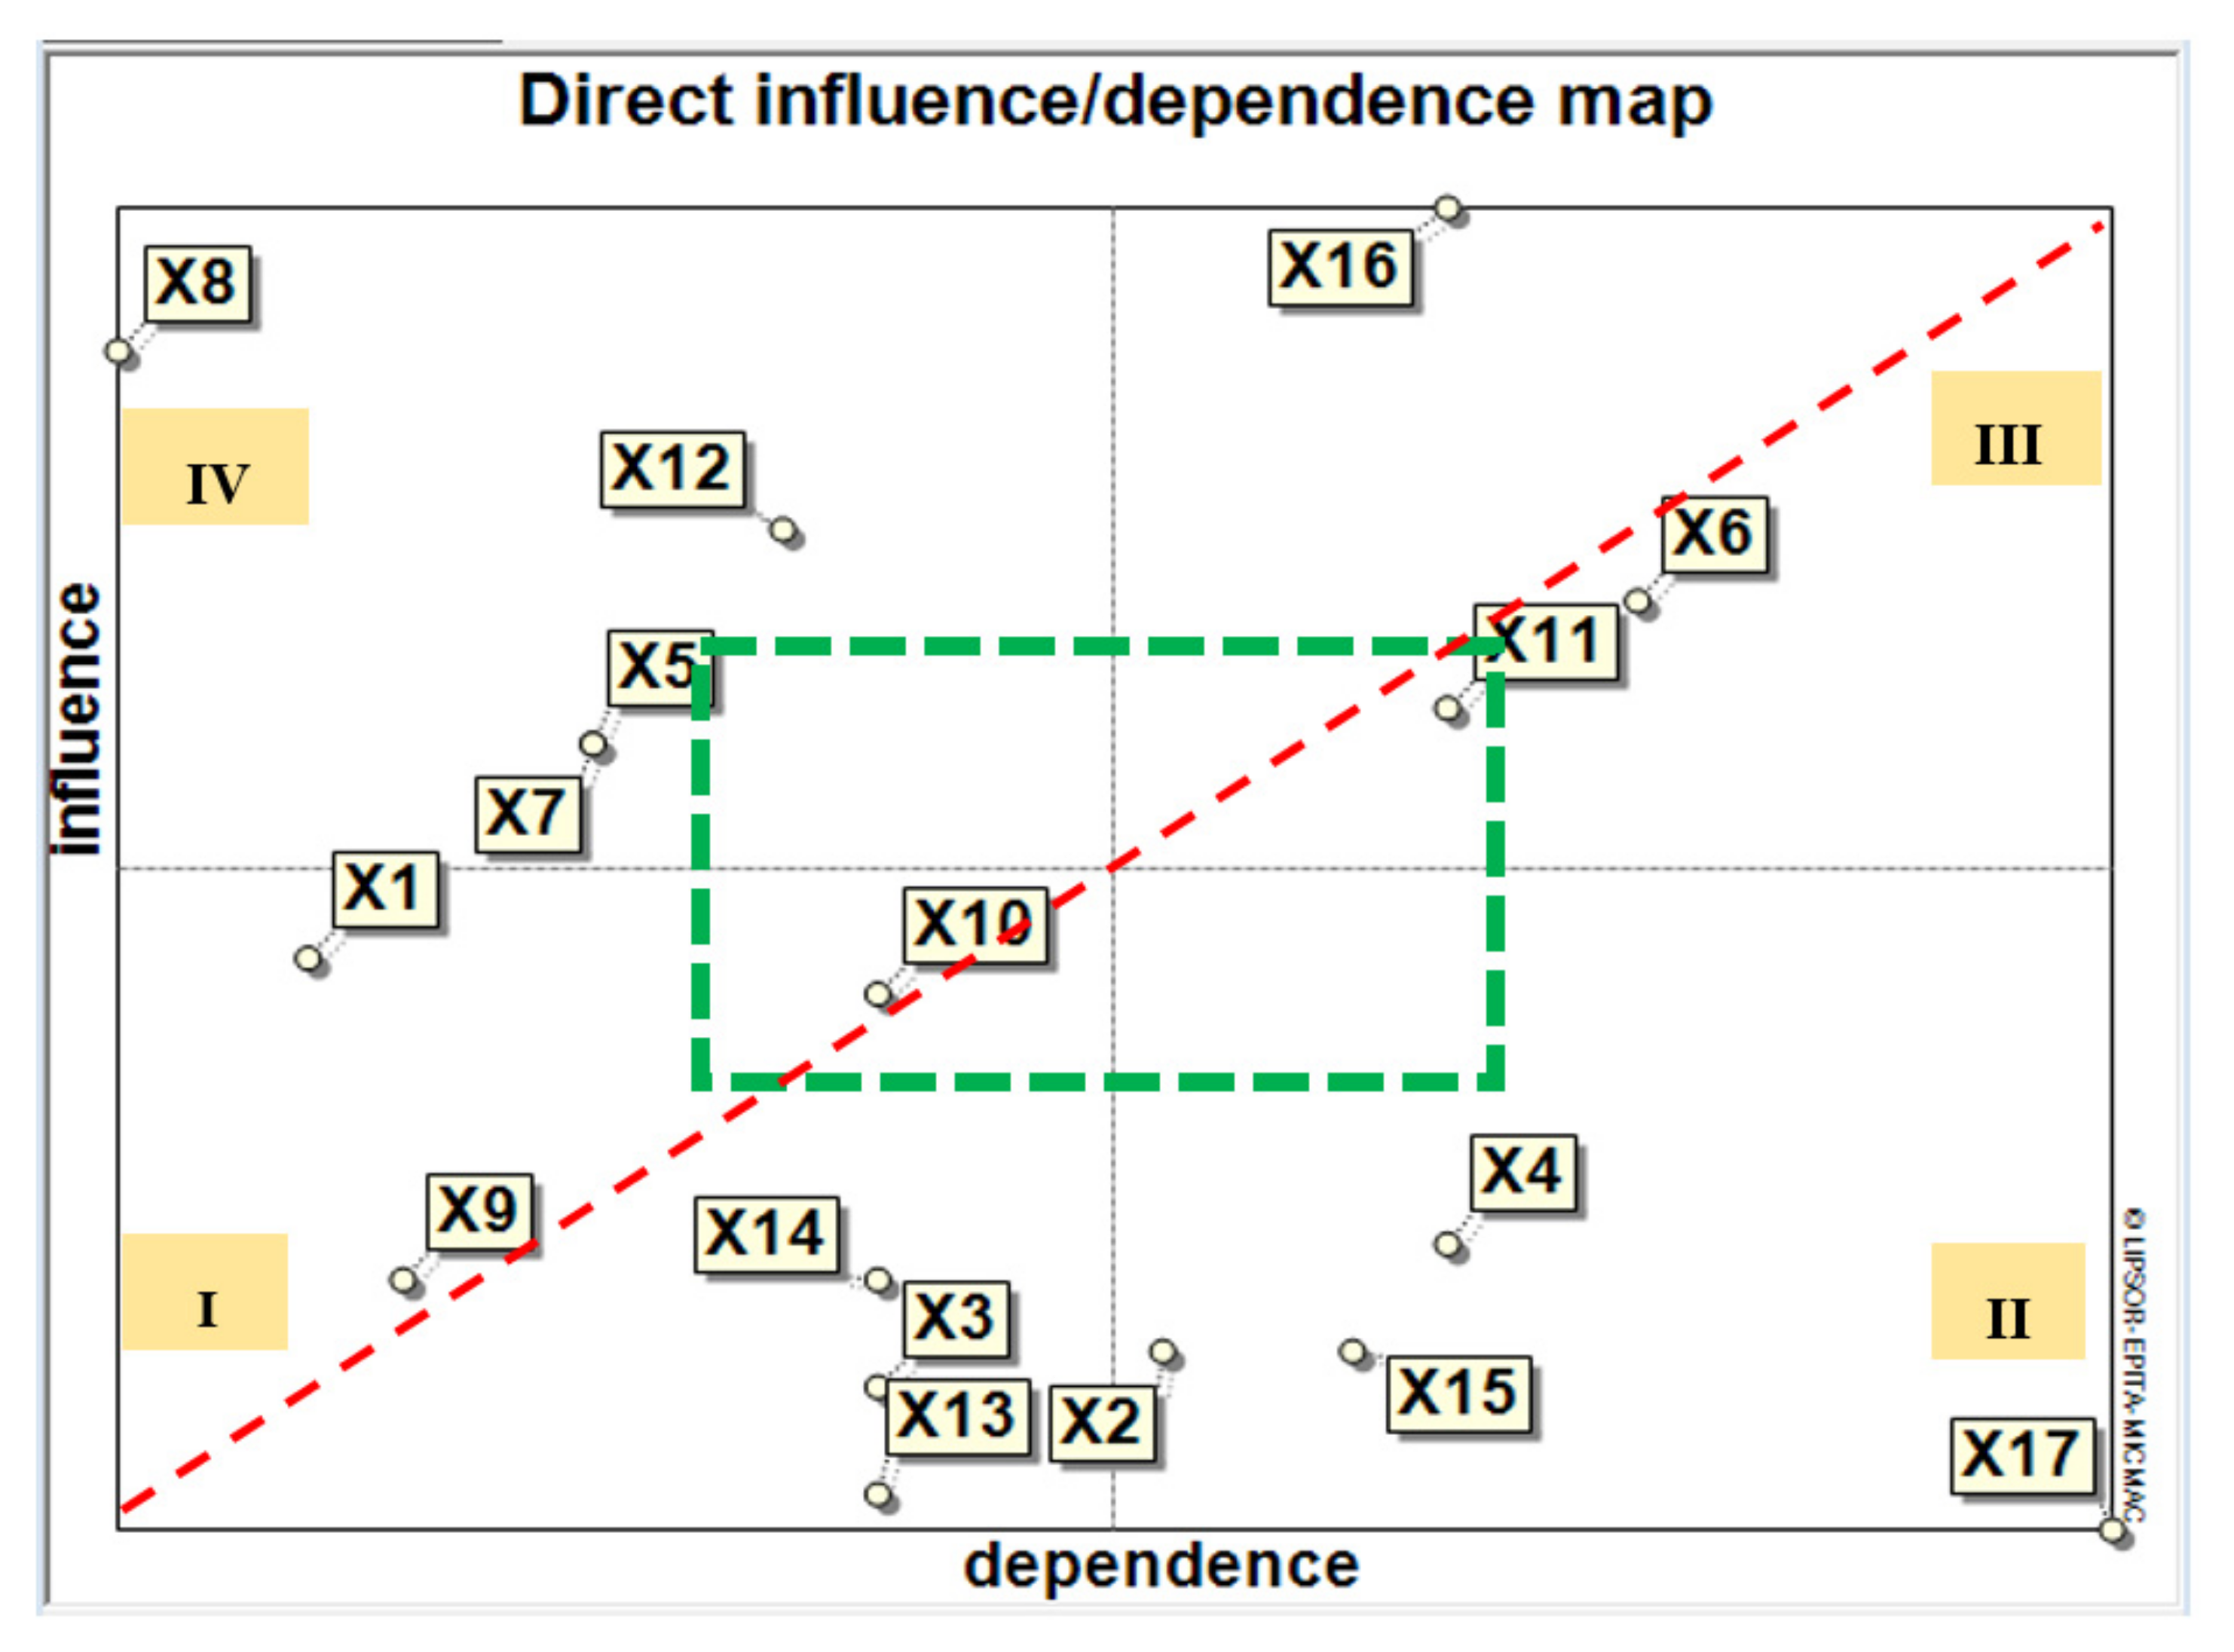
Figure 6 shows a MICMAC diagram that was created by changing the reachability matrix. A MICMAC diagram is useful for determining driving and dependency power. If the value of dependence power is higher, other barriers should be addressed before the highest dependence power barrier is removed. With more driving power, other hurdles can be readily overcome after this one is removed.
The grid is divided into four quadrants, each representing one of four different categories of variables. The differences between the variables are in the values for influence and dependence. Decreased livability in surrounding cities (X17) will have the largest dependence, and groundwater decline and depletion (X8) will have the most significant influence on the system (see page 4, row 103). Moreover, the other variables are as follows:
Autonomous barriers (I): Quadrant I represents autonomous environmental consequences and consists of increased temperature (X1), air pollution (X9), plant extinction species (X10), threats to the food chain (X14), flooding (X3), and incidence of different types of diseases (respiratory, skin diseases, and various cancers) (X13). Dependence and conductivity are low, and a change in these variables does not lead to a serious change in the system.
Dependent barriers (II): Quadrant II shows the dependent barriers, which are disturbance in the ecosystem structure of the lake (X15), extinction of wildlife (X2), decreased viability in surrounding cities (X17), and changes in cultivation patterns (X4). They have strong dependence and poor conductivity. These variables basically have high influence, but less impact on the system.
Linkage barriers (III): Quadrant III shows the linkage barriers, including dust storm (X6), drought (X11), and desertification (X16), which are all possible.
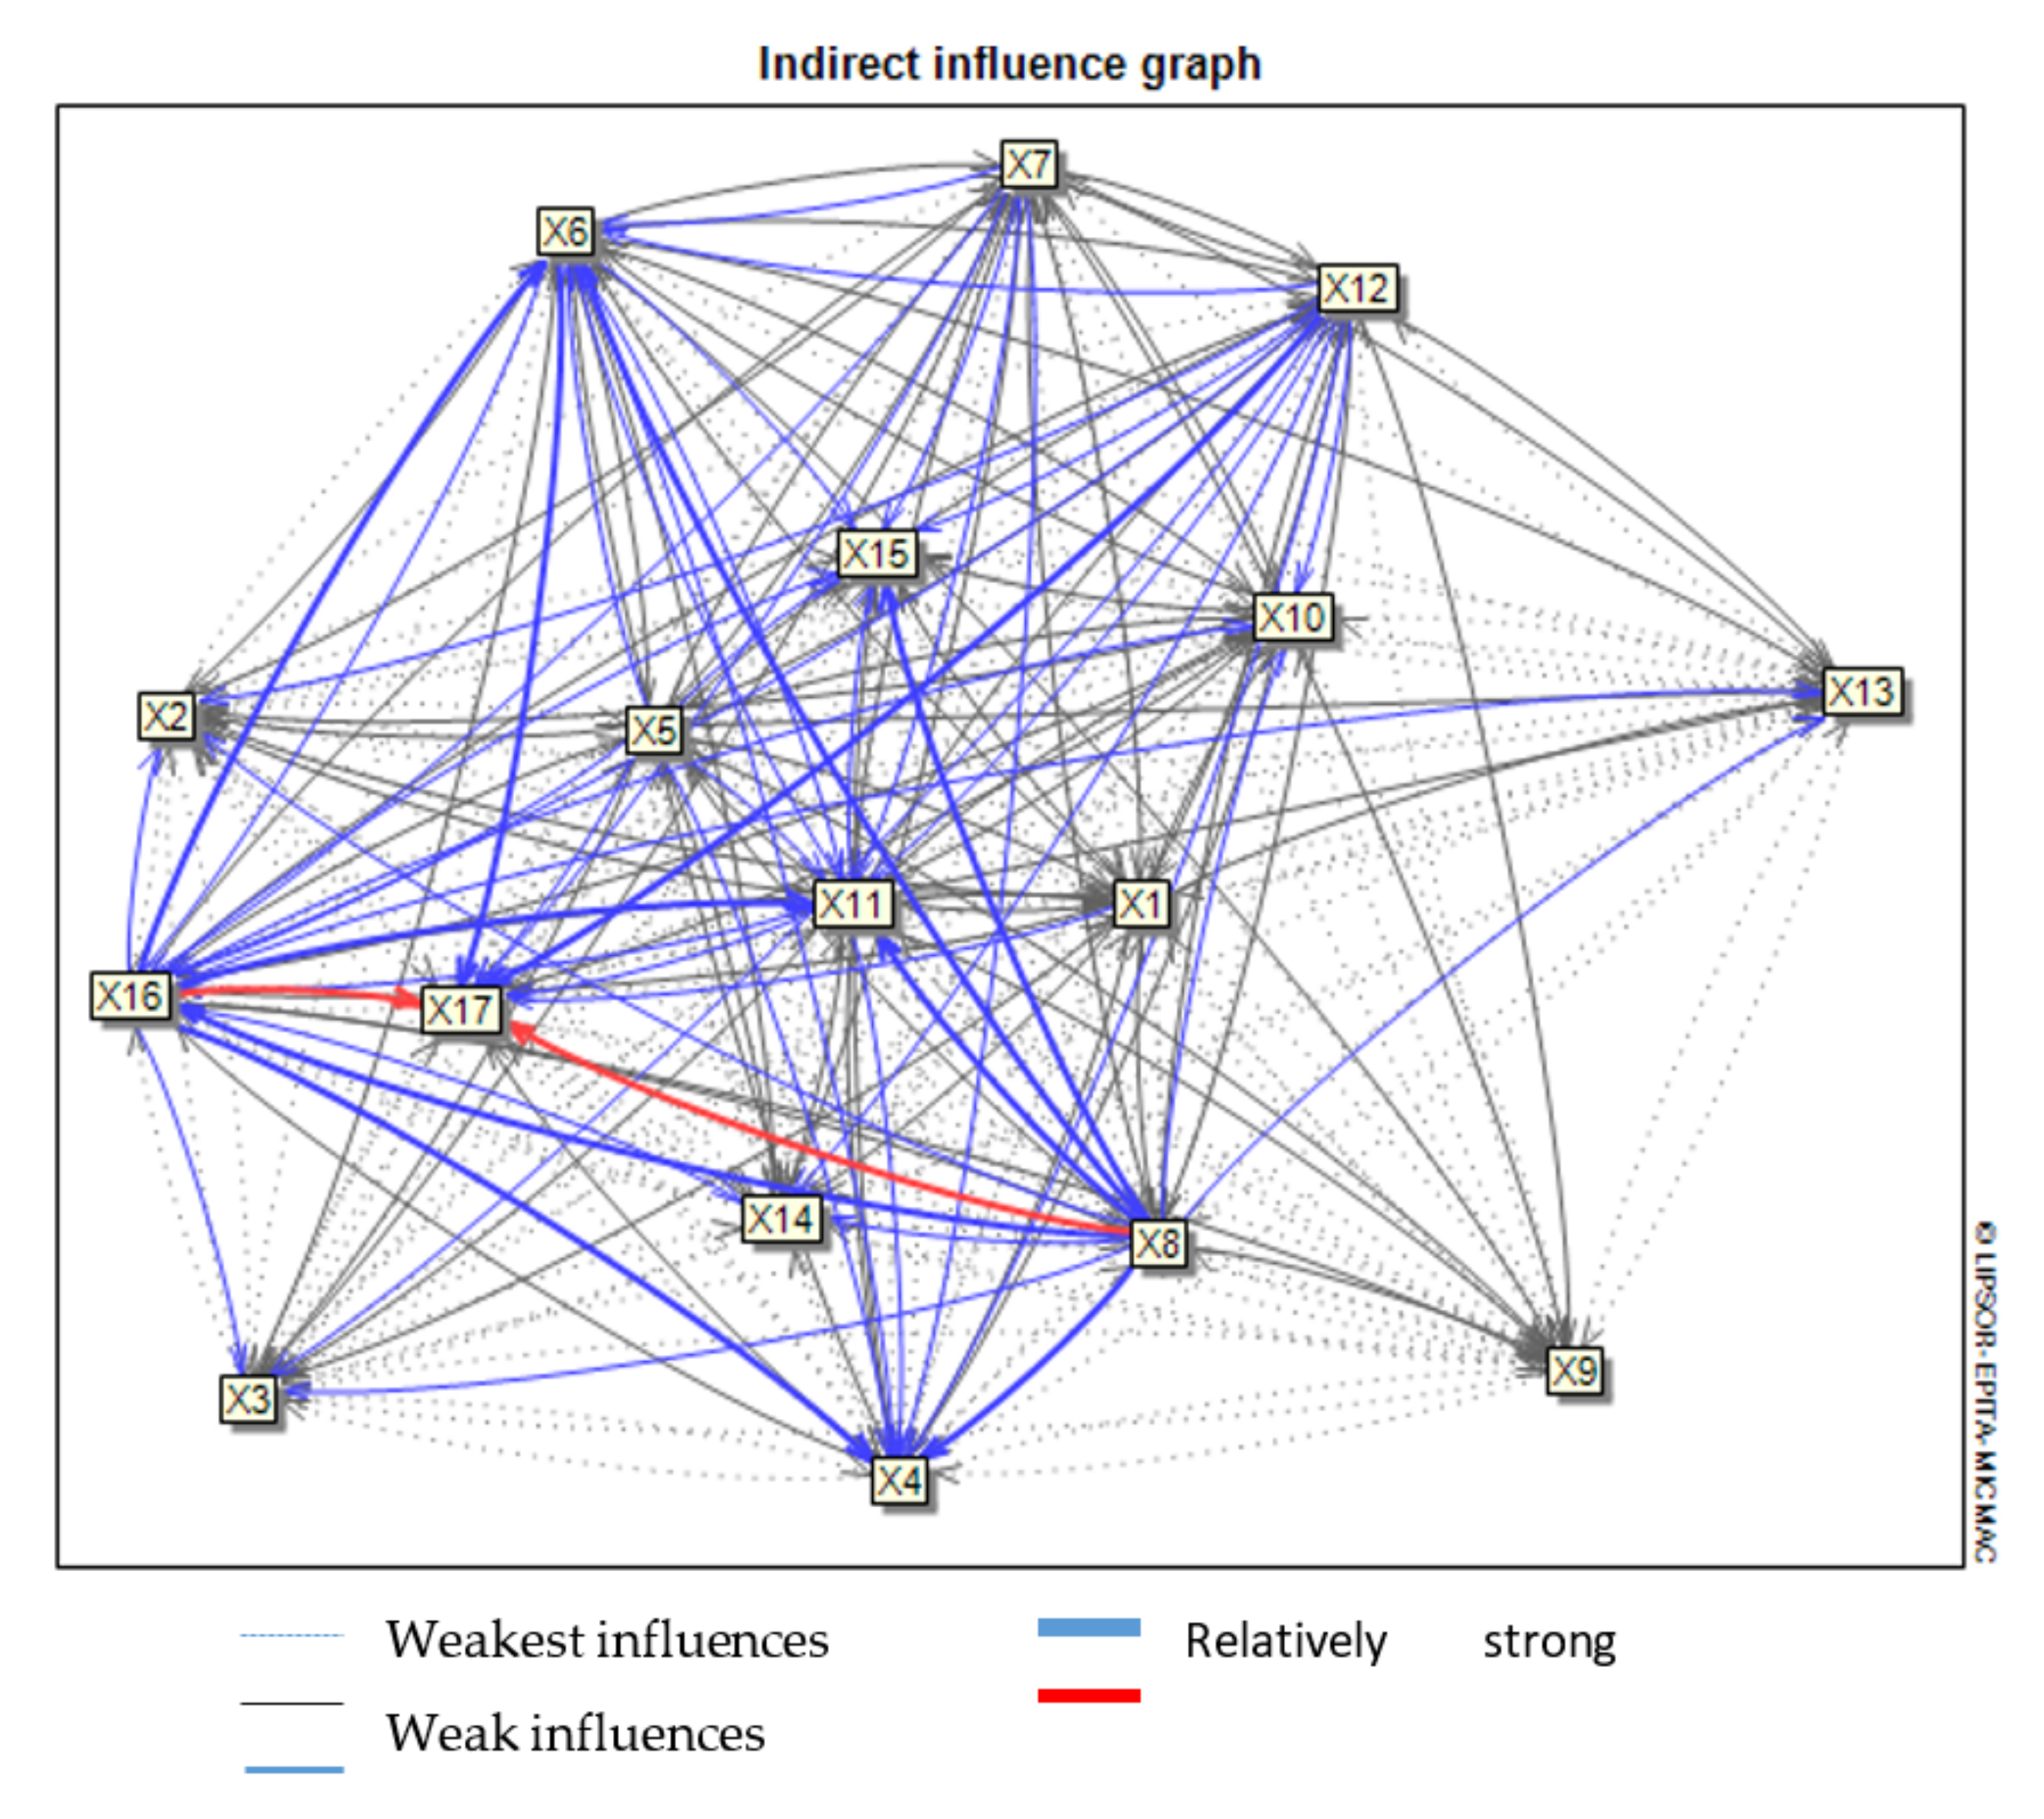
Independent barriers (IV): Quadrant IV consists of driving factors with a strong driving force but a weak dependent force. In these barriers, four environmental consequences—reducing pasture area (X5), soil and water salinity (X7), and groundwater decline and depletion (X8), and destruction of surrounding agricultural lands (X12)—were found to play a controlling role in environmental changes in the case study area. Overall, any small change in these variables leads to fundamental changes in the entire system as Figure 7 shows. We will continue research into these variables.
Groundwater decline (X8) and destruction of surrounding agricultural lands (X12) are the most important and effective consequences in this system. Desertification (X16) and groundwater decline (X8) also have the strongest influence on the quality of life in cities (X17).

4. Discussion

Planning for the future predicted by our current data, accepting uncertainty, and preparing for the improbable gives us a chance to select a better plan. According to the results of this study, four driving forces were identified, which means that by controlling and monitoring these driving forces, other consequences of the drying up of Lake Urmia can be counteracted in the future. These driving forces are the driving factors that will disrupt the ecosystem of Lake Urmia.
The environmental driving force of Urmia lake dessication:
Seventeen significant factors were identified in this paper. Among the 17 factors, four factors were identified as driving forces, as seen in Figure 6.
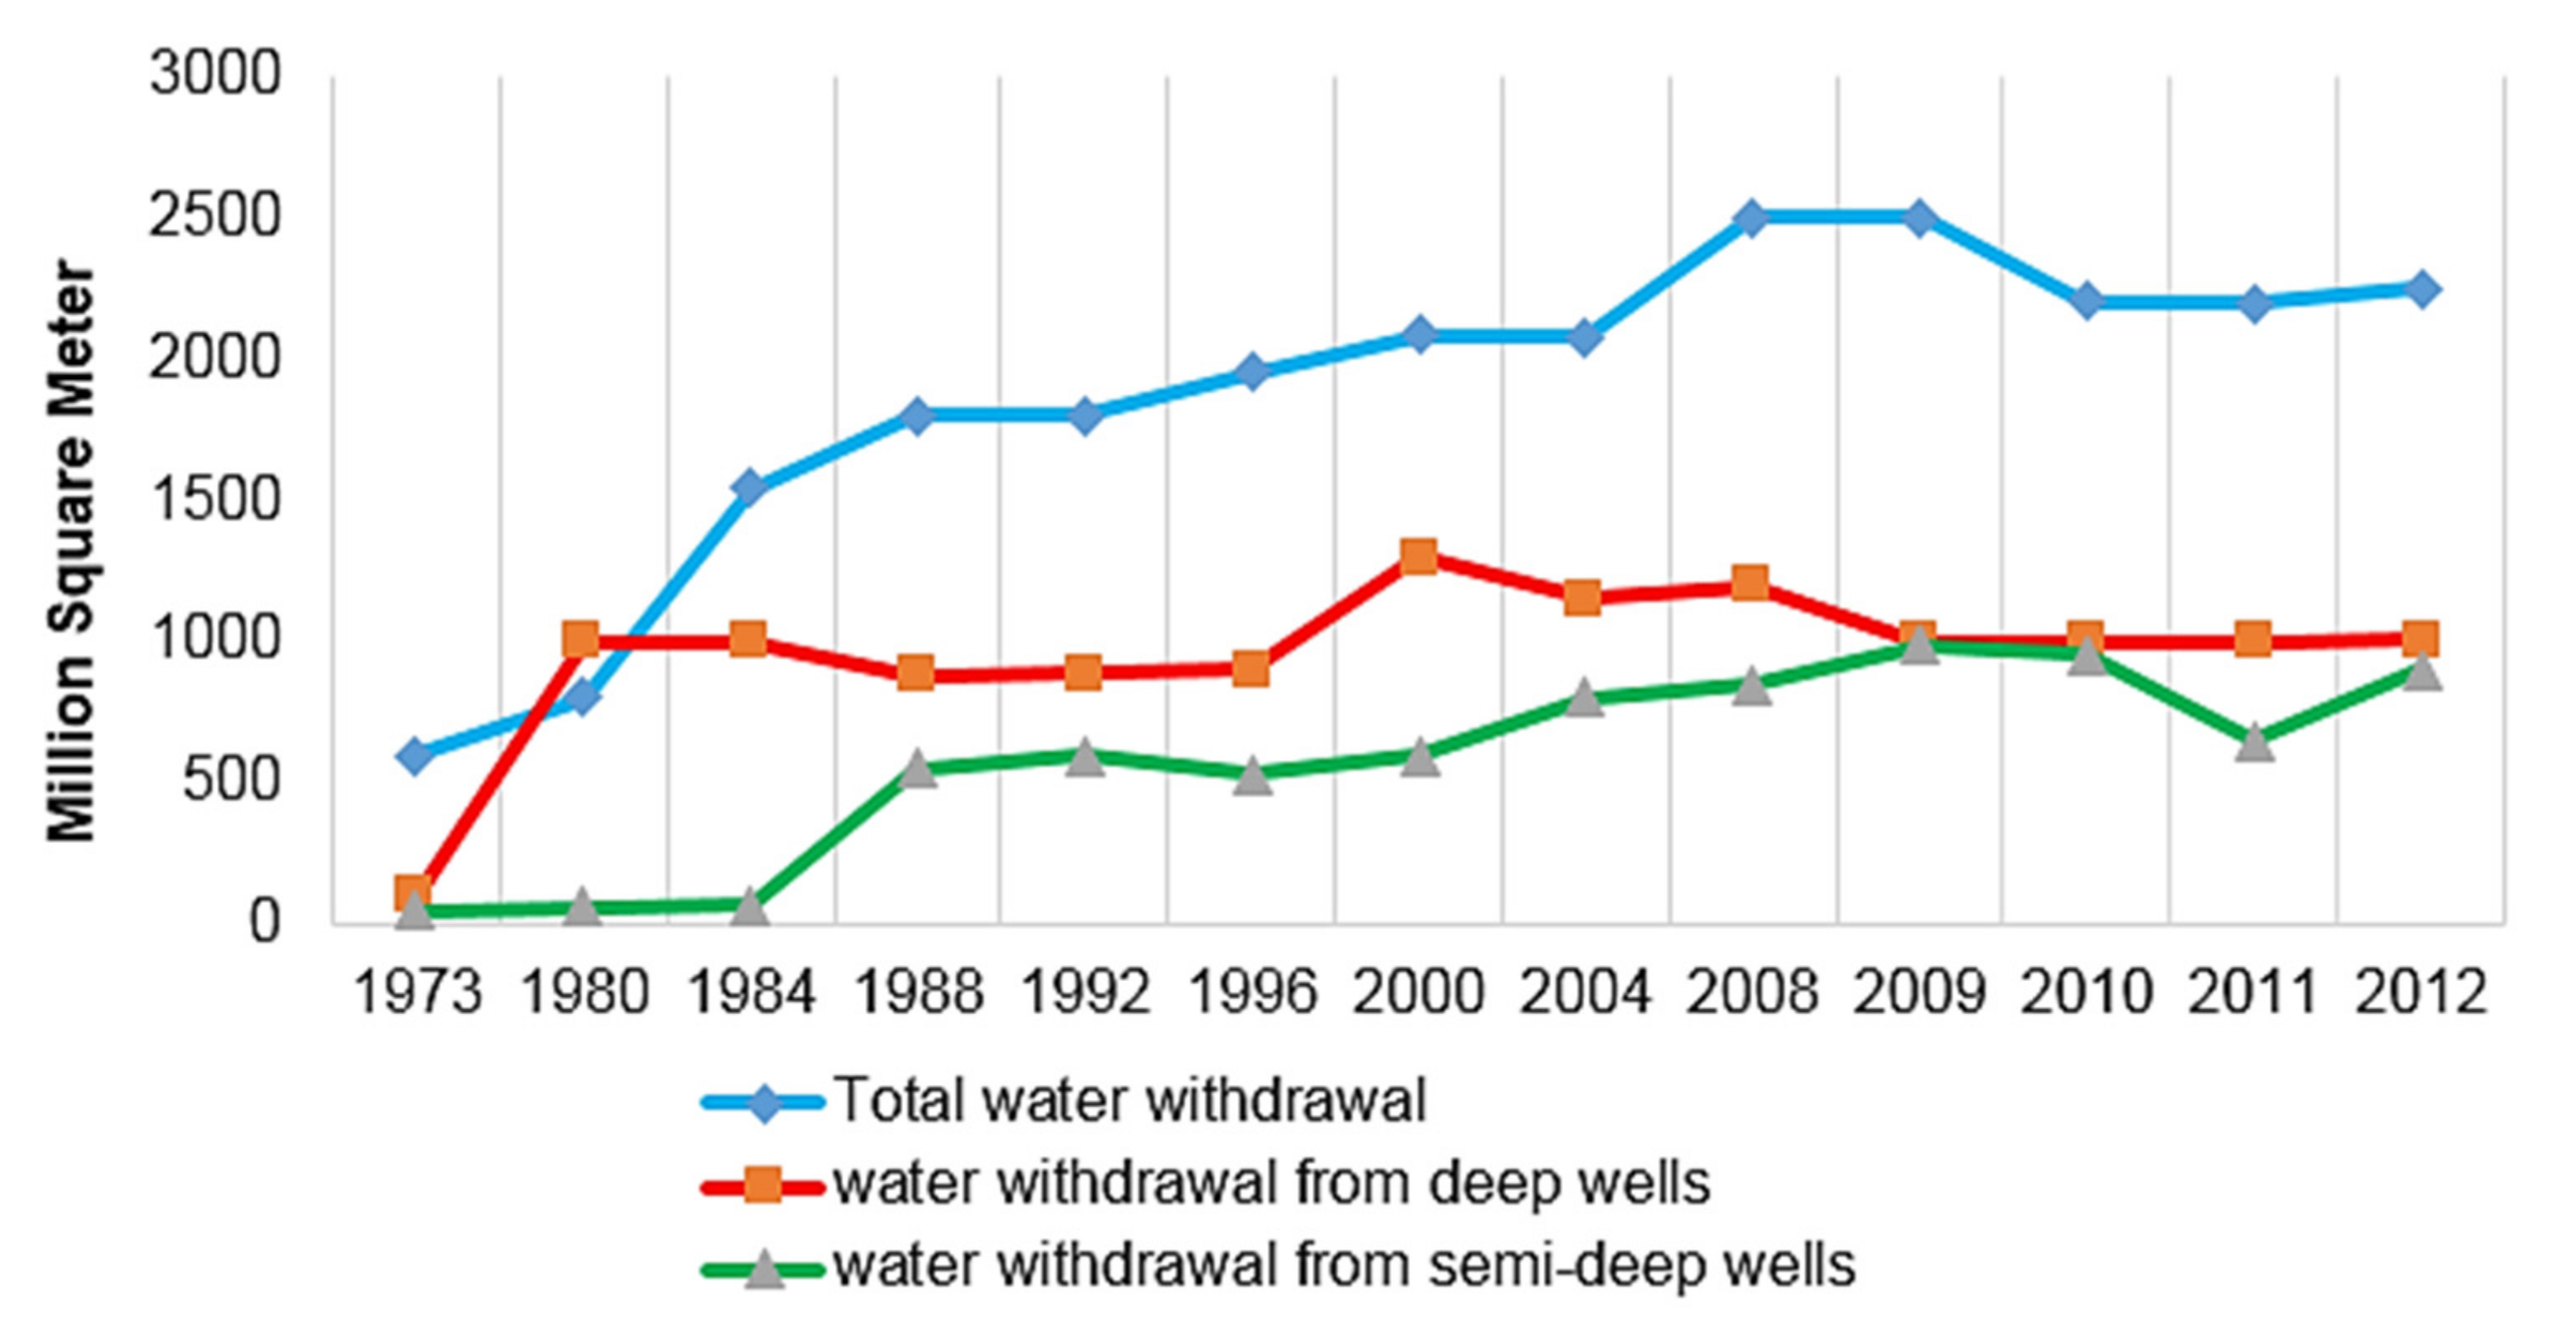
Groundwater decline and depletion: The construction of numerous dams on rivers flowing into Lake Urmia has led to a shortage of water for agriculture, and farmers have extracted groundwater by digging deep and semi-deep wells (Figure 8) to provide water for agriculture.
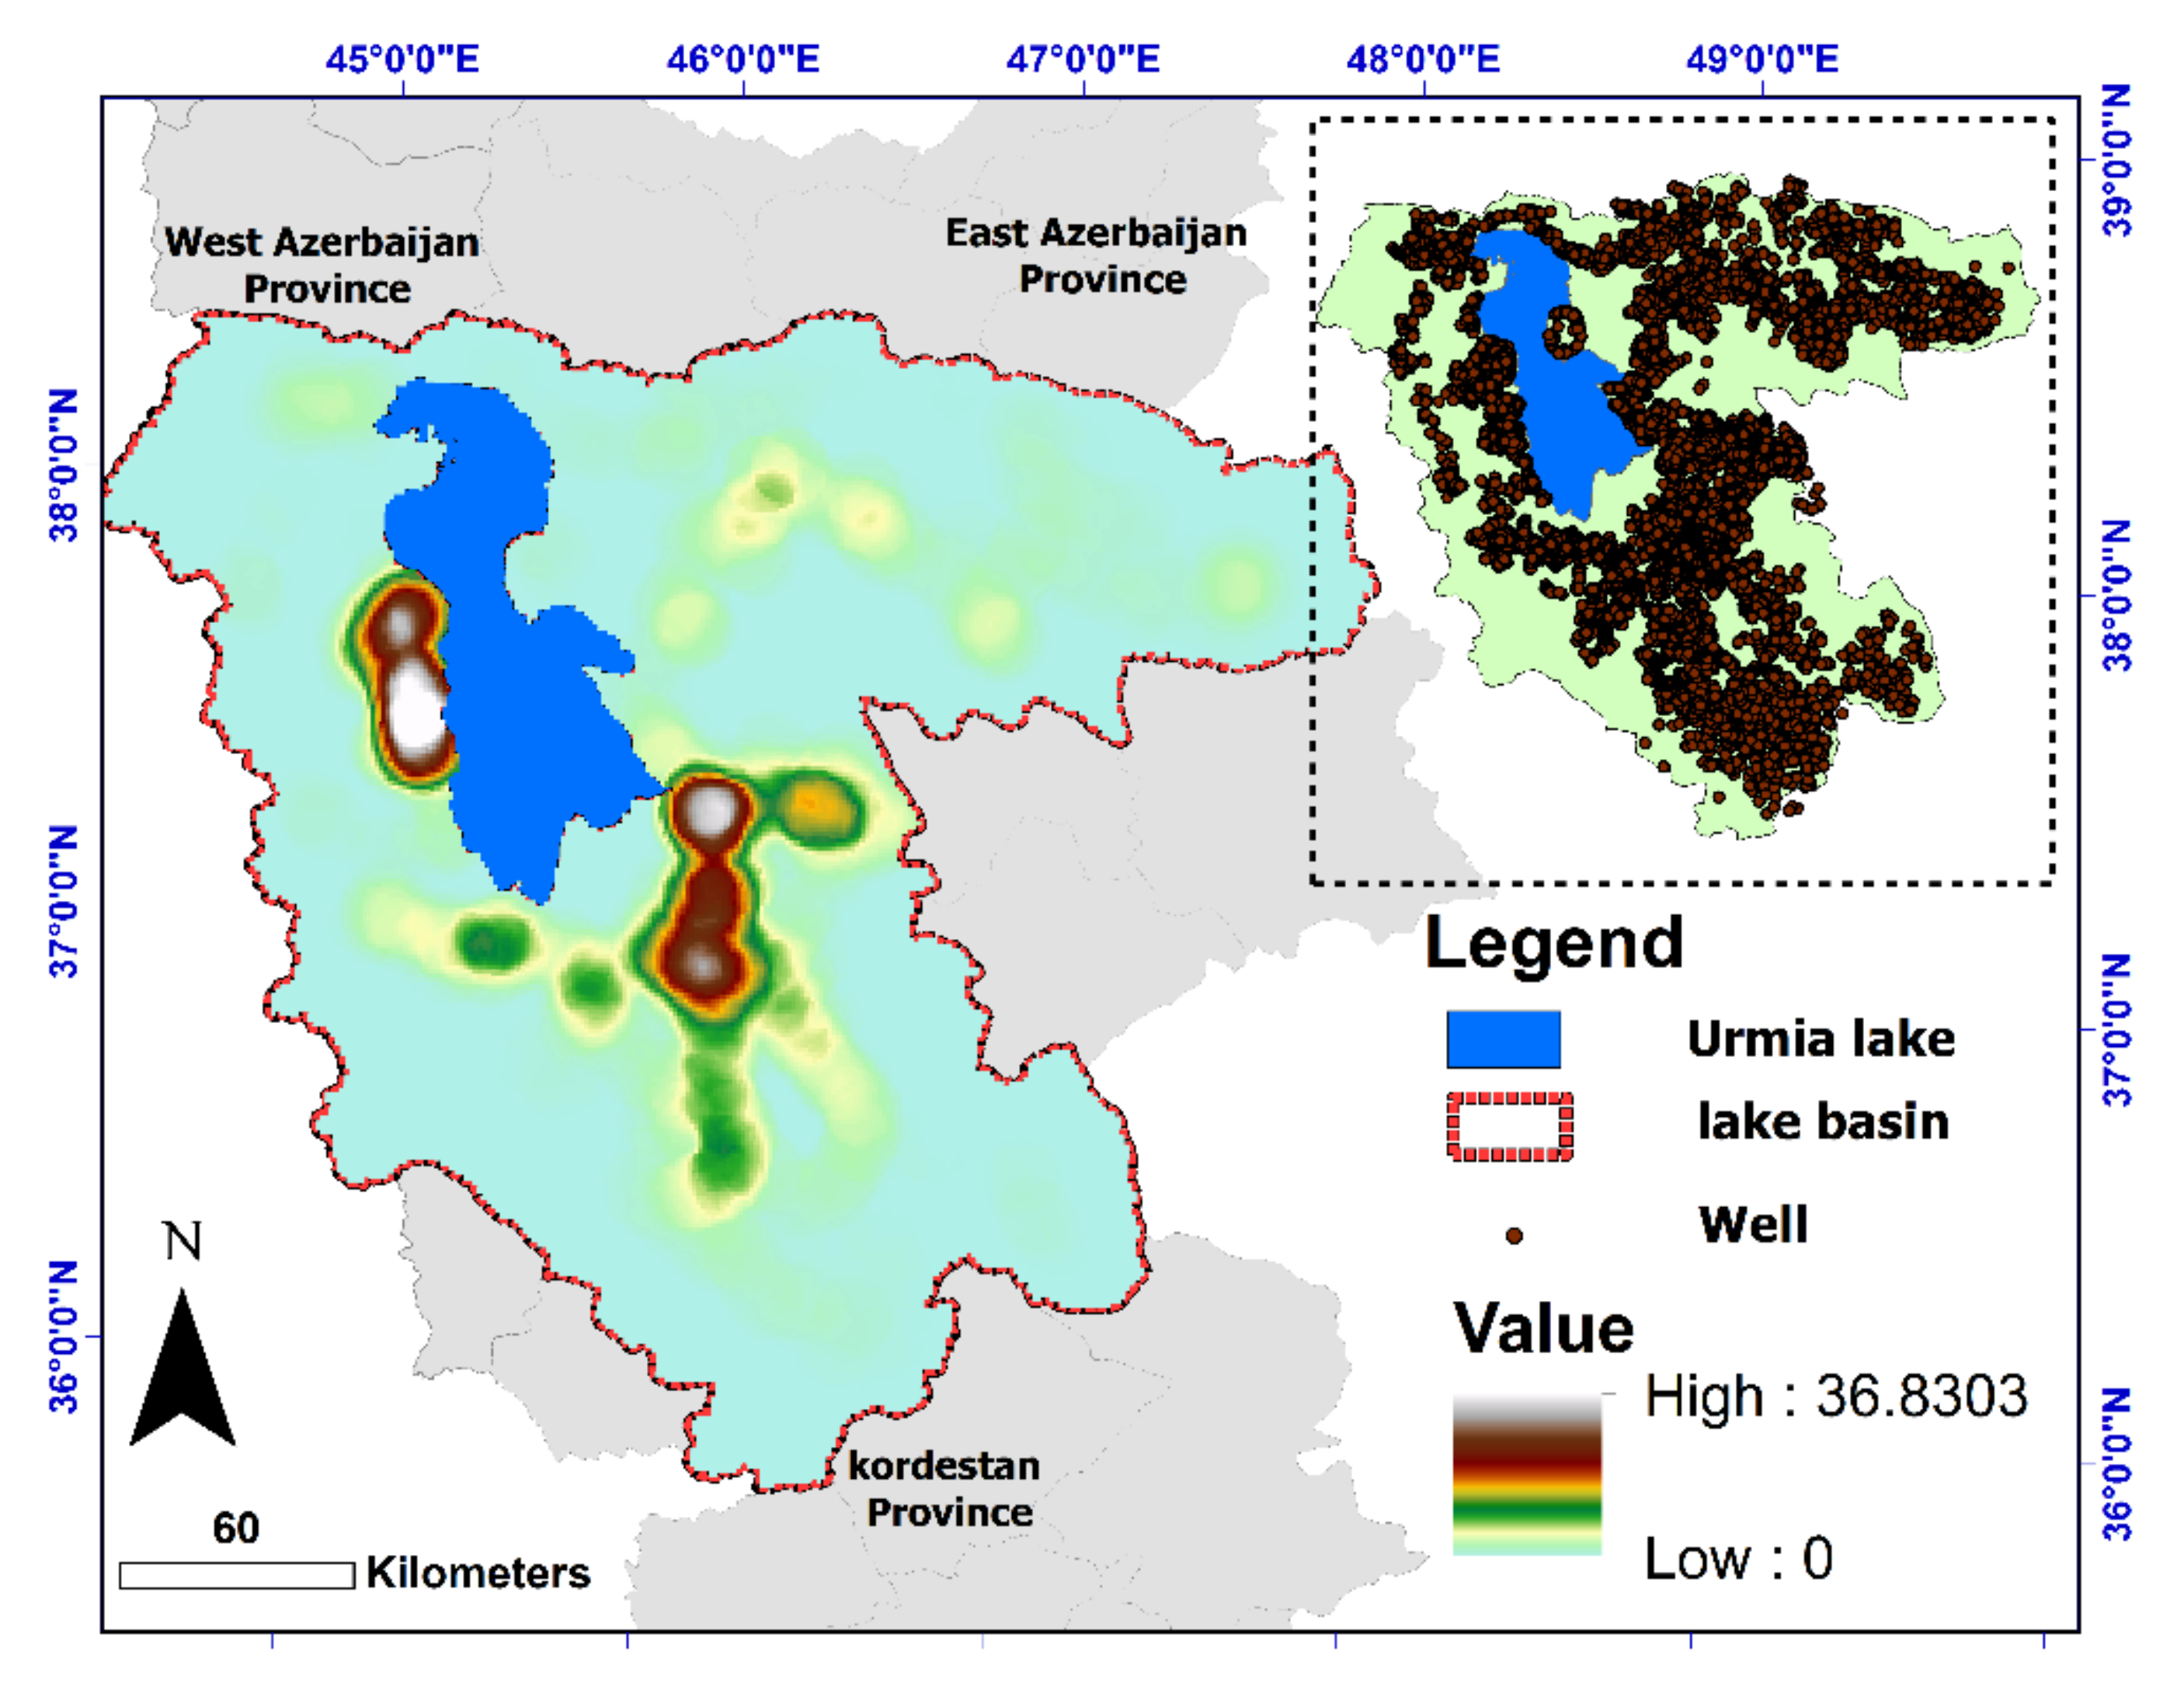
According to ULRP statistics (2019), the number of legal wells in the Lake Basin is more than 40,000. Figure 9 shows the distribution of wells in Lake Urmia’s basin. The number of semi-deep wells in the basin more than quadrupled in 2012 compared to 1982, and their respective discharges increased about sixfold. It should be mentioned that the majority of these wells are illegally drilled and used by garden and farm owners [17]. Furthermore, because there are many illegal wells, the government has limited control over groundwater abstraction, indicating a major data gap. Field-level water use is not included in current data collected near ULRP, and the existing data are either obsolete or held in inaccessible archives.
As a result, we are skeptical of the ULRP’s target of reducing agricultural water use by 40%, as we believe it will be challenging to accomplish and will have severe consequences for farmers and people in the basin. The idea could even exacerbate societal tensions; for example, a proposal to limit or restrict local farmers’ illicit use of groundwater would be met with criticism.
Reducing Pasture area: The second and strongest driving force is the loss of a large area of pasture and vegetation. Furthermore, because of the diversity of soils and topography, the Urmia Lake islands possess a diverse flora. The first report on the flora of Lake Urmia was carried out in 1990–1994 (1998) (when the lake level was at the highest water level), and the second report was in 2016–2017 [31], but when the lake level was at its lowest, this rate was reached). During this period, various events caused many changes in flora, plant communities and vegetation levels. Comparing the results of these two reports shows that the number of plant species in these salt marshes decreased from 201 species to 93 species during these two decades. Out of 28 plant genera, only 24 members remain [30]. The majority of the plants in this genus are salinity-sensitive and have been wiped out due to habitat shifts away from the lake’s edge. They play an essential role in the ecosystem’s food chain. Therefore, this consequence does not directly affect human settlements, but is the root of other natural consequences in the field.
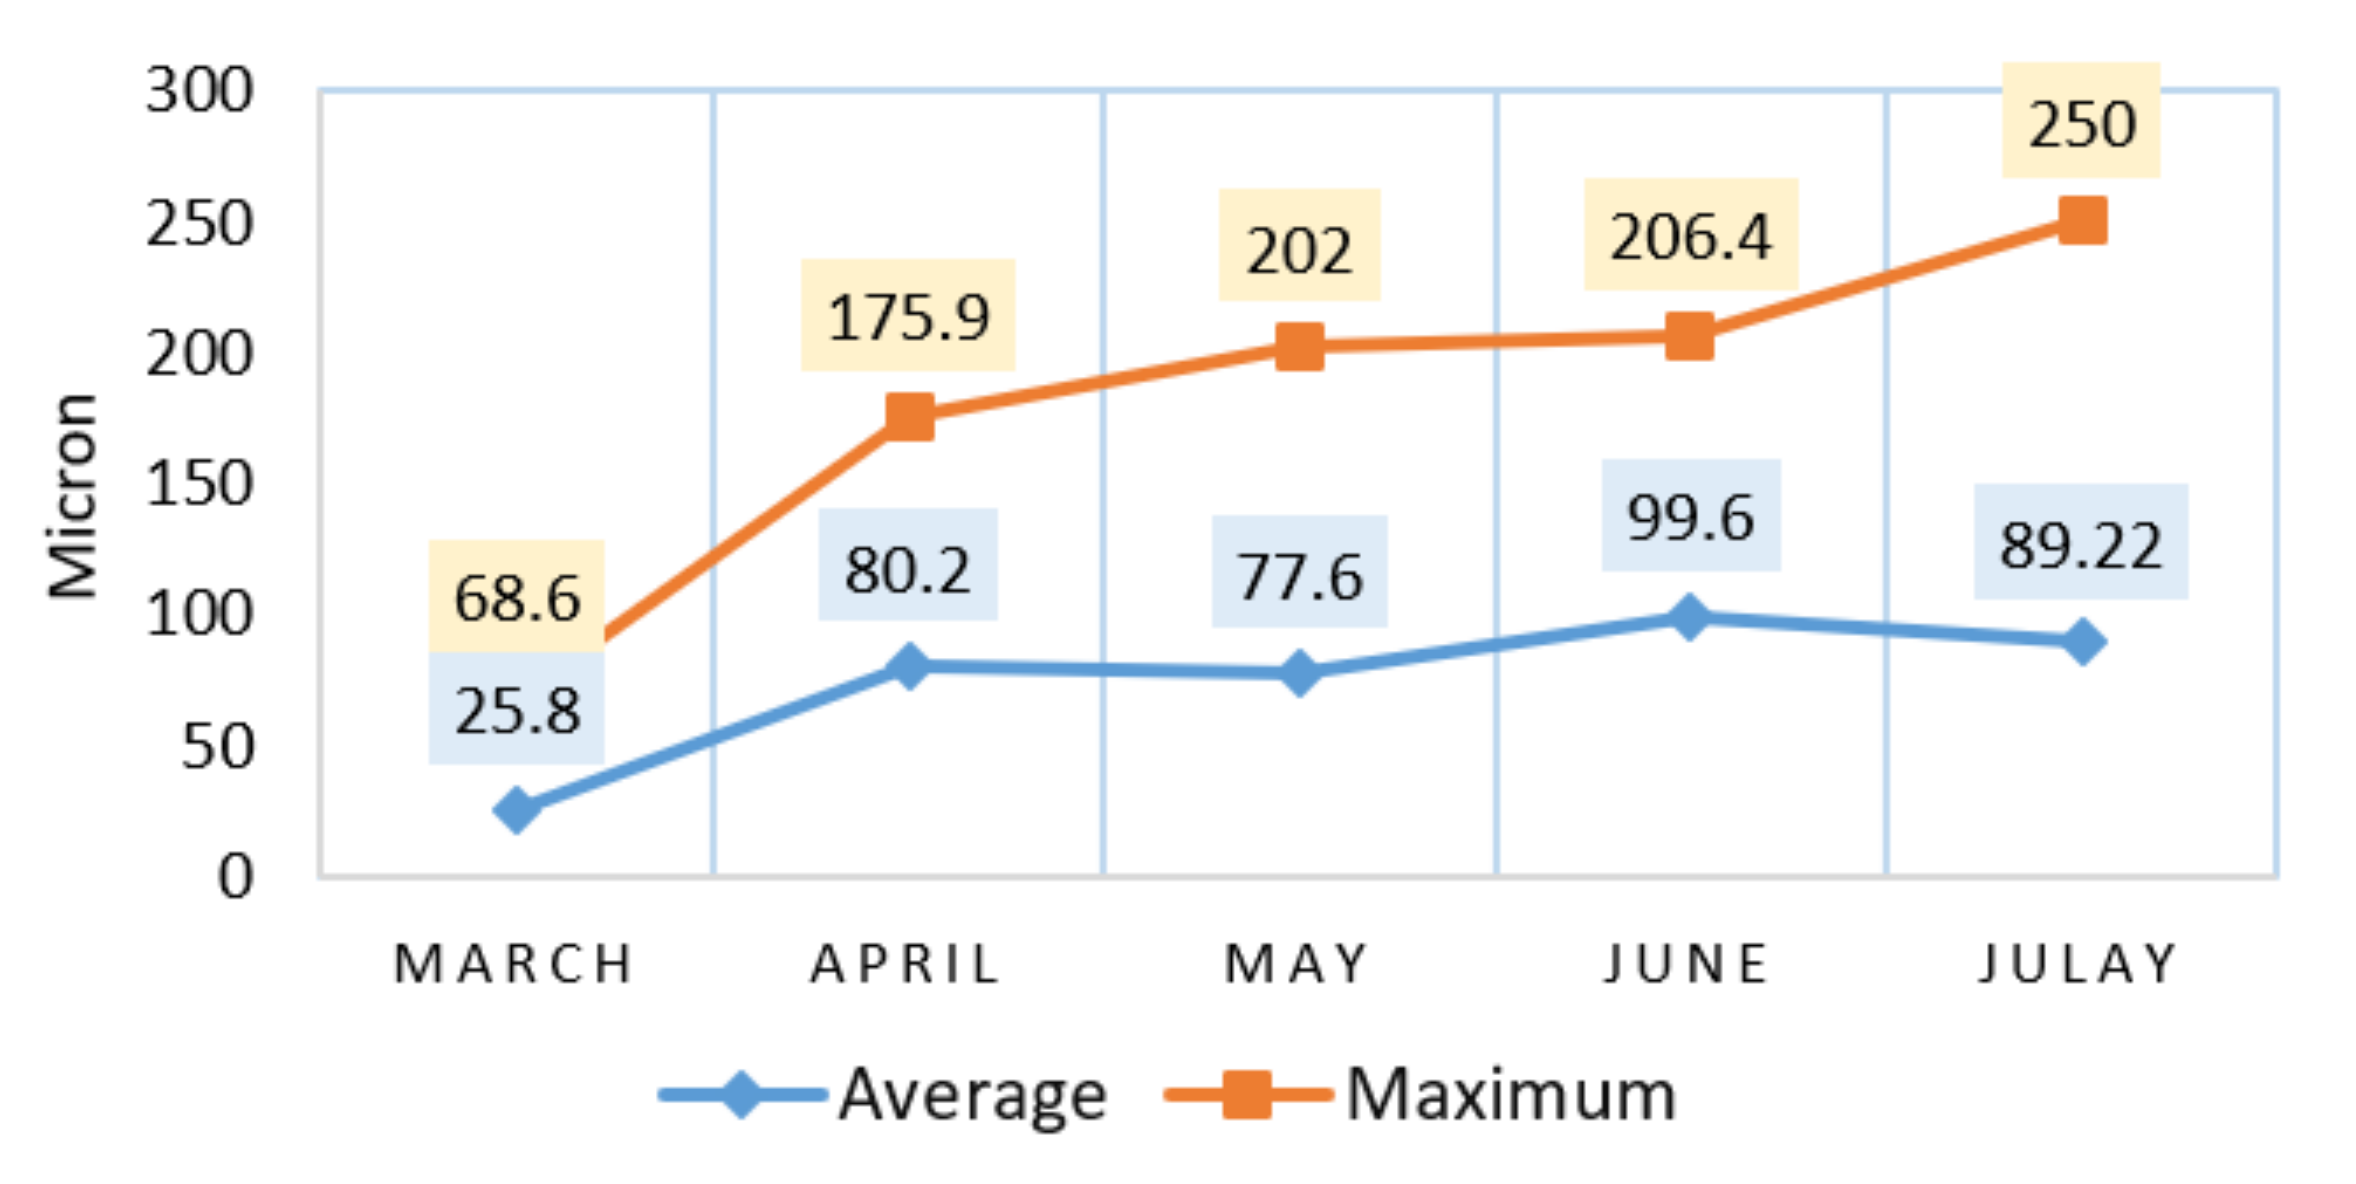
Soil and water salinity: One of the most major concerns promoting desertification in Iran’s northwest is soil salinisation caused by the drying of Urmia Lake and dust produced from the lake’s dried bottom (Figure 10). It results in a decrease in biomass output and a decrease in soil productivity.
As a result, soil salinity looks to be the most serious hazard to this region’s agricultural areas. As a result, the majority of the lake has been transformed into useless land in recent years. As the drought continues and the lake’s salt concentration increases, the extinction of the lake’s wildlife has increased (http://www.iew.ir/ accessed on 22 August 2021). Nikjoo et al.’s (2017) findings show that the environmental situation was better before 2009 when approaching the shore of Lake Urmia; however, after 2009, it has improved by moving away from the shore, and the situation at the lakeshore has become much worse [32].
Destruction of surrounding agricultural lands: Agriculture is a major source of employment in the region. However, it has been particularly hard hit by the drying up of the lake, a major water deficit, and climate change. Salt deposits, dry wells, extreme spring rains, and long droughts have negatively impacted agricultural production.
Several dams and dikes have been built in the Lake Urmia Basin, primarily to divert and storage for agricultural purposes. Although the first and second downstream canals are modern, old irrigation systems are still used in the region and water is distributed through open canals constructed by farmers. The number of farms around Lake Urmia is shown in Figure 11.
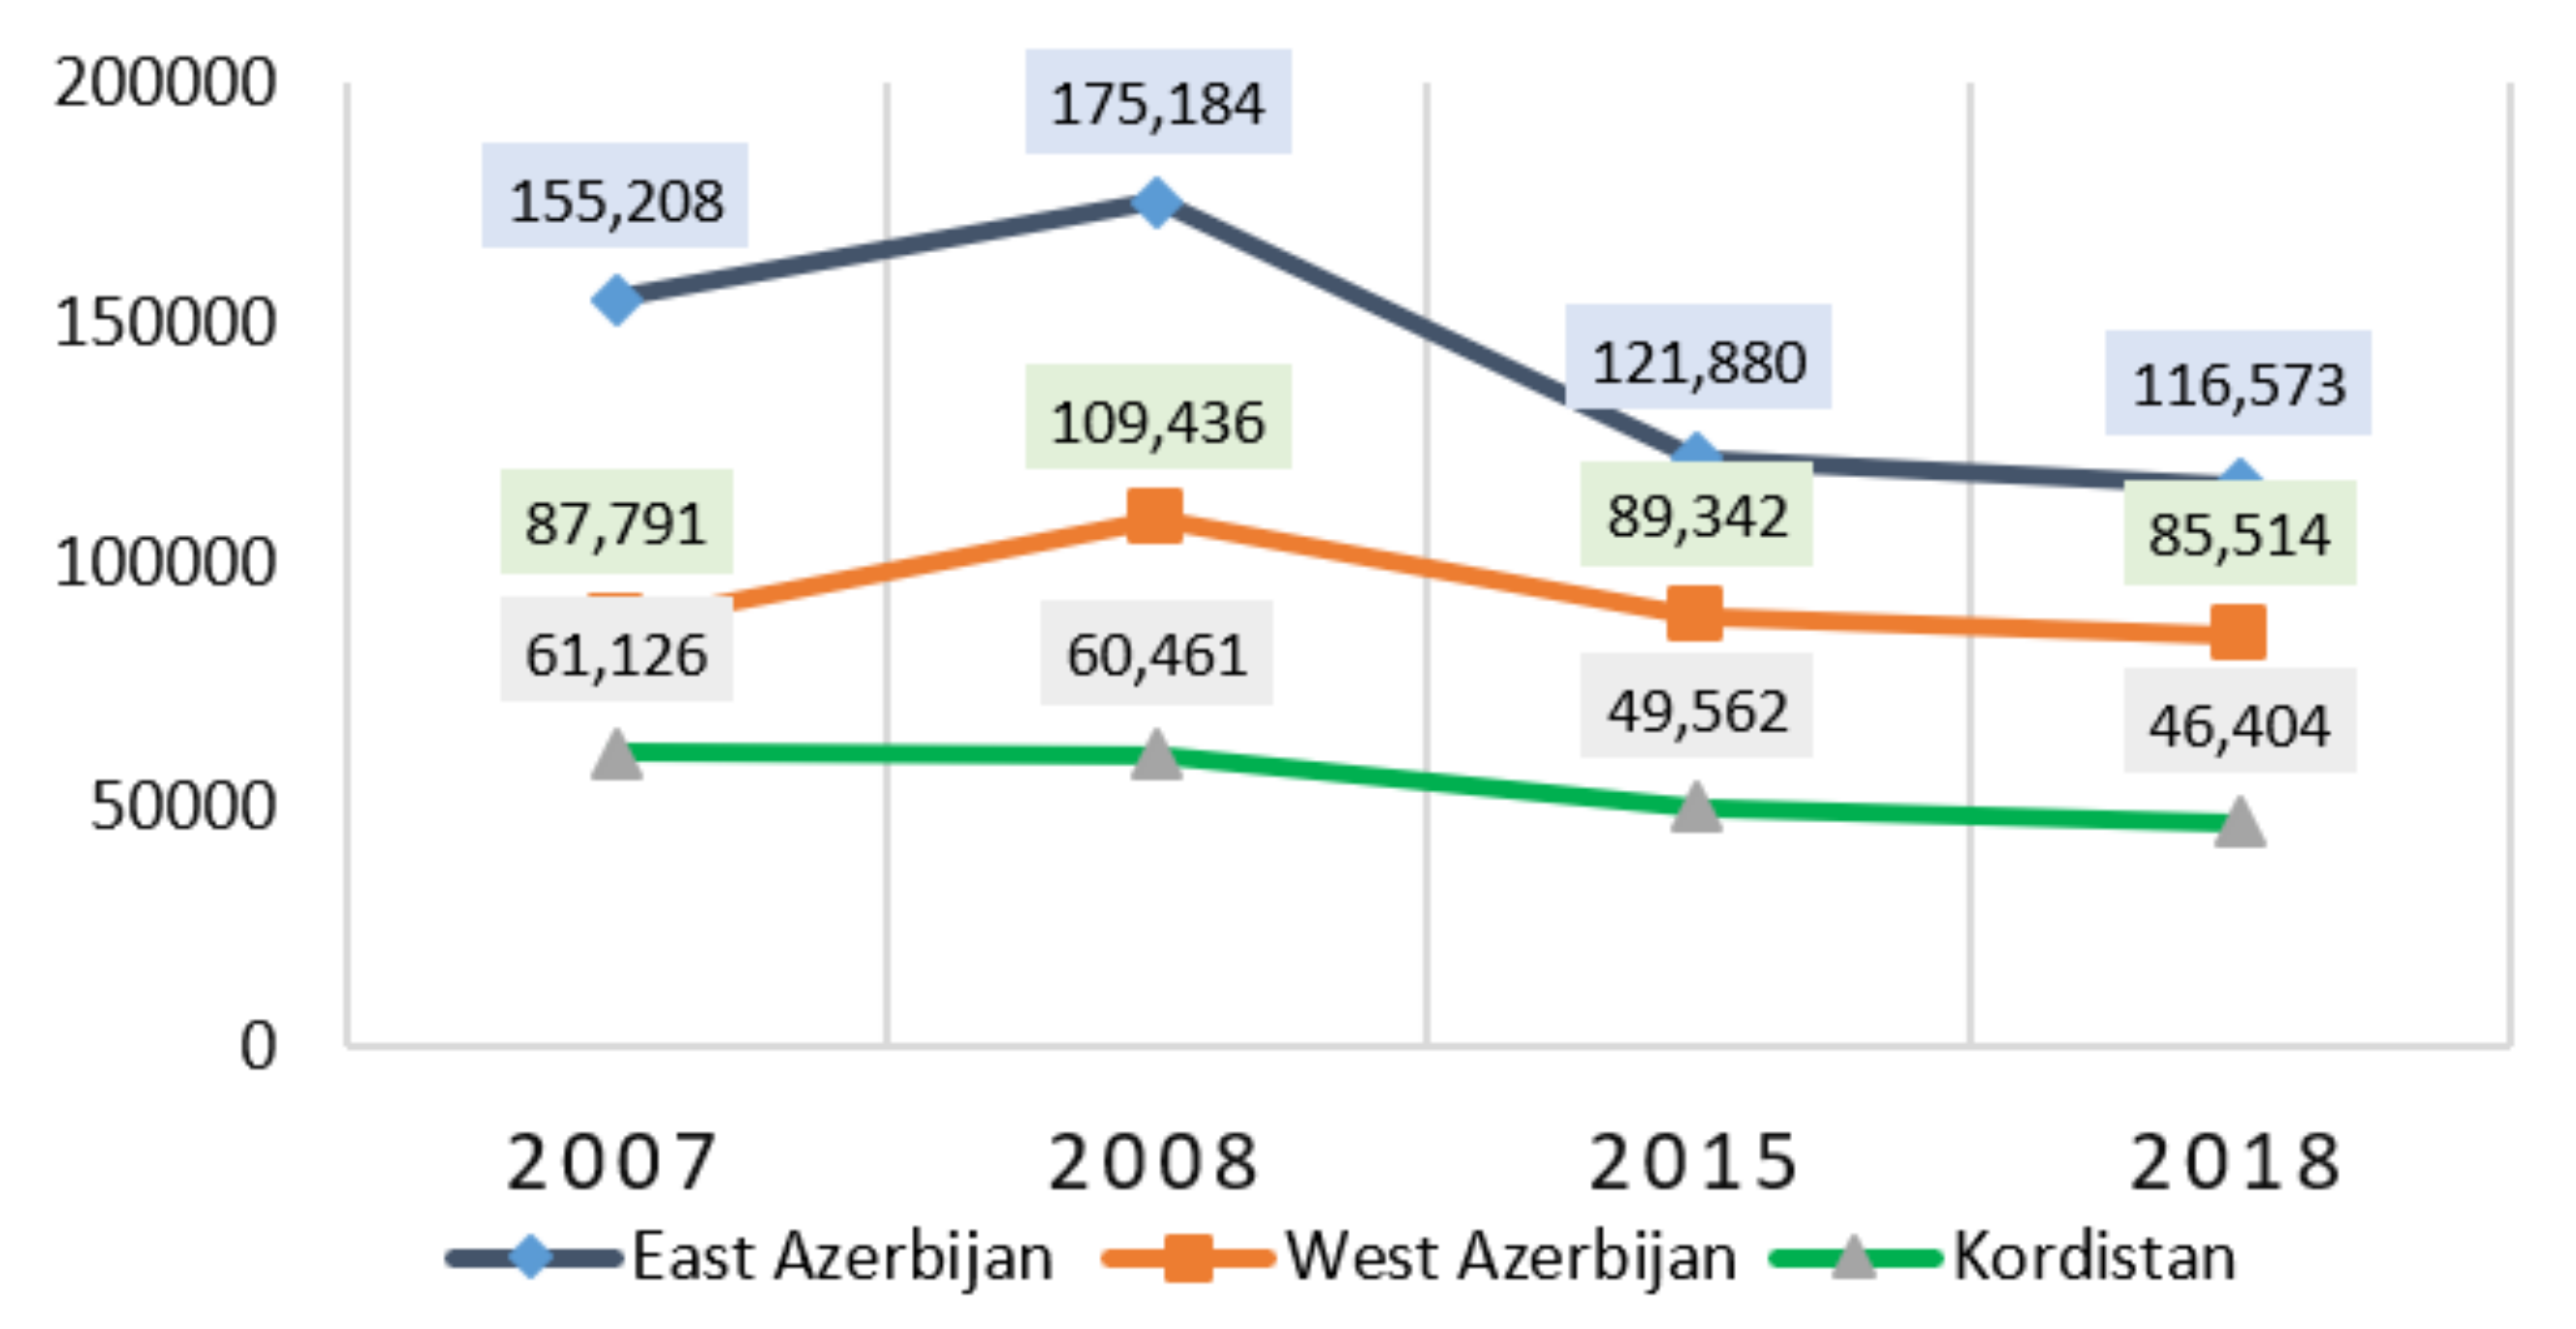
From 2007 to 2018, 38,635 farmers lost their jobs (majority in the agriculture sector) in the province of East Azerbaijan, 2277 in West Azerbaijan, and 14,722 in Kurdistan. Furthermore, according to Soleimani Zeyveh’s (2010) results, the drying up of Urmia Lake is damaging thousands of hectares of agricultural land in the lake area, resulting in a rise in unemployment and migration of roughly 3 million people to the neighbouring areas [33].
According to Mohammadi Hamidi et al. (2019), declining production and changing the type of some agricultural products are the main negative consequences that will lead to the migration of people from this region. Additionally, Ebrahimzadeh et al. (2014) argued that the least important consequence of the drying up of Lake Urmia would be the unemployment of more than three million people in the surrounding provinces. The research findings are summarised as follows [34]. Figure 12. shows an summarizes of research findings and the cause-and-effect relationships between outcomes and ultimately their impact on human habitats, which were the focus point of this paper.
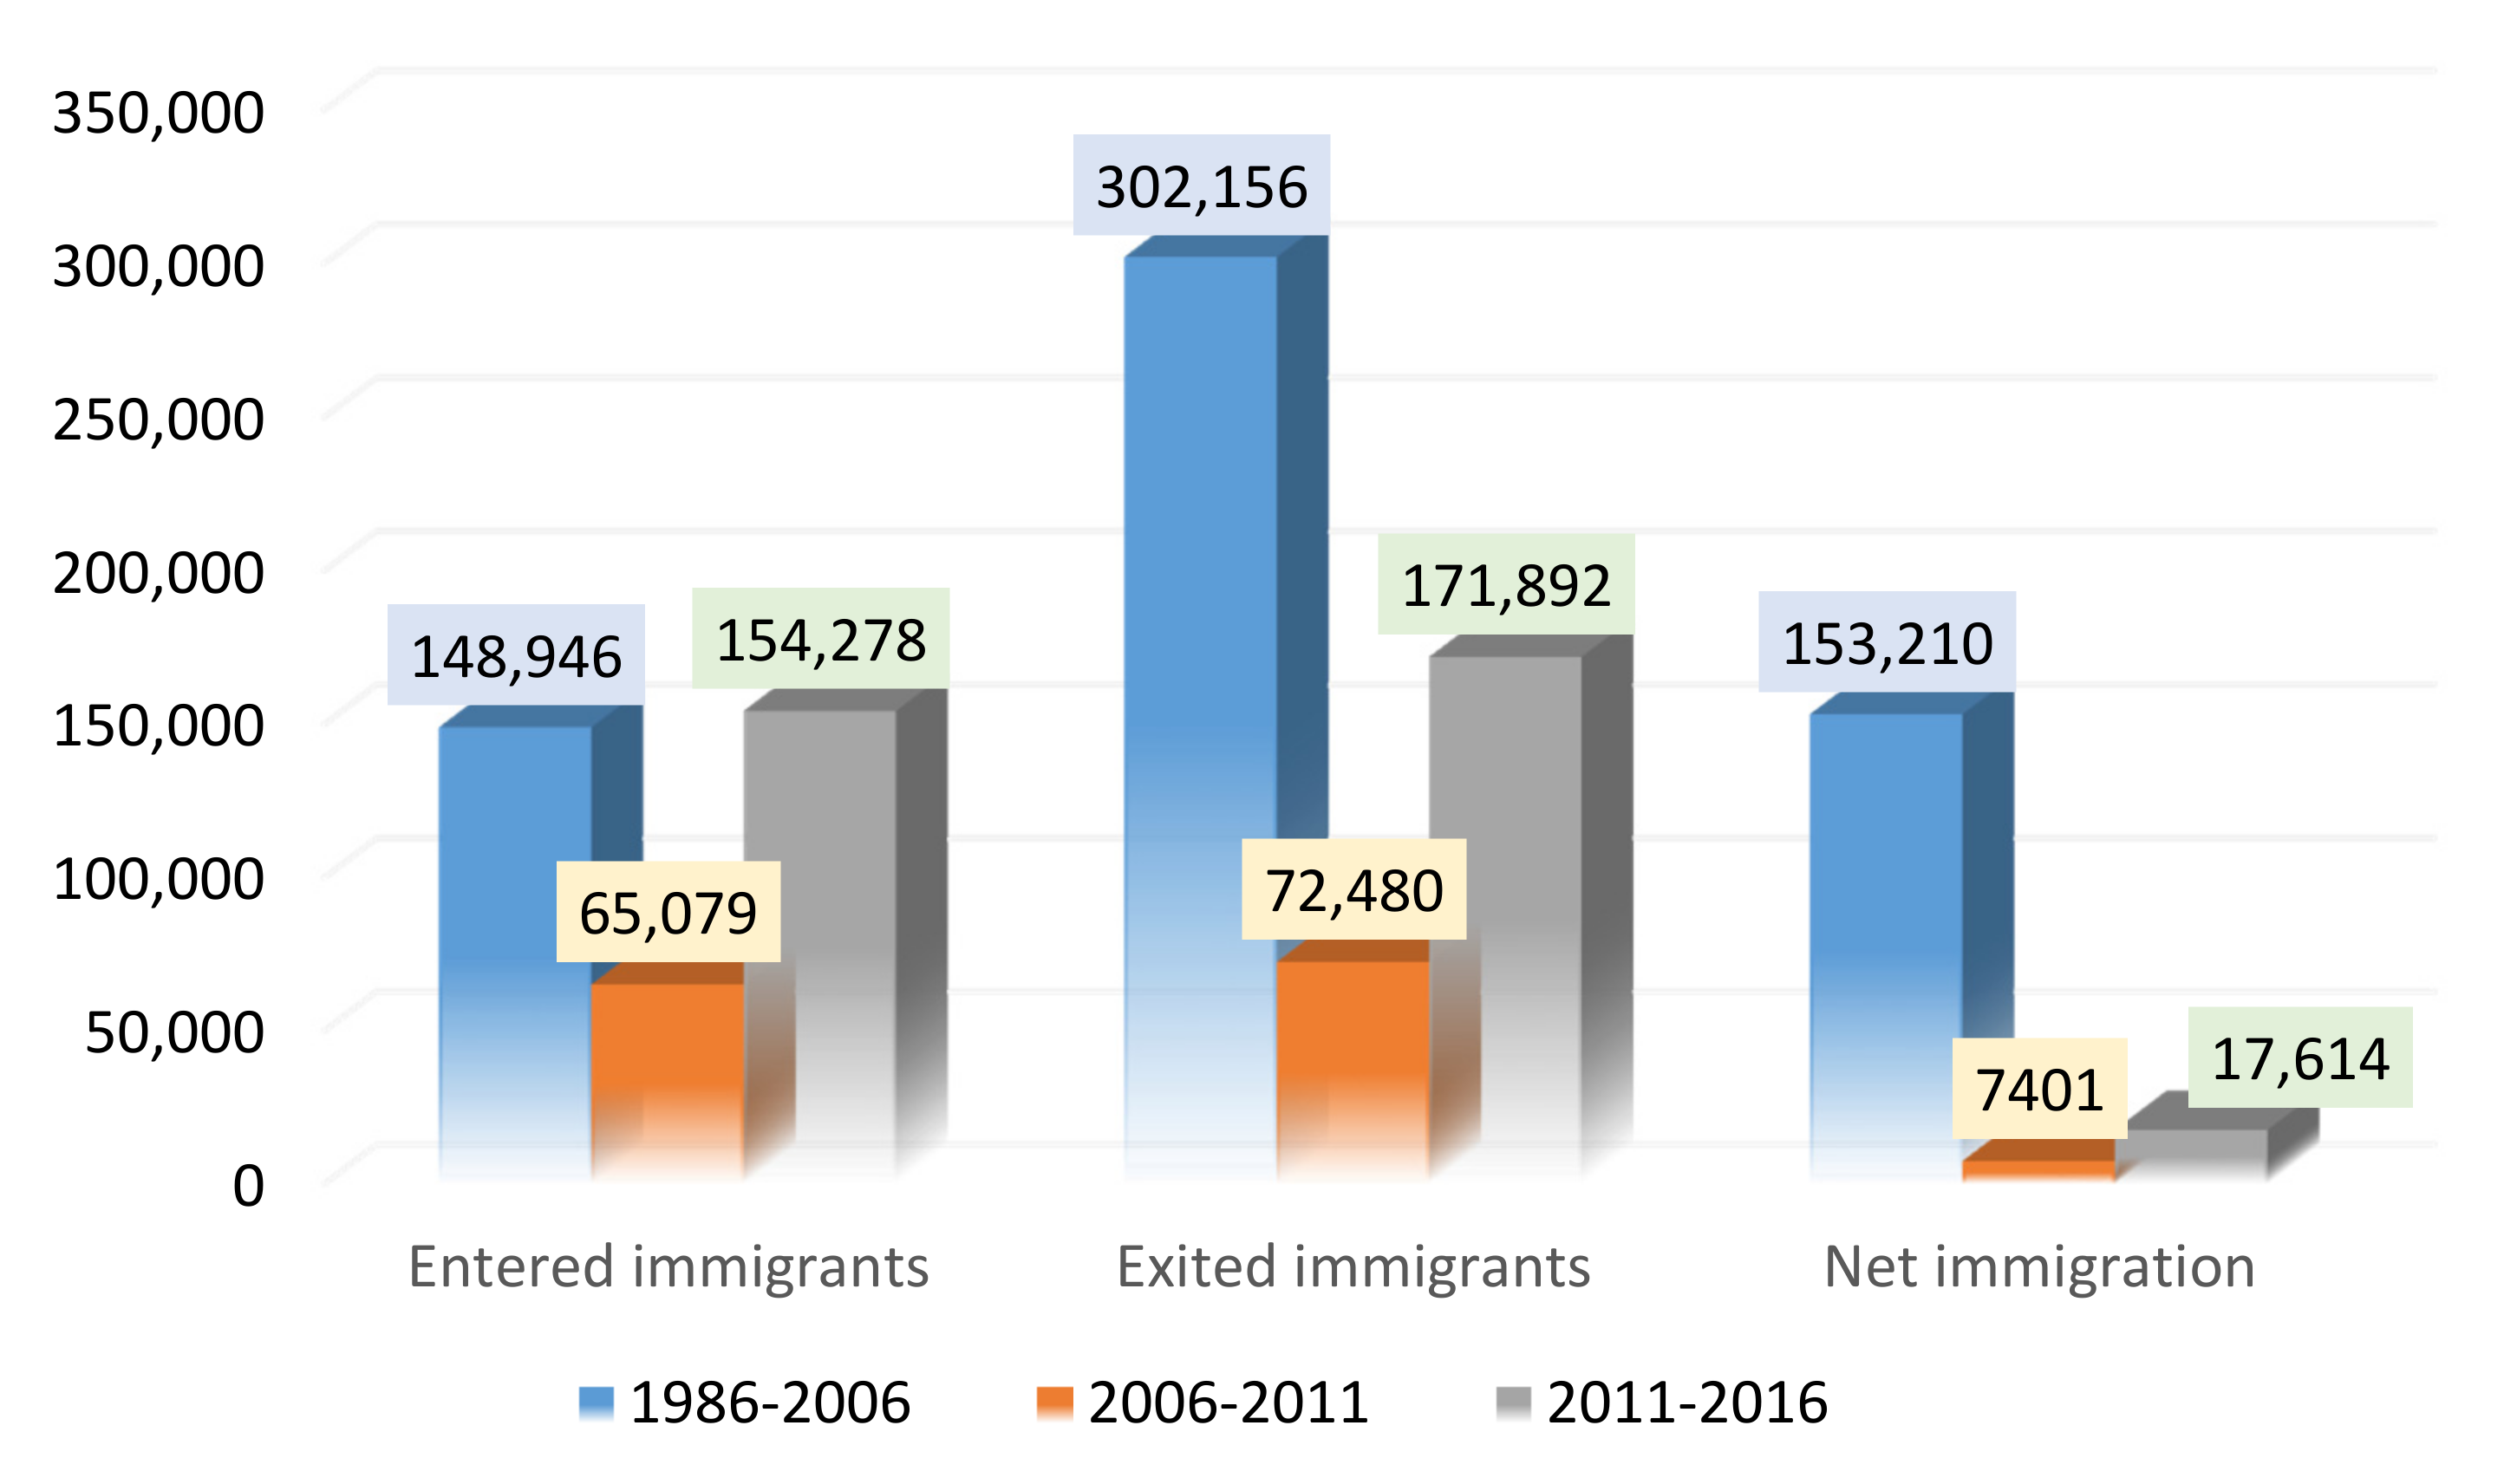
Increasing unemployment due to loss of agricultural land and the related social and economic problems [35], the creation of salt winds as a threat to agricultural lands on the shores of the lake, and the inhalation of salt dust [36], which could cause cancer and lung problems [37], are some of the greatest environmental disasters, resulting in the emigration of tens of thousands of people from the region. For example, in the past 50 years, East Azerbaijan province (located on the eastern side of Lake Urmia and directly influenced by the water fluctuations of Lake Urmia due to western winds) has experienced a surge in emigration and is ranked top among Iran’s other immigrant sending provinces, as seen in Figure 13.
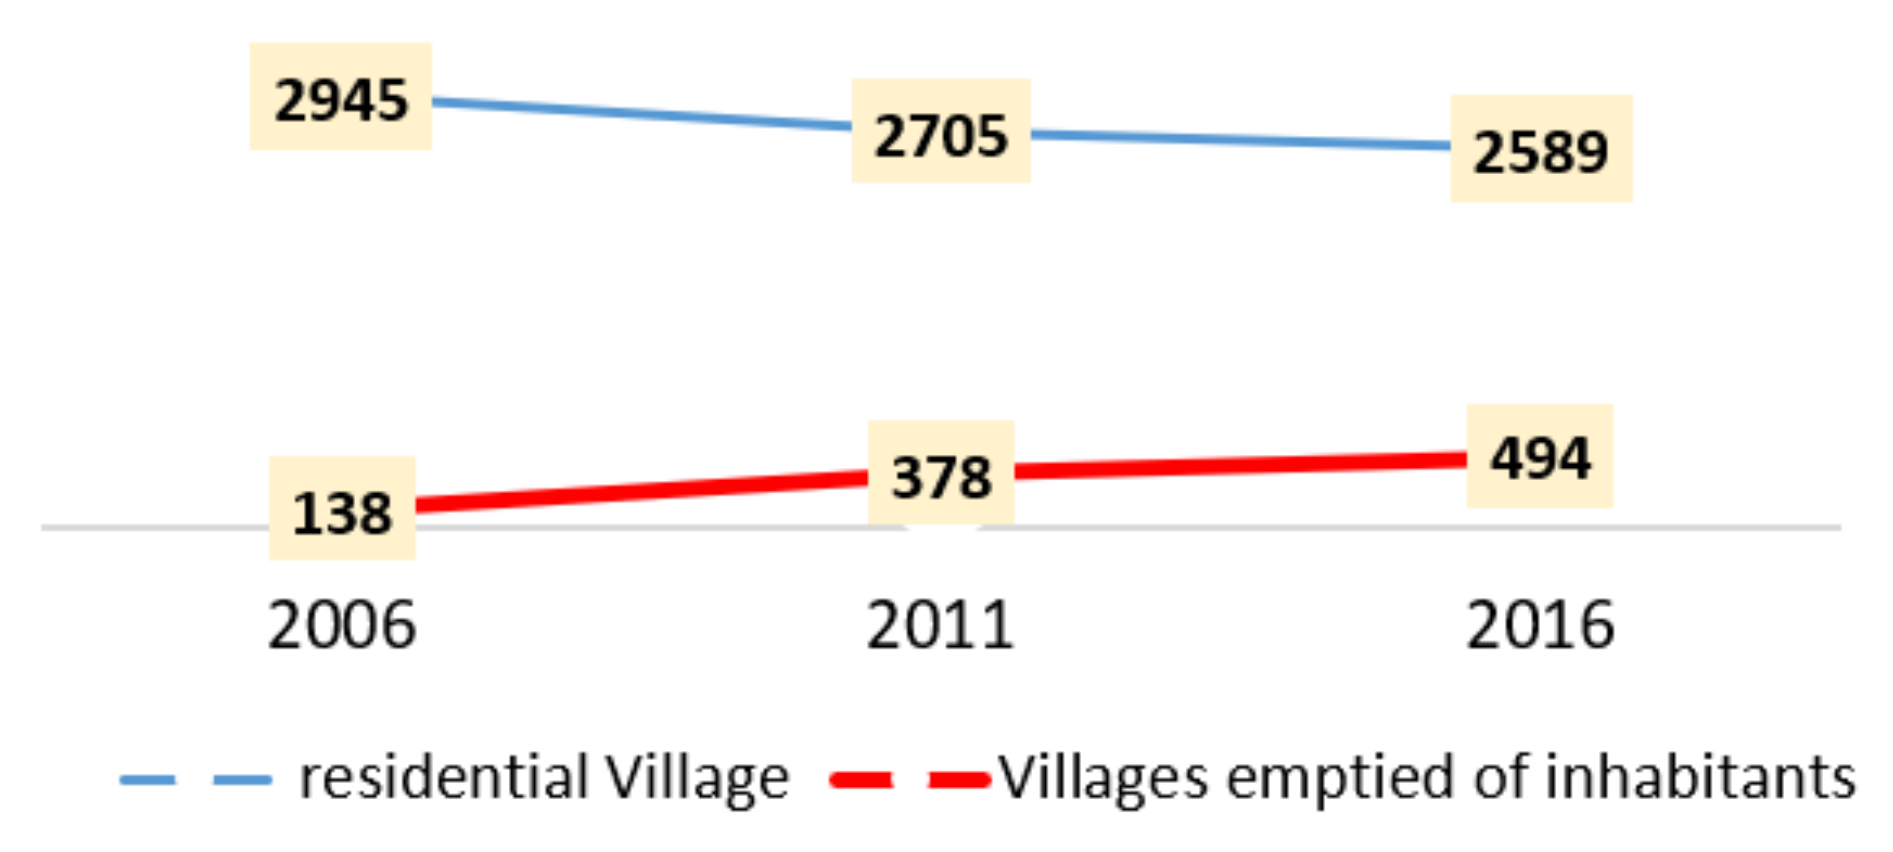
According to the census results, during the 2011 to 2016 census, a total of 171,892 people left the province. Currently, East Azerbaijan province has 3083 villages, 138 of which have been depleted and are void of inhabitants compared to the 1996 census. In 2006, the number of depleted villages reached 378 (Figure 14). Finally, according to the last census in 2016, 494 villages in this province were depopulated and multiplied since 1996.
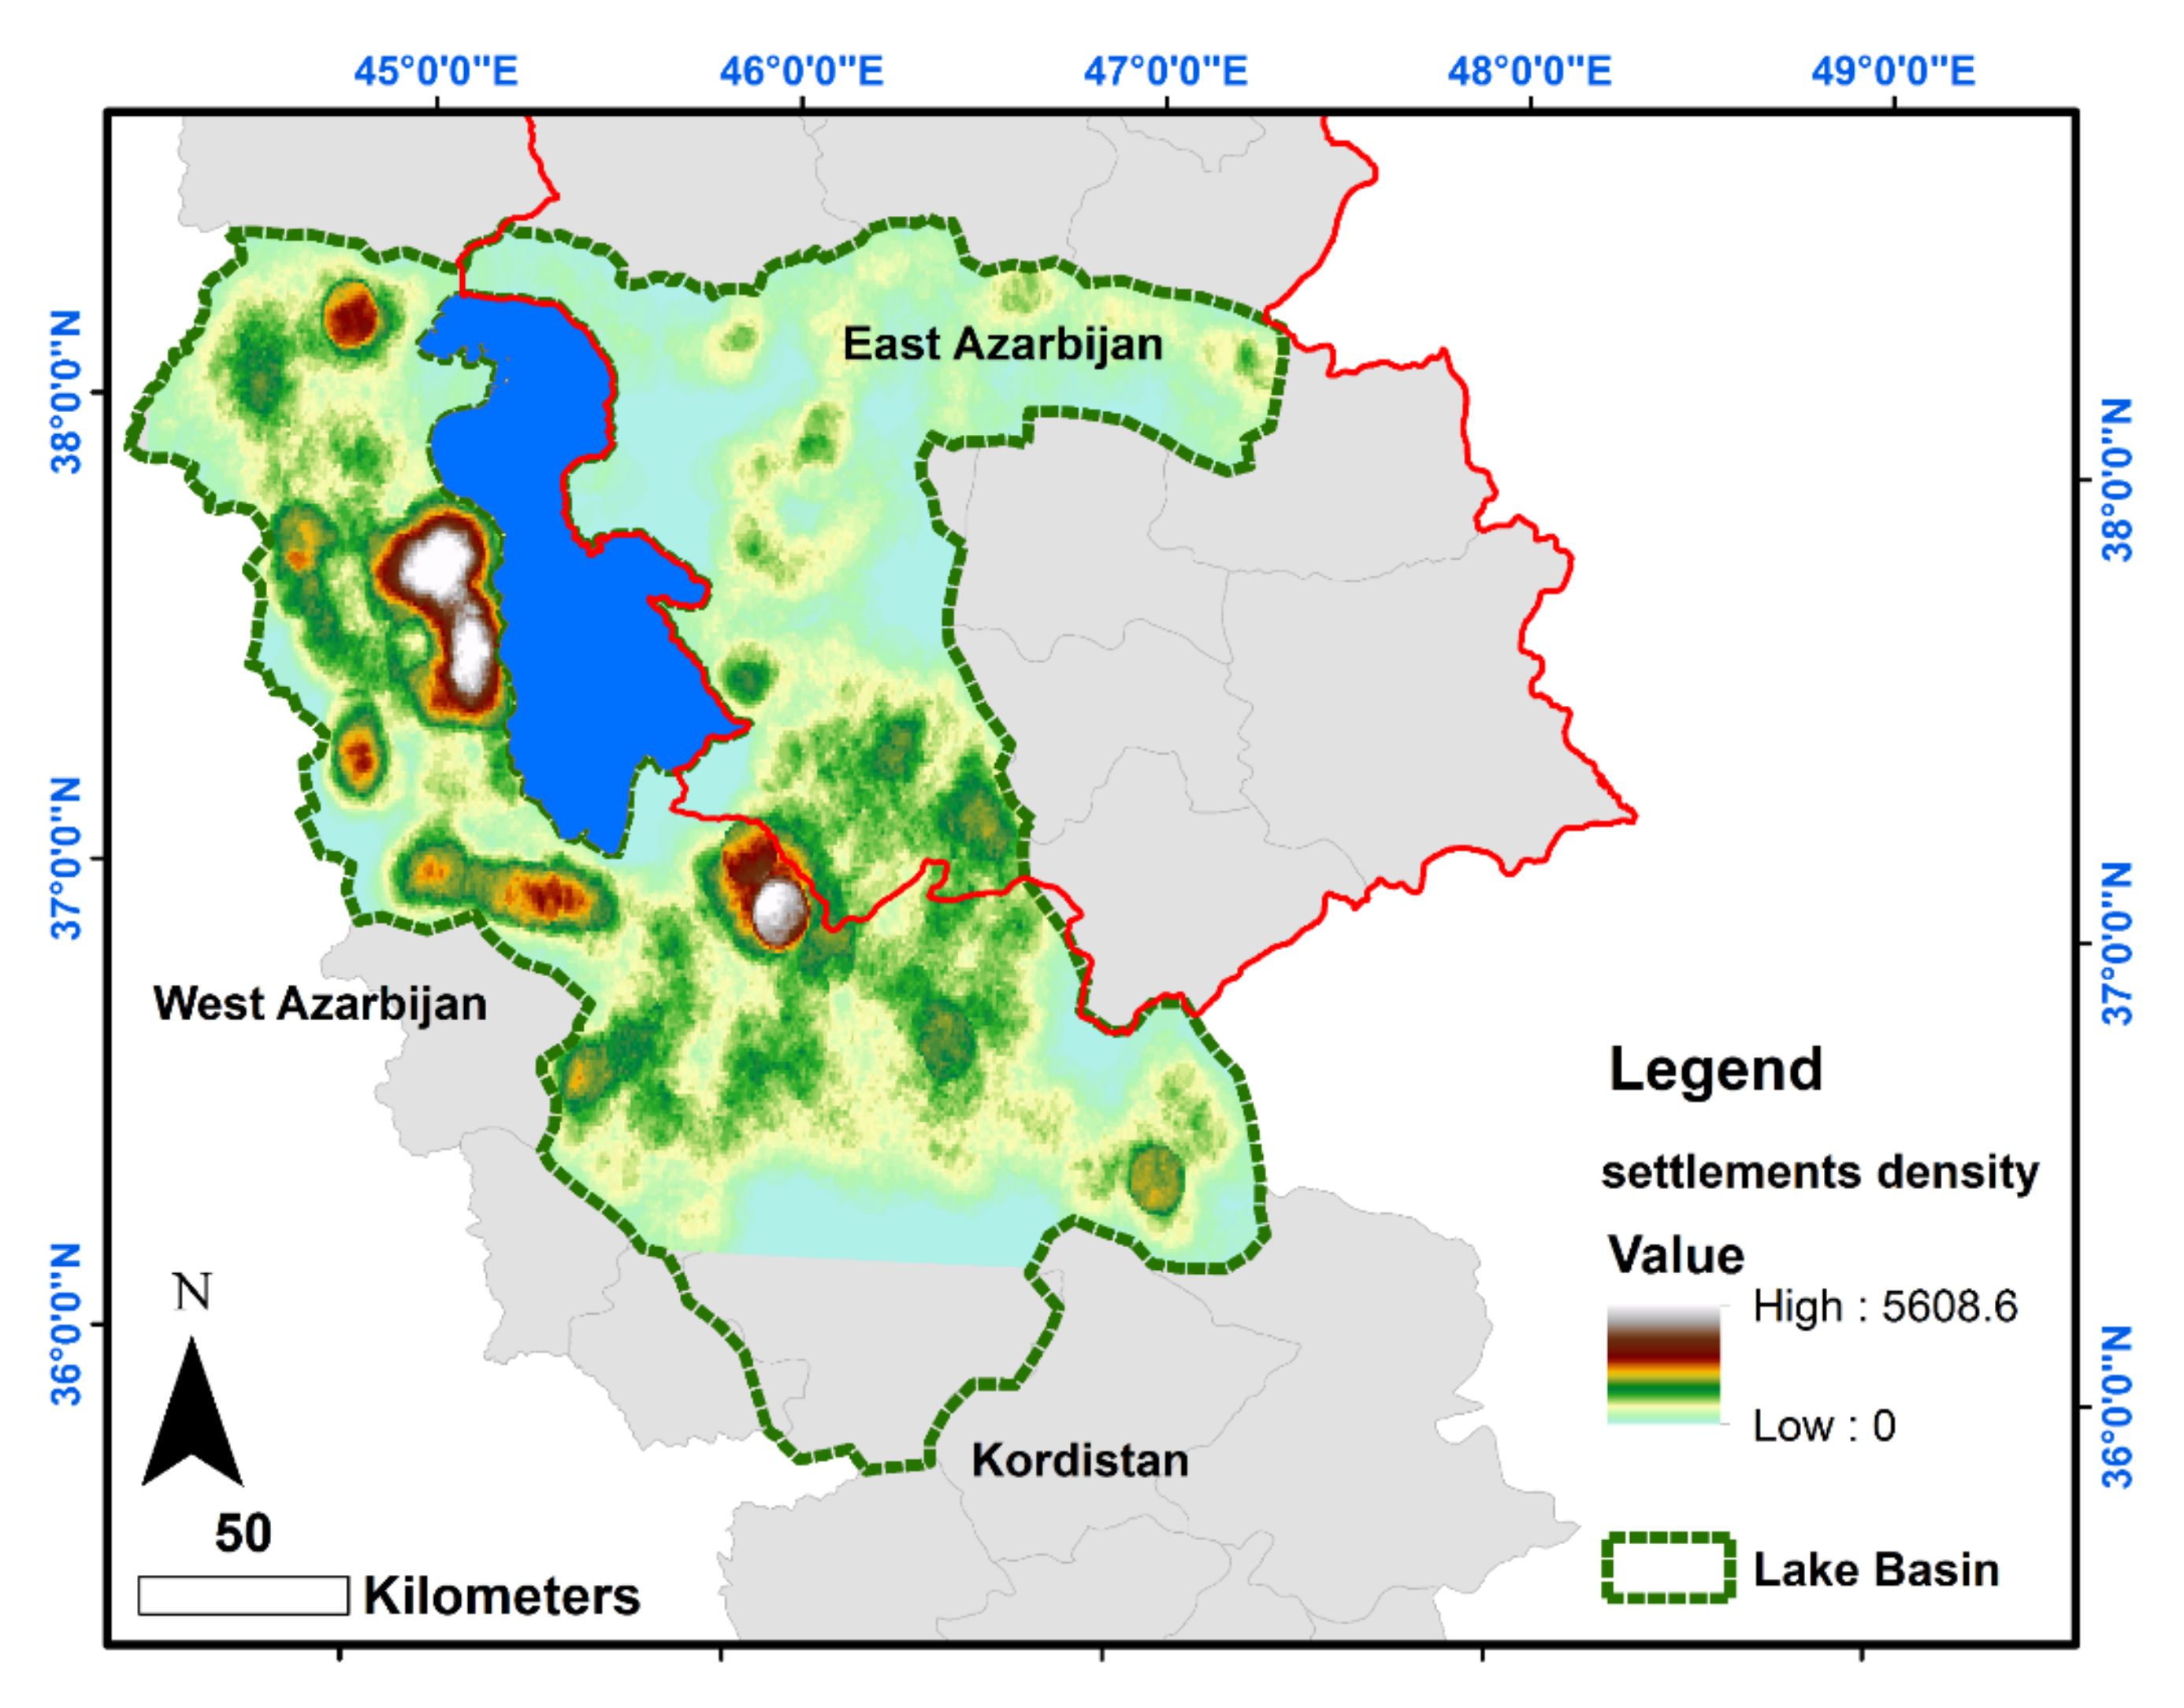
Considering the prevailing wind direction in the region, coming from the west, the probability of damage to the settlements of eastern and northeastern Urmia due to salt storms is very high. Figure 15 shows that most of the settlements in this area are depopulated.
According to Figure 15, most of the settlements are on the western and southern shores of the lake. Most of the settlements on the lake’s eastern shore (East Azerbaijan province) were abandoned by the inhabitants in recent decades.
In response to those threats, the government’s action was the formation of the Lake Urmia restoration centre, which, despite the passage of more than 80% of the program, has not yet achieved its goals, and this lake is still considered a dangerous threat to this region. Thus, the wave of migration that began in the region in recent decades will continue gradually, causing problems for cities and political conflicts in the region.

5. Conclusions

In this paper, the consequences of the drying of Lake Urmia on human settlements were investigated. The results of this study are as follows.
(1) There were 17 significant environmental consequences of lake water fluctuation identified. (2) Among the 17 consequences, decreased livability in surrounding cities was identified as the most dependent, and groundwater decline and depletion were identified as the most significant and effective environmental consequences in the system. (3) Finally, four environmental consequences— reducing pasture area, soil and water salinity, and groundwater decline and depletion, and destruction of surrounding agricultural lands—were identified.
Furthermore, this effort emphasized the importance of finding long-term solutions to mitigate environmental disasters and provide opportunities for local residents as soon as possible. However, many of the present efforts to restore the lake’s natural equilibrium have proven to be ineffective.
The northwestern regions of Iran (around Lake Urmia) have strategic conditions due to the border. In addition, due to the impact of water scarcity in Lake Urmia Basin, the migration process from these areas has accelerated in recent years. Given the region’s geopolitical status, this population loss will have long-term security ramifications. As a result, it appears that planners and policymakers must address the climatic, sociological, demographic, and political consequences of this change. Although programs and actions have been undertaken in recent years to revitalise the lake and take steps toward environmental sustainability, these trends are so slow that they are far off from achieving the desired sustainability conditions.
According to the Department of Energy, the basin is home to five million people, with average daily water use of 220 litres per person per day. With appropriate water management, the average water use in many urban areas (particularly in Europe) is around 150 litres per person per day. The urban population must play a role in the solution. Therefore, a public education program to reduce urban water use is needed. Some initiatives, such as reducing water pressure within the system, introducing a rebate program for low flush toilets, and installing water-efficient appliances in all new homes, could help to maintain the lake’s water level. Agricultural growth has had a significant influence on the marshes surrounding the lake (cultivation and grazing). Wetlands are excellent water storage and filtration systems that can help the lake recover. They need to be better preserved and maintained. While technological capability is strong, there appears to be a lack of coordination among government agencies. ULRP staff work only in the headwaters but should be able to work in the agricultural area. To launch a collaborative plan, all concerned agencies must work together. The ULRP appears to have been tasked with taking the lead, promoting cooperation and integration, and putting together an action plan.
Conducting a groundwater resource analysis includes mapping aquifers and well inventories, groundwater use, extraction vs recharge rates, and groundwater and surface water interactions, which are all crucial for drought management.
There appears to be much disagreement among specialists about how much groundwater contributes to the lake, and there is a lot of information on how it is used in agriculture. Identification and mapping of key aquifers, an inventory of groundwater wells, estimates of groundwater use, determining if extraction rates are in balance with recharge rates, and research to determine where groundwater–surface water interactions are occurring within the watershed should all be undertaken. Considering all of these, it should be emphasized that these solutions represent crucial information as some of the few solutions that are accessible and executable during droughts.

Author Contributions

S.M.H., C.F., H.N., A.R. and M.H.Y., participated in the writing and editing of the manuscript and the preparation of the figures. All authors have read and agreed to the published version of the manuscript.

Funding

This research received no external funding.

Institutional Review Board Statement

Not applicable.

Informed Consent Statement

Not applicable.

Data Availability Statement

All data generated or analysed during this study are included in this published article.

Conflicts of Interest

The authors declare no conflict of interest.

References

  1. Williams, W.D. Environmental threats to salt lakes and the likely status of inland saline ecosystems in 2025. Environ. Conserv. 2002, 29, 154–167. [Google Scholar] [CrossRef] [Green Version]
  2. Hassani, A.; Azapagic, A.; D’Odorico, P.; Keshmiri, A.; Shokri, N. Desiccation crisis of saline lakes: A new decision-support framework for building resilience to climate change. Sci. Total. Environ. 2020, 703, 134718. [Google Scholar] [CrossRef] [PubMed]
  3. Messager, M.L.; Lehner, B.; Grill, G.; Nedeva, I.; Schmitt, O. Estimating the volume and age of water stored in global lakes using a geo-statistical approach. Nat. Commun. 2016, 7, 1–11. [Google Scholar] [CrossRef] [PubMed]
  4. Heydari, N.; Jabbari, H. Worldwide Environmental Threats to Salt Lakes. Int. J. Des. Nat. Ecodynamics 2012, 7, 292–299. [Google Scholar] [CrossRef] [Green Version]
  5. Wurtsbaugh, W.A.; Miller, C.; Null, S.E.; DeRose, R.J.; Wilcock, P.; Hahnenberger, M.; Howe, F.; Moore, J. Decline of the world’s saline lakes. Nat. Geosci. 2017, 10, 816–821. [Google Scholar] [CrossRef]
  6. Pekel, J.F.; Cottam, A.; Gorelick, N.; Belward, A.S. High-resolution mapping of global surface water and its long-term changes. Nature. 2016, 540, 418–422. [Google Scholar] [CrossRef]
  7. Gross, M. The world’s vanishing lakes. Curr. Biol. 2017, 27, 43–46. [Google Scholar] [CrossRef]
  8. Nicoll, K.; Hahnenberger, M.; Goldstein, H.L. ‘Dust in the wind ‘from source-to-sink: Analysis of the 14–15 April 2015 storm in Utah. Aeolian Res. 2020, 46, 100532. [Google Scholar] [CrossRef]
  9. Micklin, P. The future Aral Sea: Hope and despair. Environ. Earth Sci. 2016, 75, 844. [Google Scholar] [CrossRef]
  10. Mischke, S.; Liu, C.; Zhang, J.; Zhang, C.; Zhang, H.; Jiao, P.; Plessen, B. The world’s earliest Aral-Sea type disaster: The decline of the Loulan Kingdom in the Tarim Basin. Sci. Rep. 2017, 7, 1–8. [Google Scholar] [CrossRef]
  11. Case, H.L.I.; Boles, J.; Delgado, A.; Nguyen, T.; Osugi, D.; Barnum, D.A.; Decker, D.; Steinberg, S.; Steinberg, S.; Keene, C.; et al. Salton Sea Ecosystem Monitoring and Assessment Plan; Open File Report 2013,1133; U.S. Geological Survey: Reston, VA, USA, 2013.
  12. Stone, R. Saving Iran’s great Salt Lake. Science 2015, 349, 1044–1047. [Google Scholar] [CrossRef]
  13. Ministry of Energy (Iran). Daily Rainfall Report for First and 2nd Level Catchments. 2021. Available online: http://wrs.wrm.ir/m3/gozaresh_print.asp (accessed on 22 August 2021).
  14. Jahanbakhsh, S.; Adalatdost, M.; Tadayoni, M. Urmia Lake: The Relationship between Sunspots and Climate on the Northwestern of Iran. Geogr. Res. Q. 2011, 25, 16656–16684. [Google Scholar]
  15. Zoljoodi, M.; Didevarasl, A. Water-Level Fluctuations of Urmia Lake: Relationship with the Long-Term Changes of Meteorological Variables (Solutions for Water-Crisis Management in Urmia Lake Basin). Atmos. Clim. Sci. 2014, 4, 358–368. [Google Scholar] [CrossRef] [Green Version]
  16. Sima, S.; Rosenberg, D.E.; Wurtsbaugh, W.A.; Null, S.E.; Kettenring, K.M. Managing Lake Urmia, Iran for diverse restoration objectives: Moving beyond a uniform target lake level. J. Hydrol. Reg. Stud. 2021, 35, 100812. [Google Scholar] [CrossRef]
  17. Urmia Lake Restoration National Committee. Necessity of Lake Urmia Resuscitation, Causes of Drought and Threats; Report No: ULRP-6-4-3-Rep 1; Urmia Lake Restoration National Committee: Tehran, Iran, 2015. [Google Scholar]
  18. Ghale, Y.A.G.; Baykara, M.; Unal, A. Investigating the interaction between agricultural lands and Urmia Lake ecosystem using remote sensing techniques and hydro-climatic data analysis. Agric. Water Manag. 2019, 221, 566–579. [Google Scholar] [CrossRef]
  19. Mohammadi Hamidi, S.; Nazmfar, H.; Ahad, R.; Yazdani, M.H. Futurology of the Economic Drivers of Urmia Lake Water Level Fluctuations on the Spatial Unbalanced. J. Spat. Plan. 2020, 24, 69–97. [Google Scholar]
  20. Panula-Ontto, J.; Luukkanen, J.; Kaivo-Oja, J.; O’Mahony, T.; Vehmas, J.; Valkealahti, S.; Björkqvist, T.; Korpela, T.; Järventausta, P.; Majanne, Y.; et al. Cross-impact analysis of Finnish electricity system with increased renewables: Long-run energy policy challenges in balancing supply and consumption. Energy Policy 2018, 118, 504–513. [Google Scholar] [CrossRef]
  21. Buehring, J.; Bishop, P.C. Foresight and Design: New Support for Strategic Decision Making. She Ji Des. Econ. Innov. 2020, 6, 408–432. [Google Scholar] [CrossRef]
  22. Jouan, J.; Ridier, A.; Carof, M. Legume production and use in feed: Analysis of levers to improve protein self-sufficiency from foresight scenarios. J. Clean. Prod. 2020, 274, 123085. [Google Scholar] [CrossRef]
  23. Gariboldi, M.I.; Lin, V.; Bland, J.; Auplish, M.; Cawthorne, A. Foresight in the time of COVID-19. Lancet Reg. Health-West. Pac. 2021, 6, 100049. [Google Scholar] [CrossRef]
  24. Ecken, P.; Gnatzy, T.; Heiko, A. Desirability bias in foresight: Consequences for decision quality based on Delphi results. Technol. Forecast. Soc. Chang. 2011, 78, 1654–1670. [Google Scholar] [CrossRef]
  25. Aschemann-Witzel, J.; Perez-Cueto, F.J.; Niedzwiedzka, B.; Verbeke, W.; Bech-Larsen, T. Transferability of private food marketing success factors to public food and health policy: An expert Delphi survey. Food Policy 2012, 37, 650–660. [Google Scholar] [CrossRef]
  26. Shariff, N. Utilising the Delphi survey approach: A review. J. Nurs. Care 2015, 4, 246. [Google Scholar] [CrossRef]
  27. Powell, C. The Delphi technique: Myths and realities. J. Adv. Nurs. 2003, 41, 376–382. [Google Scholar] [CrossRef] [PubMed] [Green Version]
  28. Swarnakar, V.; Tiwari, A.K.; Singh, A.R. Evaluating critical failure factors for implementing sustainable lean six sigma framework in manufacturing organisation. Int. J. Lean Six Sigma 2020. [Google Scholar] [CrossRef]
  29. Villacorta, P.J.; Masegosa, A.D.; Castellanos, D.; Lamata, M.T. A new fuzzy linguistic approach to qualitative Cross Impact Analysis. Appl. Soft Comput. 2014, 24, 19–30. [Google Scholar] [CrossRef]
  30. Kinker, P.; Swarnakar, V.; Singh, A.R.; Jain, R. Identifying and evaluating service quality barriers for polytechnic education: An ISM-MICMAC approach. Mater. Today Proc. 2020, 46, 9752–9757. [Google Scholar] [CrossRef]
  31. Asem, A.; Eimanifar, A.; Djamali, M.; De los Rios, P.; Wink, M. Biodiversity of the hypersaline Urmia Lake national park (NW Iran). Diversity 2014, 6, 102–132. [Google Scholar] [CrossRef] [Green Version]
  32. Nikjoo, B.; Abdeshahi, A.; Yazdanpanah, M. Prioritising the economic, social and environmental consequences on rural areas of Malekan township of the drying of lake Urmia. Environ. Sci. 2017, 15, 27–44. (In Persian) [Google Scholar]
  33. Soleimani Ziveh, M. Health and Environmental Consequences of Lake Urmia Water Loss, Comparative Comparison with Similar cases. In Proceedings of the Thirteenth National Conference on Environmental Health, Kerman, Iran, 2 November 2010. (In Persian). [Google Scholar]
  34. Ebrahimzadeh, A.; Hssani, A.R.; Farnoodfar, R. Investigating the drying of Lake Urmia and environmental pollutions and its impact on the economy. In Proceedings of the First Conference of Environmental Pollution, Ardabil, Iran, 13 May 2014. (In Persian). [Google Scholar]
  35. Mohammadi Hamidi, S.; Nazmfar, H.; Yazdani, M.H.; Rezayan Ghyeh Bashi, A. An Investigation and Analysis of the Effect of Urmia Lake Water Level Reduction on the Development Levels of Surrounding Counties. Town Ctry. Plan. 2019, 11, 285–309. (In Persian) [Google Scholar]
  36. Asghari-Kaljahi, E.; Hoseinpour, S.; Nadiri, A.O. Evaluation of salt dust occurrence potential in the Northeast Zone of Urmia Lake. Environ. Eros. Res. 2018, 8, 42–61. (In Persian) [Google Scholar]
  37. Musapour, J.; Dastgiri, S.; Asghari Jafarabadi, M.; Ziasarabi, P.; Khamnian, J. The environmental health catastrophe in Lake Urmia and asthma disease: A cohort study. Electron. J. Gen. Med. 2019, 16, em147. (In Persian) [Google Scholar] [CrossRef]
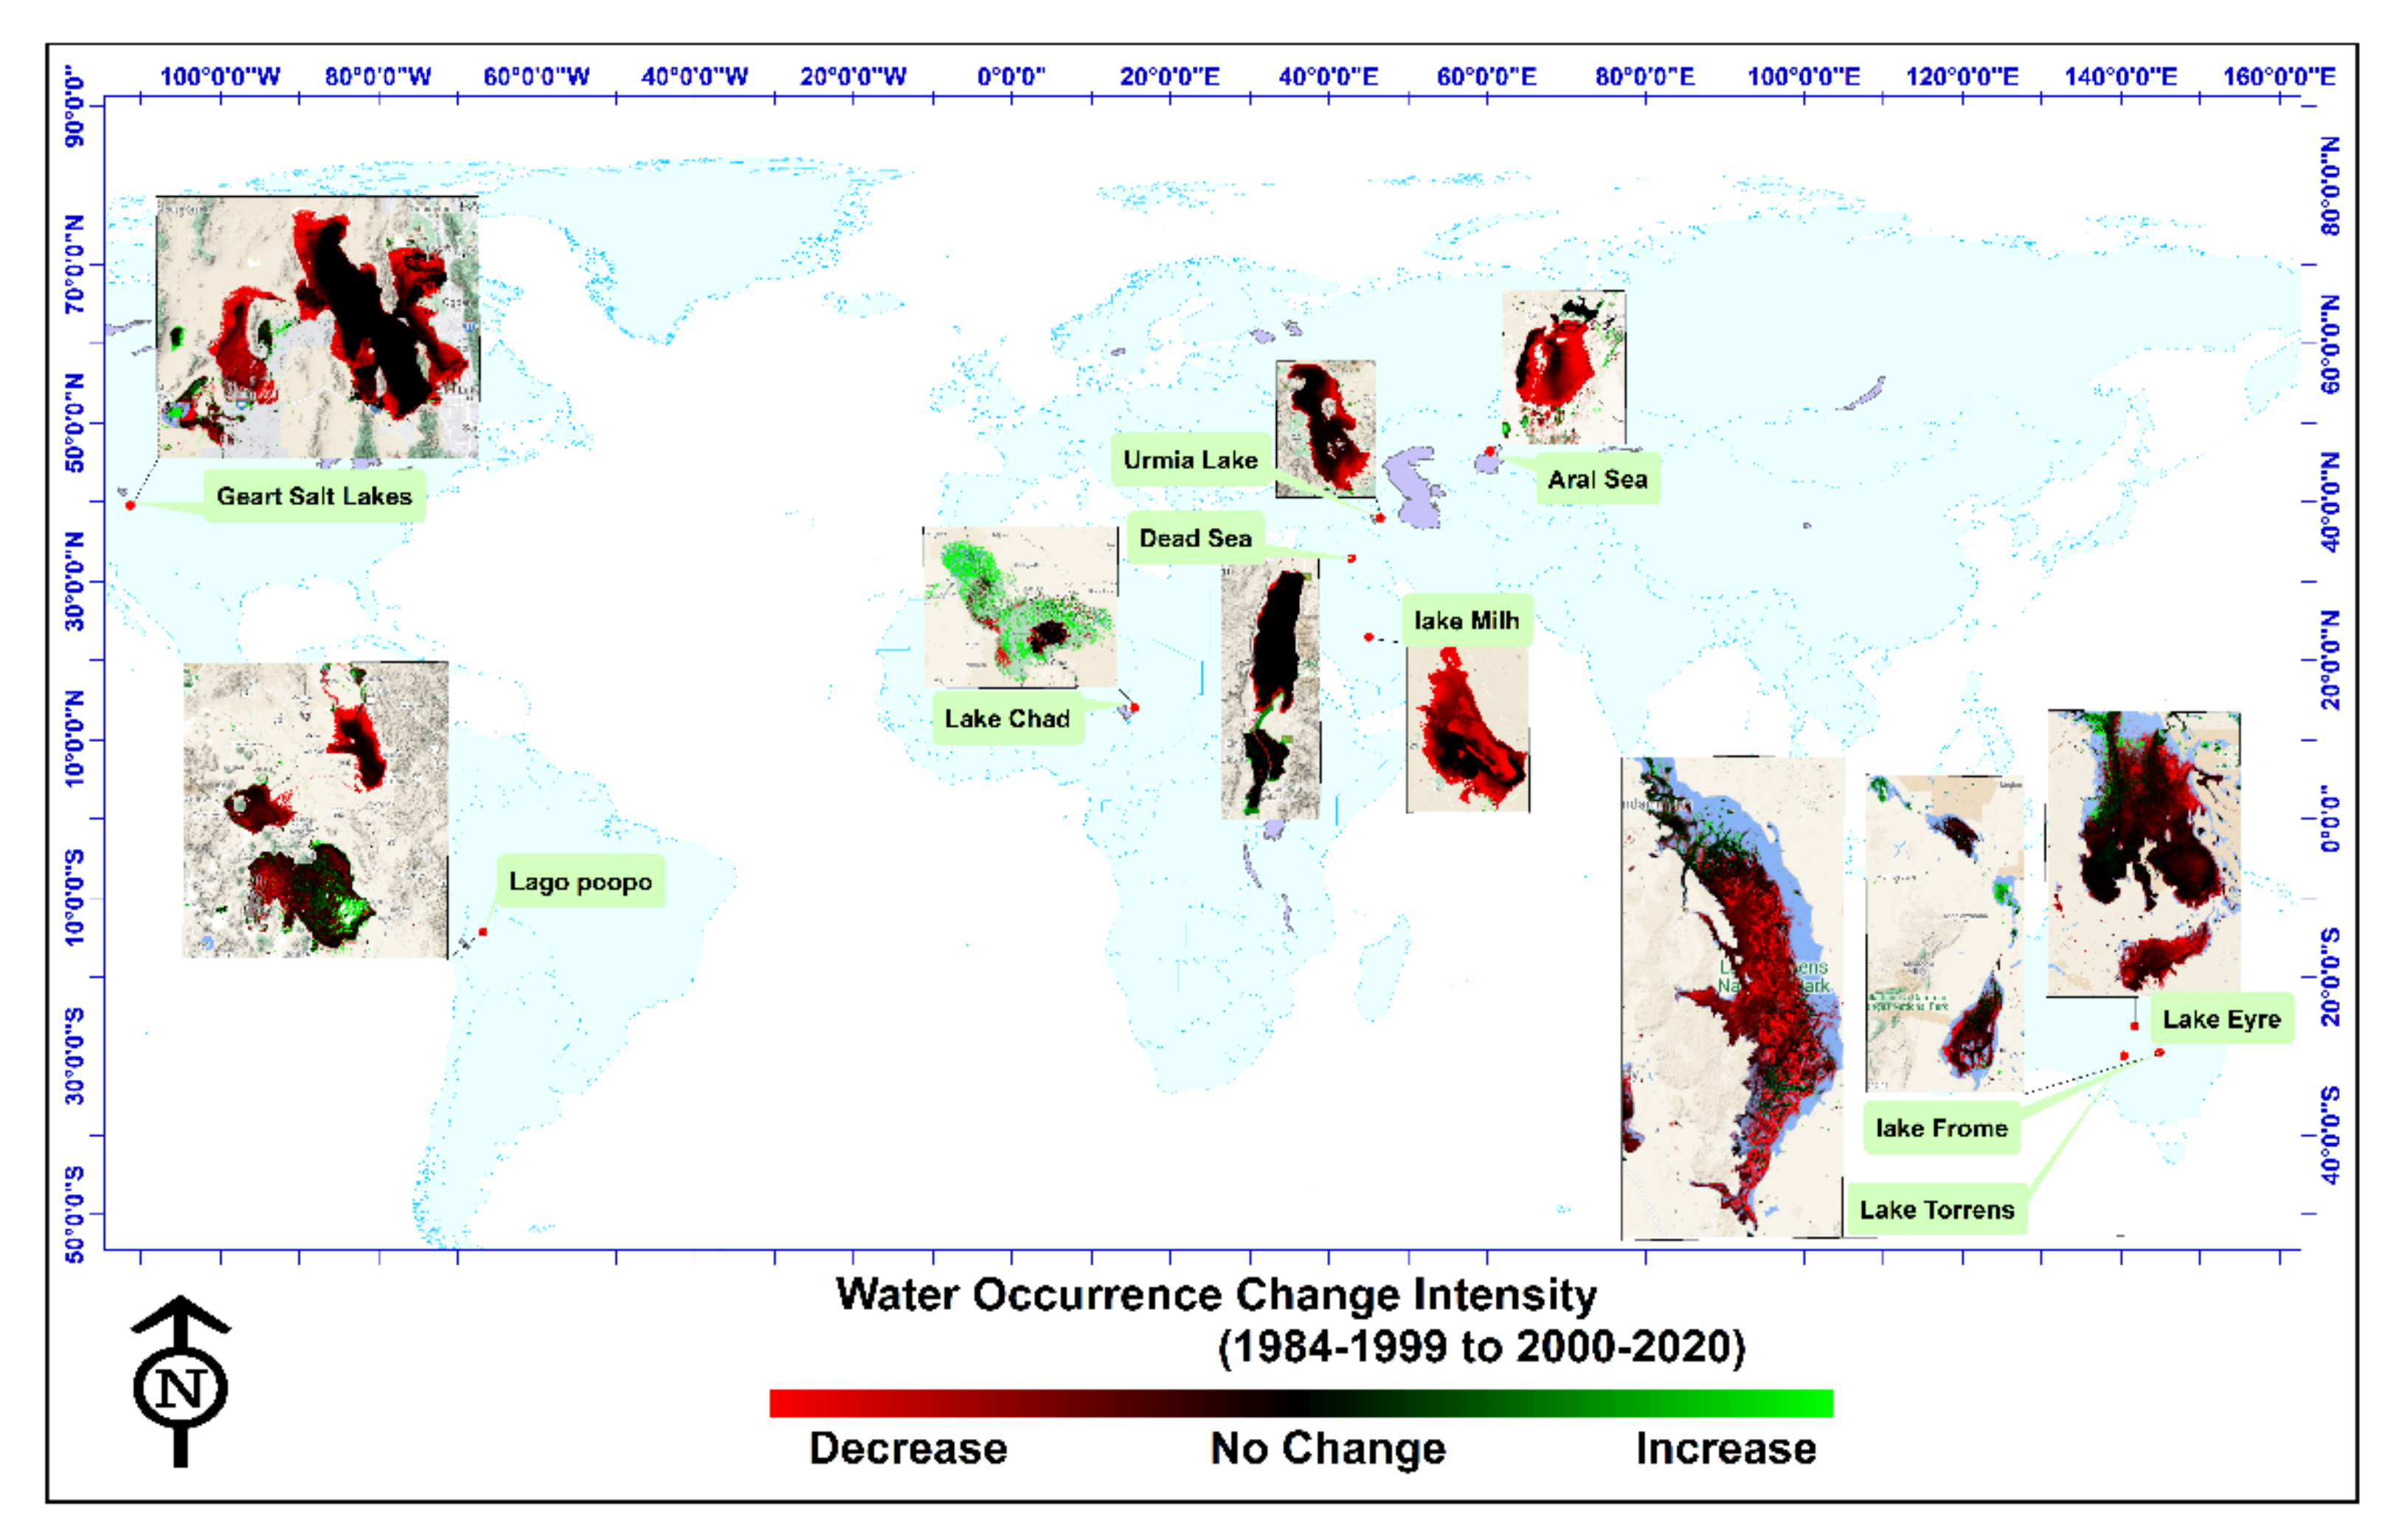
Figure 1. Examples of the observed decrease in surface water area in major salt lakes worldwide over the period 1984–2015 [6].
Sustainability 13 11495 g001
Figure 2. Location of the study area (Urmia Lake basin) and settlements.
Sustainability 13 11495 g002
Figure 3. From 1975 to 2018, the salinisation and desertification of Urmia Lake progressed.
Sustainability 13 11495 g003
Figure 4. Lake Urmia restoration road map.
Sustainability 13 11495 g004
Figure 5. MICMAC influence–dependence map.
Sustainability 13 11495 g005
Figure 6. Direct influence–dependence map.
Sustainability 13 11495 g006
Figure 7. Direct influence graph.
Sustainability 13 11495 g007
Figure 8. The amount of groundwater extracted in the Urmia Lake basin has changed dramatically over the last four decades.
Sustainability 13 11495 g008
Figure 9. The distribution and locations of water extraction wells in Lake Urmia’s basin. The majority of the lake basin wells are located towards the southeast and west of the lake.
Sustainability 13 11495 g009
Figure 10. Monthly variations in the average and maximum suspended particle concentrations less than 10 microns at the Islamic Island (the largest island in Urmia Lake) station.
Sustainability 13 11495 g010
Figure 11. The number of farms with horticultural activity in three provinces around Lake Urmia.
Sustainability 13 11495 g011
Figure 12. The decreased water level of Lake Urmia and its consequences in the surrounding settlements.
Sustainability 13 11495 g012
Figure 13. Migrants entered and exited during consecutive census (1986–2006, the Iran–Iraq war caused people to migrate from this border province) (Iran Statistical Yearbook).
Sustainability 13 11495 g013
Figure 14. The populated and depopulated villages in the East Azerbaijan province according to the consecutive census.
Sustainability 13 11495 g014
Figure 15. Distribution of settlements in the Lake Urmia basin.
Sustainability 13 11495 g015
Table 1. Economic-social and ecological characteristic of Urmia Lake.
AttributesDescription
SocialSettlementPopulation
31865 million
Village3150City69%
City36Village31%
EconomicGDP percent share Employment sectors
Service58Service sector39%
Agriculture15Agriculture sector36%
Industry27Industry sector25%
Cultivation Status
Aquaculture39.6%
Rain-fed Agriculture60.4%
EcologicalConservation statusProductsServicesFunctions
Lake is a National Park, Protected since 1957 (No hunting
area), Ramsar site, UNESCO Biosphere Reserve
Salt harvest, grazing for domestic animals, Artemia harvest, fishery) some satellite wetlands only), controlling saline underground waters, water-birds for hunting, reeds, fodder, medicinal herbsTourism/eco-tourism, recreation, education, training, research,
therapeutic muds, cultural heritage
Lake: Biodiversity support, landscape, climatic moderation, pollution and sediment retention. Satellite Wetlands: Biodiversity support, landscape, ground water recharge, climatic moderation, pollutant and sediment retention
ClimateElevation (m)Average annual daily temperature (°C)Frost (Days)Average Wind speed (Km/h)Evapotranspiration (mm)
1361MinAve.Max101.02.91626
16.712.117.6
Table 2. Expert panel characteristics.
GroupIDAffiliationImplementation
Urmia Lake Restoration centre CommitteeX1Chairman House Agriculture CommitteeXP
X2Head of Urmia Lake Restoration centre, East Azerbaijan province BranchXP
X3Member of the Social & Cultural Council of Urmia Lake Restoration centreXP
X4head of the National Wheat Farmers FoundationQ
X5Chairman of the Alternative Employment and Livelihood Committee of Urmia Lake Restoration centreXP
X6Head of the Lake Urmia Monitoring Department of Tabriz UniversityXP
X7Chairman of the NGO CommitteeXP
X8Member of the Social & Cultural Council of Urmia Lake Restoration centreXP
X9Member of the Social & Cultural Council of Urmia Lake Restoration centreXP
Researchers who have worked on Aral sea and Lake Urmia.X10Teaching Assistant at The University of British Columbia, As part of the NSERC ResNet Strategic NetworkQ
X11institute of geology and geophysics, Uzbekistan Academy of Sciences Q
X12Faculty of Geography, Lomonosov Moscow State University(PhD)Q
X13Chief of Executing Office (Head), Agency for project implementation of the International Fund for the Aral Sea SavingQ
X14Head of Department, Urmia Lake Restoration Program-Sharif University of TechnologyQ
X15Professor (Assistant), Faculty of Natural Resources, Urmia University, Urmia, Iran.Q
X15Professor (Associate), KIMEP University, KazakhstanQ
X16Head of Department, Urmia University, Urmia Lake Research InstituteQ
X17Researcher, Department of Environmental Systems Science, ETH ZurichQ
X18Department of Climatology, Faculty of Geography and Planning, University of TabrizQ
X19Department of Climatology, Faculty of Geography and Planning, University of TabrizQ
X20Head of Department, Associate Professor in Climatology at University of TehranQ
X21Professor of Climatology, University of Zanjan, Zanjan,Q
X22Professor of Natural Geography Department, University Of Mohaghegh ArdabiliQ
X23Researcher, Department Of geography and urban planning, University of ZanjanQ
X24Researcher, Department of Political Geography, Kharazmi UniversityQ
X25Researcher, Department of geography and urban-rural planning, University Of Mohaghegh ArdabiliQ
NGOs membersX26Active member of Lake Urmia Environmental Saviors InstituteQ
X27Active member of Yam Yashil Qushachai InstituteI
X28Active member of Tabriz Green Thinkers AssociationI
X29Active member of Iranian Environmental fans AssociationQ
X30Active member of Yam Yashil Qushachai InstituteQ
X31Active member of Yam Yashil Qushachai InstituteQ
P31Active member of Green Bio Collaborators AssociationQ
P32Active member of Green Hearts AssociationQ
P33Active member of ’ I’m Lake Urmia’ campaignQ
P34Active member of ’ I’m Lake Urmia’ campaignQ
P35Active member of ’ I’m Lake Urmia’ campaignQ
XP: An expert panel (official meeting) was held in the office of the Lake Urmia Restoration Center in East Azerbaijan Province. Led by a futurist researcher (Fellow at the National Research Institute for Science Policy. Futures Studies Postdoctoral Researcher, University of Tehran, Iran). I: Interview. Q: Questionnaire.
Table 3. Results of Round 3 of the Delphi survey (final environmental consequences).
Long LabelShort Label
1Increase TemperatureX1
2Extinction of WildlifeX2
3FloodX3
4Changing the Cultivation PatternX4
5Reducing Pasture areaX5
6Dust StormX6
7Soil and Water SalinityX7
8Groundwater Decline and DepletionX8
9Air pollutionX9
10Plant Extinction SpeciesX10
11DroughtX11
12Destruction of Surrounding Agricultural LandsX12
13Incidence of Different types of Diseases (respiratory, skin diseases, and various cancers)X13
14Threat of the Food ChainX14
15Disruption in Ecosystem Structure of lakeX15
16 DesertificationX16
17 Decreased Livability in Surrounding CitiesX17
Table 4. Direct influences matrix sample.
X1X2X3X4X5X6X7X8X9X10X11X12X13X14X15X16X17
X102120102000011002
X200003021000320220
X301003231233223331
X401303313011232320
X520230313022033002
X601110000000000103
X701031202000011020
X801022110001030003
X90010000000200101p
X1012333332303333332
X1121201000000002232
X1213210000033012123
X1302232202011201213
X1402331302031100110
X1521210000111201002
X1622011100000000003
X1700000000002000000
Publisher’s Note: MDPI stays neutral with regard to jurisdictional claims in published maps and institutional affiliations.