
A Study on Dining-Out Trends Using Big Data: Focusing on Changes since COVID-19


Abstract
:1. Introduction
2. Related Studies
2.1. Changes in Dining-Out Patterns after the COVID-19 Pandemic
2.2. Big Data Analysis in the Foodservice Industry
3. Research Methodology
3.1. Data and Summary Statistics
3.2. Methodology
4. Results
4.1. Content Analysis
4.2. Text-Mining Analysis
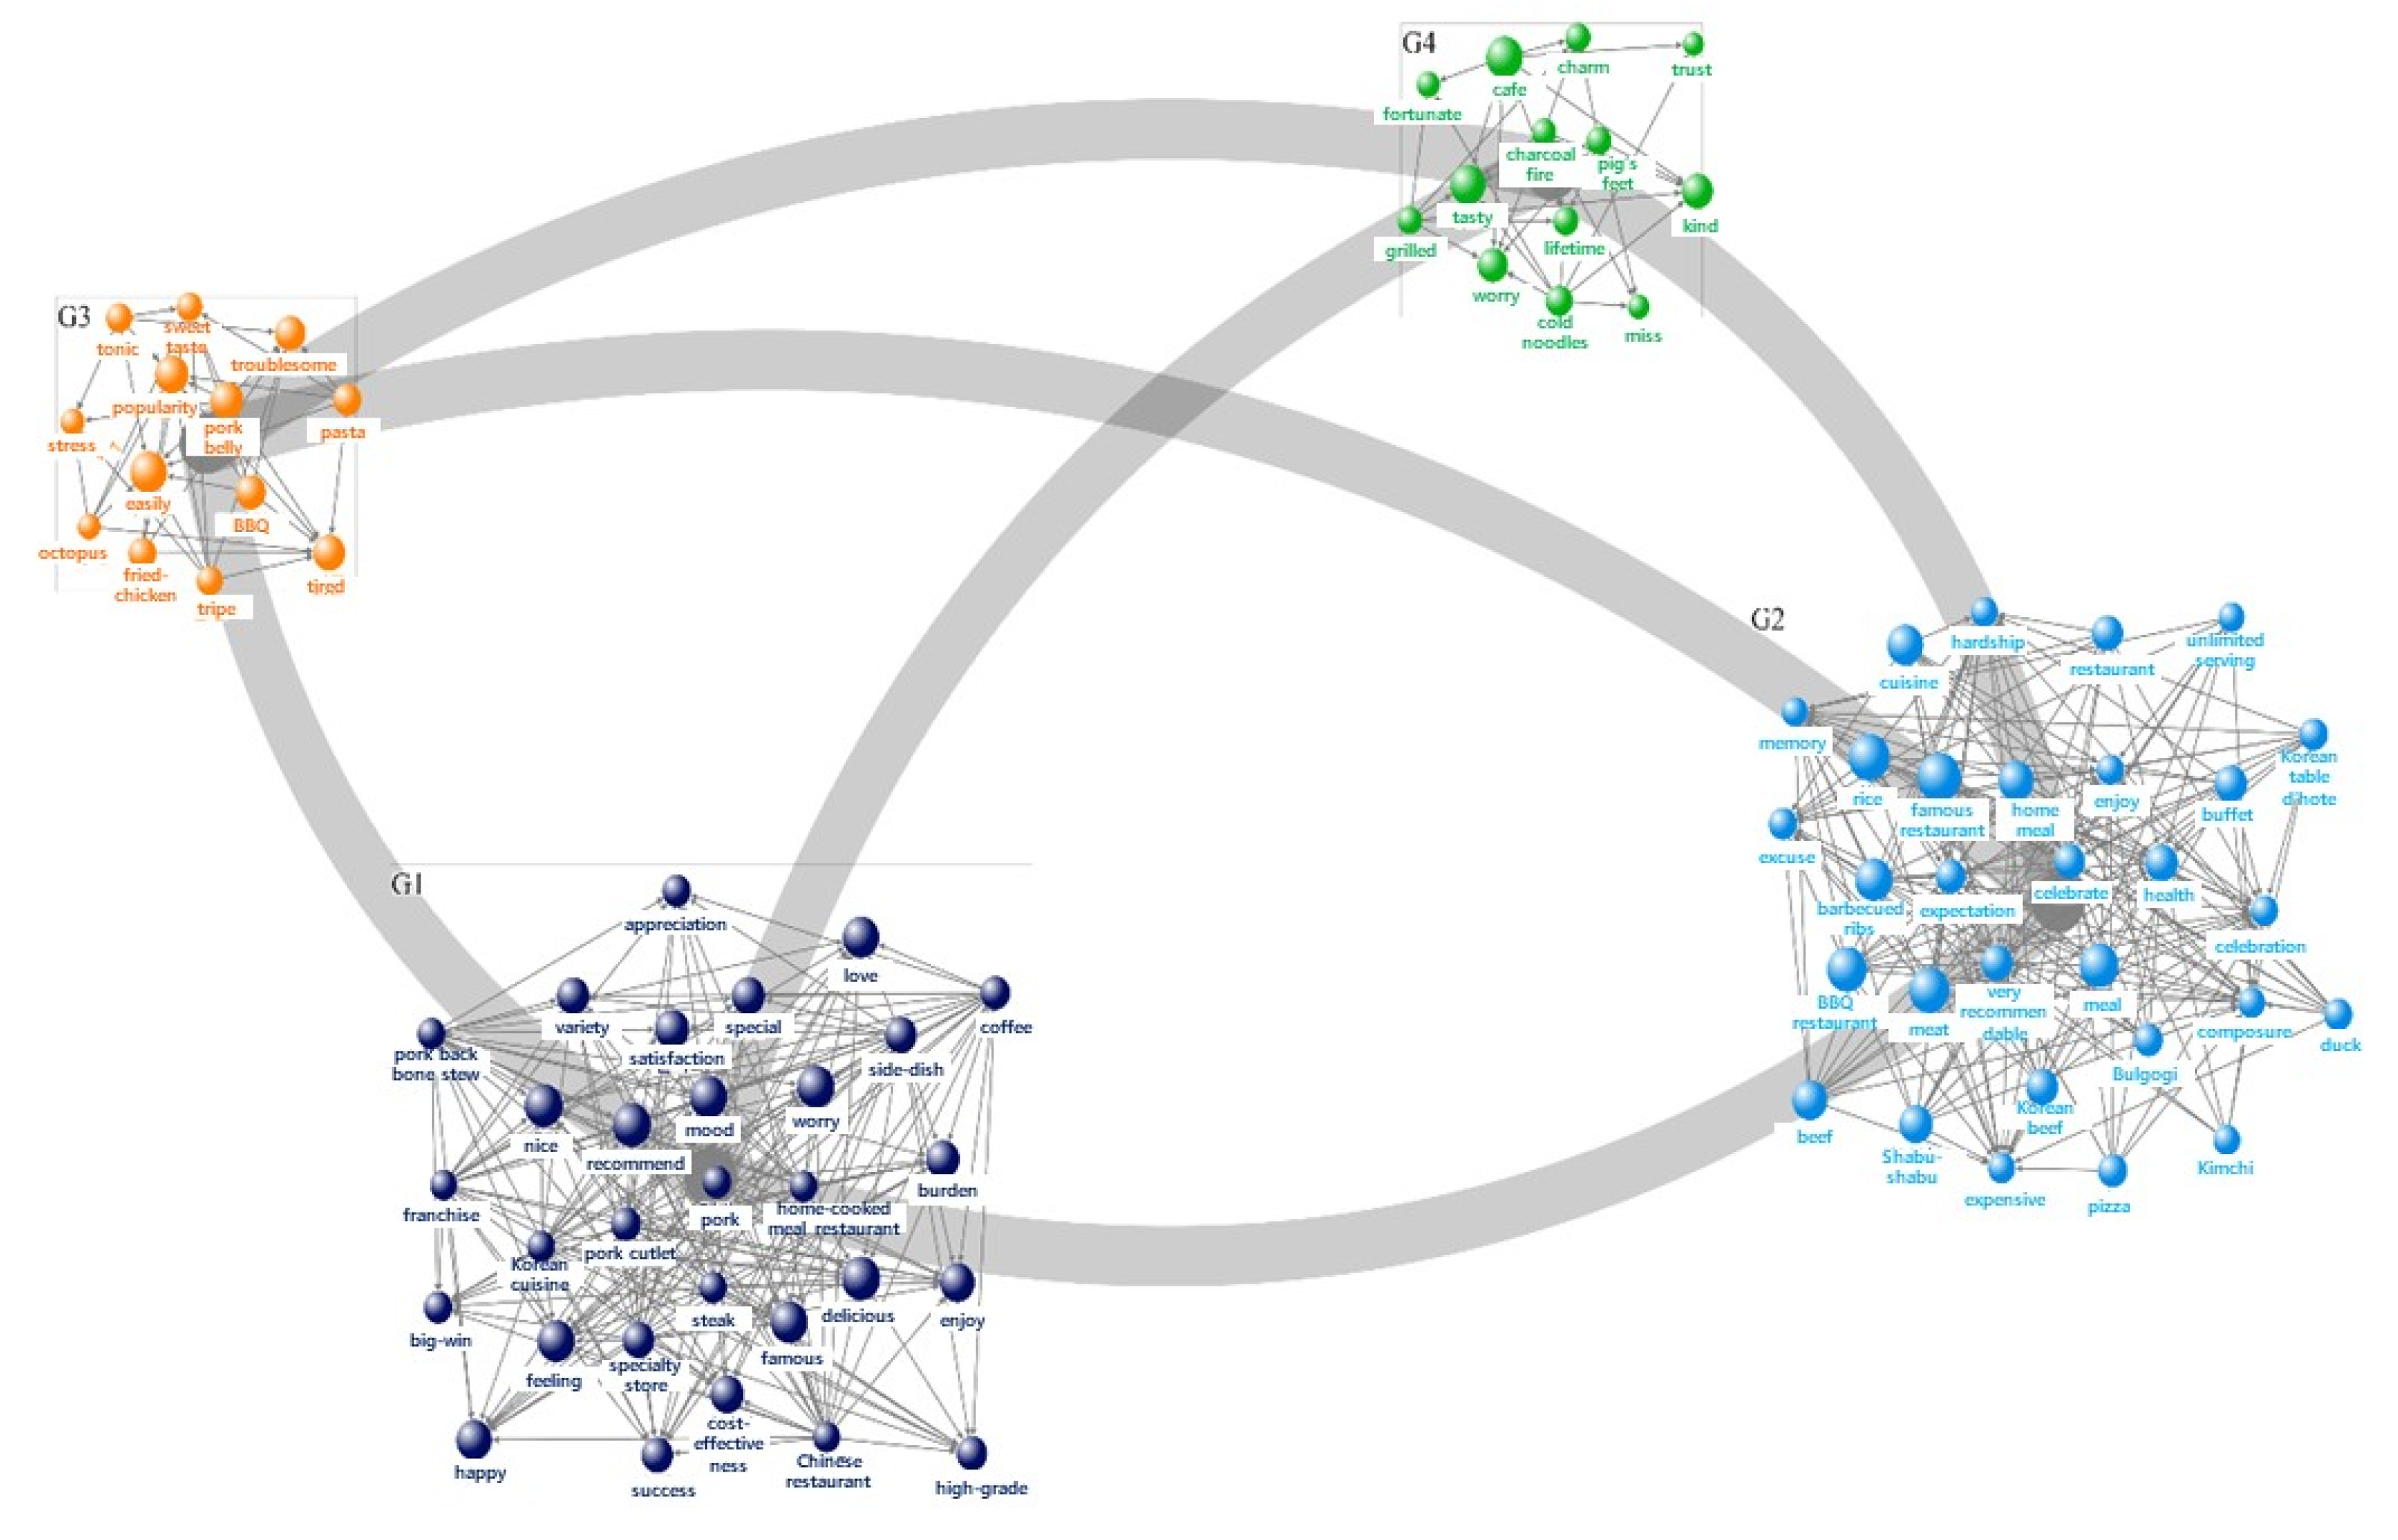
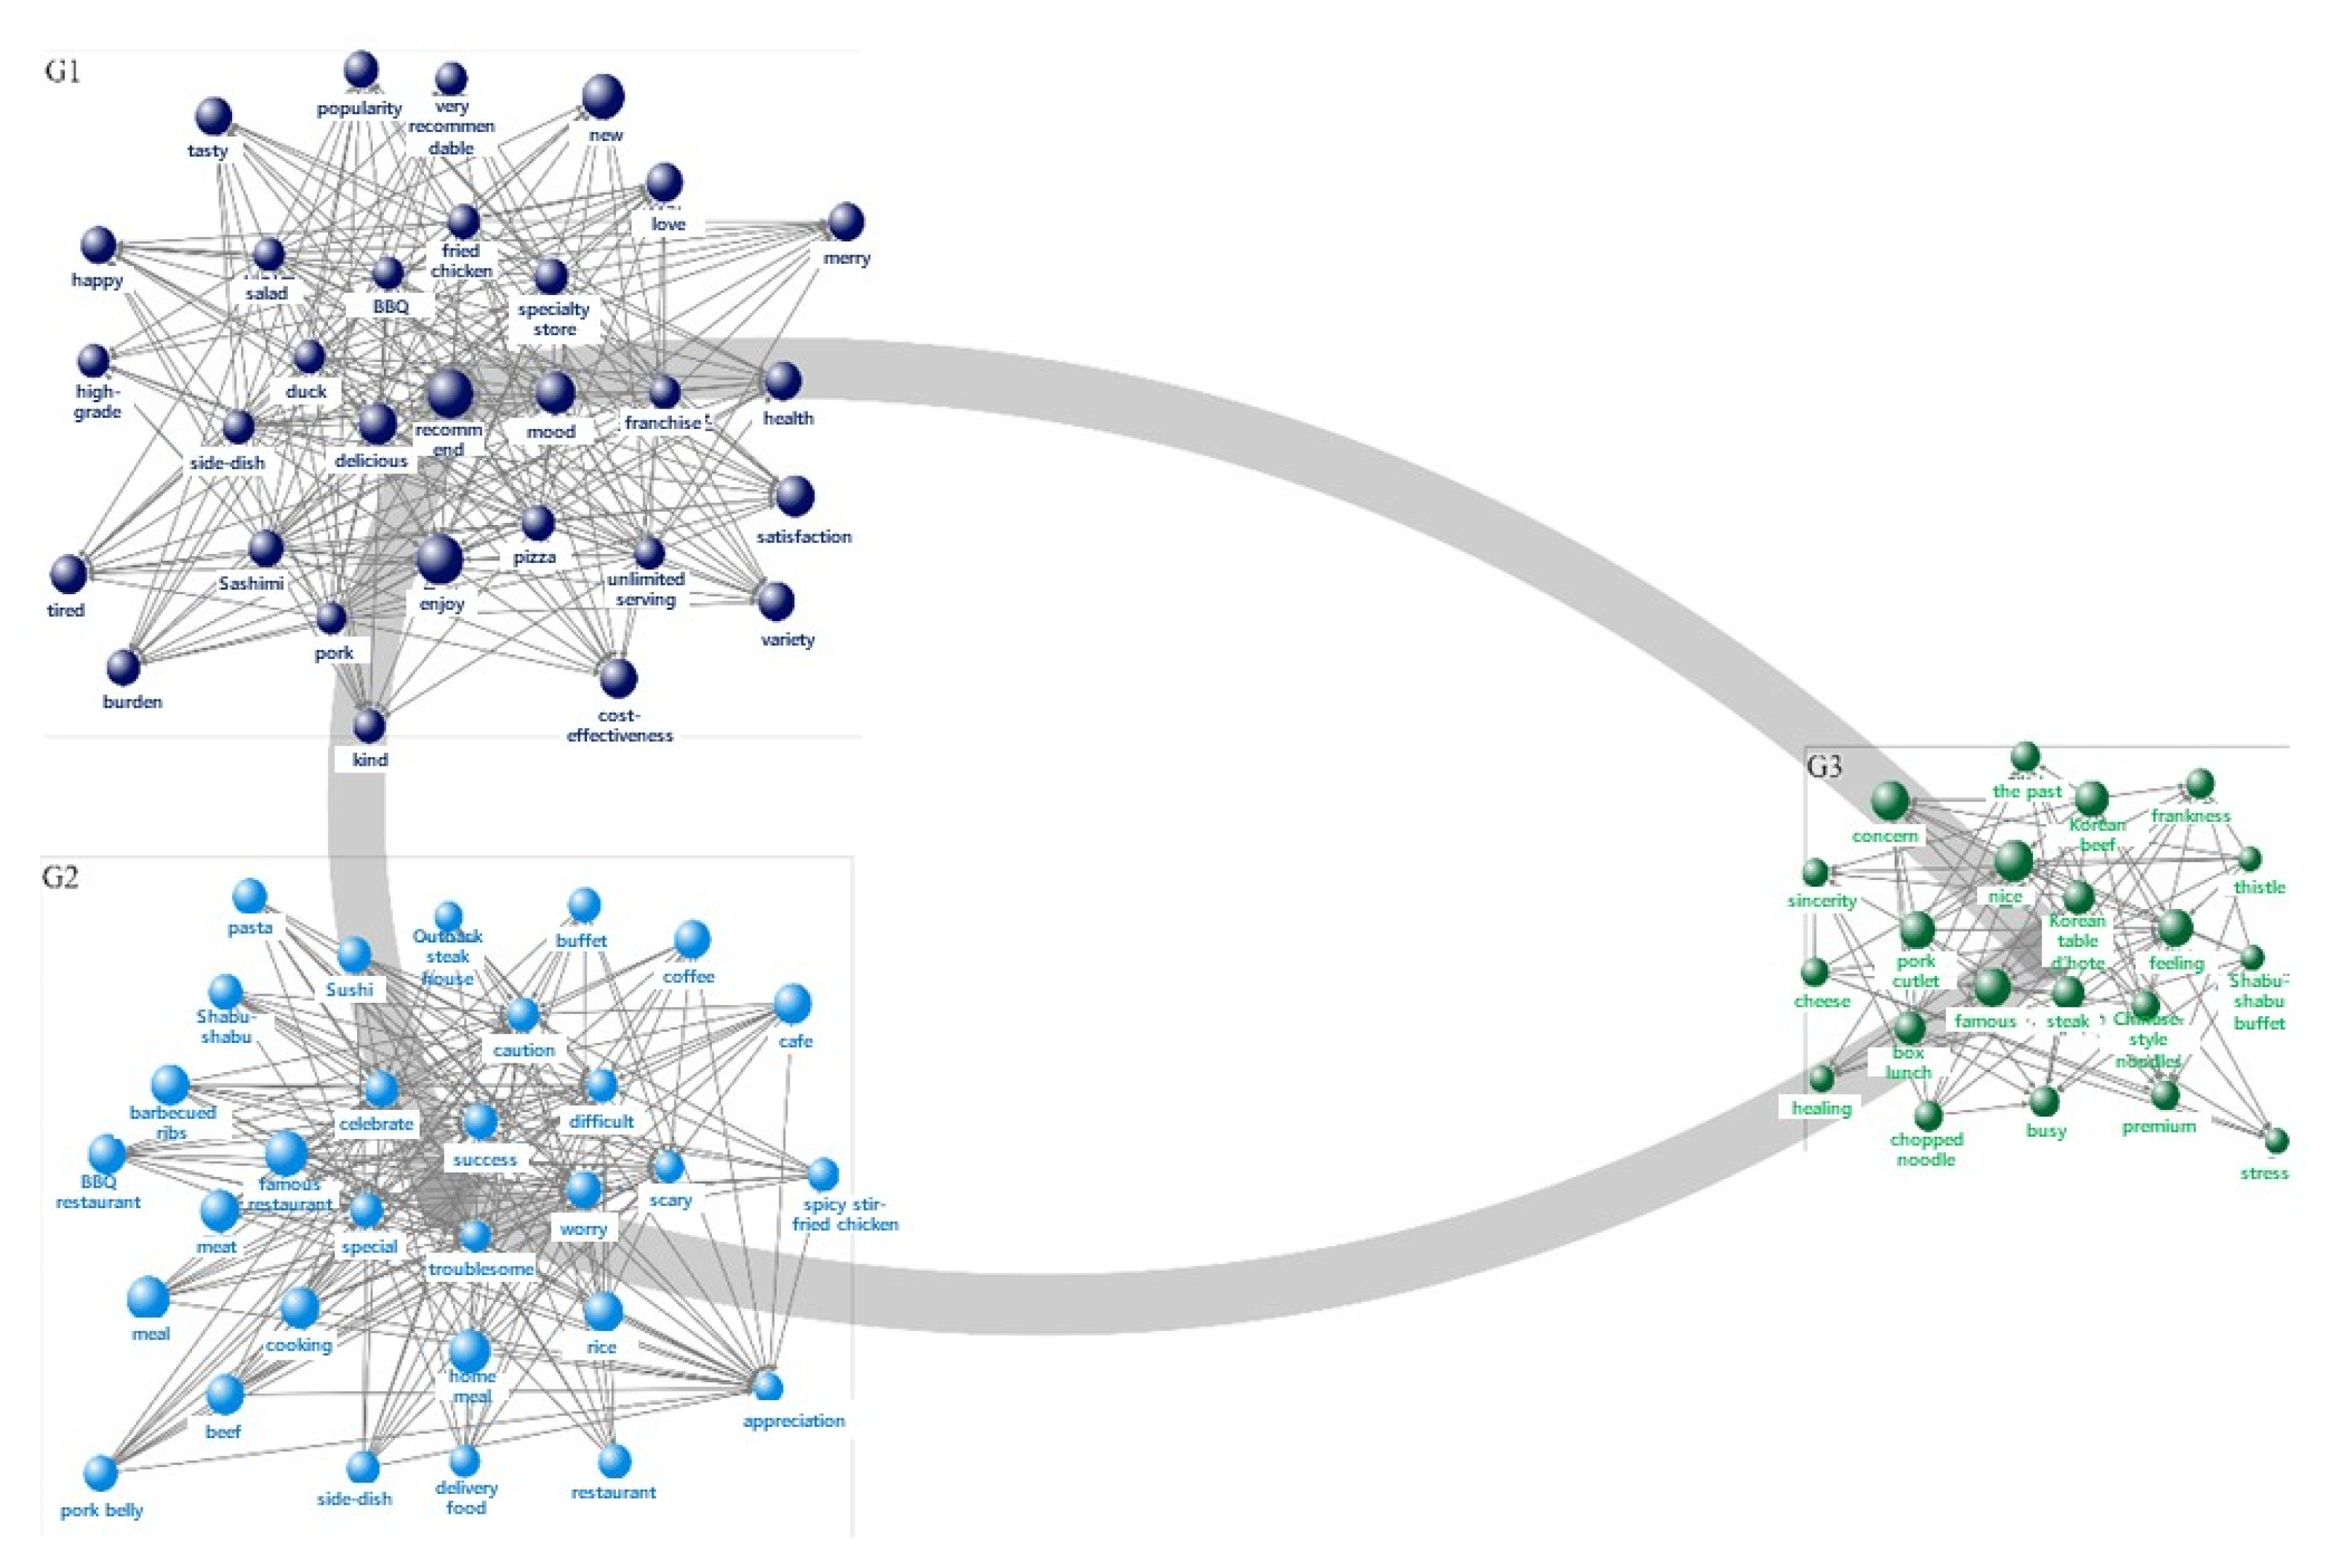
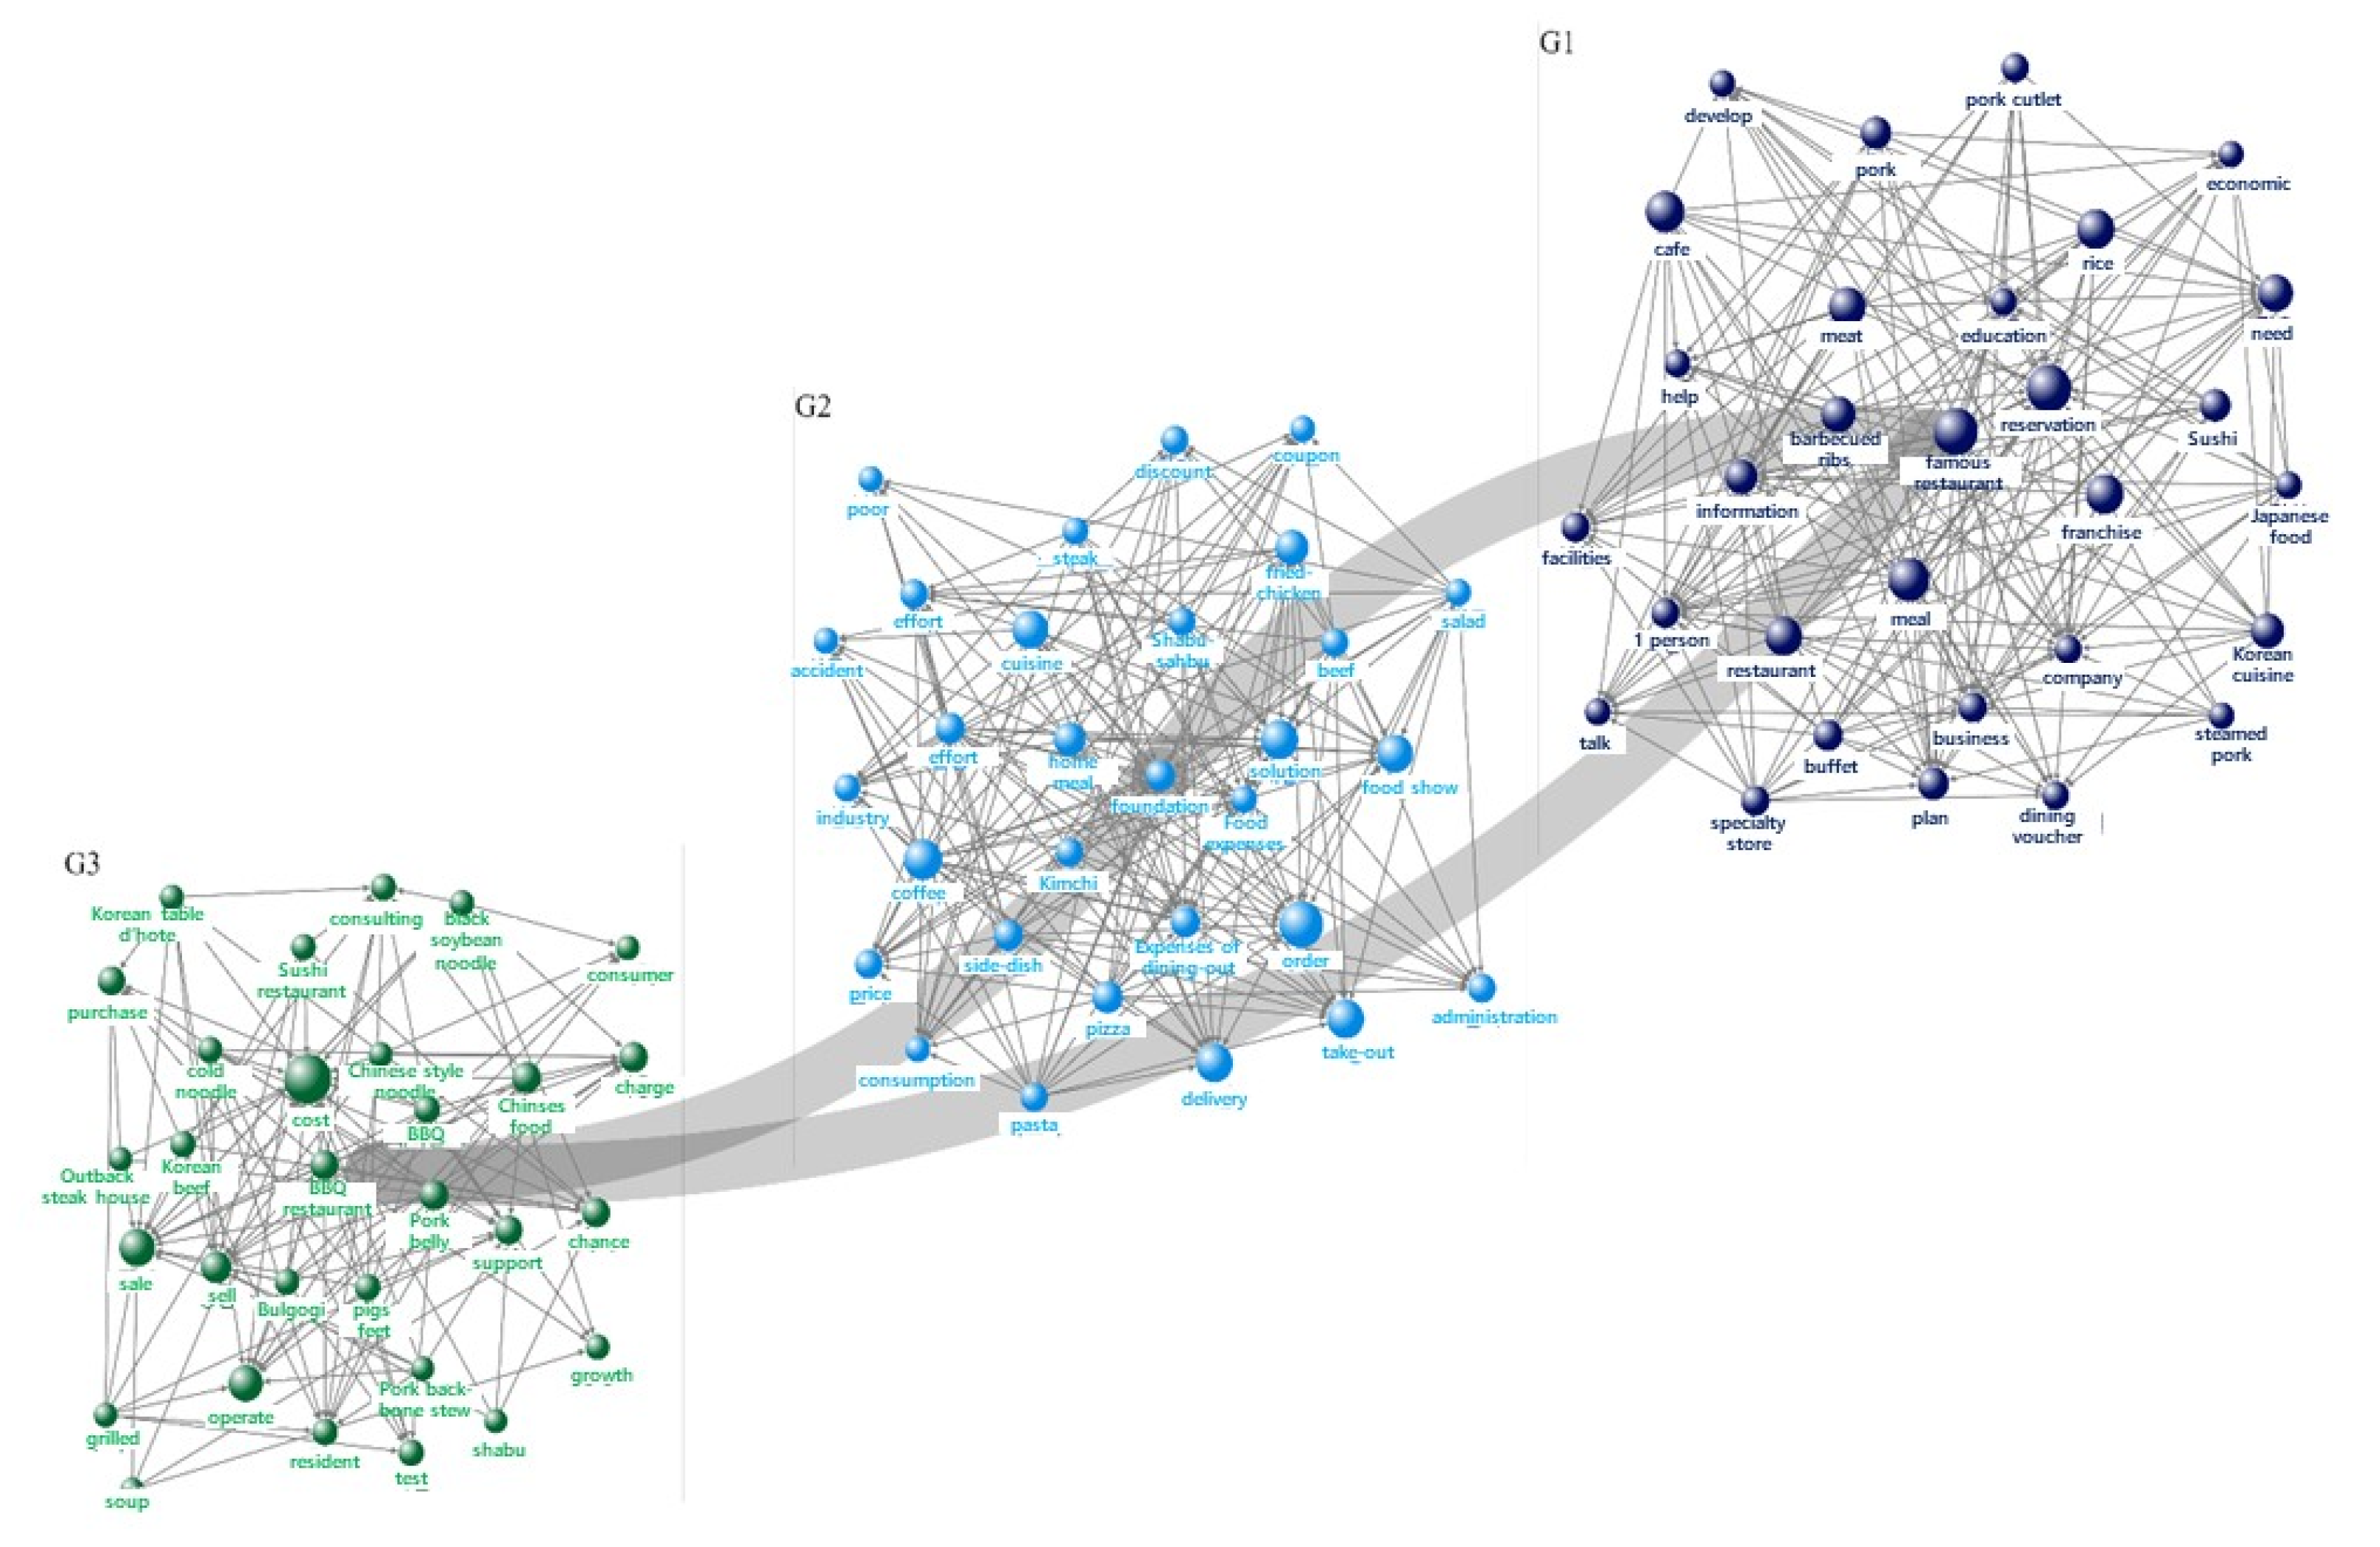
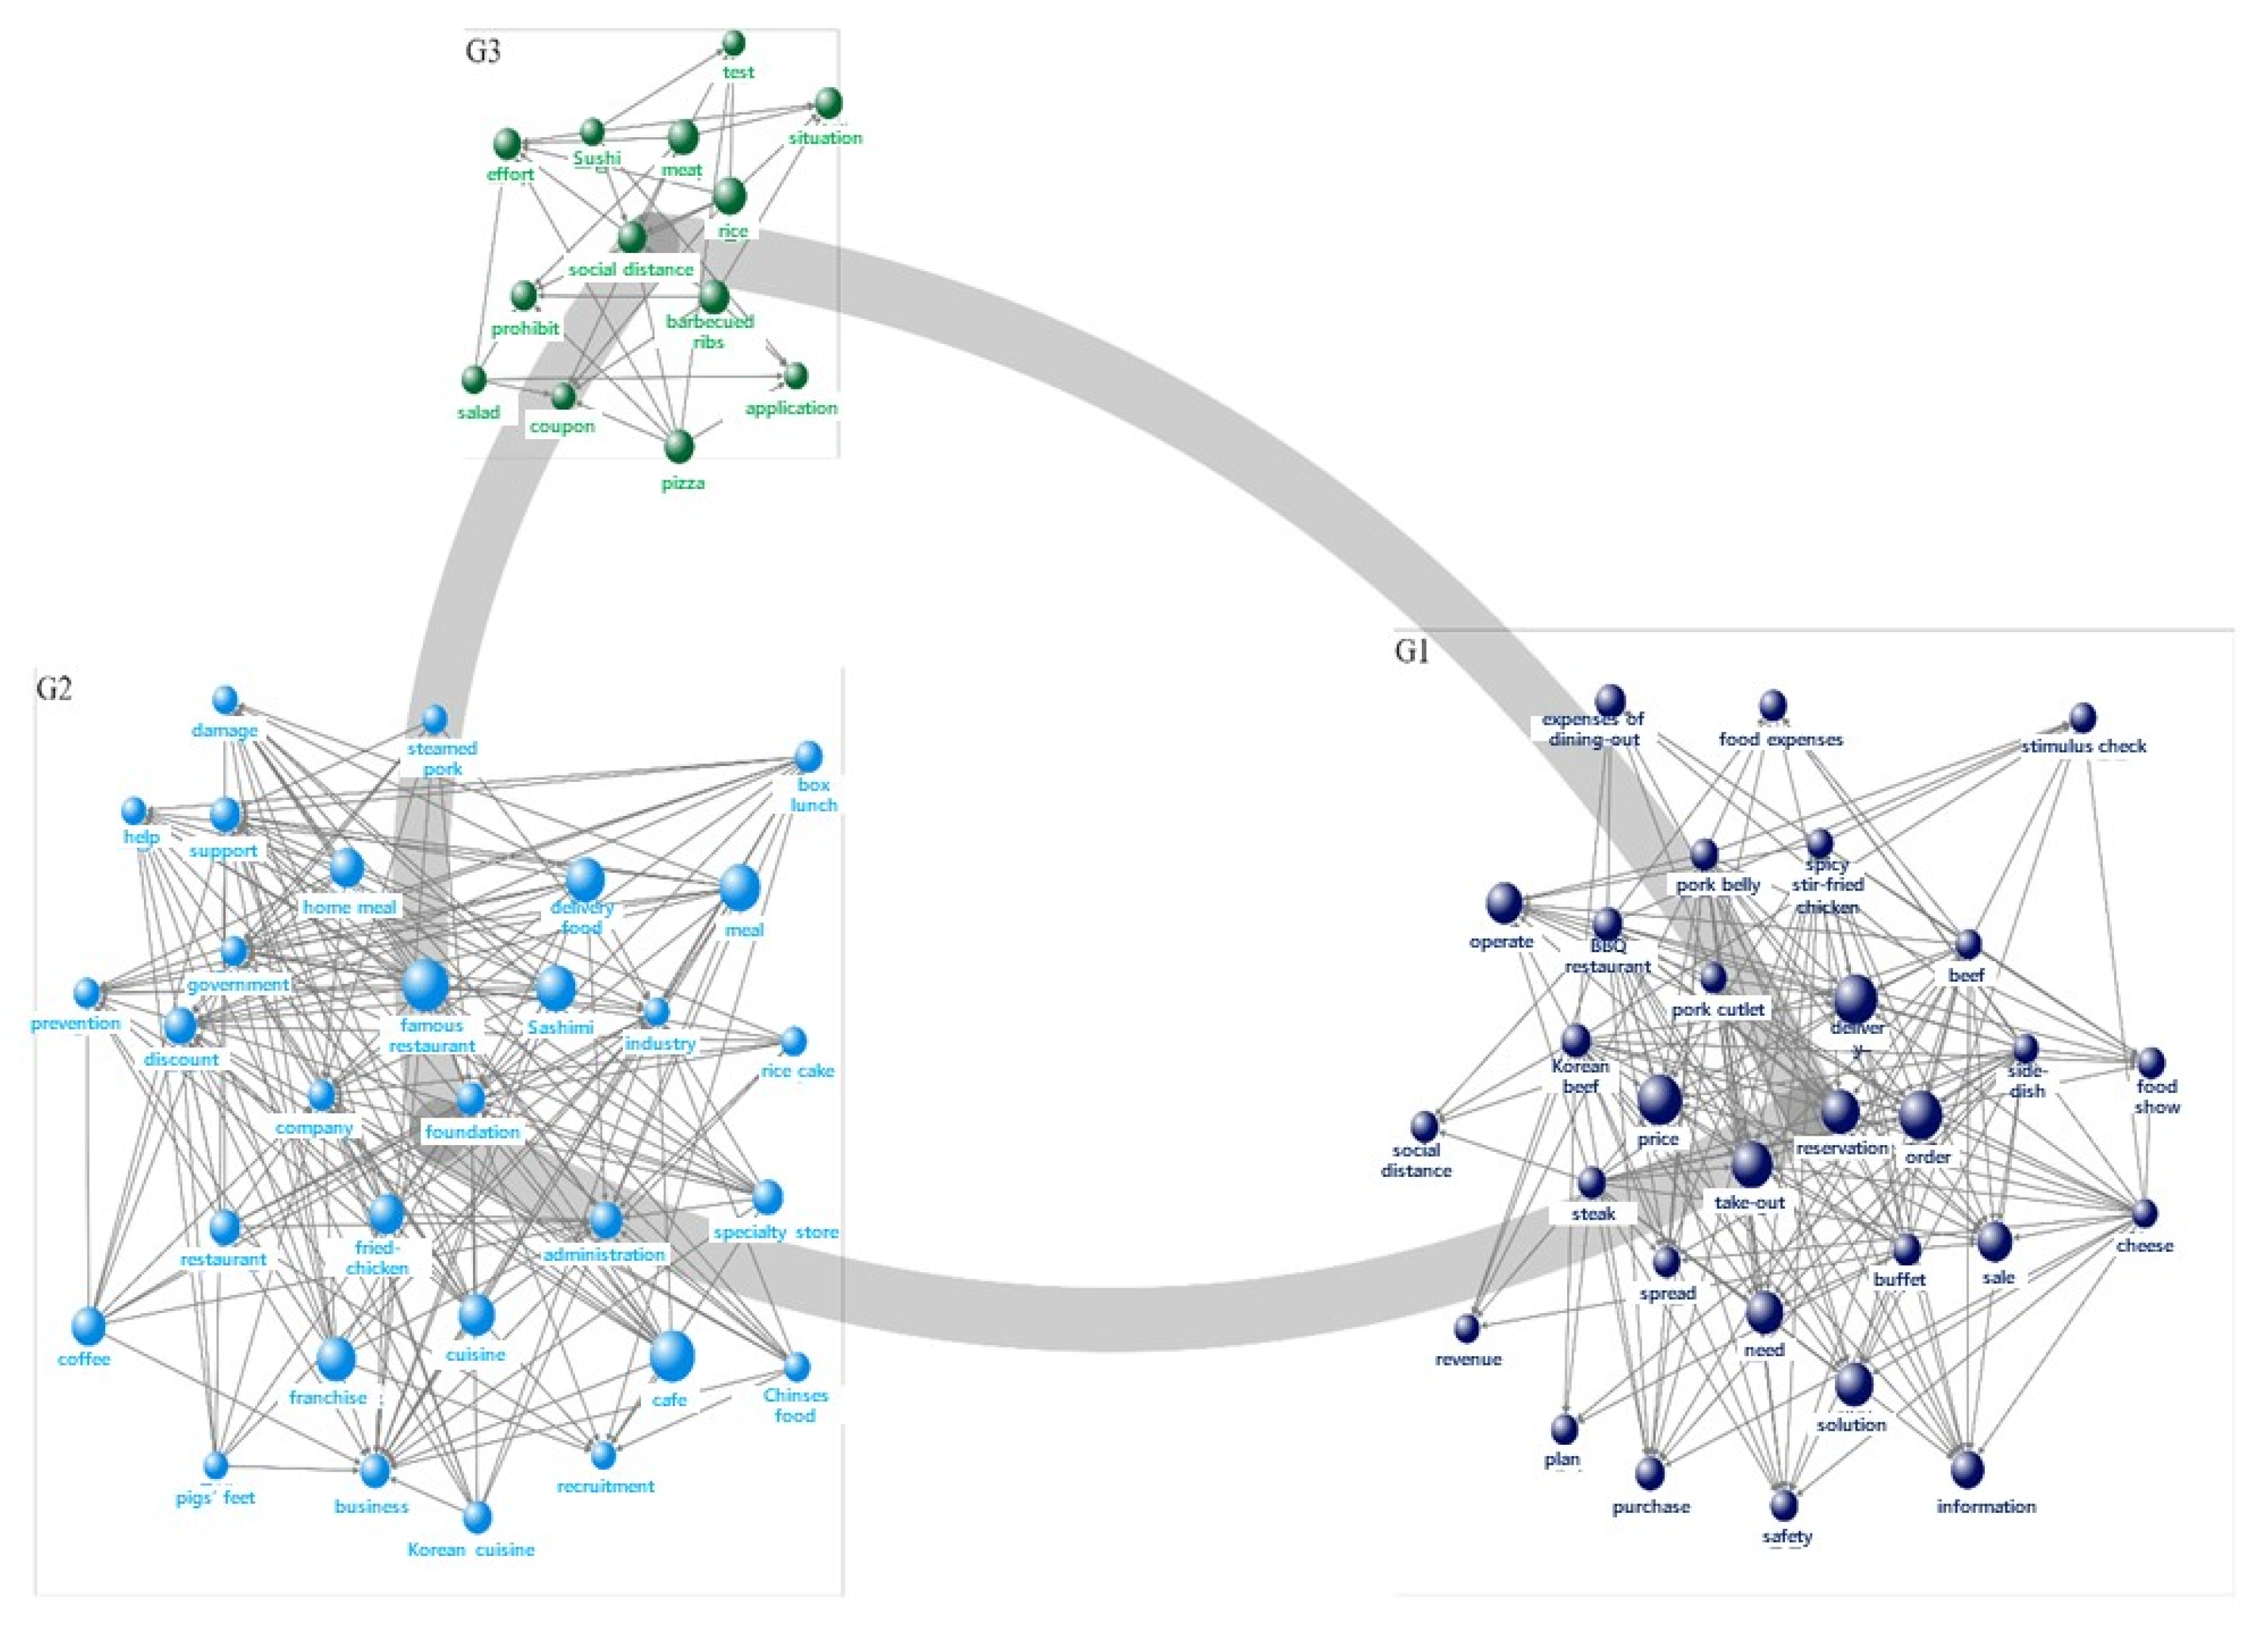
4.3. Semantic Network Analysis
4.4. Sentiment Analysis
5. Discussion and Implications
Author Contributions
Funding
Institutional Review Board Statement
Informed Consent Statement
Data Availability Statement
Conflicts of Interest
References
- Hou, R.; Kong, Y.; Cai, B.; Liu, H. Unstructured big data analysis algorithm and simulation of Internet of Things based on machine learning. Neural Comput. Appl. 2020, 32, 5399–5407. [Google Scholar] [CrossRef]
- Carter, P. Big Data Analytics, Future Architectures, Skills & Road Maps for the CIO; IDC White Paper; IDC: Needham, MA, USA, September 2011; pp. 1–14. [Google Scholar]
- Laney, D. The importance of big data: A definition. Gart. Retrieved 2012, 21, 1–9. [Google Scholar]
- McKinsey. Big Data: The Next Frontier for Innovation, Competition, and Productivity; McKinsey Global Institute: Chicago, IL, USA, 2011. [Google Scholar]
- Mangold, W.G.; Faulds, D.J. Social media: The new hybrid element of the promotion mix. Bus. Horiz. 2009, 52, 357–365. [Google Scholar] [CrossRef]
- Bremmer, C. The Voice of the Industry: Travel. Euro-Monitor Int. Available online: www.portal.euromonitor.com (accessed on 23 October 2019).
- Yallop, A.; Seraphin, H. Big data and analytics in tourism and hospitality: Opportunities and risks. J. Tour. Future 2020, 6, 257–262. [Google Scholar] [CrossRef]
- Sheng, J.; Amankwah-Amoah, J.; Khan, Z.; Wang, X. COVID-19 Pandemic in the New Era of Big Data Analytics: Methodological Innovations and Future Research Directions. Br. J. Manag. 2021, 32, 1164–1183. [Google Scholar] [CrossRef]
- Yang, Y.; Liu, H.; Chen, X. COVID-19 and restaurant demand: Early effects of the pandemic and stay-at-home orders. Int. J. Contemp. Hosp. Manag. 2020, 32, 3809–3834. [Google Scholar] [CrossRef]
- Drouin, M.; McDaniel, B.T.; Pater, J.; Toscos, T. How parents and their children used social media and technology at the begin-ning of the COVID-19 pandemic and associations with anxiety. Cyberpsychol. Behav. Soc. Netw. 2020, 23, 727–736. [Google Scholar] [CrossRef]
- Kydros, D.; Argyropoulou, M.; Vrana, V. A Content and Sentiment Analysis of Greek Tweets during the Pandemic. Sustainability 2021, 13, 6150. [Google Scholar] [CrossRef]
- Ahn, J.; Cho, M. Exploring restaurant selection attributes using IPA during the COVID-19 Pandemic. J. Hotel Resort 2020, 19, 201–218. [Google Scholar]
- Han, J.S.; Yoon, J.H. Activation strategies of the 20th BIFF using social big data text mining analysis. J. Tour. Sci. 2016, 40, 133–145. [Google Scholar] [CrossRef]
- Alsetoohy, O.; Ayoun, B.; Abou-Kamar, M. COVID-19 pandemic is a wake-up call for sustainable local food supply chains: Ev-idence from green restaurants in the USA. Sustainability 2021, 13, 9234. [Google Scholar] [CrossRef]
- Ferrante, M.J.; Goldsmith, J.; Tauriello, S.; Epstein, L.H.; Leone, L.A.; Anzman-Frasca, S. Food Acquisition and Daily Life for U.S. Families with 4-to 8-Year-Old Children during COVID-19: Findings from a Nationally Representative Survey. Int. J. Environ. Res. Public Health 2021, 18, 1734. [Google Scholar] [CrossRef] [PubMed]
- Bogevska, Z.; Berjan, S.; Bilali, H.E.; Allahyari, M.S.; Radosavac, A.; Davitkovska, M. Exploring food shopping, consumption and waste habits in North Macedonia during the COVID-19 pandemic. Socio-Econ. Plan. Sci. 2021, 101150. [Google Scholar] [CrossRef]
- Filimonau, V.; Vi, L.H.; Beer, S.; Ermolaev, V.A. The Covid-19 pandemic and food consumption at home and away: An explor-atory study of English households. Socio-Econ. Plan. Sci. 2021, 101125. (in press). [Google Scholar] [CrossRef]
- Ronto, R.; Nanayakkara, J.; Worsley, A.; Rathi, N. COVID-19 & culinary behaviours of Australian household food gatekeepers: A qualitative study. Appetite 2021, 167, 105598. [Google Scholar] [CrossRef] [PubMed]
- Bender, K.E.; Badiger, A.; Roe, B.E.; Shu, Y.; Qi, D. Consumer behavior during the COVID-19 pandemic: An analysis of food purchasing and management behaviors in U.S. households through the lens of food system resilience. Socio-Econ. Plan. Sci. 2021, 2021, 101107. [Google Scholar] [CrossRef]
- Byrd, K.; Her, E.; Fan, A.; Almanza, B.; Liu, Y.; Leitch, S. Restaurants and COVID-19: What are consumers’ risk perceptions about restaurant food and its packaging during the pandemic? Int. J. Hosp. Manag. 2021, 94, 102821. [Google Scholar] [CrossRef]
- Kim, J.; Lee, J.C. Effects of COVID-19 on preferences for private dining facilities in restaurants. J. Hosp. Tour. Manag. 2020, 45, 67–70. [Google Scholar] [CrossRef]
- Zhong, Y.; Oh, S.; Moon, H.C. What can drive consumers’ dining-out behavior in China and Korea during the COVID-19 Pan-demic? Sustainability 2021, 13, 1724. [Google Scholar] [CrossRef]
- McAfee, A.; Brynjolfsson, E. Big data: The management revolution. Harv. Bus. Rev. 2012, 90, 4–5. [Google Scholar]
- Tran, M.T.; Jeeva, A.S.; Pourabedin, Z. Social network analysis in tourism services distribution channels. Tour. Manag. Perspect. 2016, 18, 59–67. [Google Scholar] [CrossRef]
- Jin, C.; Bouzembrak, Y.; Zhou, J.; Liang, Q.; Bulk, L.M.V.D.; Gavai, A.; Liu, N.; Heuvel, L.J.V.D.; Hoenderdaal, W.; Marvin, H.J. Big Data in food safety—A review. Curr. Opin. Food Sci. 2020, 36, 24–32. [Google Scholar] [CrossRef]
- Hwang, U.S. The analysis of interest trend of railway tourism by big data. J. Hotel Resort 2019, 18, 219–239. [Google Scholar]
- Lin, T.R.; Tsai, M.L. A study of big data analytics for E-commerce corporation business model. Value Manag. 2017, 27, 13–22. [Google Scholar]
- Yoon, J.S. Big data use case dictionary. Dataedu 2018, 419, 230–294. [Google Scholar]
- Kim, D.S.; Kim, W.S.; Lee, B.C. A case study of big data analysis in tourism and hospitality context. J. Hotel Resort 2019, 18, 197–218. [Google Scholar]
- Joseph, G.; Varghese, V. Analyzing Airbnb Customer Experience Feedback Using Text Mining. In Big Data and Innovation in Tourism, Travel, and Hospitality; Gabler: Singapore, 2019; pp. 147–162. [Google Scholar]
- Hu, N.; Zhang, T.; Gao, B.; Bose, I. What do hotel customers complain about? Text analysis using structural topic model. Tour. Manag. 2019, 72, 417–426. [Google Scholar] [CrossRef]
- Mayasari, N.R.; Ho, D.K.N.; Lundy, D.J.; Skalny, A.V.; Tinkov, A.A.; Teng, I.-C.; Wu, M.-C.; Faradina, A.; Mohammed, A.Z.M.; Park, J.M.; et al. Impacts of the COVID-19 Pandemic on Food Security and Diet-Related Lifestyle Behaviors: An Analytical Study of Google Trends-Based Query Volumes. Nutrients 2020, 12, 3103. [Google Scholar] [CrossRef]
- Jia, S. Analyzing Restaurant Customers’ Evolution of Dining Patterns and Satisfaction during COVID-19 for Sustainable Business Insights. Sustainability 2021, 13, 4981. [Google Scholar] [CrossRef]
- Chen, W.-K.; Riantama, D.; Chen, L.-S. Using a Text Mining Approach to Hear Voices of Customers from Social Media toward the Fast-Food Restaurant Industry. Sustainability 2020, 13, 268. [Google Scholar] [CrossRef]
- Yang, F.X.; Li, X.; Lau, V.M.C.; Zhu, V.Z. To survive or to thrive? China’s luxury hotel restaurants entering O2O food deliv-ery platforms amid the COVID-19 crisis. Int. J. Hosp. Manag. 2021, 94, 102855. [Google Scholar] [CrossRef]
- Jeong, C.; Moon, Y.; Hwang, Y.H. Analysis for daily food delivery and consumption trends in the post-covid-19 era through big data. J. Korea Soc. Comp. Inform. 2021, 26, 231–238. [Google Scholar]
- Zhang, C.; Jiang, J.; Jin, H.; Chen, T. The Impact of COVID-19 on Consumers’ Psychological Behavior Based on Data Mining for Online User Comments in the Catering Industry in China. Int. J. Environ. Res. Public Health 2021, 18, 4178. [Google Scholar] [CrossRef] [PubMed]
- Sung, Y.-A.; Kim, K.-W.; Kwon, H.-J. Big Data Analysis of Korean Travelers’ Behavior in the Post-COVID-19 Era. Sustainability 2020, 13, 310. [Google Scholar] [CrossRef]
- Park, T.-S. “A Study on the Perception of Ulsan Tourism and the Promotion Plans for the Future through the Analysis of Social Big Data: Focused on CONCOR Analysis Methodology”. Northeast. Asia Tour. Res. 2020, 16, 109–126. [Google Scholar] [CrossRef]
- Dsouza, D.; Sharma, D. Online food delivery portals during COVID-19 times: An analysis of changing consumer behavior and expectations. Int. J. Innov. Sci. 2021, 13, 218–232. [Google Scholar] [CrossRef]
- Kowalczuk, I.; Stangierska, D.; Gębski, J.; Tul-Krzyszczuk, A.; Zmudczyńska, E. Digital consumers in the foodservices market. Sustainability 2021, 13, 7403. [Google Scholar] [CrossRef]

| Data | Channel | Section | 2019 | 2020 |
|---|---|---|---|---|
| Dining-out | Naver | Blog | 10,899 | 11,147 |
| Cafe | 11,789 | 11,799 | ||
| Daum | Blog | 9896 | 10,464 | |
| Cafe | 6560 | 5830 |
| Categories | 2019 | 2020 | Total |
|---|---|---|---|
| Food | 256 | 245 | 295 |
| Sentimental | 83 | 89 | 102 |
| Demand | 89 | 116 | 127 |
| Tourism/Region | 160 | 165 | 189 |
| Total | 588 | 615 | 713 |
| Rank | Word | Freq. | TF-IDF | Rank | Word | Freq. | TF-IDF |
|---|---|---|---|---|---|---|---|
| 1 | dining-out | 70,288 | 0.09164 | 26 | industry | 1454 | 0.07708 |
| 2 | family | 23,807 | 0.07547 | 27 | husband | 1381 | 0.05833 |
| 3 | famous restaurant | 17,242 | 0.06471 | 28 | baby | 1307 | 0.06571 |
| 4 | recommend | 4820 | 0.05504 | 29 | sale | 1292 | 0.08035 |
| 5 | dinner | 4784 | 0.06592 | 30 | visit | 1261 | 0.04357 |
| 6 | delicious | 4286 | 0.05309 | 31 | restaurant management | 1243 | 0.11043 |
| 7 | weekend | 4283 | 0.06258 | 32 | price | 1231 | 0.04361 |
| 8 | menu | 3717 | 0.05702 | 33 | beef | 1146 | 0.05700 |
| 9 | restaurant | 3465 | 0.05526 | 34 | buffet | 1121 | 0.06578 |
| 10 | meat | 2966 | 0.05803 | 35 | friend | 1119 | 0.04866 |
| 11 | children | 2943 | 0.05517 | 36 | bride | 1115 | 0.05595 |
| 12 | barbecued ribs | 2485 | 0.06895 | 37 | pork cutlet | 1068 | 0.07999 |
| 13 | after a long interval | 2446 | 0.05645 | 38 | cooking | 1065 | 0.05390 |
| 14 | lunch | 2411 | 0.05758 | 39 | pork belly | 1064 | 0.06436 |
| 15 | get-together | 2283 | 0.05036 | 40 | birthday | 1061 | 0.06792 |
| 16 | BBQ restaurant | 2275 | 0.05831 | 41 | neighborhood | 1046 | 0.04460 |
| 17 | Pusan | 2207 | 0.06539 | 42 | mood | 1033 | 0.04735 |
| 18 | food | 2191 | 0.05241 | 43 | foundation | 1030 | 0.09500 |
| 19 | meal | 1970 | 0.04980 | 44 | Suwon | 1022 | 0.08136 |
| 20 | people | 1866 | 0.05426 | 45 | ingredient | 1010 | 0.06238 |
| 21 | taste | 1762 | 0.05221 | 46 | parents | 1006 | 0.05192 |
| 22 | rice | 1679 | 0.05378 | 47 | Korean beef | 999 | 0.07039 |
| 23 | time | 1628 | 0.04714 | 48 | son | 982 | 0.05974 |
| 24 | meeting | 1540 | 0.04591 | 49 | business | 980 | 0.06028 |
| 25 | mother | 1536 | 0.05363 | 50 | home meal | 975 | 0.05862 |
| Rank | Word | Freq. | TF-IDF | Rank | Word | Freq. | TF-IDF |
|---|---|---|---|---|---|---|---|
| 1 | dining-out | 69,850 | 0.06887 | 26 | rice | 1437 | 0.03745 |
| 2 | family | 20,063 | 0.05595 | 27 | hotel | 1415 | 0.07046 |
| 3 | famous restaurant | 15,536 | 0.04978 | 28 | restaurant management | 1386 | 0.08942 |
| 4 | recommend | 4610 | 0.04021 | 29 | meeting | 1349 | 0.03644 |
| 5 | taste | 4117 | 0.03626 | 30 | mother | 1335 | 0.03664 |
| 6 | Corona | 3584 | 0.03927 | 31 | cuisine | 1289 | 0.04262 |
| 7 | weekend | 3486 | 0.04453 | 32 | cooking | 1278 | 0.07097 |
| 8 | dinner | 3333 | 0.04344 | 33 | visit | 1265 | 0.03169 |
| 9 | restaurant | 3177 | 0.04028 | 34 | beef | 1233 | 0.04467 |
| 10 | menu | 2994 | 0.04267 | 35 | Korean beef | 1226 | 0.05640 |
| 11 | after a long interval | 2856 | 0.04271 | 36 | husband | 1154 | 0.03834 |
| 12 | Pusan | 2490 | 0.05282 | 37 | business | 1129 | 0.04545 |
| 13 | meat | 2299 | 0.04113 | 38 | discount | 1114 | 0.05478 |
| 14 | lunch | 2107 | 0.04031 | 39 | industry | 1106 | 0.06390 |
| 15 | children | 2096 | 0.03843 | 40 | government | 1020 | 0.05345 |
| 16 | barbecued ribs | 2061 | 0.04983 | 41 | delicious | 1007 | 0.03579 |
| 17 | foundation | 1990 | 0.04396 | 42 | support | 985 | 0.04867 |
| 18 | food | 1929 | 0.03997 | 43 | Jongro | 978 | 0.12561 |
| 19 | time | 1839 | 0.03623 | 44 | Ulsan | 965 | 0.06643 |
| 20 | get-together | 1780 | 0.03715 | 45 | mood | 957 | 0.03580 |
| 21 | people | 1775 | 0.03819 | 46 | birthday | 955 | 0.04450 |
| 22 | meal | 1732 | 0.03563 | 47 | diet | 947 | 0.05561 |
| 23 | BBQ restaurant | 1697 | 0.04072 | 48 | neighborhood | 943 | 0.03262 |
| 24 | home meal | 1638 | 0.04191 | 49 | ingredient | 937 | 0.05085 |
| 25 | delivery | 1560 | 0.04345 | 50 | foodservice industry | 932 | 0.04521 |
| Word | Degree Centrality | Betweenness Centrality | Closeness Centrality | Page Rank | Group | Categorize |
|---|---|---|---|---|---|---|
| delicious | 70 | 322.294229 | 0.004808 | 1.577226 | 1 | Sentimental |
| recommend | 70 | 322.294229 | 0.004808 | 1.577226 | 1 | Sentimental |
| nice | 69 | 311.684104 | 0.004762 | 1.556164 | 1 | Sentimental |
| worry | 68 | 299.836921 | 0.004717 | 1.534461 | 1 | Sentimental |
| mood | 68 | 298.947117 | 0.004717 | 1.534301 | 1 | Sentimental |
| famous | 67 | 287.777914 | 0.004673 | 1.512909 | 1 | Sentimental |
| feeling | 67 | 287.514979 | 0.004673 | 1.512666 | 1 | Sentimental |
| love | 66 | 276.160605 | 0.00463 | 1.491242 | 1 | Sentimental |
| happy | 64 | 258.469303 | 0.004545 | 1.449704 | 1 | Sentimental |
| enjoy | 61 | 237.359899 | 0.004425 | 1.390506 | 1 | Sentimental |
| satisfaction | 61 | 233.549063 | 0.004425 | 1.388615 | 1 | Sentimental |
| burden | 59 | 215.047136 | 0.004348 | 1.346004 | 1 | Sentimental |
| cost- effectiveness | 59 | 212.152358 | 0.004348 | 1.344833 | 1 | Sentimental |
| special | 57 | 209.369735 | 0.004274 | 1.309802 | 1 | Sentimental |
| variety | 56 | 193.102542 | 0.004237 | 1.284526 | 1 | Sentimental |
| side-dish | 51 | 184.269454 | 0.004065 | 1.191853 | 1 | Food |
| specialty store | 51 | 178.795206 | 0.004065 | 1.188236 | 1 | Food |
| success | 54 | 174.592019 | 0.004167 | 1.241266 | 1 | Sentimental |
| high-grade | 51 | 159.37688 | 0.004065 | 1.183023 | 1 | Sentimental |
| pork cutlet | 50 | 147.473698 | 0.004032 | 1.155163 | 1 | Food |
| coffee | 47 | 138.989366 | 0.003937 | 1.099501 | 1 | Food |
| pork | 45 | 124.424039 | 0.003876 | 1.057743 | 1 | Food |
| appreciation | 45 | 119.79205 | 0.003876 | 1.058784 | 1 | Sentimental |
| big win | 45 | 116.48295 | 0.003876 | 1.057254 | 1 | Sentimental |
| Korean cuisine | 43 | 107.56309 | 0.003817 | 1.013455 | 1 | Food |
| steak | 45 | 107.00543 | 0.003876 | 1.047406 | 1 | Food |
| pork back-bone stew | 39 | 106.163375 | 0.003704 | 0.944944 | 1 | Food |
| home-cooked meal restaurant | 42 | 104.875629 | 0.003788 | 0.994696 | 1 | Food |
| Chinese restaurant | 42 | 97.191562 | 0.003788 | 0.98965 | 1 | Food |
| franchise | 37 | 89.082361 | 0.00365 | 0.899498 | 1 | Food |
| famous restaurant | 70 | 453.728098 | 0.004808 | 1.622257 | 2 | Food |
| rice | 67 | 391.863766 | 0.004673 | 1.549125 | 2 | Food |
| meat | 67 | 363.09434 | 0.004673 | 1.537617 | 2 | Food |
| BBQ restaurant | 64 | 354.105045 | 0.004545 | 1.484834 | 2 | Food |
| meal | 66 | 340.119854 | 0.00463 | 1.511436 | 2 | Food |
| barbecued ribs | 64 | 301.245644 | 0.004545 | 1.462569 | 2 | Food |
| cuisine | 60 | 268.723507 | 0.004386 | 1.382303 | 2 | Food |
| home meal | 59 | 250.955652 | 0.004348 | 1.35819 | 2 | Food |
| beef | 59 | 250.38176 | 0.004348 | 1.357289 | 2 | Food |
| shabu-shabu | 55 | 215.167636 | 0.004202 | 1.273755 | 2 | Food |
| health | 57 | 197.198505 | 0.004274 | 1.303429 | 2 | Sentimental |
| buffet | 54 | 195.108557 | 0.004167 | 1.24745 | 2 | Food |
| Korean beef | 51 | 183.897275 | 0.004065 | 1.191413 | 2 | Food |
| very recommendable | 54 | 177.229625 | 0.004167 | 1.24283 | 2 | Sentimental |
| restaurant | 52 | 171.959886 | 0.004098 | 1.201941 | 2 | Food |
| celebrate | 51 | 158.560252 | 0.004065 | 1.182022 | 2 | Sentimental |
| expectation | 48 | 144.735317 | 0.003968 | 1.123962 | 2 | Sentimental |
| pizza | 48 | 132.592664 | 0.003968 | 1.113391 | 2 | Food |
| Bulgogi | 45 | 123.041638 | 0.003876 | 1.057008 | 2 | Food |
| Korean table d’hote | 45 | 117.786204 | 0.003876 | 1.053752 | 2 | Food |
| duck | 43 | 115.664111 | 0.003817 | 1.019094 | 2 | Food |
| excuse | 44 | 114.850094 | 0.003846 | 1.038363 | 2 | Sentimental |
| composure | 41 | 98.315522 | 0.003759 | 0.976806 | 2 | Sentimental |
| expensive | 41 | 98.290686 | 0.003759 | 0.976734 | 2 | Sentimental |
| celebration | 41 | 96.451363 | 0.003759 | 0.975602 | 2 | Sentimental |
| enjoy | 41 | 96.393733 | 0.003759 | 0.975888 | 2 | Sentimental |
| Kimchi | 40 | 92.126833 | 0.003731 | 0.952724 | 2 | Food |
| hardship | 40 | 91.449893 | 0.003731 | 0.955335 | 2 | Sentimental |
| unlimited serving | 40 | 82.310442 | 0.003731 | 0.946301 | 2 | Food |
| memory | 37 | 76.409433 | 0.00365 | 0.893819 | 2 | Sentimental |
| easily | 66 | 283.975878 | 0.00463 | 1.494265 | 3 | Sentimental |
| popularity | 58 | 215.191137 | 0.00431 | 1.329886 | 3 | Sentimental |
| pork belly | 54 | 207.084581 | 0.004167 | 1.252918 | 3 | Food |
| tired | 55 | 182.286979 | 0.004202 | 1.262206 | 3 | Sentimental |
| troublesome | 53 | 161.501796 | 0.004132 | 1.217797 | 3 | Sentimental |
| BBQ | 51 | 153.432128 | 0.004065 | 1.175257 | 3 | Food |
| pasta | 44 | 114.069034 | 0.003846 | 1.034075 | 3 | Food |
| fried-chicken | 43 | 108.751885 | 0.003817 | 1.014057 | 3 | Food |
| tripe | 38 | 80.656331 | 0.003676 | 0.911228 | 3 | Food |
| tonic | 37 | 77.570752 | 0.00365 | 0.891711 | 3 | Food |
| sweet taste | 34 | 69.004339 | 0.003571 | 0.837939 | 3 | Sentimental |
| stress | 28 | 43.469819 | 0.003425 | 0.712831 | 3 | Sentimental |
| octopus | 24 | 28.7657 | 0.003333 | 0.627516 | 3 | Food |
| cafe | 59 | 284.026186 | 0.004348 | 1.373213 | 4 | Food |
| tasty | 63 | 250.735072 | 0.004505 | 1.429842 | 4 | Sentimental |
| kind | 52 | 165.324757 | 0.004098 | 1.203034 | 4 | Sentimental |
| concern | 50 | 152.409821 | 0.004032 | 1.162438 | 4 | Sentimental |
| cold noodles | 34 | 95.005162 | 0.003571 | 0.854982 | 4 | Food |
| lifetime | 33 | 66.153523 | 0.003546 | 0.818428 | 4 | Sentimental |
| charm | 34 | 64.719298 | 0.003571 | 0.834013 | 4 | Sentimental |
| pigs’ feet | 33 | 60.387609 | 0.003546 | 0.810589 | 4 | Food |
| charcoal fire | 32 | 54.701426 | 0.003521 | 0.788868 | 4 | Food |
| grilled | 31 | 50.421126 | 0.003497 | 0.768134 | 4 | Food |
| fortunate | 24 | 31.97706 | 0.003333 | 0.633348 | 4 | Sentimental |
| miss | 15 | 11.454291 | 0.003145 | 0.451106 | 4 | Sentimental |
| trust | 6 | 1.4844 | 0.002976 | 0.270825 | 4 | Sentimental |
| Word | Degree Centrality | Betweenness Centrality | Closeness Centrality | Page Rank | Group | Categorize |
|---|---|---|---|---|---|---|
| enjoy | 68 | 440.899372 | 0.004717 | 1.559007 | 1 | Sentimental |
| recommend | 69 | 408.194809 | 0.004762 | 1.55905 | 1 | Sentimental |
| new | 52 | 340.918363 | 0.004098 | 1.277353 | 1 | Sentimental |
| mood | 67 | 275.721365 | 0.004673 | 1.476108 | 1 | Sentimental |
| satisfaction | 66 | 262.917894 | 0.00463 | 1.454095 | 1 | Sentimental |
| delicious | 65 | 258.643622 | 0.004587 | 1.436707 | 1 | Sentimental |
| cost-effectiveness | 61 | 231.132277 | 0.004425 | 1.358892 | 1 | Sentimental |
| love | 62 | 224.527813 | 0.004464 | 1.371853 | 1 | Sentimental |
| tired | 62 | 222.432191 | 0.004464 | 1.371116 | 1 | Sentimental |
| variety | 61 | 221.630996 | 0.004425 | 1.354707 | 1 | Sentimental |
| tasty | 61 | 215.560356 | 0.004425 | 1.350838 | 1 | Sentimental |
| health | 60 | 214.609013 | 0.004386 | 1.33497 | 1 | Sentimental |
| merry | 61 | 210.170468 | 0.004425 | 1.348807 | 1 | Sentimental |
| happy | 58 | 192.750317 | 0.00431 | 1.291029 | 1 | Sentimental |
| Sashimi | 53 | 188.306519 | 0.004132 | 1.204808 | 1 | Food |
| popularity | 47 | 186.102392 | 0.003937 | 1.108562 | 1 | Sentimental |
| specialty store | 53 | 173.51095 | 0.004132 | 1.197633 | 1 | Food |
| burden | 55 | 167.541026 | 0.004202 | 1.228985 | 1 | Sentimental |
| pizza | 52 | 165.629174 | 0.004098 | 1.177149 | 1 | Food |
| fried-chicken | 47 | 147.380719 | 0.003937 | 1.085467 | 1 | Food |
| home-cooked meal restaurant | 50 | 137.5473 | 0.004032 | 1.129937 | 1 | Food |
| high-grade | 50 | 135.741742 | 0.004032 | 1.129093 | 1 | Sentimental |
| very recommendable | 49 | 135.209445 | 0.004 | 1.11295 | 1 | Sentimental |
| kind | 49 | 134.760867 | 0.004 | 1.112486 | 1 | Sentimental |
| salad | 48 | 132.020688 | 0.003968 | 1.093723 | 1 | Food |
| duck | 47 | 129.868121 | 0.003937 | 1.075394 | 1 | Food |
| franchise | 44 | 126.092065 | 0.003846 | 1.024459 | 1 | Food |
| BBQ | 47 | 117.818291 | 0.003937 | 1.06877 | 1 | Food |
| unlimited serving | 45 | 112.340337 | 0.003876 | 1.032249 | 1 | Food |
| pork | 45 | 107.835939 | 0.003876 | 1.028672 | 1 | Food |
| meal | 70 | 348.439369 | 0.004808 | 1.552481 | 2 | Food |
| famous restaurant | 70 | 348.439369 | 0.004808 | 1.552481 | 2 | Food |
| home meal | 68 | 315.729419 | 0.004717 | 1.507602 | 2 | Food |
| meat | 66 | 273.996738 | 0.00463 | 1.458074 | 2 | Food |
| cuisine | 64 | 268.244295 | 0.004545 | 1.422209 | 2 | Food |
| barbecued ribs | 65 | 255.493466 | 0.004587 | 1.433877 | 2 | Food |
| rice | 63 | 254.980259 | 0.004505 | 1.40065 | 2 | Food |
| cafe | 62 | 250.541379 | 0.004464 | 1.382279 | 2 | Food |
| BBQ restaurant | 62 | 244.225864 | 0.004464 | 1.378948 | 2 | Food |
| beef | 62 | 243.881168 | 0.004464 | 1.379042 | 2 | Food |
| coffee | 57 | 210.86832 | 0.004274 | 1.282546 | 2 | Food |
| worry | 57 | 190.436448 | 0.004274 | 1.273748 | 2 | Sentimental |
| pasta | 55 | 174.499946 | 0.004202 | 1.231711 | 2 | Food |
| Sushi | 55 | 172.395991 | 0.004202 | 1.23078 | 2 | Food |
| pork belly | 56 | 172.202498 | 0.004237 | 1.247301 | 2 | Food |
| shabu-shabu | 53 | 169.109242 | 0.004132 | 1.196152 | 2 | Food |
| celebrate | 53 | 164.794163 | 0.004132 | 1.194158 | 2 | Sentimental |
| success | 54 | 163.97476 | 0.004167 | 1.210411 | 2 | Sentimental |
| restaurant | 52 | 158.886622 | 0.004098 | 1.173677 | 2 | Food |
| side-dish | 52 | 153.366772 | 0.004098 | 1.171326 | 2 | Food |
| buffet | 50 | 149.883366 | 0.004032 | 1.136371 | 2 | Food |
| special | 52 | 149.003294 | 0.004098 | 1.169634 | 2 | Sentimental |
| caution | 51 | 142.850348 | 0.004065 | 1.150003 | 2 | Sentimental |
| spicy stir-fried chicken | 47 | 133.344585 | 0.003937 | 1.078022 | 2 | Food |
| difficult | 50 | 124.635092 | 0.004032 | 1.122582 | 2 | Sentimental |
| delivery food | 45 | 116.485076 | 0.003876 | 1.034367 | 2 | Food |
| troublesome | 44 | 95.330837 | 0.003846 | 1.005397 | 2 | Sentimental |
| scary | 42 | 90.405209 | 0.003788 | 0.969127 | 2 | Sentimental |
| appreciation | 40 | 86.897962 | 0.003731 | 0.933243 | 2 | Sentimental |
| Outback steak house | 39 | 86.864768 | 0.003704 | 0.916839 | 2 | Food |
| nice | 66 | 267.084691 | 0.00463 | 1.456131 | 3 | Sentimental |
| concern | 63 | 237.829579 | 0.004505 | 1.393748 | 3 | Sentimental |
| famous | 61 | 216.099775 | 0.004425 | 1.351752 | 3 | Sentimental |
| pork cutlet | 56 | 197.967183 | 0.004237 | 1.259735 | 3 | Food |
| feeling | 59 | 192.541133 | 0.004348 | 1.307373 | 3 | Sentimental |
| Korean beef | 54 | 175.408641 | 0.004167 | 1.215263 | 3 | Food |
| steak | 52 | 146.183606 | 0.004098 | 1.167631 | 3 | Food |
| Korean table d’hote | 50 | 131.808401 | 0.004032 | 1.126672 | 3 | Food |
| box lunch | 45 | 115.83974 | 0.003876 | 1.034597 | 3 | Food |
| busy | 46 | 107.317171 | 0.003906 | 1.045794 | 3 | Sentimental |
| the past | 43 | 93.08553 | 0.003817 | 0.987292 | 3 | Sentimental |
| chopped noodle | 41 | 87.202013 | 0.003759 | 0.950296 | 3 | Food |
| premium | 39 | 83.241308 | 0.003704 | 0.914457 | 3 | Sentimental |
| Chinese-style noodles | 40 | 82.100424 | 0.003731 | 0.929421 | 3 | Food |
| frankness | 39 | 81.397102 | 0.003704 | 0.91291 | 3 | Sentimental |
| cheese | 36 | 68.767121 | 0.003623 | 0.853211 | 3 | Food |
| sincerity | 35 | 61.67607 | 0.003597 | 0.832038 | 3 | Sentimental |
| healing | 27 | 34.288564 | 0.003401 | 0.673715 | 3 | Sentimental |
| Shabu-shabu buffet | 21 | 21.667991 | 0.003268 | 0.559834 | 3 | Food |
| stress | 22 | 20.71771 | 0.003289 | 0.574884 | 3 | Sentimental |
| thistle | 18 | 12.553157 | 0.003205 | 0.496886 | 3 | Food |
| Word | Degree Centrality | Betweenness Centrality | Closeness Centrality | Page Rank | Group | Categorize |
|---|---|---|---|---|---|---|
| reservation | 64 | 797.470922 | 0.004545 | 2.17584 | 1 | Demand |
| famous restaurant | 66 | 785.902987 | 0.00463 | 2.210304 | 1 | Food |
| meal | 61 | 632.06387 | 0.004425 | 2.038584 | 1 | Food |
| cafe | 55 | 528.291905 | 0.004202 | 1.858234 | 1 | Food |
| rice | 54 | 489.566346 | 0.004167 | 1.818386 | 1 | Food |
| franchise | 50 | 484.077206 | 0.004032 | 1.742427 | 1 | Food |
| meat | 54 | 461.573986 | 0.004167 | 1.805738 | 1 | Food |
| restaurant | 50 | 455.714825 | 0.004032 | 1.709666 | 1 | Food |
| need | 50 | 398.908795 | 0.004032 | 1.685233 | 1 | Demand |
| barbecued ribs | 49 | 367.200539 | 0.004 | 1.645367 | 1 | Food |
| Korean cuisine | 45 | 330.189035 | 0.003876 | 1.538223 | 1 | Food |
| information | 45 | 303.760925 | 0.003876 | 1.52143 | 1 | Demand |
| plan | 41 | 257.665268 | 0.003759 | 1.402606 | 1 | Demand |
| Sushi | 37 | 243.515131 | 0.00365 | 1.299266 | 1 | Food |
| pork | 40 | 242.208857 | 0.003731 | 1.370158 | 1 | Food |
| buffet | 38 | 198.672189 | 0.003676 | 1.295512 | 1 | Food |
| specialty store | 35 | 173.703943 | 0.003597 | 1.20724 | 1 | Food |
| business | 36 | 173.470822 | 0.003623 | 1.229887 | 1 | Demand |
| facilities | 31 | 172.946922 | 0.003497 | 1.116657 | 1 | Demand |
| 1 person | 33 | 163.407887 | 0.003546 | 1.150719 | 1 | Demand |
| pork cutlet | 29 | 137.095746 | 0.003448 | 1.036453 | 1 | Food |
| company | 31 | 129.651836 | 0.003497 | 1.080755 | 1 | Demand |
| dining voucher | 28 | 126.105361 | 0.003425 | 1.006501 | 1 | Demand |
| education | 29 | 108.270836 | 0.003448 | 1.016802 | 1 | Demand |
| help | 28 | 107.423992 | 0.003425 | 0.99164 | 1 | Demand |
| Japanese food | 25 | 101.359003 | 0.003356 | 0.918269 | 1 | Food |
| talk | 25 | 95.216971 | 0.003356 | 0.912971 | 1 | Demand |
| develop | 22 | 84.653806 | 0.003289 | 0.828394 | 1 | Demand |
| steamed pork | 23 | 84.09314 | 0.003311 | 0.857146 | 1 | Food |
| economic | 26 | 80.825921 | 0.003378 | 0.921261 | 1 | Demand |
| order | 65 | 755.090093 | 0.004587 | 2.185213 | 2 | Demand |
| coffee | 54 | 510.186796 | 0.004167 | 1.829752 | 2 | Food |
| solution | 54 | 479.523213 | 0.004167 | 1.819816 | 2 | Demand |
| take-out | 53 | 460.135528 | 0.004132 | 1.788445 | 2 | Demand |
| Delivery | 51 | 443.284429 | 0.004065 | 1.728307 | 2 | Demand |
| cuisine | 51 | 435.727635 | 0.004065 | 1.72589 | 2 | Food |
| food show | 50 | 418.449551 | 0.004032 | 1.69896 | 2 | Demand |
| fried-chicken | 44 | 330.586755 | 0.003846 | 1.505421 | 2 | Food |
| home meal | 43 | 279.618268 | 0.003817 | 1.4619 | 2 | Food |
| pizza | 40 | 237.250726 | 0.003731 | 1.367106 | 2 | Food |
| delivery food | 35 | 200.993955 | 0.003597 | 1.231174 | 2 | Food |
| expenses of dining-out | 34 | 198.587997 | 0.003571 | 1.199892 | 2 | Demand |
| foundation | 36 | 198.414759 | 0.003623 | 1.244003 | 2 | Demand |
| side-dish | 36 | 189.832788 | 0.003623 | 1.243523 | 2 | Food |
| effort | 32 | 153.213665 | 0.003521 | 1.123898 | 2 | Demand |
| price | 31 | 149.938024 | 0.003497 | 1.098571 | 2 | Demand |
| administration | 30 | 147.066656 | 0.003472 | 1.069709 | 2 | Demand |
| pasta | 32 | 139.283028 | 0.003521 | 1.112205 | 2 | Food |
| Kimchi | 31 | 137.737133 | 0.003497 | 1.089665 | 2 | Food |
| discount | 30 | 137.095817 | 0.003472 | 1.064892 | 2 | Demand |
| beef | 32 | 127.219503 | 0.003521 | 1.103435 | 2 | Food |
| shabu-shabu | 29 | 117.158385 | 0.003448 | 1.024257 | 2 | Food |
| industry | 30 | 103.815577 | 0.003472 | 1.037495 | 2 | Demand |
| food expenses | 26 | 100.322078 | 0.003378 | 0.941752 | 2 | Demand |
| steak | 29 | 98.712928 | 0.003448 | 1.009557 | 2 | Food |
| salad | 24 | 84.41505 | 0.003333 | 0.877673 | 2 | Food |
| coupon | 26 | 79.76715 | 0.003378 | 0.920865 | 2 | Demand |
| accident | 23 | 73.564528 | 0.003311 | 0.842634 | 2 | Demand |
| consumption | 23 | 62.055311 | 0.003311 | 0.832573 | 2 | Demand |
| poor | 21 | 58.966211 | 0.003268 | 0.782713 | 2 | Demand |
| cost | 69 | 909.735046 | 0.004762 | 2.322271 | 3 | Demand |
| sale | 50 | 410.123353 | 0.004032 | 1.691861 | 3 | Demand |
| operate | 49 | 368.839937 | 0.004 | 1.645838 | 3 | Demand |
| sell | 37 | 225.504147 | 0.00365 | 1.292445 | 3 | Demand |
| Chinses food | 33 | 191.933074 | 0.003546 | 1.172243 | 3 | Food |
| charge | 37 | 180.051015 | 0.00365 | 1.259376 | 3 | Demand |
| pork belly | 36 | 174.300492 | 0.003623 | 1.230647 | 3 | Food |
| BBQ restaurant | 35 | 162.372335 | 0.003597 | 1.199899 | 3 | Food |
| chance | 33 | 159.888637 | 0.003546 | 1.149984 | 3 | Demand |
| support | 31 | 152.679513 | 0.003497 | 1.101476 | 3 | Demand |
| purchase | 30 | 137.777301 | 0.003472 | 1.06422 | 3 | Demand |
| BBQ | 27 | 93.720121 | 0.003401 | 0.956429 | 3 | Food |
| resident | 23 | 88.402854 | 0.003311 | 0.866486 | 3 | Demand |
| pigs’ feet | 25 | 85.78213 | 0.003356 | 0.904768 | 3 | Food |
| test | 25 | 85.617066 | 0.003356 | 0.903689 | 3 | Demand |
| Korean beef | 25 | 82.215865 | 0.003356 | 0.898171 | 3 | Food |
| consulting | 25 | 81.01189 | 0.003356 | 0.897511 | 3 | Demand |
| Bulgogi | 24 | 72.777947 | 0.003333 | 0.865727 | 3 | Food |
| Sushi restaurant | 23 | 65.296239 | 0.003311 | 0.834241 | 3 | Food |
| cold noodles | 20 | 62.789884 | 0.003247 | 0.758093 | 3 | Food |
| black soybean noodle | 22 | 61.753778 | 0.003289 | 0.806894 | 3 | Food |
| Korean table d’hote | 20 | 49.884784 | 0.003247 | 0.747209 | 3 | Food |
| Growth | 19 | 49.299321 | 0.003226 | 0.72107 | 3 | Demand |
| Chinese-style noodles | 19 | 44.64515 | 0.003226 | 0.715376 | 3 | Food |
| consumer | 18 | 37.982898 | 0.003205 | 0.683535 | 3 | Demand |
| soup | 17 | 35.649719 | 0.003185 | 0.65714 | 3 | Food |
| pork back-bone stew | 16 | 32.083259 | 0.003165 | 0.626322 | 3 | Food |
| grilled | 16 | 30.176911 | 0.003165 | 0.624164 | 3 | Food |
| Outback steak house | 16 | 29.323732 | 0.003165 | 0.624976 | 3 | Food |
| Shabu | 12 | 25.322948 | 0.003086 | 0.520164 | 3 | Food |
| Word | Degree Centrality | Betweenness Centrality | Closeness Centrality | Page Rank | Group | Categorize |
|---|---|---|---|---|---|---|
| price | 65 | 753.577869 | 0.004587 | 2.156064 | 1 | Demand |
| delivery | 66 | 743.580499 | 0.00463 | 2.175311 | 1 | Demand |
| order | 64 | 713.973257 | 0.004545 | 2.110157 | 1 | Demand |
| take-out | 63 | 610.409801 | 0.004505 | 2.055841 | 1 | Demand |
| reservation | 58 | 513.525267 | 0.00431 | 1.904466 | 1 | Demand |
| solution | 58 | 511.006219 | 0.00431 | 1.898237 | 1 | Demand |
| need | 56 | 472.396154 | 0.004237 | 1.838031 | 1 | Demand |
| operate | 53 | 430.713433 | 0.004132 | 1.745185 | 1 | Demand |
| sale | 50 | 392.584543 | 0.004032 | 1.664849 | 1 | Demand |
| information | 49 | 317.853367 | 0.004 | 1.599476 | 1 | Demand |
| expenses of dining-out | 43 | 236.584794 | 0.003817 | 1.417147 | 1 | Demand |
| BBQ restaurant | 42 | 216.878305 | 0.003788 | 1.38134 | 1 | Food |
| Korean beef | 40 | 210.940305 | 0.003731 | 1.328835 | 1 | Food |
| purchase | 38 | 204.997075 | 0.003676 | 1.279821 | 1 | Demand |
| buffet | 35 | 173.381866 | 0.003597 | 1.189104 | 1 | Food |
| pork belly | 36 | 158.019368 | 0.003623 | 1.203344 | 1 | Food |
| steak | 36 | 157.888266 | 0.003623 | 1.202163 | 1 | Food |
| food show | 36 | 151.892945 | 0.003623 | 1.201917 | 1 | Demand |
| safety | 35 | 147.926619 | 0.003597 | 1.173527 | 1 | Demand |
| food expenses | 35 | 147.665422 | 0.003597 | 1.17435 | 1 | Demand |
| distancing | 32 | 147.051057 | 0.003521 | 1.103845 | 1 | Demand |
| plan | 32 | 139.882656 | 0.003521 | 1.102034 | 1 | Demand |
| spread | 31 | 137.001023 | 0.003497 | 1.072903 | 1 | Demand |
| stimulus check | 32 | 128.440692 | 0.003521 | 1.092867 | 1 | Demand |
| pork cutlet | 30 | 117.946322 | 0.003472 | 1.032443 | 1 | Food |
| spicy stir-fried chicken | 29 | 115.941438 | 0.003448 | 1.008674 | 1 | Food |
| beef | 31 | 111.294116 | 0.003497 | 1.051863 | 1 | Food |
| side-dish | 30 | 102.67317 | 0.003472 | 1.01995 | 1 | Food |
| cheese | 28 | 95.439848 | 0.003425 | 0.968055 | 1 | Food |
| revenue | 24 | 91.653767 | 0.003333 | 0.869018 | 1 | Demand |
| famous restaurant | 68 | 836.825037 | 0.004717 | 2.25661 | 2 | Food |
| cafe | 66 | 802.226792 | 0.00463 | 2.204632 | 2 | Food |
| meal | 61 | 625.758876 | 0.004425 | 2.019672 | 2 | Food |
| Sashimi | 57 | 583.940076 | 0.004274 | 1.922639 | 2 | Food |
| franchise | 58 | 539.574148 | 0.00431 | 1.911204 | 2 | Food |
| delivery food | 54 | 532.664604 | 0.004167 | 1.83269 | 2 | Food |
| cuisine | 54 | 438.756065 | 0.004167 | 1.774375 | 2 | Food |
| fried-chicken | 49 | 386.663831 | 0.004 | 1.63942 | 2 | Food |
| home meal | 49 | 364.400855 | 0.004 | 1.625339 | 2 | Food |
| coffee | 50 | 358.617647 | 0.004032 | 1.645642 | 2 | Food |
| discount | 41 | 302.000188 | 0.003759 | 1.385031 | 2 | Demand |
| administration | 37 | 281.176252 | 0.00365 | 1.29098 | 2 | Demand |
| restaurant | 43 | 258.231127 | 0.003817 | 1.429782 | 2 | Food |
| specialty store | 41 | 247.060278 | 0.003759 | 1.379772 | 2 | Food |
| support | 40 | 238.284133 | 0.003731 | 1.349089 | 2 | Demand |
| business | 33 | 208.870111 | 0.003546 | 1.152666 | 2 | Demand |
| Korean cuisine | 36 | 187.477842 | 0.003623 | 1.226806 | 2 | Food |
| foundation | 39 | 181.326074 | 0.003704 | 1.289612 | 2 | Demand |
| box lunch | 36 | 157.110387 | 0.003623 | 1.202653 | 2 | Food |
| company | 34 | 135.898005 | 0.003571 | 1.142304 | 2 | Demand |
| prevention | 27 | 119.277605 | 0.003401 | 0.961696 | 2 | Demand |
| government | 31 | 113.685187 | 0.003497 | 1.053777 | 2 | Demand |
| Chinses food | 28 | 107.884402 | 0.003425 | 0.978714 | 2 | Food |
| rice cake | 27 | 105.380137 | 0.003401 | 0.955441 | 2 | Food |
| industry | 28 | 87.888155 | 0.003425 | 0.961717 | 2 | Demand |
| damage | 27 | 84.295056 | 0.003401 | 0.934965 | 2 | Demand |
| steamed pork | 26 | 81.54425 | 0.003378 | 0.908448 | 2 | Food |
| help | 26 | 74.889147 | 0.003378 | 0.904532 | 2 | Demand |
| recruitment | 16 | 74.269798 | 0.003165 | 0.675009 | 2 | Demand |
| pigs’ feet | 26 | 70.822506 | 0.003378 | 0.899606 | 2 | Food |
| rice | 49 | 320.909707 | 0.004 | 1.599567 | 3 | Food |
| meat | 44 | 259.40111 | 0.003846 | 1.450645 | 3 | Food |
| barbecued ribs | 40 | 231.633728 | 0.003731 | 1.344203 | 3 | Food |
| pizza | 40 | 210.245023 | 0.003731 | 1.330354 | 3 | Food |
| social distance | 40 | 182.211182 | 0.003731 | 1.312169 | 3 | Demand |
| situation | 32 | 154.636898 | 0.003521 | 1.103237 | 3 | Demand |
| effort | 35 | 152.636383 | 0.003597 | 1.175636 | 3 | Demand |
| prohibit | 32 | 117.355774 | 0.003521 | 1.080988 | 3 | Demand |
| salad | 25 | 78.445464 | 0.003356 | 0.882549 | 3 | Food |
| coupon | 25 | 63.403519 | 0.003356 | 0.869361 | 3 | Demand |
| Sushi | 22 | 55.469974 | 0.003289 | 0.788607 | 3 | Food |
| application | 19 | 49.648969 | 0.003226 | 0.71365 | 3 | Demand |
| test | 17 | 25.586032 | 0.003185 | 0.635372 | 3 | Demand |
| 2019 | 2020 | Increase or Decrease | |
|---|---|---|---|
| Positive word | 82.31% | 77.95% | −4.36% |
| Negative word | 17.69% | 20.05% | +4.36% |
| Frequency | Sentiment Intensity (%) | Frequency (%) | |
|---|---|---|---|
| Positive | 36,495 | 82.68 | 82.31 |
| Good feeling | 30,324 | 69.21 | 68.39 |
| Joy | 3949 | 8.74 | 8.91 |
| Interest | 2222 | 4.73 | 5.01 |
| Negative | 7844 | 17.32 | 17.69 |
| Sadness | 2456 | 5.64 | 5.54 |
| Disgust | 3579 | 8.23 | 8.07 |
| Fear | 796 | 1.21 | 1.80 |
| Pain | 265 | 0.65 | 0.60 |
| Anger | 620 | 1.24 | 1.40 |
| Fright | 125 | 0.34 | 0.29 |
| Total | 44,339 | 100.00 | 100.00 |
| Frequency | Sentiment Intensity (%) | Frequency (%) | |
|---|---|---|---|
| Positive | 31,680 | 78.93 | 77.95 |
| Good feeling | 26,547 | 66.86 | 65.32 |
| Joy | 3292 | 7.86 | 8.10 |
| Interest | 1841 | 4.21 | 4.53 |
| Negative | 8962 | 21.07 | 22.05 |
| Sadness | 2629 | 6.53 | 6.47 |
| Disgust | 893 | 1.73 | 2.20 |
| Fear | 3545 | 8.67 | 8.72 |
| Pain | 1367 | 2.98 | 3.36 |
| Anger | 396 | 0.78 | 0.97 |
| Fright | 132 | 0.38 | 0.32 |
| Total | 40,642 | 100.00 | 100.00 |
Publisher’s Note: MDPI stays neutral with regard to jurisdictional claims in published maps and institutional affiliations. |
© 2021 by the authors. Licensee MDPI, Basel, Switzerland. This article is an open access article distributed under the terms and conditions of the Creative Commons Attribution (CC BY) license (https://creativecommons.org/licenses/by/4.0/).
Share and Cite
Jung, H.-S.; Yoon, H.-H.; Song, M.-K. A Study on Dining-Out Trends Using Big Data: Focusing on Changes since COVID-19. Sustainability 2021, 13, 11480. https://doi.org/10.3390/su132011480
Jung H-S, Yoon H-H, Song M-K. A Study on Dining-Out Trends Using Big Data: Focusing on Changes since COVID-19. Sustainability. 2021; 13(20):11480. https://doi.org/10.3390/su132011480
Chicago/Turabian StyleJung, Hyo-Sun, Hye-Hyun Yoon, and Min-Kyung Song. 2021. "A Study on Dining-Out Trends Using Big Data: Focusing on Changes since COVID-19" Sustainability 13, no. 20: 11480. https://doi.org/10.3390/su132011480
APA StyleJung, H.-S., Yoon, H.-H., & Song, M.-K. (2021). A Study on Dining-Out Trends Using Big Data: Focusing on Changes since COVID-19. Sustainability, 13(20), 11480. https://doi.org/10.3390/su132011480