
Energy and Economic Sustainability of a Trigeneration Solar System Using Radiative Cooling in Mediterranean Climate


Abstract
:1. Introduction
2. Materials and Methods
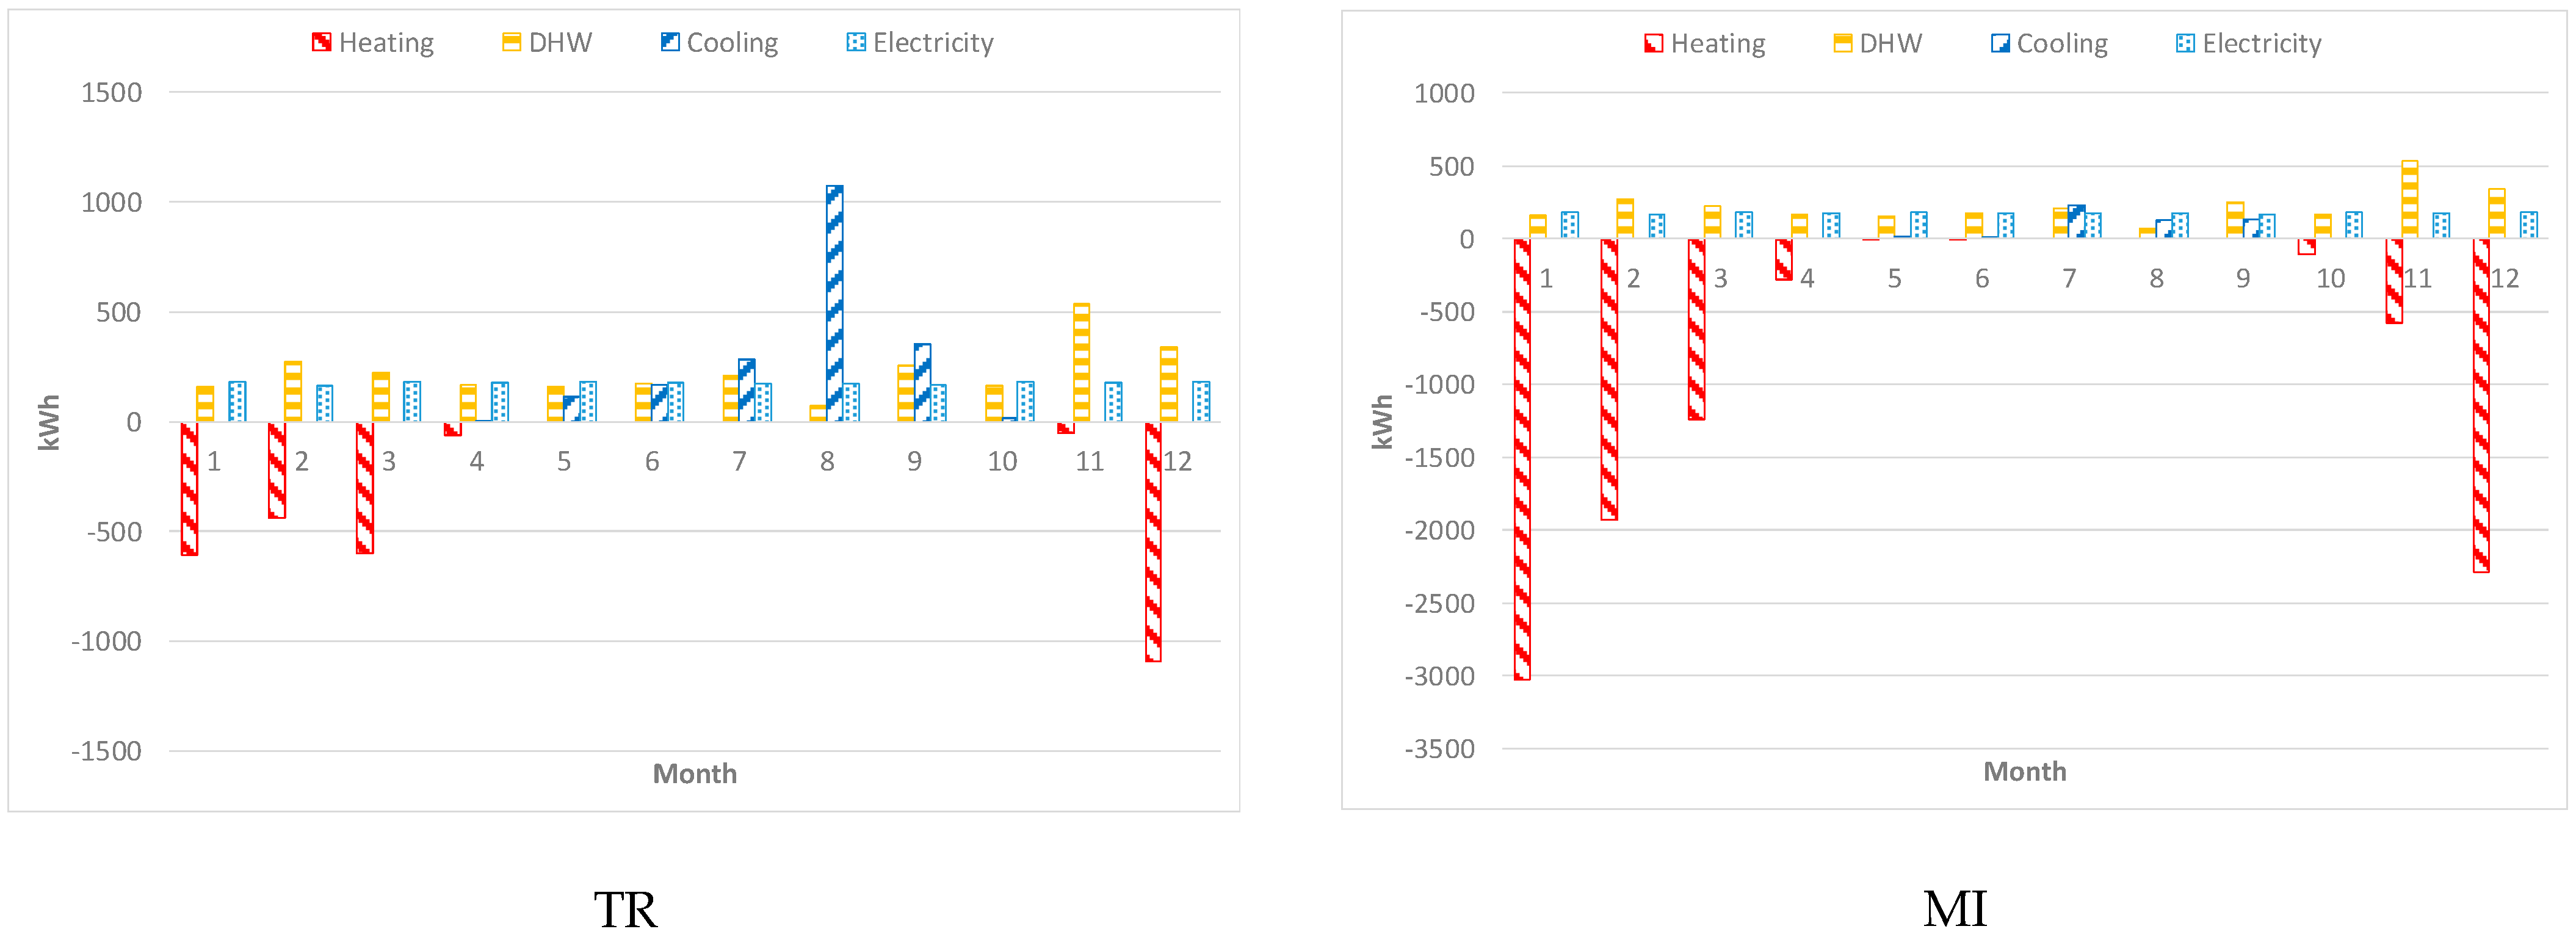
2.1. Energy Needs of the Building
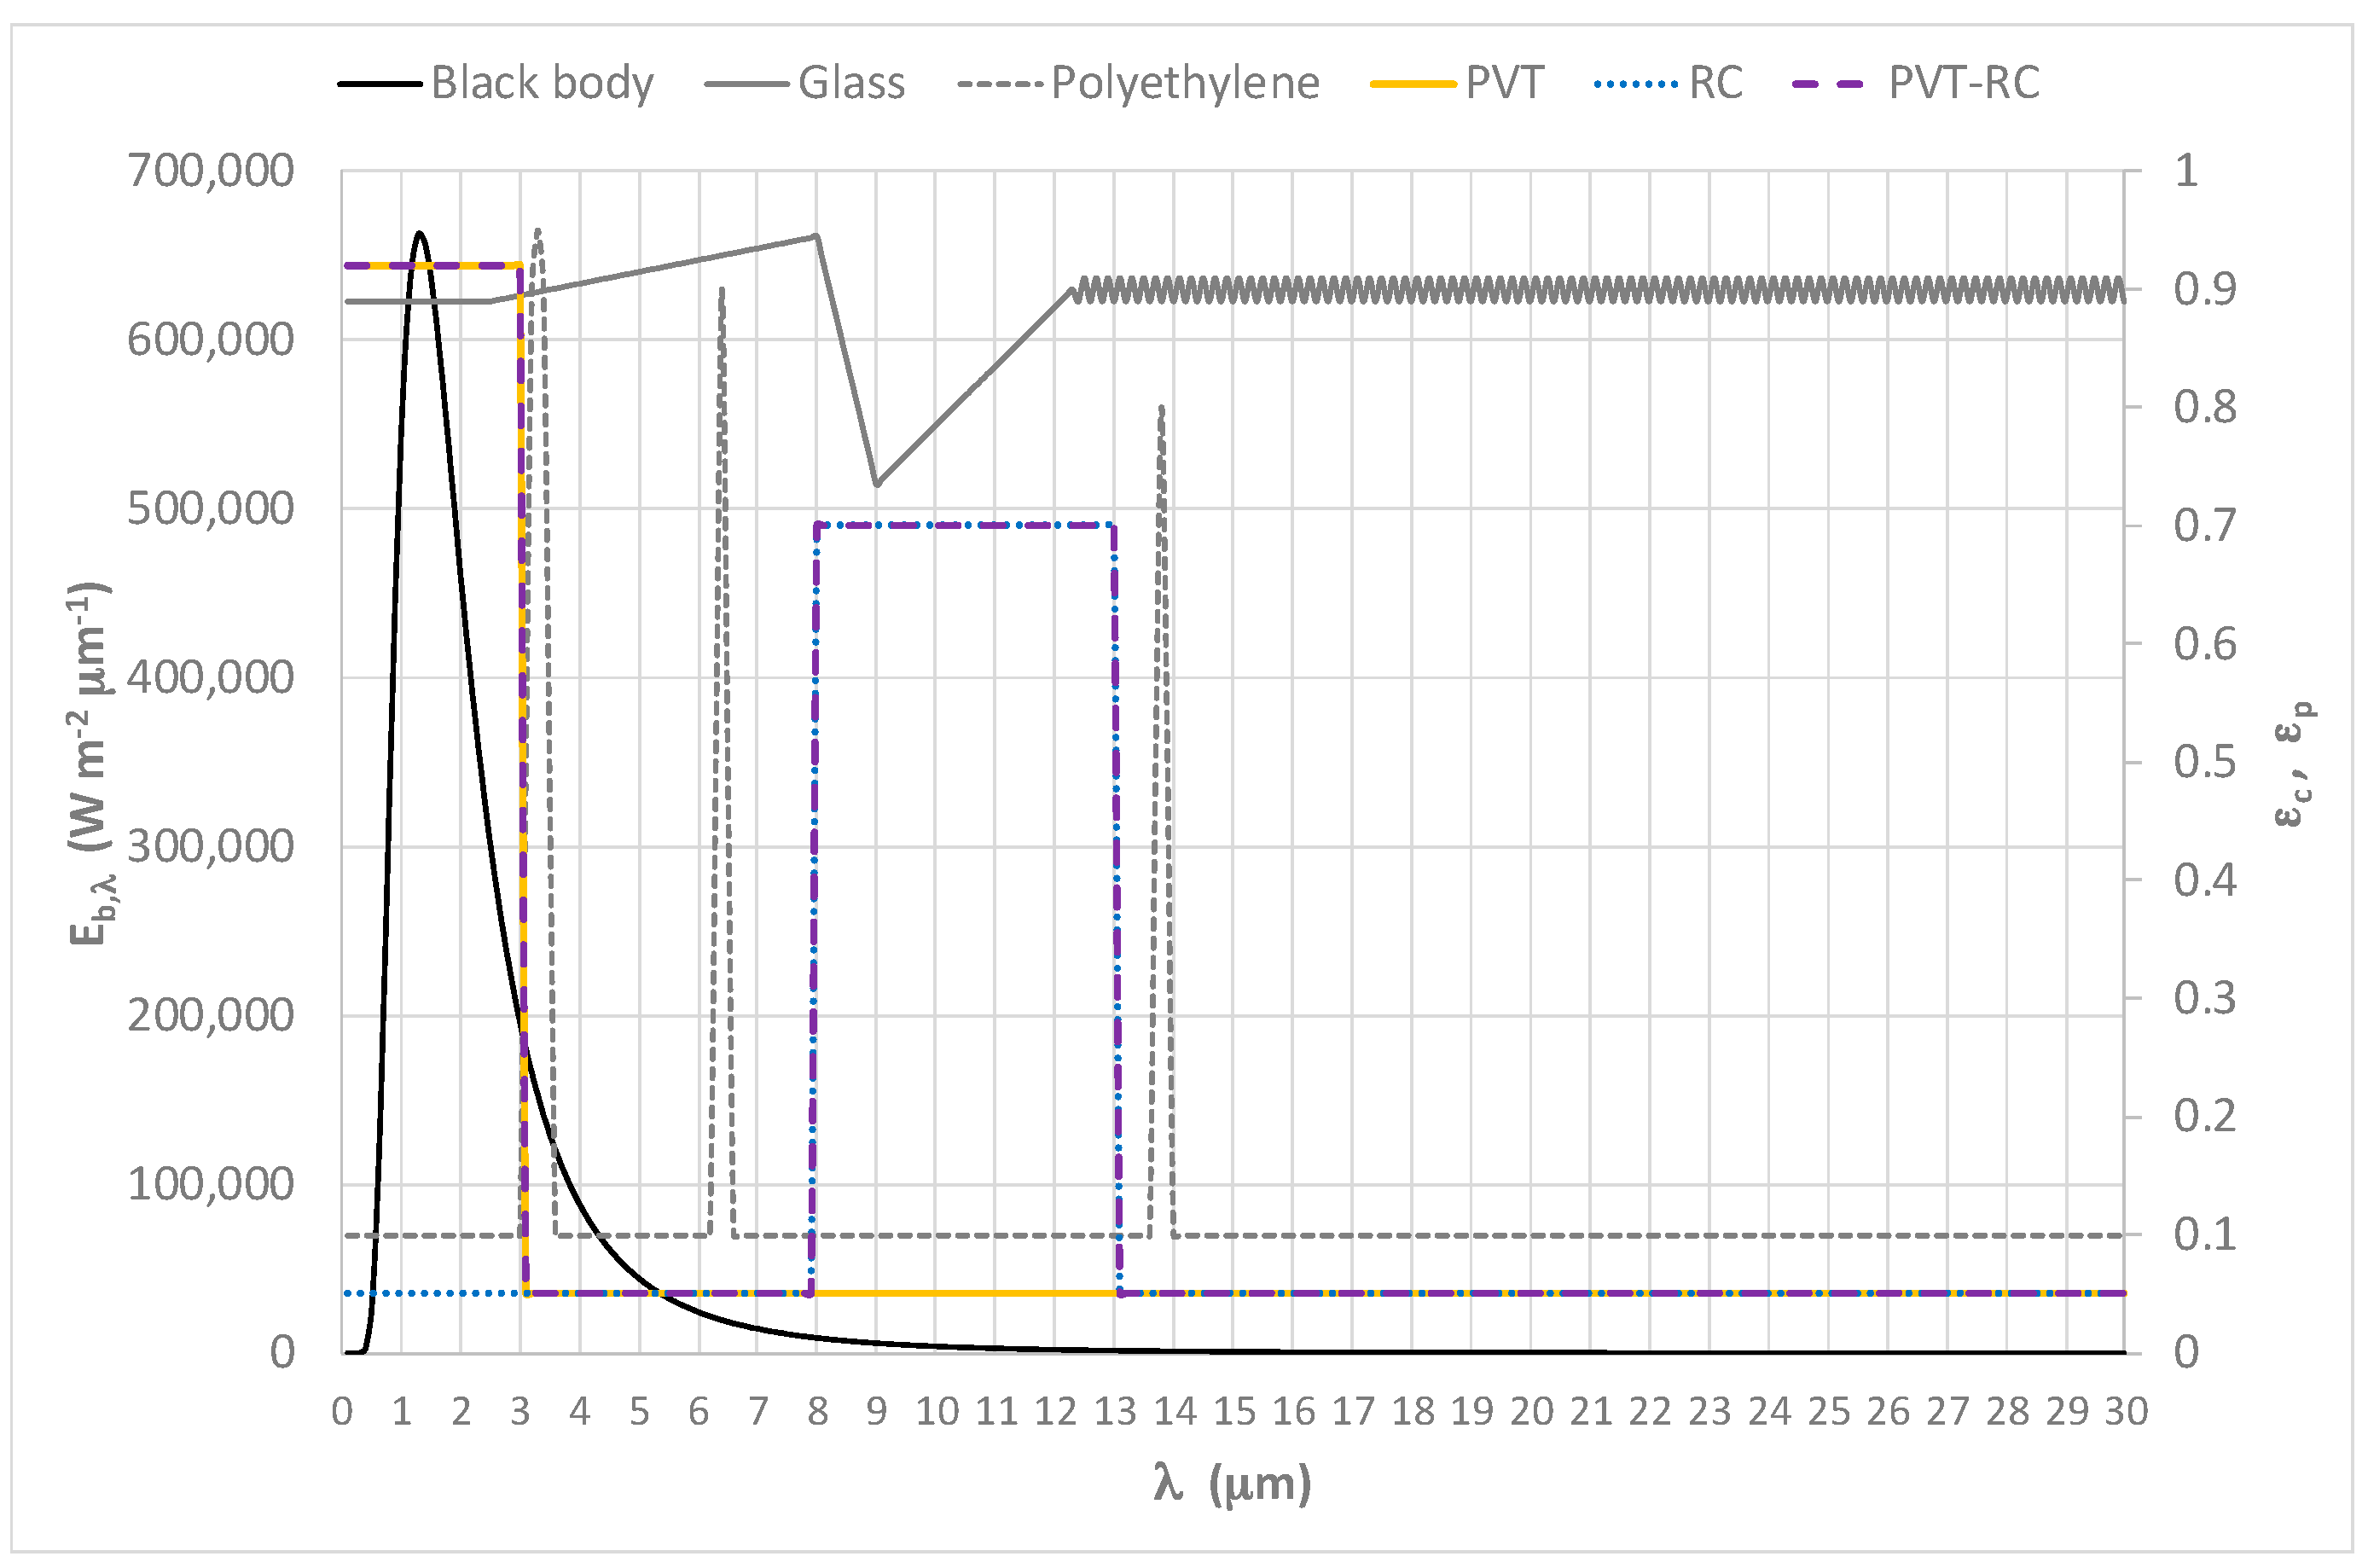
2.2. Spectral Characteristics of The Collectors
- a spectrally selective PVT–RC surface with an average absorptivity of 0.92 in the SH band, i.e., nearly the same as that of the real SH surface;
- an average emissivity of 0.70 in the RC band, i.e., nearly the same as that of the real RC surface, and an average absorptivity (emissivity) of 0.05 in other bands, i.e. nearly the same as that of the real SH surface.
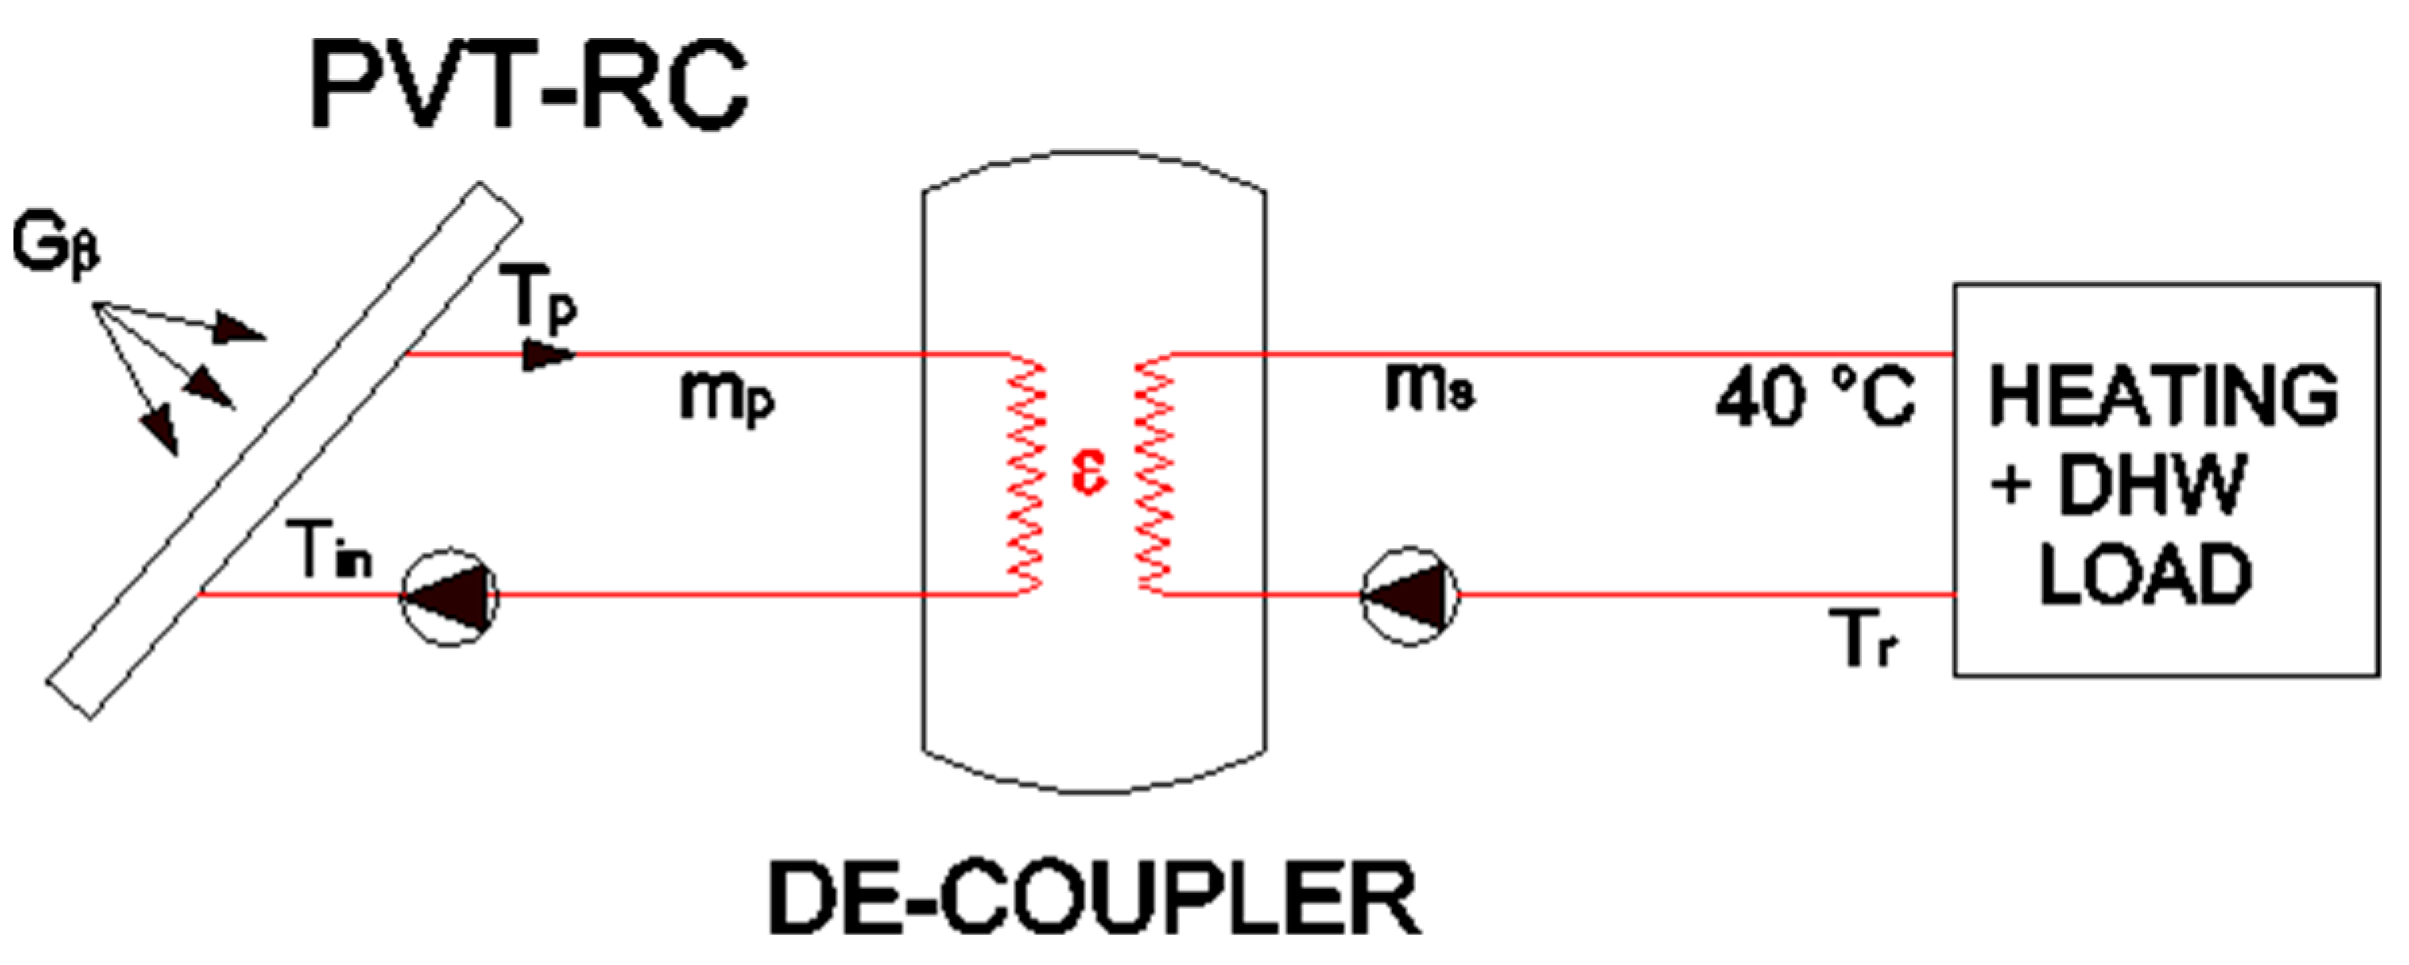
2.3. The Trigeneration Solar System
2.4. Hypotheses of The Analyses
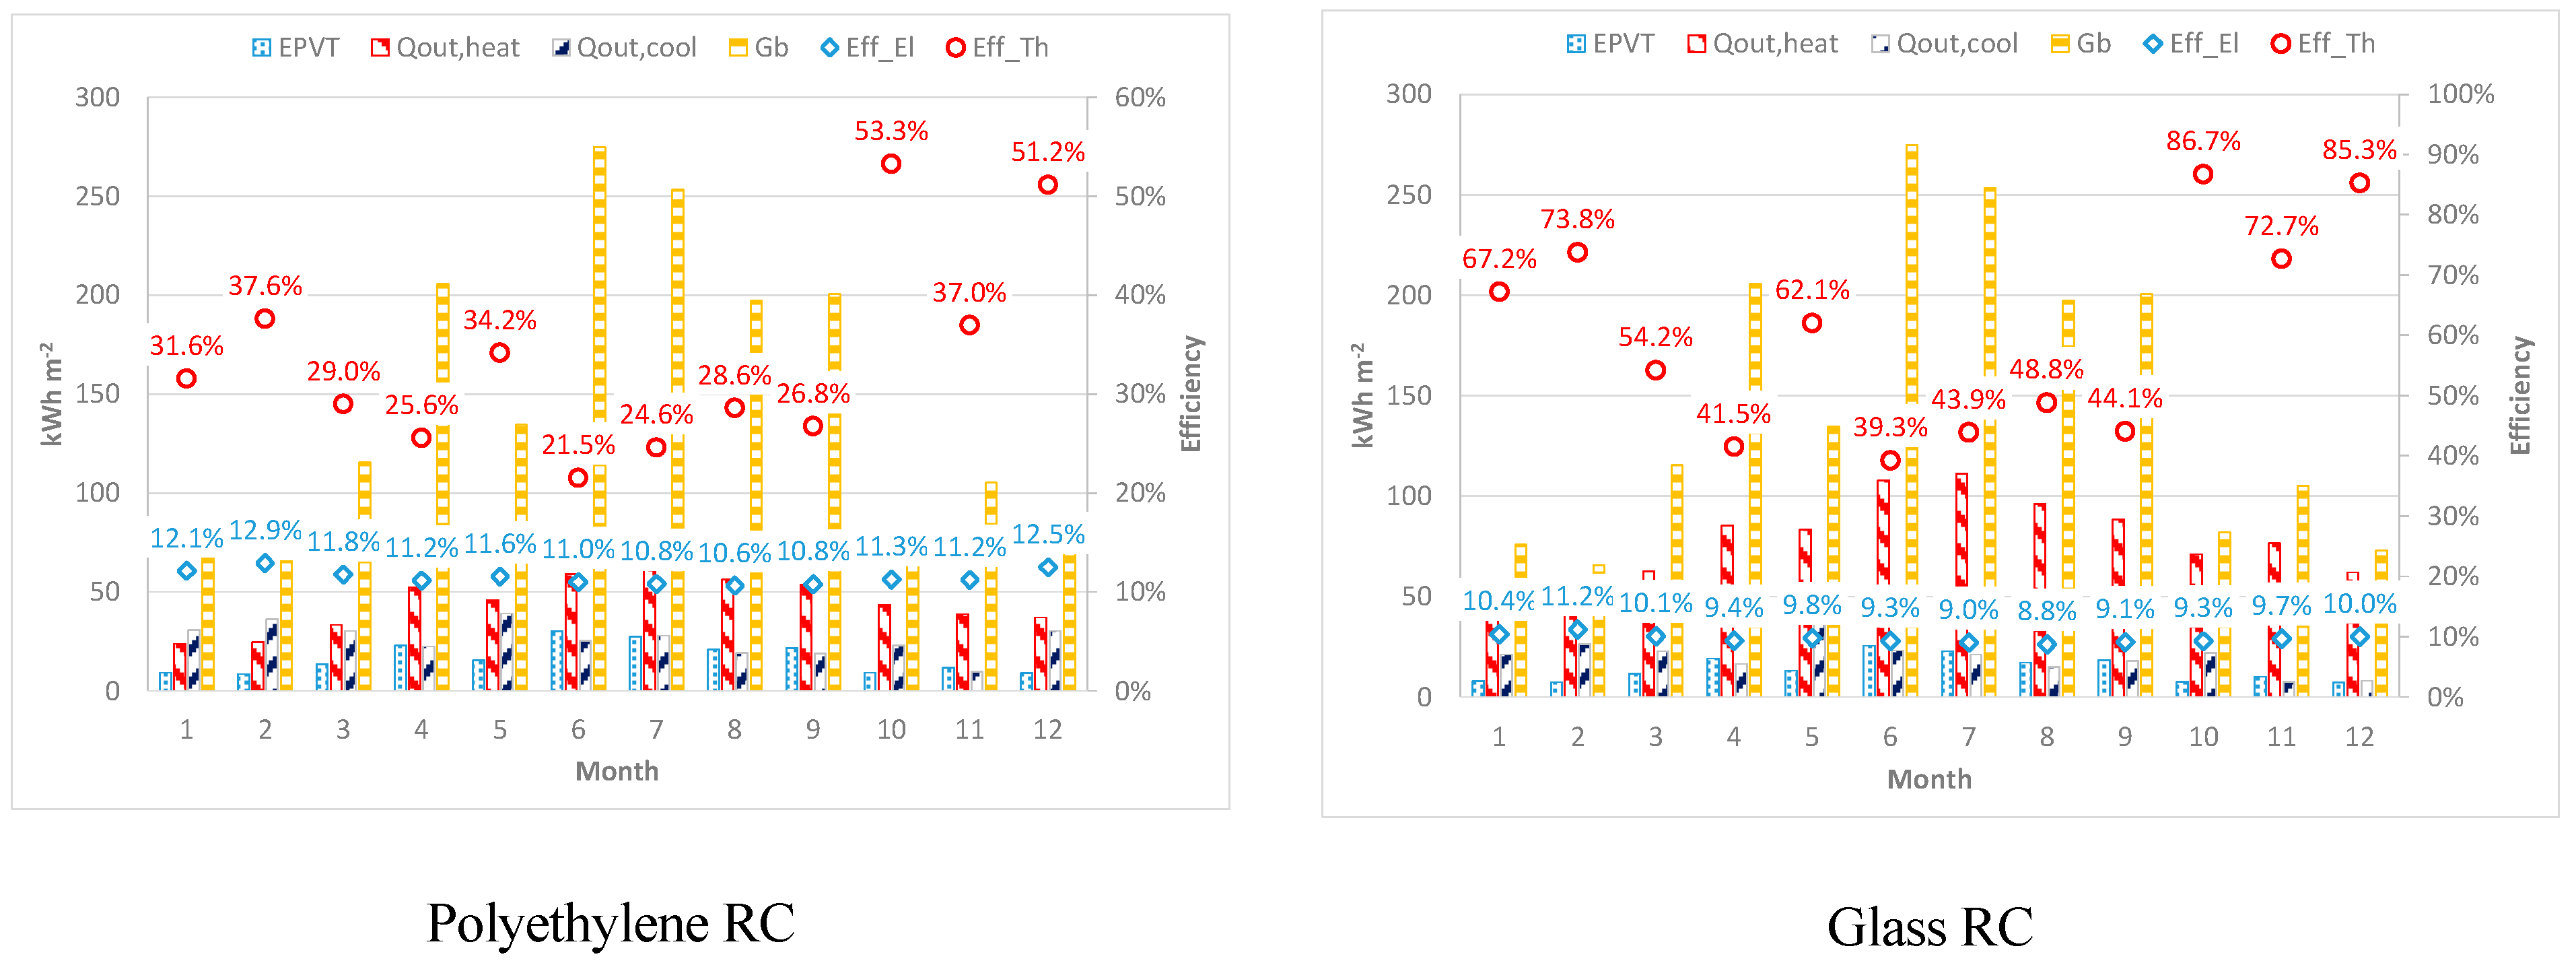
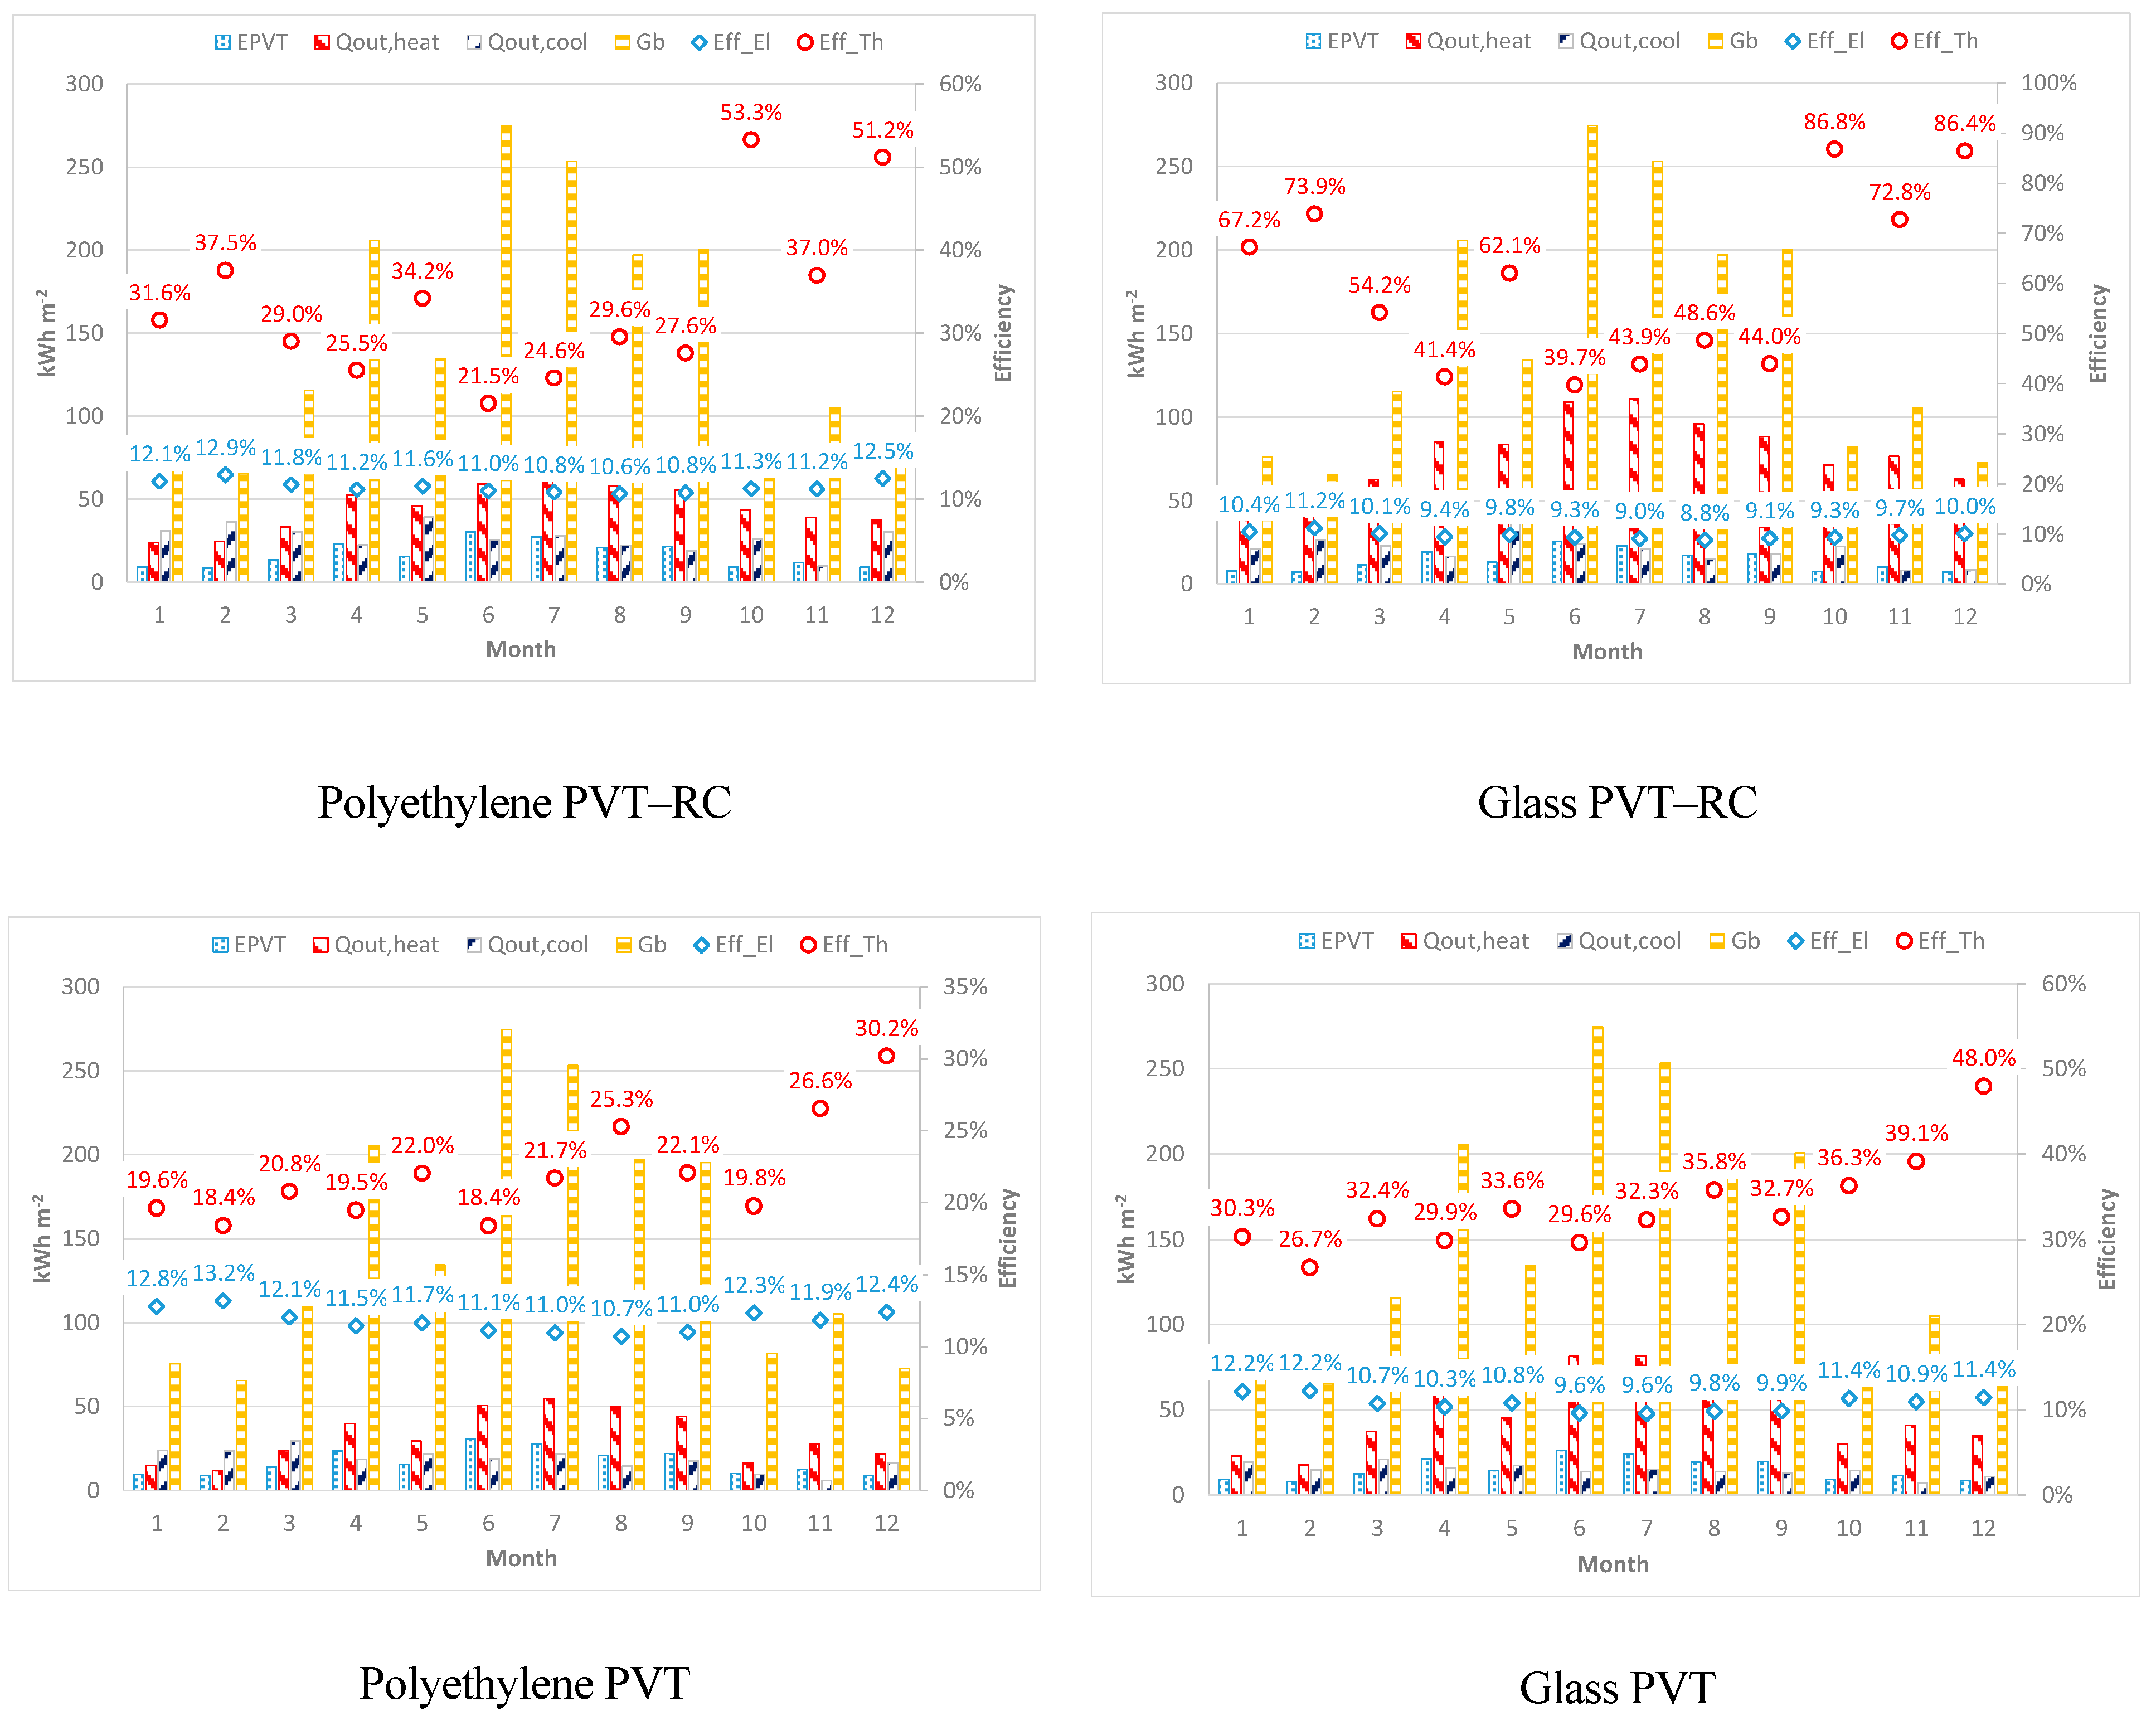
- monthly energy production by the collector (electricity (EPVT), thermal energy (Qout,heat) and cooling energy (Qout,cool)), both specific (per square meter of collector surface) and total values (for 10 m2 of collectors’ area as reported in Table 1);
- monthly thermal (ηth) and electrical (ηel) efficiency, defined as the ratio between the useful energy produced by the collector and the global solar radiation Gβ on the collector surface (Equation (1)):
- load factors (LF), that is, the ratio between the useful energy produced by the collector (electric, thermal and cooling) and the respective load of the building (Equation (2)):
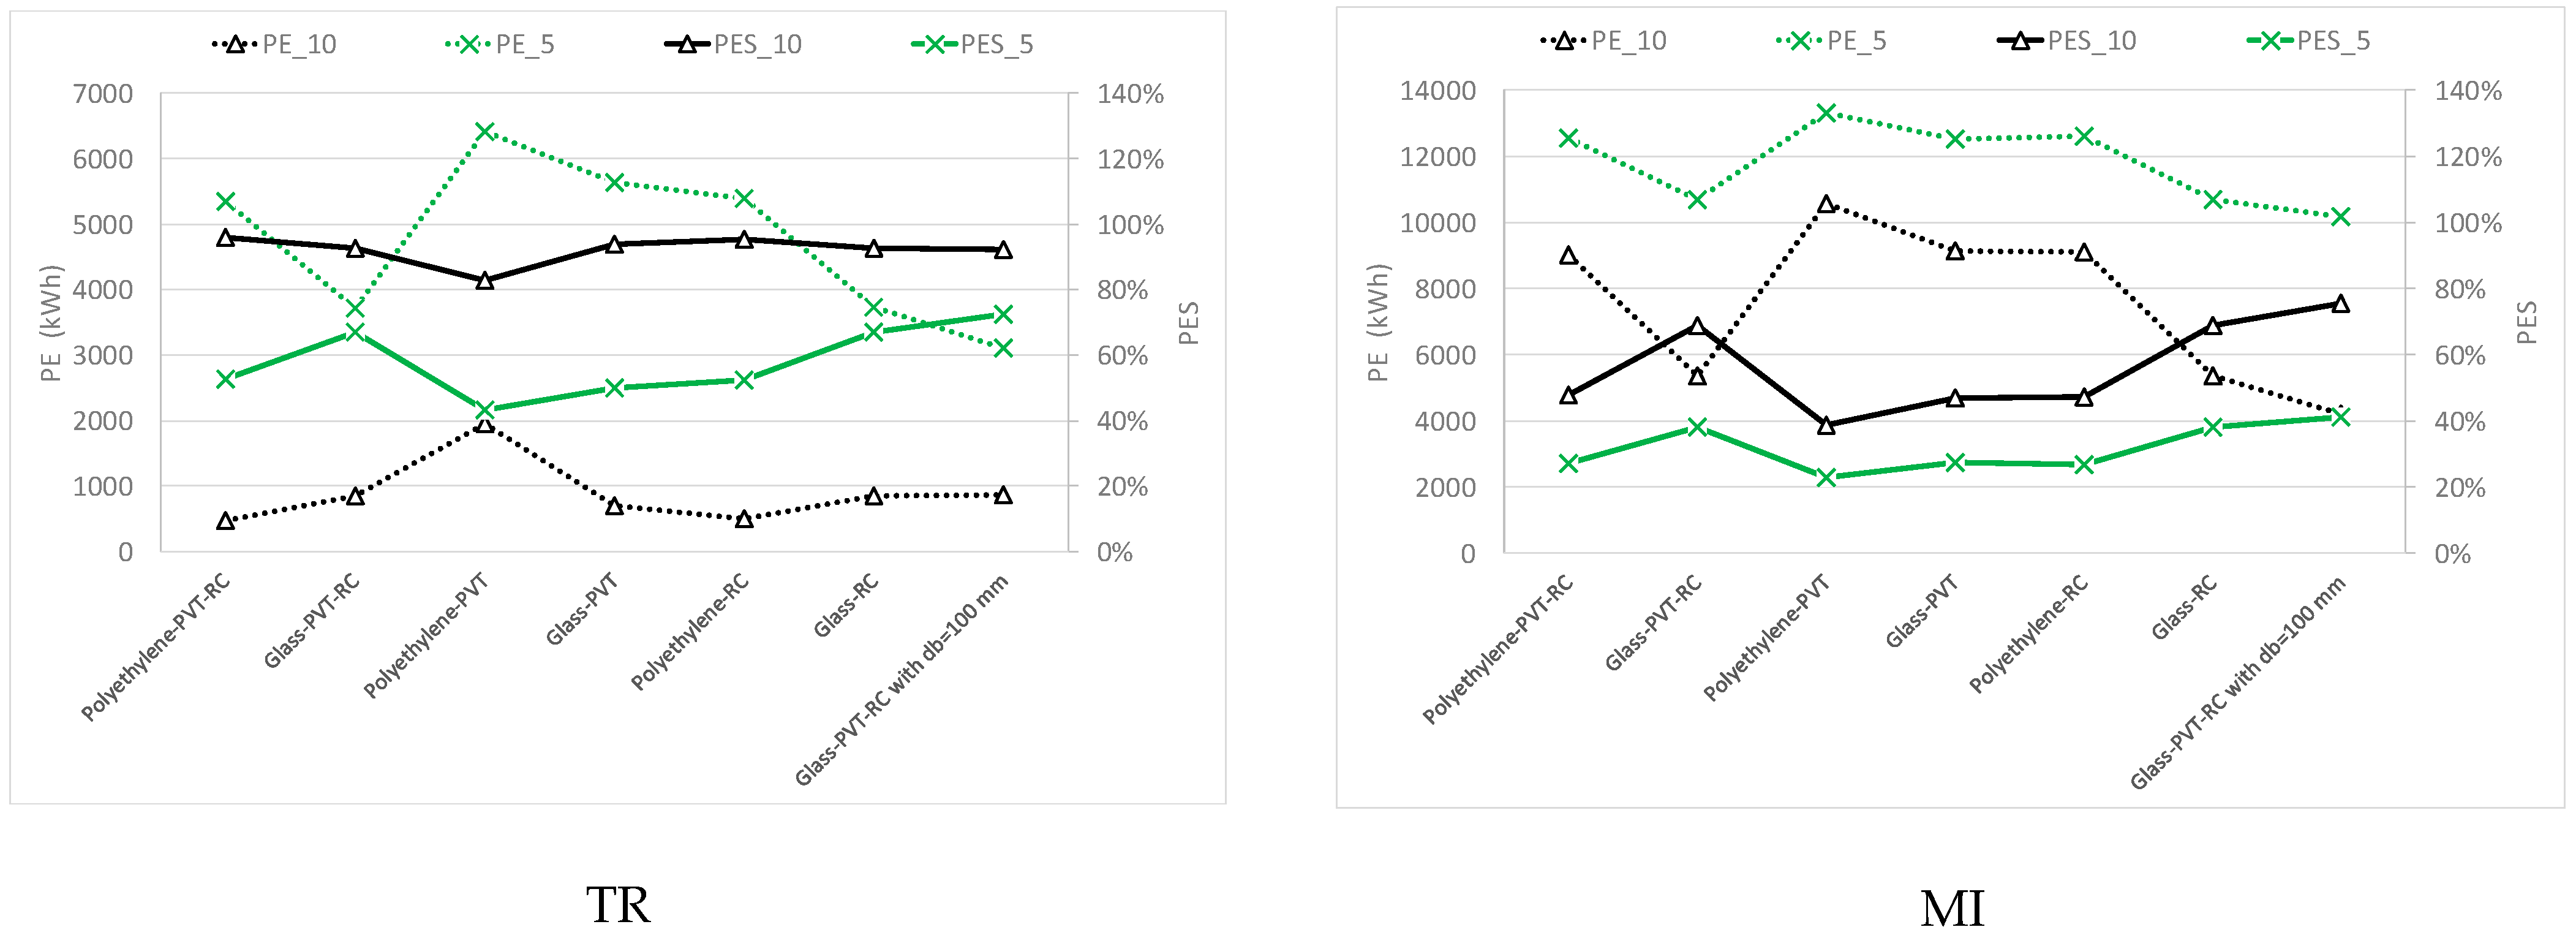
- specific non-renewable primary energy (PE) consumed to satisfy the (possible) parts of the loads not fully covered by the collectors;
- non-renewable primary energy saving (PES) with respect to a reference traditional solution (natural gas-fired condensing boiler, air–water electric vapor compression chiller and electricity from the grid). To conduct such a comparison, reference efficiencies were fixed for electricity (ηel,sp = 51.3%) and thermal energy (ηth,sp = 95.2%) of the separate production on the base of the primary energy factors as defined by Italian Decree DM 26/06/2015, namely, fP,nren (natural gas) = 1.05 and fP,nren (electricity from the grid) = 1.95. An energy efficiency ratio of 3 was set for the cooling energy production by the conventional air–water chiller;
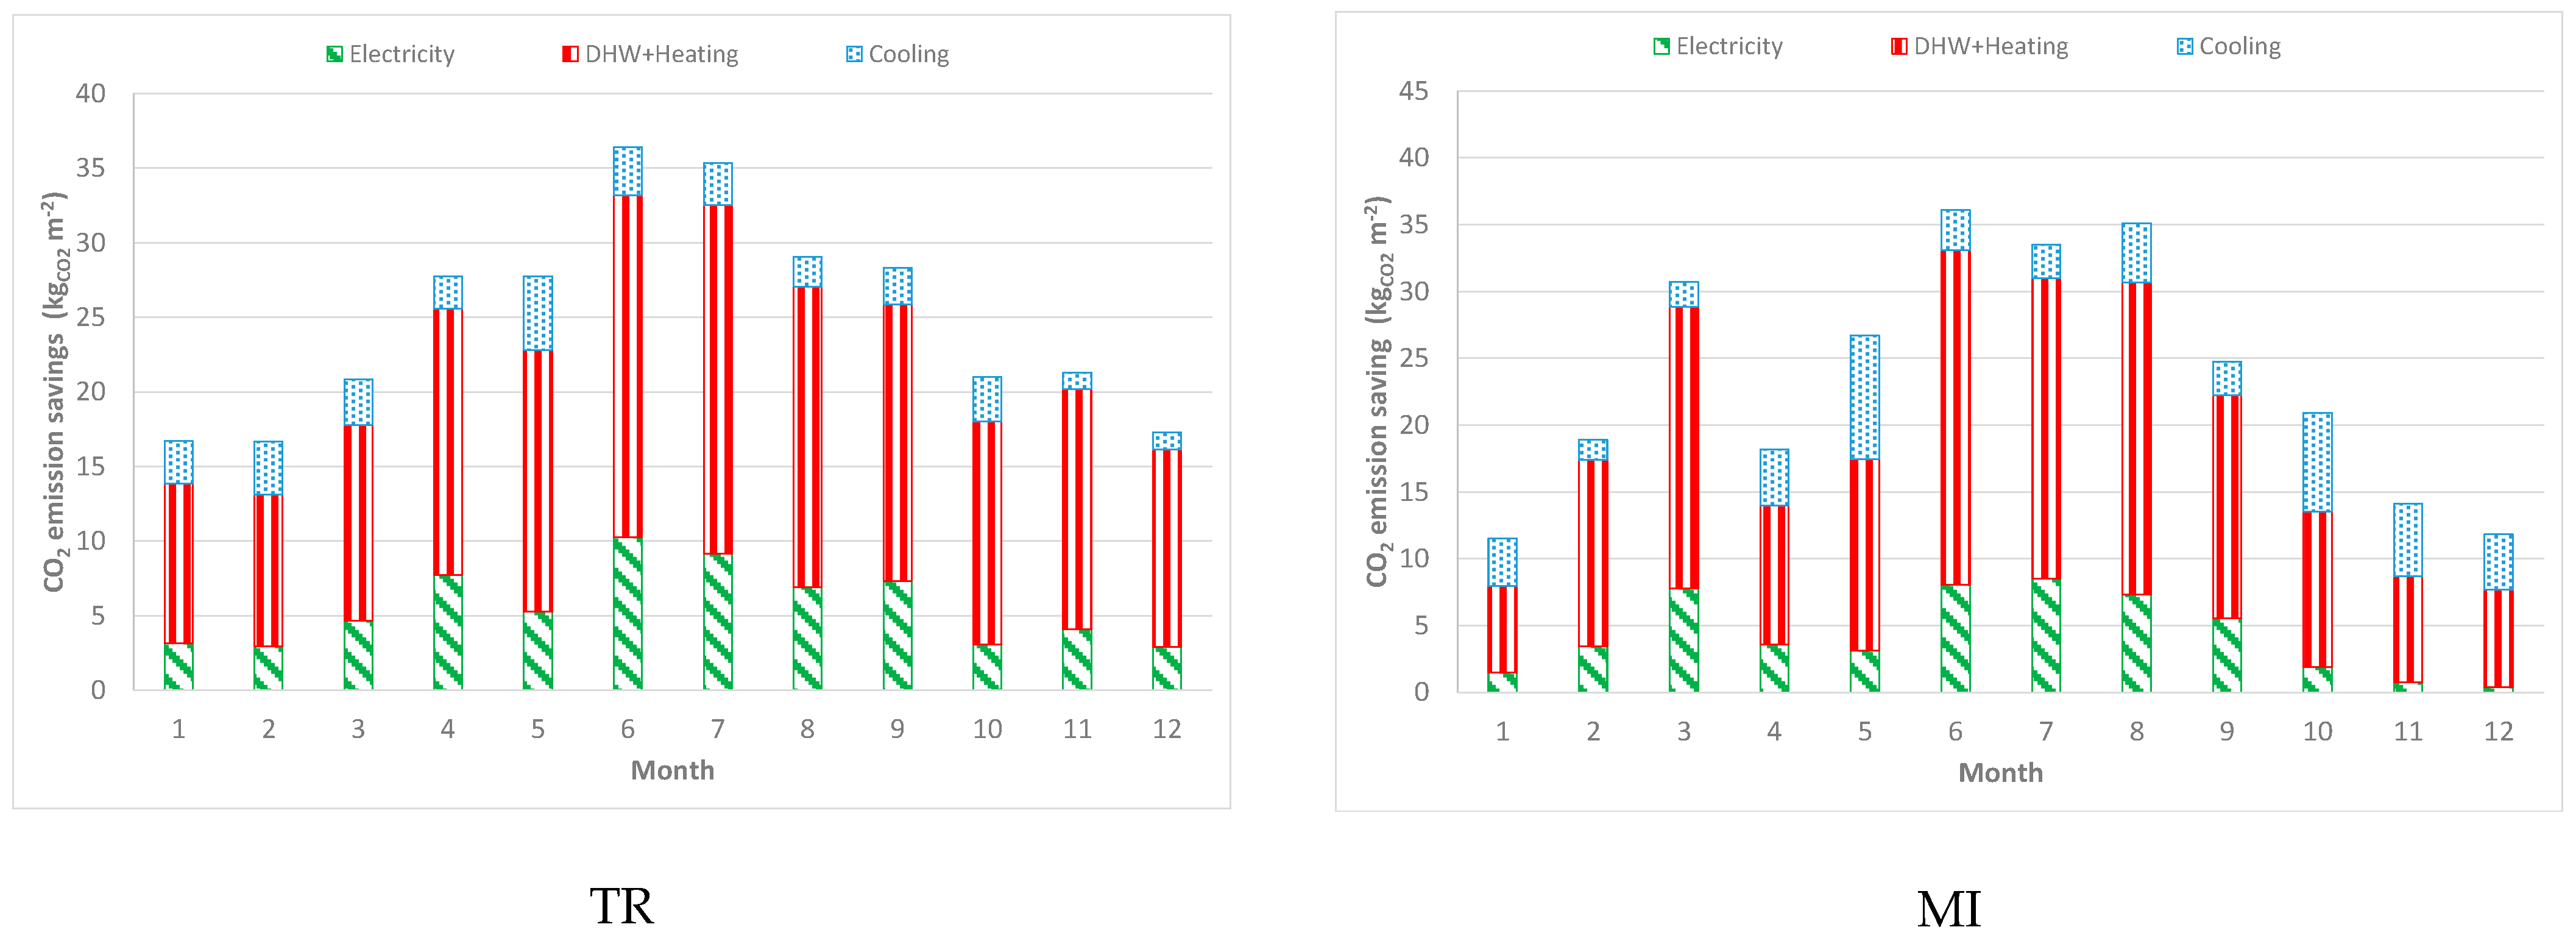
- CO2 specific savings with respect to the traditional solution. Official data in Italy [33] were assumed for electricity (0.4 kgCO2 kWhel−1, which considers the mix of thermo-electric generating technologies, not including renewable sources such as hydro and photovoltaic plants) and for the natural gas boiler (0.2 kgCO2 kWh−1 of primary energy);
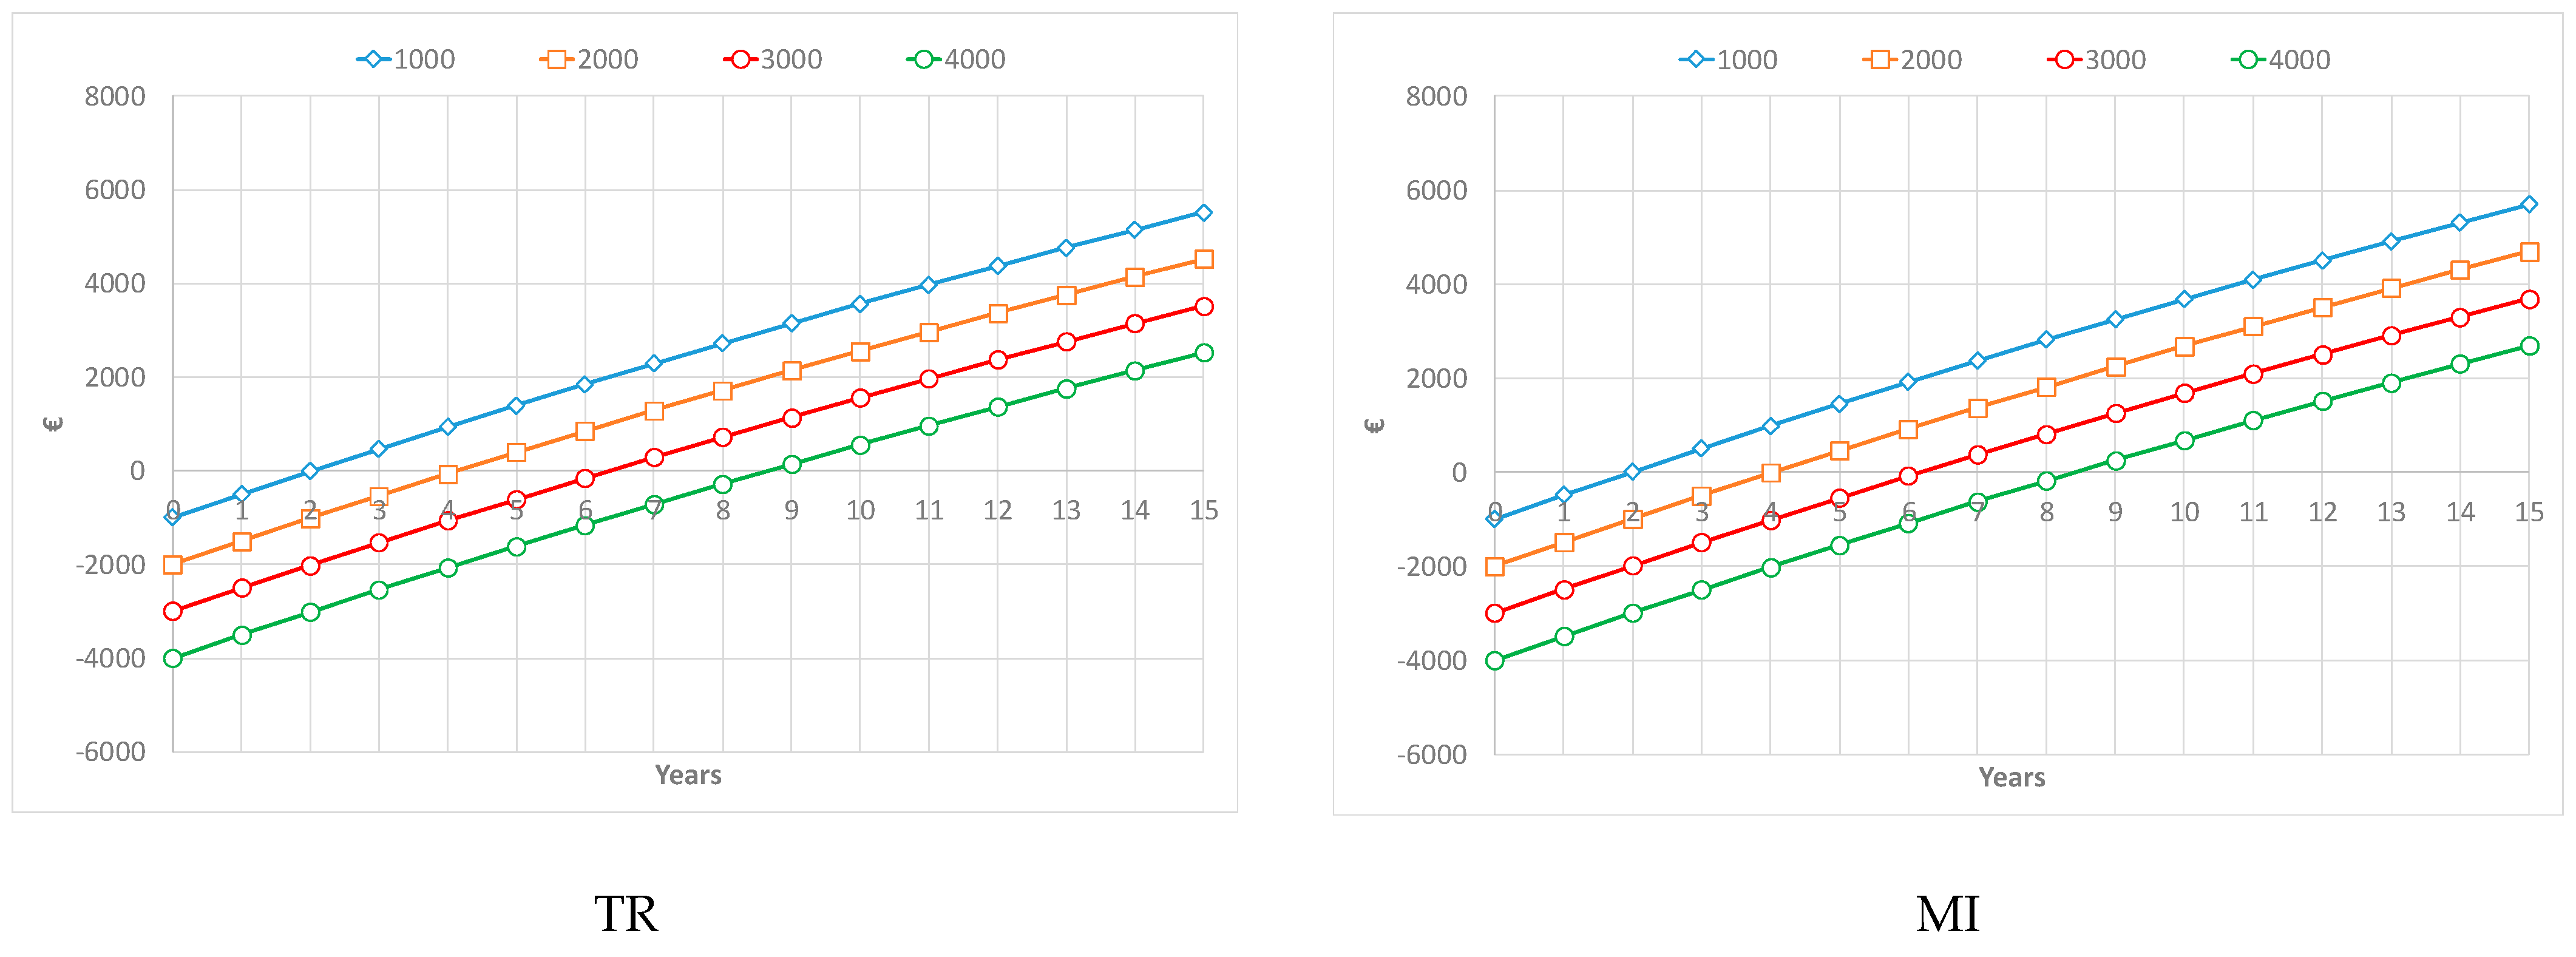
- the six configurations were compared to investigate the best solution from the economic point of view, i.e., with the maximum differential net present worth (NPW) and/or minimum discounted payback period (DPP). In this case, the NPW is defined on the basis of a time series of cumulative differential cash flows, i.e., it is calculated as the sum of the present values of the differential cash flows (DCF) of each solution, with respect to the traditional one, given the interest rate (2% in this study) and the period of the analysis (15 years) (Equation (3)). The DPP is the period of time required for the return on the investment in solar trigeneration to “repay” (by economic savings S) the sum of the original extra-investment P related to the traditional solution (Equation (4)) [34]:
3. Results and Discussion
3.1. Energy Analysis
3.2. Environmental Analysis
3.3. Economic Analysis
4. Conclusions
Author Contributions
Funding
Institutional Review Board Statement
Informed Consent Statement
Conflicts of Interest
Nomenclature
| Acronyms | |
| DHW | domestic hot water |
| MI | Milano |
| NZEB | nearly zero-energy building |
| PV | photovoltaic |
| PVT | photovoltaic/Thermal |
| RC | radiative cooling |
| SH | solar heating |
| TR | Trapani |
| Symbols | |
| Br | temperature coefficient of the solar cells (K−1) |
| DCF | discounted cash flow (EUR) |
| DPP | discounted payback period (y) |
| dp,c | distance cover-plate (mm) |
| db | insulation thickness (mm) |
| kb | insulation thermal conductivity (W m−1 K−1) |
| Eb,λ | spectral radiation power (W m−2 μm−1) |
| Eload | electric load (kWh, kWh m−2) |
| EPVT | electric energy produced by the collector (kWh, kWh m−2) |
| fp,nren | non-renewable primary energy factor |
| Gβ | global solar radiation on the collector surface (kWh, kWh m−2) |
| LFcool | cooling load factor |
| LFel | electricity load factor |
| LFheat | heating load factor |
| mp | primary circuit specific mass flow rate (kg h−1 m−2) |
| ms | secondary circuit specific mass flow rate (kg h−1 m−2) |
| NPW | net present worth (EUR) |
| P | extra-investment of the trigeneration with respect traditional plant (EUR) |
| PE | primary energy (kWh) |
| PES | primary energy Saving |
| Qcooling | cooling load (kWh, kWh m−2) |
| Qheating | heating load (kWh, kWh m−2) |
| Qheating + DHW | heating + DHW load (kWh, kWh m−2) |
| Qout,cool | cooling energy produced by the collector (kWh, kWh m−2) |
| Qout,heat | thermal energy produced by the collector (kWh, kWh m−2) |
| S | annual saving (EUR y−1) |
| t | year |
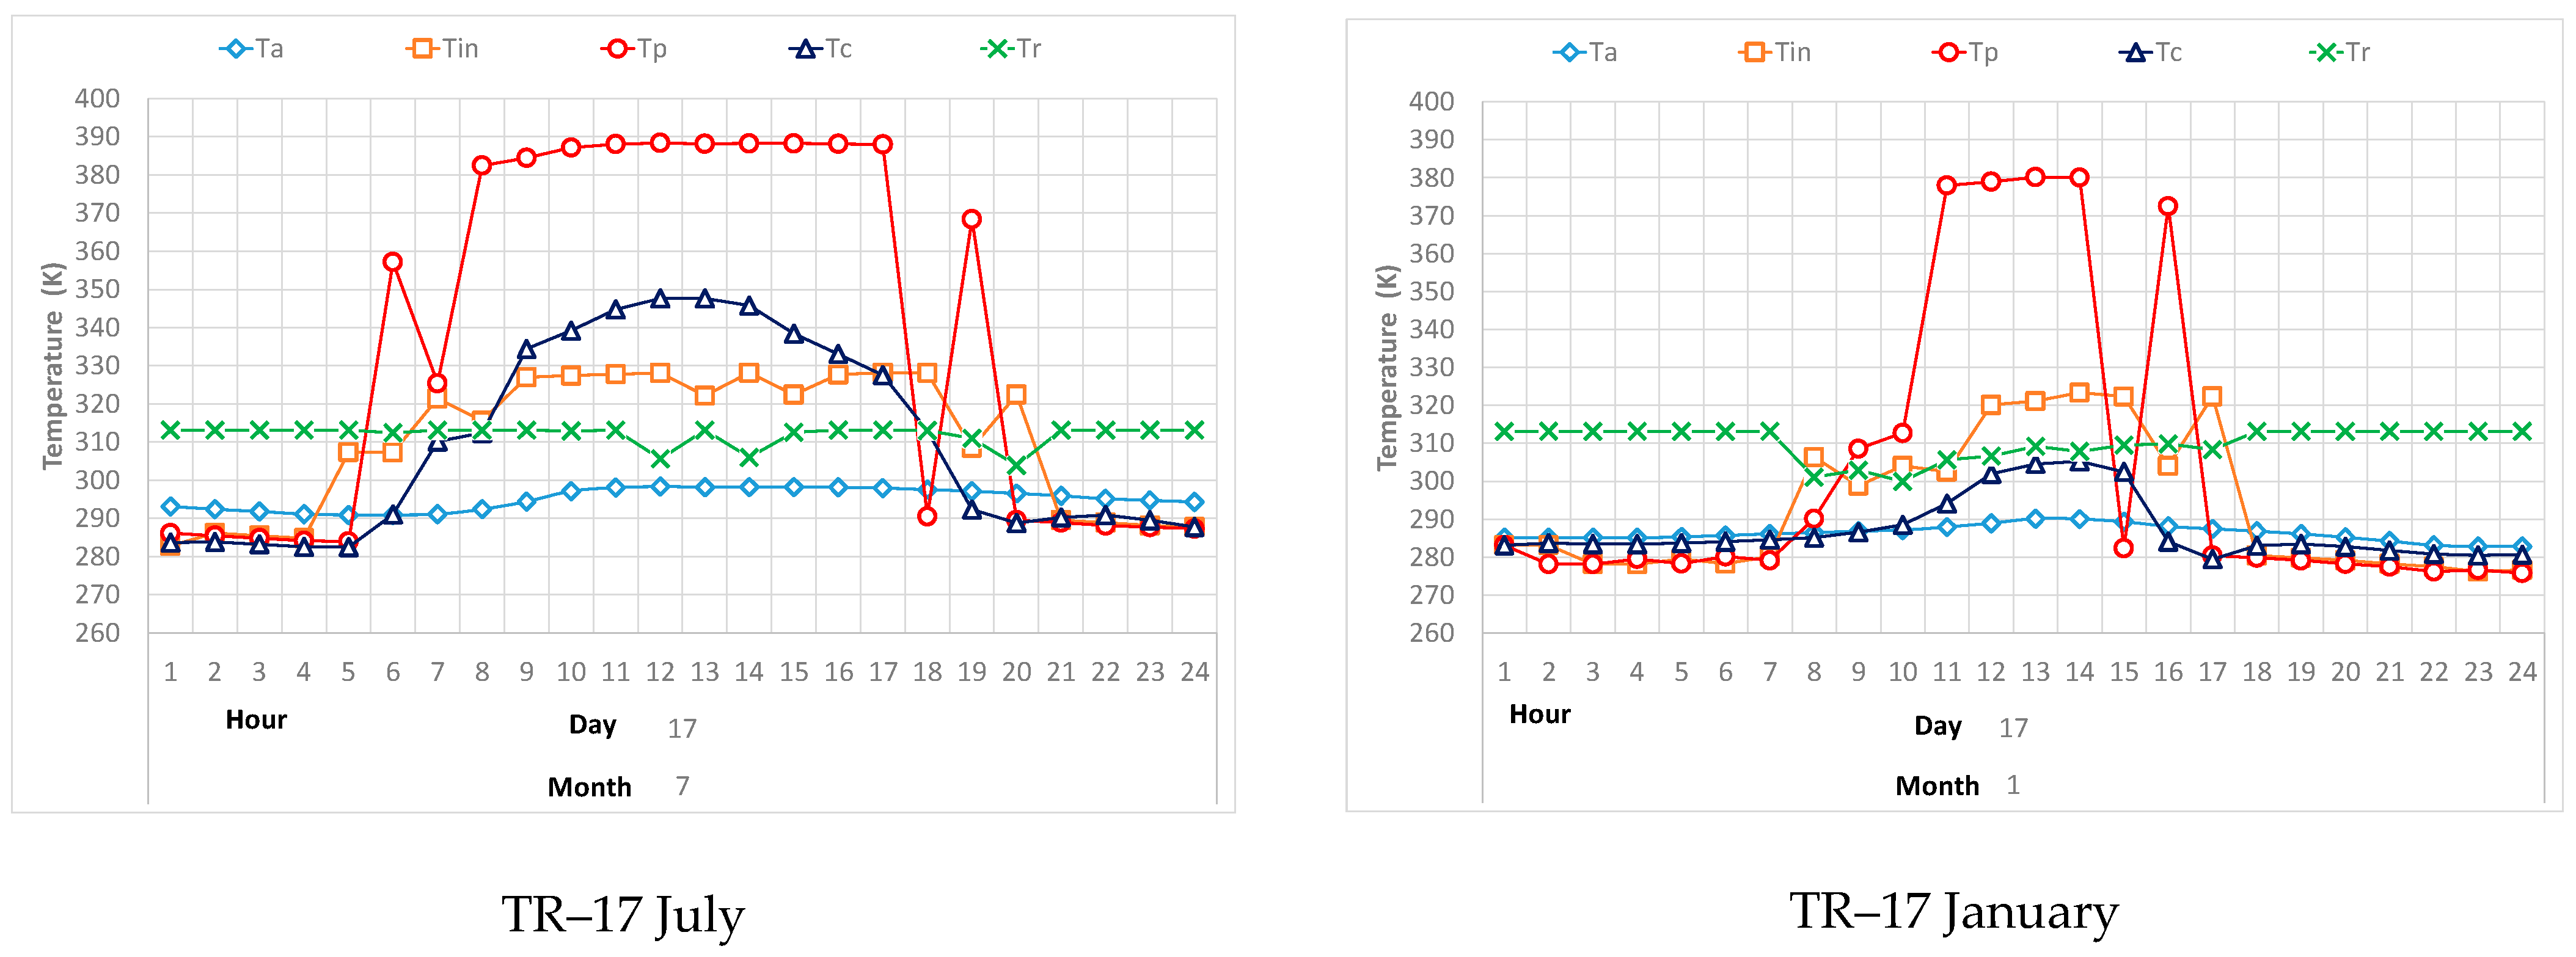
| Ta | outdoor air temperature (°C) |
| Tc | cover temperature (°C) |
| Tin | inlet temperature (°C) |
| Tp | plate temperature (°C) |
| Tr | return temperature (°C) |
| ε | efficiency of the heat exchanger |
| εc | emissivity of the cover |
| εp | emissivity of the plate |
| ηel | electrical efficiency of the collector |
| ηel,sp | electrical efficiency of the separate production |
| ηth | thermal efficiency of the collector |
| ηth,sp | thermal efficiency of the separate production |
| ηref | reference electrical efficiency of the solar cells |
| ρc | reflectance of the cover |
| ρp | reflectance of the plate |
| τc | transmittance of the cover |
References
- Lazzarin, R. Heat pumps and solar energy: A review with some insights in the future. Int. J. Refrig. 2020, 116, 146–160. [Google Scholar] [CrossRef]
- Lazzarin, R. Renewable energy technologies in air conditioning: State-of-the-art and perspectives. In Proceedings of the 25th IIR International Congress of Refrigeration, Montréal, QC, Canada, 24–30 August 2019; pp. 130–141. [Google Scholar]
- IEA. World Energy Outlook 2020; IEA: Paris, France, 2020; Available online: https://www.iea.org/reports/world-energy-outlook-2020 (accessed on 1 September 2021).
- Fraunhofer Institute for Solar Energy Systems. Photovoltaics Report. 2021. Available online: https://www.ise.fraunhofer.de/content/dam/ise/de/documents/publications/studies/Photovoltaics-Report.pdf (accessed on 1 September 2021).
- Yang, H.; Wang, Q.; Huang, X.; Li, J.; Pei, G. Performance study and comparative analysis of traditional and double-selective-coated parabolic trough receivers. Energy 2017, 145, 206–216. [Google Scholar] [CrossRef]
- Dan, A.; Barshilia, H.C.; Chattopadhyay, K.; Basu, B. Solar energy absorption mediated by surface plasma polaritons in spectrally selective dielectric-metaldielectric coatings: A critical review. Renew. Sustain. Energy Rev. 2017, 79, 1050–1077. [Google Scholar] [CrossRef]
- Ning, Y.; Wang, W.; Wang, L.; Sun, Y.; Song, P.; Man, H.; Zhang, Y.; Dai, B.; Zhang, J.; Wang, C.; et al. Optical simulation and preparation of novel Mo/ZrSiN/ZrSiON/SiO2 solar selective absorbing coating. Sol. Energy Mater. Sol. Cell 2017, 167, 178–183. [Google Scholar] [CrossRef]
- Bauer, G.H. Photovoltaic Solar Energy Conversion; Springer: Berlin/Heidelberg, Germany, 2015; ISBN 978-3-662-46683-4. [Google Scholar]
- Theodore, L. Heat Transfer Applications for the Practicing Engineer; John Wiley & Sons: Hoboken, NJ, USA, 2011. [Google Scholar]
- Chow, T.T. A review on photovoltaic/thermal hybrid solar technology. Appl. Energy 2010, 87, 365–379. [Google Scholar] [CrossRef]
- REN 21. Renewables 2020—Global Status Report. Available online: https://www.ren21.net/gsr-2020/ (accessed on 2 September 2021).
- Montagnino, F.M. Solar cooling technologies. Design, application and performance of existing projects. Sol. Energy 2017, 154, 144–157. [Google Scholar] [CrossRef]
- Lazzarin, R.; Noro, M. Past, present, future of solar cooling: Technical and economical considerations. Sol. Energy 2018, 172, 2–13. [Google Scholar] [CrossRef]
- Lazzarin, R.; Noro, M. Heating and Cooling of a Building by Absorption Heat Pumps driven by Evacuated Tube Solar Collectors (ETCs). In Proceedings of the ISHPC 2021 Proceedings—Online Pre-Conference 2020, Berlin, Germany, 22–25 August 2021; pp. 133–136. [Google Scholar] [CrossRef]
- Noro, M.; Lazzarin, R. PVT and ETC Coupling for Annual Heating and Cooling by Absorption Heat Pumps. Sustainability 2020, 12, 7042. [Google Scholar] [CrossRef]
- Raman, A.P.; Anoma, M.A.; Zhu, L.; Rephaeli, E.; Fan, S. Passive radiative cooling below ambient air temperature under direct sunlight. Nature 2014, 515, 540–544. [Google Scholar] [CrossRef]
- Zhai, Y.; Ma, Y.; David, S.N.; Zhao, D.; Lou, R.; Tan, G.; Yang, R.; Yin, X. Scalable-manufactured randomized glass-polymer hybrid metamaterial for daytime radiative cooling. Science 2017, 355, 1062–1066. [Google Scholar] [CrossRef] [PubMed] [Green Version]
- Vall, S.; Castell, A. Radiative cooling as low-grade energy source: A literature review. Renew. Sustain. Energy Rev. 2017, 77, 803–820. [Google Scholar] [CrossRef] [Green Version]
- Gentle, A.R.; Smith, G.B. A subambient open roof surface under the Mid-Summer sun. Adv. Sci. 2015, 2, 1500119. [Google Scholar] [CrossRef] [PubMed]
- Kou, J.-L.; Jurado, Z.; Chen, Z.; Fan, S.; Minnich, A.J. Daytime radiative cooling using near-black infrared emitters. ACS Photon. 2017, 4, 626–630. [Google Scholar] [CrossRef] [Green Version]
- Chen, J.; Lu, L. Development of radiative cooling and its integration with buildings: A comprehensive review. Sol. Energy 2020, 212, 125–151. [Google Scholar] [CrossRef]
- Zhang, J.; Yuan, J.; Liu, J.; Zhou, Z.; Sui, J.; Xing, J.; Zuo, J. Cover shields for sub-ambient radiative cooling: A literature review. Renew. Sustain. Energy Rev. 2021, 143, 110959. [Google Scholar] [CrossRef]
- Zhao, B.; Hu, M.; Ao, X.; Pei, G. Conceptual development of a building-integrated photovoltaic–radiative cooling system and preliminary performance analysis in Eastern China. Appl. Energy 2017, 205, 626–634. [Google Scholar] [CrossRef]
- Hu, M.; Zhao, B.; Ao, X.; Zhao, P.; Su, Y.; Pei, G. Field investigation of a hybrid photovoltaic-photothermic-radiative cooling system. Appl. Energy 2018, 231, 288–300. [Google Scholar] [CrossRef]
- Zhao, B.; Hu, M.; Ao, X.; Chen, N.; Pei, G. Radiative cooling: A review of fundamentals, materials, applications, and prospects. Appl. Energy 2019, 236, 489–513. [Google Scholar] [CrossRef]
- Hu, M.; Su, Y.; Darkwa, J.; Riffat, S. Implementation of Passive Radiative Cooling Technology in Buildings: A Review. Buildings 2020, 10, 215. [Google Scholar]
- Hu, M.; Zhao, B.; Ao, X.; Su, Y.; Wang, Y.; Pei, G. Comparative analysis of different surfaces for integrated solar heating and radiative cooling: A numerical study. Energy 2018, 155, 360–369. [Google Scholar] [CrossRef]
- Hu, M.; Zhao, B.; Li, J.; Wang, Y.; Pei, G. Preliminary thermal analysis of a combined photovoltaic-photothermic-nocturnal radiative cooling system. Energy 2017, 137, 419–430. [Google Scholar] [CrossRef]
- Hu, M.; Zhao, B.; Ao, X.; Ren, X.; Cao, J.; Wang, Q.; Su, Y.; Pei, G. Performance assessment of a trifunctional system integrating solar PV, solar thermal, and radiative sky cooling. Appl. Energy 2020, 260, 114167. [Google Scholar] [CrossRef]
- Hu, M.; Zhao, B.; Ao, X.; Cao, J.; Wang, Q.; Riffat, S.; Su, Y.; Pei, G. An analytical study of the nocturnal radiative cooling potential of typical photovoltaic/thermal module. Appl. Energy 2020, 277, 115625. [Google Scholar] [CrossRef]
- Vialetto, G.; Noro, M.; Rokni, M. Innovative household systems based on solid oxide fuel cells for the Mediterranean climate. Int. J. Hydrogen Energy 2015, 40, 14378–14391. [Google Scholar] [CrossRef]
- CTI—Comitato Termotecnico Italiano. Weather Reference Year. Available online: https://www.cti2000.it/index.php?controller=news&action=show&newsid=34985 (accessed on 15 July 2021). (In Italian).
- Schibuola, L.; Tambani, C. Performance comparison of heat recovery systems to reduce viral contagion in indoor environments. Appl. Therm. Eng. 2021, 190, 116843. [Google Scholar] [CrossRef]
- Noro, M.; Lazzarin, R.; Busato, F. Solar cooling and heating plants: An energy and economic analysis of liquid sensible vs phase change material (PCM) heat storage. Int. J. Refrig. 2014, 39, 104–116. [Google Scholar] [CrossRef]
- Mancin, S.; Noro, M. Reversible Heat Pump Coupled with Ground Ice Storage for Annual Air Conditioning: An Energy Analysis. Energies 2020, 13, 6182. [Google Scholar] [CrossRef]
- Righetti, G.; Lazzarin, R.; Noro, M.; Mancin, S. Phase Change Materials embedded in porous matrices for hybrid thermal energy storages: Experimental results and modelling. Int. J. Refrig. 2019, 106, 266–277. [Google Scholar] [CrossRef]
- Lazzarin, R.; Noro, M. Lessons learned from long term monitoring of a multisource heat pump system. Energy Build. 2018, 174, 335–346. [Google Scholar] [CrossRef]
- Lazzarin, R.; Noro, M. Photovoltaic/Thermal (PV/T)/ground dual source heat pump: Optimum energy and economic sizing based on performance analysis. Energy Build. 2020, 211, 109800. [Google Scholar] [CrossRef]


| Variable (Unit) | Value |
|---|---|
| Primary circuit specific mass flow rate (mp) (kg h−1 m−2) | 60 |
| Secondary circuit specific mass flow rate (ms) (kg h−1 m−2) | 20 |
| Collector area (m2) | 10 |
| Distance of cover-plate (dp,c) (mm) | 40 |
| Insulation thickness (db) (mm) | 40 |
| Insulation thermal conductivity (kb) (W m−1 K−1) | 0.04 |
| Reflectance of cover (ρc) | 0.01 |
| Reflectance of plate (ρp) | 0.10 |
| Transmittance (τc)—Polyethylene | 0.90 |
| Transmittance (τc)—Glass mid-and far-infrared (night) | 0.10 |
| Transmittance (τc)—Glass near infrared (day) | 0.90 |
| Reference electrical efficiency of the solar cells (ηref) | 16.0% |
| Temperature coefficient of the solar cells (Br) (K−1) | 0.0045 |
| Efficiency of the heat exchanger (ε) | 0.8 |
| Trapani | Milano | ||||||||||||||
|---|---|---|---|---|---|---|---|---|---|---|---|---|---|---|---|
| Polyethylene PVT–RC | Glass PVT–RC | Polyethylene PVT | Glass PVT | Polyethylene RC | Glass RC | Glass PVT–RC * | Polyethylene PVT–RC | Glass PVT–RC | Poly Ethylene-PVT | Glass PVT | Poly Ethylene-RC | Glass RC | Glass PVT–RC * | ||
| EPVT | kWh | 2003 | 1686 | 2049 | 1844 | 2002 | 1685 | 1676 | 1518 | 1296 | 1554 | 1397 | 1518 | 1295 | 1272 |
| Qout,heat | kWh | 5355 | 9455 | 3865 | 5897 | 5320 | 9443 | 10,238 | 4716 | 8600 | 3176 | 4812 | 4615 | 8598 | 9740 |
| Qout,cool | kWh | 3200 | 2419 | 2219 | 1760 | 3144 | 2392 | 3201 | 4021 | 3732 | 2895 | 1930 | 3870 | 3715 | 4234 |
| Gβ | kWh | 17,827 | 17,827 | 17,827 | 17,827 | 17,827 | 17,827 | 17,827 | 13,348 | 13,348 | 13,348 | 13,348 | 13,348 | 13,348 | 13,348 |
| ηel | 11.2% | 9.5% | 11.5% | 10.3% | 11.2% | 9.5% | 9.4% | 11.4% | 9.7% | 11.6% | 10.5% | 11.4% | 9.7% | 9.5% | |
| ηth | 30.0% | 53.0% | 21.7% | 33.1% | 29.8% | 53.0% | 57.4% | 35.3% | 64.4% | 23.8% | 36.1% | 34.6% | 64.4% | 73.0% | |
| Eload | kWh | 2121 | 2121 | 2121 | 2121 | 2121 | 2121 | 2121 | 2121 | 2121 | 2121 | 2121 | 2121 | 2121 | 2121 |
| Qheating + DHW | kWh | 5586 | 5586 | 5586 | 5586 | 5586 | 5586 | 5586 | 12,179 | 12,179 | 12,179 | 12,179 | 12,179 | 12,179 | 12,179 |
| Qcooling | kWh | 2008 | 2008 | 2008 | 2008 | 2008 | 2008 | 2008 | 505 | 505 | 505 | 505 | 505 | 505 | 505 |
| 94.4% | 79.5% | 96.6% | 87.0% | 94.4% | 79.5% | 79.0% | 71.6% | 61.1% | 73.3% | 65.9% | 71.6% | 61.0% | 60.0% | ||
| 95.9% | 100.0% | 69.2% | 100.0% | 95.2% | 100.0% | 100.0% | 38.7% | 70.6% | 26.1% | 39.5% | 37.9% | 70.6% | 80.0% | ||
| 100.0% | 100.0% | 100.0% | 87.6% | 100.0% | 100.0% | 100.0% | 100.0% | 100.0% | 100.0% | 100.0% | 100.0% | 100.0% | 100.0% | ||
| Poly Ethylene-PVT–RC | Glass PVT–RC | Poly Ethylene-PVT | Glass PVT | Poly Ethylene-RC | Glass RC | Glass PVT–RC with db = 100 mm | ||
|---|---|---|---|---|---|---|---|---|
| TR | Electricity | 80.1 | 67.4 | 81.9 | 73.8 | 80.1 | 67.4 | 67.0 |
| DHW + heating | 112.5 | 198.6 | 81.2 | 123.9 | 111.8 | 198.4 | 215.1 | |
| Cooling | 42.7 | 32.2 | 29.6 | 23.5 | 41.9 | 31.9 | 42.7 | |
| Total | 235.3 | 298.3 | 192.7 | 221.1 | 233.8 | 297.7 | 324.8 | |
| MI | Electricity | 60.7 | 51.8 | 62.1 | 55.9 | 60.7 | 51.8 | 50.9 |
| DHW + heating | 115.5 | 198.8 | 84.5 | 122.3 | 113.4 | 198.7 | 220.9 | |
| Cooling | 45.1 | 42.8 | 31.3 | 21.6 | 43.1 | 42.6 | 47.8 | |
| Total | 221.3 | 293.4 | 177.9 | 199.7 | 217.2 | 293.1 | 319.6 |
Publisher’s Note: MDPI stays neutral with regard to jurisdictional claims in published maps and institutional affiliations. |
© 2021 by the authors. Licensee MDPI, Basel, Switzerland. This article is an open access article distributed under the terms and conditions of the Creative Commons Attribution (CC BY) license (https://creativecommons.org/licenses/by/4.0/).
Share and Cite
Noro, M.; Mancin, S.; Riehl, R. Energy and Economic Sustainability of a Trigeneration Solar System Using Radiative Cooling in Mediterranean Climate. Sustainability 2021, 13, 11446. https://doi.org/10.3390/su132011446
Noro M, Mancin S, Riehl R. Energy and Economic Sustainability of a Trigeneration Solar System Using Radiative Cooling in Mediterranean Climate. Sustainability. 2021; 13(20):11446. https://doi.org/10.3390/su132011446
Chicago/Turabian StyleNoro, Marco, Simone Mancin, and Roger Riehl. 2021. "Energy and Economic Sustainability of a Trigeneration Solar System Using Radiative Cooling in Mediterranean Climate" Sustainability 13, no. 20: 11446. https://doi.org/10.3390/su132011446
APA StyleNoro, M., Mancin, S., & Riehl, R. (2021). Energy and Economic Sustainability of a Trigeneration Solar System Using Radiative Cooling in Mediterranean Climate. Sustainability, 13(20), 11446. https://doi.org/10.3390/su132011446