Abstract
Until recently, solar assisted heat pumps have used solar collectors as a cold source. Solar collectors provide, when possible, direct heat, otherwise they offer temperature levels to the heat pump evaporator higher than the outside air. At the same time, solar thermal cooling exploits the solar collectors and the absorption chiller only in hot months. Photovoltaic/Thermal (PVT) modules have been available on the market in recent years for solar cogeneration, but their utilization can be problematic due to PhotoVoltaic (PV) cell damage in cases where there is no heating request. This paper considers the possibility of coupling evacuated tube collectors and photovoltaic/thermal modules to drive an absorption heat pump-based plant operating as an absorption chiller in the summertime. The cold source is the solar energy and the ground, which is recharged by the solar thermal and photovoltaic/thermal collectors and by the cooling of the absorber-condenser in mid-seasons and summer. This study analyzes the system behavior in yearly operation and evaluates the role of suitable storage tanks in two different climates, varying the size of the two solar fields and the generator tank. In the best plant configuration, a primary energy ratio of 26.6 in colder climates with cloudy skies and 20 in hotter climates with clearer skies is obtained.
1. Introduction
The cooling and heating of buildings results in a very high global energy demand; about 30–45%, depending of the country [1]. Even though the Energy Performance of Buildings Directive (EPBD) requires that all new buildings in the European Union be nearly zero energy buildings (NZEB) by the end of 2020 [2], heating and cooling demands remain high for existing buildings, even after refurbishment. This has encouraged an interest in using more efficient equipment for heating, such as condensing boilers or heat pumps, and, obviously, renewable energy.
Solar energy can contribute to meeting the heating and cooling demands of buildings by solar electricity or by solar thermally driven processes [3,4]. Reversible vapor compression heat pumps connected to PhotoVoltaic (PV) modules are an attractive solution due to the impressive cost reduction of PV modules since 2005.
On the other hand, solar energy can be converted into thermal energy to run thermally activated devices, such as absorption or adsorption systems [5]. As is well known, low solar energy availability and outside air temperatures usually penalize solar collectors’ energy performance during the cold season. For this reason, solar absorption cooling has been actively investigated since the 1970s, whereas solar absorption heating has been studied much less. Firstly, LiBr single effect air conditioners coupled to selective Flat Plate Collectors (FPCs) were used in energy plants [6]. Later on, the first utilization of Evacuated Tube Collectors (ETCs) was proposed. Due to the sensitivity of the absorption chiller performance to on-off working, a steady operation for a longer time by means of control and storage was developed with the proposal of also installing a cold storage [7]. A series of technical improvements regarding solar thermal collectors and absorption chillers has occurred over the last few decades, with concentration collectors appearing on the market [8,9]. Many studies have been compiled in the literature review papers [10,11,12,13].
However, only 1350 solar cooling plants were recorded before 2015 (mostly in Europe), even if their application appeared suitable (plenty of solar energy when the cooling demand is the highest) [14]. As a matter of fact, solar thermal cooling suffers some technical and economic drawbacks; it requires a complex system, is an expensive application, and, above all, in temperate climates the utilization of a solar thermal cooling plant is limited to only a few months because, in the cold season, utilization suffers from the above-mentioned limitations of low outside temperature and solar radiation.
An interesting option to increase the attractiveness of solar thermally driven systems, when compared to the actually more competitive PV heating and cooling systems, could be the utilization of ETCs as a means of driving energy at the generator of a thermally driven heat pump, rather than just their traditional use as a heat source (at the evaporator). Nowadays, this can be possible thanks to technical improvements in solar thermal collectors over the last few years [3]. Higher performance selective coatings have been developed specifically for ETCs, thus reducing the overall heat loss coefficient. Currently, a first order thermal loss coefficient of 1 W m−2 K−1, or even less, is normal for ETCs that are widely available on the market. The useful solar radiation on the aperture area of the ETCs is further enhanced by means of Compound Parabolic Reflectors (CPC) [15,16].
As a matter of fact, thanks to the high thermal efficiency, even during colder months, a suitable outlet temperature can be reached if sufficient solar radiation impinges the collector’s surface. Obviously, the performance depends on the climate of the resort considered, particularly on the outside air temperature and the clearness index. For such an annual utilization of solar thermal energy, a thermally driven chiller that can operate as a heat pump with suitable temperatures at the three heat exchangers (generator, evaporator, absorber/condenser) has to be coupled.
In this study, a simulation model of a thermally driven multi-source heat pump/chiller that faces the heating and cooling loads of an existing building is developed. The main novelty of this study is the utilization of thermal energy produced by ETCs as both the driving and the heat source energy of a thermally driven heat pump/chiller. At low levels of solar radiation, the heat pump is driven by a conventional boiler. A further solar contribution as the heat source of the heat pump is supplied by Photovoltaic/Thermal (PVT) modules. These are devices that exploit the thermal fraction because the PV cells are connected to an absorber that exchanges heat with a cooling water flow [17,18,19,20]. Electricity from the PV cells can be directly used to supply the consumption of the plant itself. In order to avoid possible overheating of the PV cells, and as the system must ensure service, even in the absence of solar radiation, a proper coupling with ground heat exchangers is considered.
The available construction data of an existing building allows us to analyze the energy performance of a multi-source (ground + unglazed PVT + ETC), thermally driven (by ETC) heat pump/chiller. The analysis is carried out in two different climates. A suitable scheme of the heating, ventilating and air conditioning (HVAC) plant and its control logic has been developed to face the contemporaneity of heating and cooling demands during mild months. The results of simulations allow us to assess the size of the main equipment of the solar heating and cooling plant in order to make it sufficiently sustainable from an energy point of view when compared to a traditional air/water (A/W) electric chiller/heat pump system.
2. Materials and Methods
This section describes the simulation models developed in Trnsys to simulate the behavior of the system, with a time step of 15 min, in order to determine the size of the equipment for optimizing the energy performance.
2.1. The Simulation Model
2.1.1. Building Thermal Loads Calculation
An existing real building sited at ENEA Casaccia Research Centre near Rome (Italy) is considered as our case study (“Scuola delle energie”, “Energies School”, building). Its volume is of 620 m3, with a total floor surface of 230 m2. The dynamic simulation software Trnsys [21] has been used to model the building on the basis of characteristics of the transparent and opaque surfaces, internal gains and schedules data supplied by ENEA [22]. As the main features, the thermal transmittance of windows, roof and external walls are, respectively, 2.8, 0.52 and 0.72 W m−2 K−1. The set point of internal air temperature is 20 °C in the daytime with an attenuation down to 16 °C in the nighttime during the heating season, whereas during the summer the temperature is set at 26 °C, and allowed to increase to 28 °C following the schedule. No air relative humidity control is foreseen. The cooling and heating loads are calculated on the basis of two Italian resorts’ climatic data based on the EN ISO 15927-4 European standard [23]: Rome and Belluno (respectively 41.9° N and 46.14° N latitude). They have two very different climates in terms of both air temperature and clearness index MT (the latter is defined as the ratio between the hourly global solar irradiation on the horizontal plane and the same in absence of the atmosphere [15]) (Figure 1).
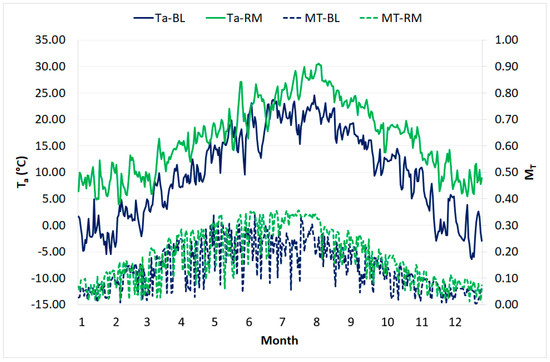
Figure 1.
Daily average outside air temperature (Ta) and clearness index (MT) for Rome (RM) and Belluno (BL).
A suitable schedule of presence of people and other internal gains were considered. For the heating season (15 October–15 April for Rome, 15 September–30 April for Belluno), a thermal load of 11 kW and 16 kW, and thermal needs of 11.18 GJ and 49.2 GJ (13.5 and 59.4 kWh m−2 y−1) respectively for Rome and Belluno were calculated. For the cooling season, a cooling load of 15.9 kW and 10 kW, and cooling needs of 35.5 GJ and 12.5 GJ (42.9 and 15.1 kWh m−2 y−1) respectively for Rome and Belluno were determined (Figure 2). As a matter of fact, the climate of the resort affects the design of the building. The comparison proposed here is based on the same building tested in two different resorts, with the main scope of optimizing the design and size of the main equipment of the HVAC plant. In the authors’ opinion, modifying the thermal transmittance on the external walls, roofs and windows in order to have a different optimum passive design of the building in Belluno’s climate would introduce a further degree of freedom in this study that would complicate the study itself. Finally, as the building utilization is for offices and teaching rooms, the daily domestic hot water demand is very small, and can be considered satisfied by means of electric resistances (not considered in this study).
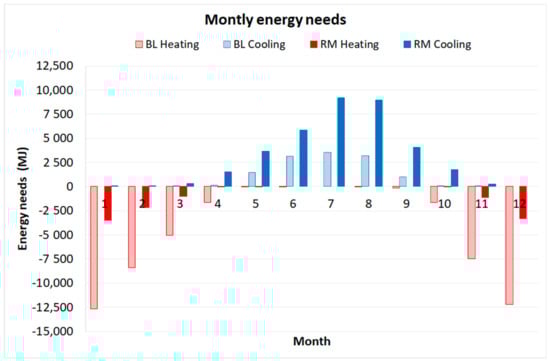
Figure 2.
Heating and cooling monthly energy needs for Rome (RM) and Belluno (BL).
2.1.2. Heating and Cooling Plant Model
The plant is represented in Figure 3, with the various components connected by suitable storage tanks. The original feature of the HVAC plant is the solar section composed by ETCs driving a thermally driven absorption heat pump, and an unglazed PVT field that produces electrical and thermal energy. Both the PVT and the ETC provide direct heating when possible (by HEX1 and HEX2 respectively), or act as heat pump cold sources (HEX3 and HEX4).
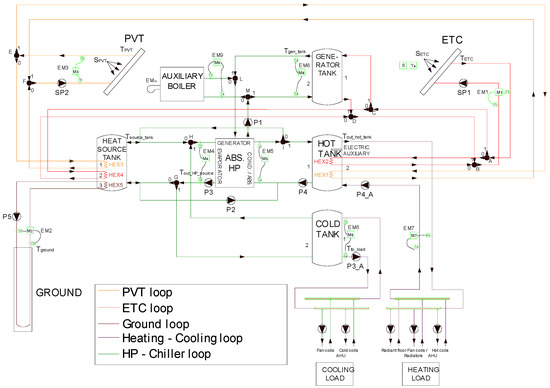
Figure 3.
Simplified functional diagram of the heating and cooling plant.
The plant is set up by five main loops:
- PVT loop: this includes the cooling circuit of PVT modules. As a matter of fact, thermal energy from PVT can be used to produce hot water for heating in the Hot Tank (HEX1) or, if available at lower temperature, to act as heat source of the heat pump in the Heat Source Tank (HEX3). The excess heat by PVT (mainly in summer) recharges the ground by means of HEX5;
- ETC loop: hot water from collectors is used for direct heating in the Hot Tank (HEX2) or to drive the heat pump (Generator Tank) following the control logic described in the next section;
- Ground loop: this allows the temperature inside the Heat Source Tank to be maintained between the suitable range (2–20 °C) to act as the heat source of the heat pump;
- Heating-Cooling loop: the circuit allows the Hot Tank to satisfy the heating loads, and the Cold Tank to satisfy the cooling loads;
- Heat Pump-Chiller loop: heating load is satisfied by the Hot Tank. It receives heat by the heat pump condenser, whereas the heat pump evaporator is fed by the Heat Source Tank alimented either by the ground or by the PVT (HEX3) or by the ETC (HEX4) as cold source. The Cold Tank faces the cooling load. It is cooled by the heat pump evaporator, whereas useful heat for heating can be provided by the heat pump condenser. In the summertime, the ground is utilized to receive excess heat from the solar fields (PVT and ETC) or the heat pump condenser; thus, the ground is recharged, and the PVT is maintained at an acceptable temperature.
The control logic of the plant is based on an operation threshold between 50 and 100 W m−2 of solar radiation intensity (S), and a comparison between the various suitable tanks set-points and the available temperatures in the different circuits (Figure 3). Moreover, the basement is supplied by fan-coil units only, whereas the other two floors are supplied by both radiant floors and fan-coils.
2.1.3. Modelling of the Main Equipment
The unglazed PVT collector is modelled in Trnsys by type 50c, that is derived by type 1 modelling solar thermal collector based on the Hottel-Whillier equation. The main geometrical, constructive, electrical and thermal characteristics determine the thermal and electrical performance of the PVT (Table 1, data refer to a real unglazed PVT module available on the market). The ETC considered is a modern collector available on the market, with a very low first order heat loss coefficient. It is modelled by type 71, the main technical features of which are reported in Table 1 and Table 2. Both PVT and ETC are supposed to have a tilt of 30° and an azimuth of 0°.

Table 1.
Main parameters of the commercial unglazed Photovoltaic/Thermal (PVT) and evacuated tube collector.
Table 2.
Incident Angle Modifier of the evacuated tube collector.
The ground is modelled by type 557a with storage heat capacity of 2016 kJ m−3 K−1 and ground thermal conductivity of 2.87 W m−1 K−1. It is composed of a row of 2 × 100 m vertical tube U heat exchangers, with outer diameter of 32 mm and thickness of 2.9 mm, distance 6 m. Type 4a (Generator Tank, Cold Tank) and type 60d (Heat Source Tank, Hot Tank) are used to model the tanks.
In Trnsys, no specific type is available for modelling a thermally driven heat pump; for this reason, type 927 is used to model the water-water heat pump based on nominal data from a manufacturer concerning thermal power, cooling power and thermal power consumption at various heat source and sink temperatures (Figure 4 and Figure 5). As described in the next section, such temperatures have been considered to vary within useful ranges according to source and sink temperatures (respectively 2 ≤ Tsource_tank ≤ 20 °C and Hot Tank or Heat Source Tank max 40 °C), and generator temperature (75–95 °C). The capacity of the heat pump has been fixed on the basis of peak heating and cooling thermal load calculation, as previously reported.
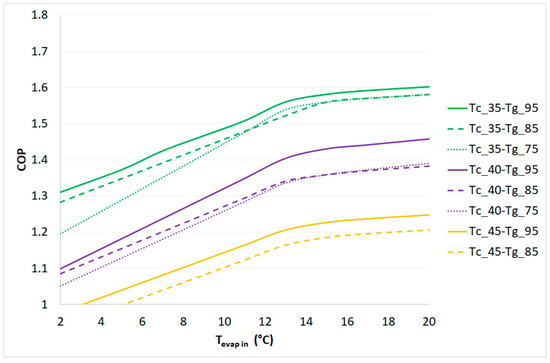
Figure 4.
Coefficient of Performance of a commercial thermally driven W/W absorption heat pump/chiller in function of outlet absorber/condenser (Tc), inlet evaporator (Tevap in) and inlet generator (Tg) temperature.
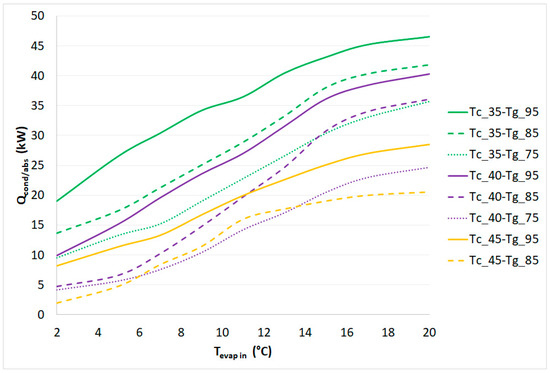
Figure 5.
Useful thermal power of a commercial thermally driven W/W absorption heat pump/chiller in the function of an outlet absorber/condenser (Tc), inlet evaporator (Tevap in) and inlet generator (Tg) temperature.
2.2. Plant Control Logic
In this section, the control strategy of the main equipment of the plant is described.
2.2.1. ETC
The reduced temperature (Tred) is defined as a function of the mean temperature of the water entering and leaving the collector (Tm), air temperature (Ta), and global solar radiation on the tilted surface SETC (Equation (1)):
Tred = (Tm − Ta)/SETC
During the heating season, operation of the ETC field is based on the useful thermal energy producible by the plant in correspondence with two values of the reduced temperature (with Tred1 > Tred2). Tred1 is calculated in function of the return temperature from the Generator Tank, whereas Tred2 in function of the return temperature from the Hot Tank. In correspondence with these two values, thermal efficiency as defined in Equation (2) is calculated as:
where η0, a1 and a2 are constants (Table 1). The useful thermal energy producible by the plant in the two cases has been then determined (where COPHP is the Coefficient of Performance of the heat pump, HP):
ηth,ETC = η0 − a1 Tred − a2 SETC Tred2
- Qus,1=ηth,ETC,1SETC COPHP → indirect heating by HP).
- Qus,2=ηth,ETC,2SETC → (direct heating by ETC).
The ETC field is operated on the basis of which Qus is greater:
- Qus,1 > Qus,2 → ETC field feeds the Generator Tank (valves in Figure 3 A = B = C = D = 1) (indirect heating by HP).
- Qus,1 < Qus,2 → ETC field feeds the Hot Tank (A = B = 0) (direct heating by ETC).
If Tred < Tred2 the ETC field feeds the Heat Source Tank (A = B = 1, C = D = 0).
During the cooling season, A = B = 1 in any case (no direct heating as there are no heating loads). The ETC operation is based on the Generator Tank outlet temperature: if Tgen_tank < 95 °C, hot water from ETC is supplied to the Generator Tank to feed the absorption HP generator (C = D = 1); if Tgen_tank > 95 °C, hot water from ETC is supplied to the Heat Source Tank to regenerate the ground (C = D = 0).
2.2.2. PVT
During the heating season, the PVT operation is based on the temperature difference between outlet water from the modules and outlet water from the Hot Tank:
- TPVT − Tout_hot_tank > 5 °C → PVT field feeds the Hot Tank (direct heating, E = F = 1).
- TPVT − Tout_hot_tank < 2 °C → PVT field feeds the Heat Source Tank (heat source of the HP or ground regeneration, E = F = 0).
During the cooling season, E = F = 0 in any case.
2.2.3. Thermally Driven HP/Chiller
During the heating season, the operation strategy of HP is based on the Hot Tank outlet temperature (COOLING_LOADS = 0 AND Tout_hot_tank < 40 °C). Instead, during the cooling season, it is based on the Cold Tank outlet temperature (COOLING_LOADS > 0 AND Tto_load > 12 °C). In the first case, the operation is the same as heat pump: the absorber/condenser heats up the Hot Tank, the evaporator is fed by the Heat Source Tank. In the second case, the equipment can operate as a chiller (the evaporator cools down the Cold Tank) with heat recovery (if Tout_hot_tank < 38 °C the absorber/condenser is connected to the Hot Tank), or without heat recovery (if Tout_hot_tank > 40 °C the absorber/condenser is connected to the Heat Source Tank). Table 3 reports the outlet of valves and the status of pumps for the three main operation modes of the thermally driven equipment.
Table 3.
Status of pumps and valves control variables for the heat pump (HP)-Chiller loop (refer to Figure 3).
When the HP/Chiller is in operation, its generator has to be fed by hot water. This is produced by the Generator Tank if Tgen_tank > 75 °C (L = M = 1), or by an Auxiliary Boiler (efficiency supposed constant and equal to 1) if Tgen_tank < 75 °C (L = M = 0).
2.2.4. Generator Tank
The temperature Tgen_tank is maintained in a useful range (75–95 °C). When Tgen_tank > 95 °C, hot water from ETC field supplies the Hot Tank (A = B = 0) or, if the latter is already satisfied, the Heat Source Tank (A = B = 1, C = D = 0). When Tgen_tank < 75 °C, the Auxiliary Boiler turns on (L = M = 0).
2.2.5. Heat Source Tank
The temperature Tsource_tank is maintained in a useful range (2–20 °C). When Tsource_tank > 20 °C, P5 pump turns on, and the ground is used as heat sink for heat produced by ETC or PVT or HP. When Tsource_tank < 2 °C, P5 turns on, the ground is used as a heat source for the HP.
2.3. Energy Performance Indices
On the basis of the energy flows of the plant available from the simulations, energy performance is evaluated by different indices (Table 4).
Table 4.
Energy performance indices.
ETC area and Generator Tank capacity are designed by means of a system energy performance evaluation. The length of the ground probes is maintained at 2 × 100 m, even if it could be reduced when increasing the solar field because the contribution of the solar energy is greater both in electric and thermal energy [20,24,25]. As this is an economic issue, no variation on the ground probes is considered in this study that is based on an energy analysis. Furthermore, the capacities of the Hot Tank and the Heat Source Tank are fixed at 0.8 and 1.5 m3 respectively for both the resorts, whereas the Cold Tank capacity is fixed at 0.75 m3 for Belluno and 1 m3 for Rome. For Belluno, the PVT area is kept constant at 40 m2, a size that allows us to fully cover the electricity self-consumption of the plant. Table 5 reports even the suitable size of tanks for the eight and six alternatives considered for Belluno and Rome respectively.
Table 5.
Size of the solar Evacuated Tube Collectors (ETC) and PVT fields and of the Generator tank for the alternatives considered.
3. Results and Discussion
In next sections, monthly energy performance results for Belluno are illustrated for the most favorable alternative (Section 3.1). The alternative considers 60 m2 ETC, 40 m2 PVT and 4 m3 Generator Tank capacity. The results are reported by means of energy balances for the main plant sections. Subsequently, a comparison between the different alternatives in terms of annual energy results is reported, even considering the Rome climate (Section 3.2.).
3.1. Monthly Energy Balances of the Preferred Alternative
Figure 6 and Figure 7 report the solar energy balance for the ETC and PVT sections respectively. The positive input (solar radiation) is divided into four negative outputs:
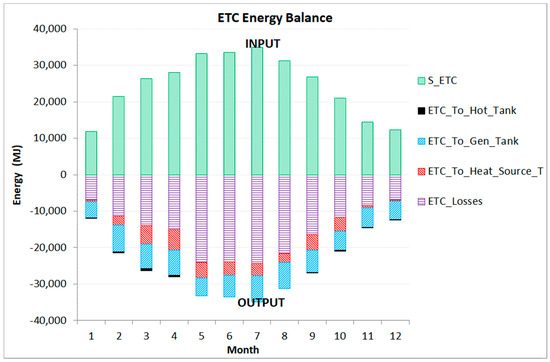
Figure 6.
Monthly ETC solar energy balance (BL).
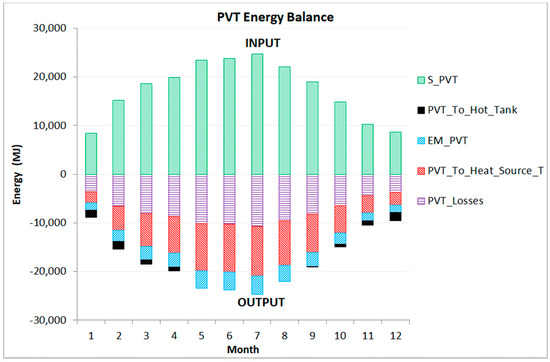
Figure 7.
Monthly PVT solar energy balance (BL).
- Thermal losses;
- Electric energy (PVT) or thermal energy to Generator Tank to drive the heat pump (ETC);
- Contribution as heat pump heat source or ground recharging (Heat Source Tank);
- Thermal energy to the Hot Tank for direct heating.
Even if thermal losses generally exceed the other items, during the heating season a good contribution is offered by ETC and, above all, by PVT as heat pump cold source (red oblique lines in Figure 6 and Figure 7). For example, 2274 MJ are available for the heat pump by PVT in the most unfavorable month (January). In the same period, 1424 MJ (396 kWh) of electricity is produced, and thermal losses are estimated at 3663 MJ. A significant quota (1488 MJ) is used for direct heating. In July, the produced electricity is of 3782 MJ (1050 kWh), with 10,260 MJ of thermal energy to ground recharging (there is not necessity of direct heating). In July, the overall useful energy supplied by PVT is greater than the heat losses, with an overall monthly efficiency of 56.8% (electrical efficiency 15.3%, thermal efficiency 41.5%). Due to the control logic before described, ETC’s main contribution is directed to the Generator Tank to drive the thermally driven HP, whereas the contribution to direct heating is not as significant.
The PVT field contributes s Please check and correct the ref number here.ignificantly to the heating needs of the building. As depicted in Figure 8, PVT satisfies between 11% and 50% of the heating demand for the whole period from September to April; the negative component of the balance is the heating load plus a small heat amount due to Hot Tank thermal losses. Instead, the complementary part is almost fully provided by the heat pump.
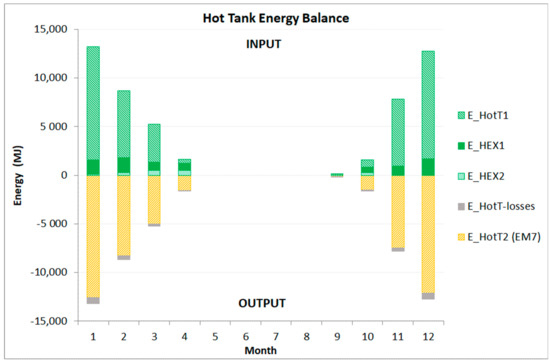
Figure 8.
Monthly Hot Tank energy balance (BL).
As far as the heat pump behavior is concerned, Figure 9 reports the energy balance. It operates all year to satisfy the heating and cooling loads of the building. In heat pump operation mode (during colder months) the heat sink (useful effect) is the Hot Tank, and the cold source is the Heat Source Tank. The thermal energy supplied to the generator is faced by a large quota by the ETC field by means of the Generator Tank (38% in the worst case, January, 100% in the best case, April, September, October). In chiller operation mode, the equipment produces the useful effect at the Cold Tank, and it supplies the condensation heat either to the Hot Tank (useful heat recovery for the limited heat loads in mid-season) or to the Heat Source Tank.
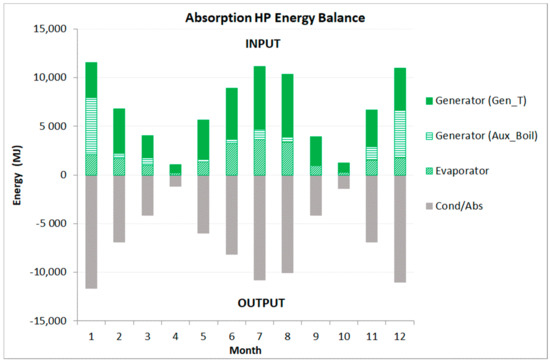
Figure 9.
Monthly HP/Chiller energy balance (BL).
A further insight is allowed by the balance of the Heat Source Tank. Three positive contributions feed this tank during the cold months: from the ground, the ETC and the PVT. The first two components are not very significant (Figure 10), whereas energy from the PVT can be found entirely to the heat pump evaporator (Figure 9). During the other months, the heat pump condenser releases to this tank the energy not requested by the heating. Even if some output energy of the tank is supplied to the heat pump evaporator for short periods of the month, the output is mainly towards the ground.
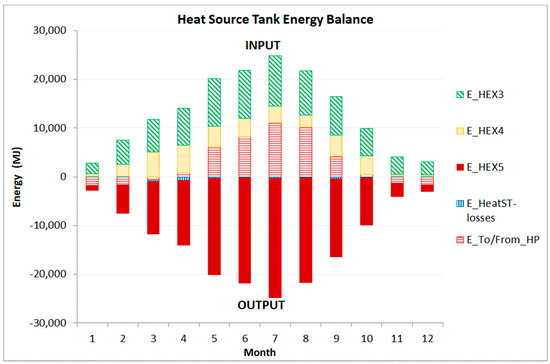
Figure 10.
Monthly Heat Source Tank energy balance (BL).
PVT electric efficiency ranges between 14.4% (April) and 16.9% (January) (Figure 11). A suitable PV cells cooling is allowed by the plant, as during many months electrical efficiency is greater than the nominal value (16% in peak condition) because the PVT is unglazed. ETCs thermal efficiency is higher during heating season with respect to cooling season, due to the better exploitation of solar energy in relative terms. Such reasoning could lead to the consideration of reducing the ETC field area in order to reduce the heat losses quota during the cooling season. As a matter of fact, the comparative analysis reported in Section 3.2. shows that this would not be advantageous from the whole plant energy performance point of view. Besides the efficiency parameters of the solar fields, Figure 11 illustrates the efficiency indices of the heat pump as well (COP for the heat pump operation, EER for the chiller operation).
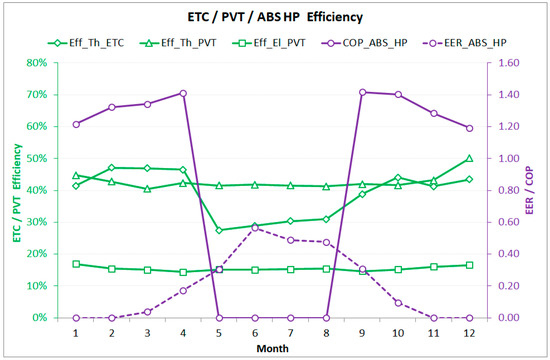
Figure 11.
Monthly ETC, PVT, HP/Chiller efficiency indices (BL).
The PVT field produces electricity that is firstly used to supply the components of the plant (pumps) (Figure 12) and, secondly, can be exported towards the grid or is available for the other uses of the building (lighting, electric appliances, etc.). The HVAC plant is electricity self-sufficient on a yearly basis; only in January and December can a relatively balanced situation be observed.
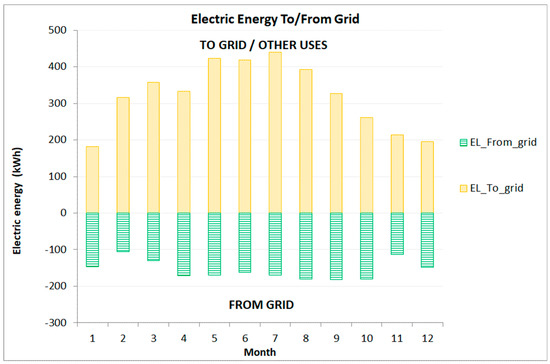
Figure 12.
Monthly electricity balance (production by PVT and withdrawn from the grid) (BL).
3.2. Energy Comparison of Different Alternatives and with a Conventional System
The different combinations of ETC and PVT area and Generator Tank capacity as reported in Table 5 are compared in Figure 13 on a yearly basis in terms of net no-renewable primary energy consumption EPannual for Belluno resort. This is also divided into the two contributions for heating and cooling seasons, each with the counterpart of a traditional solution (A/W HP/Chiller with monthly mean efficiency index reported in Table 6). The yearly primary energy ratio (PERplant,nren) is reported as well. It is calculated on the basis of the net no-renewable primary energy consumption of the whole plant: as reported in Table 4, the term “net” means that Auxiliary Boiler and parasitic power of pumps are taken into account, as well as the positive contribution of the electricity produced by the PVT field in excess with respect to the auxiliaries’ consumption. The primary energy factors are the ones defined in Table 4 (fP,nren (NG) = 1.05; fP,nren (electricity from the grid) = 1.95)); the traditional plant is considered to use the same pumps of the proposed one (except for the solar and the geothermal pumps).
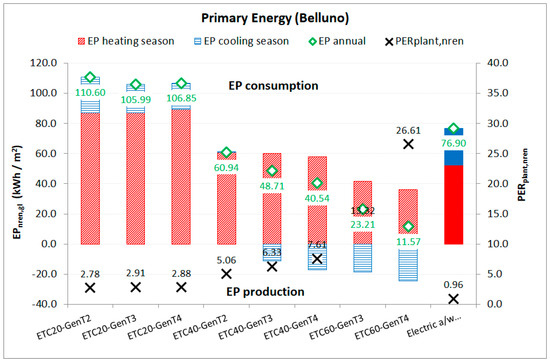
Figure 13.
Comparison between different alternatives compared with the conventional one, on the base of annual net no-renewable primary energy consumption (EPnren,gl) and primary energy ratio (PERplant,nren) for BL.
Table 6.
Monthly average values of the COP/EER for the HP/chiller of the “traditional solution”.
Looking at the climate of Belluno (Figure 13), the increase of the ETCs area decreases the net no-renewable primary energy consumption of the plant both during the heating season (red bars) and cooling season (blue bars). As a matter of fact, increasing the ETCs area is beneficial because EPannual (green rhombus) decreases. Is not surprising that primary energy can become negative: it means that there is a “production”—this is the constant quota due to the PVT electricity production that over-compensates the electricity consumption of pumps—that is greater than the consumption in relative terms because the increased ETCs area produces more thermal energy for driving the HP/Chiller, thus reducing the NG consumption of the Auxiliary Boiler. Increasing the capacity of Generator Tank has a similar effect, i.e., the plant EPannual decreases. When EPannual decreases, PERplant,nren increases. PERplant,nren is particularly high during heating season for the efficient utilization of the solar heat both directly (HEX1 and HEX2 in Hot Tank) and indirectly by the HP (Generator Tank as driving and Heat Source Tank as heat source energy).
Figure 13 also shows that for the BL climate it is not advantageous to have only 20 m2 of ETC field, as in this case EPannual would be greater than the traditional solution. The best solution appears to be ETC60-GenT4 (60 m2 ETC, 40 m2 PVT, 4000 L Generator Tank), with an EPannual of 11.6 kWh m−2 year−1 and a PERplant,nren equal to 26.6.
For a hotter resort with greater clearness index, like Rome, the effects of increased ETCs area and Generator Tank capacity are even more apparent (Figure 14). In this case, the effects of varying the PVT field area are investigated as well. The ETC20-PVT20-GenT3 (20 m2 ETC, 20 m2 PVT, 3000 L GenT capacity) has a greater primary energy consumption of the traditional solution (respectively 216 and 70.7 kWh m−2 year−1), and doubling the PVT area brings a great positive effect by reducing the EPannual to 44.8 kWh m−2 year−1 (lower than the conventional solution). For Rome, Figure 14 shows that the best solution is 25 m2 ETC, 40 m2 PVT, 3000 L GenT capacity (EPannual of 11.5 kWh m−2 year−1 and PERplant,nren equal to 20): a further increase of ETCs field area or GenT capacity would bring negative annual values of EPannual and PERplant,nren (the latter is not represented in Figure 14), which probably would not be sustainable from the economic point of view. As a matter of fact, plant energy performance in Rome is similar to that in Belluno (EPannual around 11.5 kWh m−2 year−1) obtained by less than half ETCs area and ¾ GenT capacity.
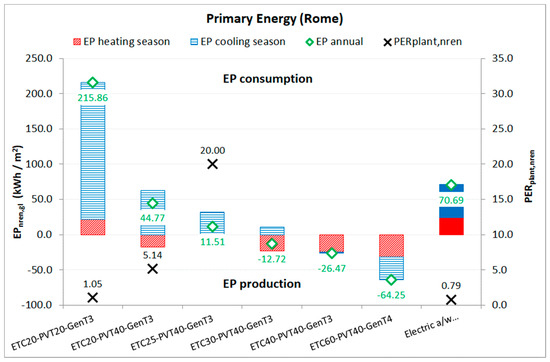
Figure 14.
Comparison between different alternatives compared with the conventional one, on the base of annual net no-renewable primary energy consumption (EPnren,gl) and primary energy ratio (PERplant,nren) for RM.
4. Conclusions
The use of modern high efficiency ETCs coupled with PVT technology is a viable solution for high energy performance solar heating and cooling systems. Such a plant configuration allows a meaningful annual utilization of solar energy by thermally driven heat pumps, and high reduction of utilization of electricity from the grid in the case of a more traditional electric vapor compression heat pump. The plant designed in this study for an existing building features a very good annual energy performance thanks to its configuration that exploits different technologically clever devices: the ETCs thermal efficiency has increased and PVT has seen a cost reduction over the last years, and there is a possibility of preventing the overheating of PVT modules by a multi-source heat pump combination. The case study here considered two different climates, allowing us to understand the reasoning behind the optimum sizing strategies and annual utilization of the equipment in multi-source (ground + unglazed PVT + ETC) thermally driven (by ETC) heat pump/chiller. Furthermore, due to the simultaneous presence of heating and cooling loads, a useful decoupling of the heat sources from the heat pump is allowed by a suitable disposition of storage tanks.
The design of the plant considers different alternatives by increasing the solar ETC field (20–40–60 m2), the PVT field (20–40 m2) and the Generator Tank capacity (2–3–4 m3), compared to a traditional solution (air/water HP/chiller). The dynamic simulations by Trnsys reveal that the most efficient solution (highest PERplant,nren, lowest EPgl,nren) features less than half of the ETC field area and 3/4 GenT capacity in hot and high clearness index resorts with respect to other resorts under the same conditions of net no-renewable primary energy consumption. The designed plant is self-sufficient for the electricity on a yearly basis; moreover, it can export electricity to other uses of the building (laboratory equipment, computers, lighting and so on) or to the grid.
As increasing the solar fields to a certain extent permits us to reduce the ground field extension with lower costs, a possible extension of this study would be an economic analysis in order to evaluate the optimum economic sizing of this kind of configuration of solar heating and cooling plant.
Author Contributions
Conceptualization, M.N. and R.L.; methodology, M.N. and R.L.; software, M.N.; validation, M.N. and R.L.; writing—original draft preparation, M.N.; writing—review and editing, M.N. and R.L.; funding acquisition, M.N. All authors have read and agreed to the published version of the manuscript.
Funding
This research project was partially funded by: MIUR, Italy, PRIN 2017: “The energy FLEXibility of enhanced HEAT pumps for the next generation of sustainable buildings (FLEXHEAT)” (grant number 2017KAAECT).
Conflicts of Interest
The authors declare no conflict of interest.
References
- Santamouris, M.; Kolokotsa, D. Passive cooling dissipation techniques for buildings and other structures: The state of the art. Energy Build. 2013, 57, 74–94. [Google Scholar] [CrossRef]
- Directive 2010/31/EU of the European Parliament and of the Council of 19 May 2010 on the Energy Performance of Buildings. Available online: http://data.europa.eu/eli/dir/2010/31/oj (accessed on 13 July 2020).
- Lazzarin, R.; Noro, M. Past, present, future of solar cooling: Technical and economical considerations. Sol. Energy 2018, 172, 2–13. [Google Scholar] [CrossRef]
- Lazzarin, R. Heat pumps and solar energy: A review with some insights in the future. Int. J. Refrig. 2020, 116, 146–160. [Google Scholar] [CrossRef]
- International Energy Agency. Solar Cooling Position Paper, Task 38 Solar Air-Conditioning Refrigeration; Solar Heating and Cooling Program. 2011. Available online: http://www.task6.iea-shc.org/data/sites/1/publications/IEA-SHC-Solar-Cooling-Position-Paper.pdf (accessed on 13 July 2020).
- Nakahara, N.; Miyakawa, Y.; Yamamoto, M. Experimental study on house cooling and heating with solar energy using flat plate collector. Sol. Energy 1977, 19, 657–662. [Google Scholar] [CrossRef]
- Lazzarin, R. Steady and transient behaviour of LiBr absorption chillers of low capacity. Int. J. Refrig. 1980, 4, 213–218. [Google Scholar] [CrossRef]
- Cabrera, F.J.; Fernàndez-Garcìa, A.; Silva, R.M.P.; Pérez-Garcìa, M. Use of parabolic trough collectors for solar refrigeration and air-conditioning applications. Renew. Sustain. Energy Rev. 2013, 20, 103–118. [Google Scholar] [CrossRef]
- Fernandez-Garcia, A.; Zarza, E.; Valenzuela, L.; Perez, M. Parabolic-trough solar collectors and their applications. Renew. Sustain. Energy Rev. 2010, 14, 1695–1721. [Google Scholar] [CrossRef]
- Al-Alili, A.; Hwang, Y.; Radermacher, R. Review of solar thermal air conditioning technologies. Int. J. Refrig. 2014, 39, 4–22. [Google Scholar] [CrossRef]
- Kim, D.S.; Infante Ferreira, C.A. Solar refrigeration options—A state-of-the-art review. Int. J. Refrig. 2008, 31, 3–15. [Google Scholar] [CrossRef]
- Aliane, A.; Abboudi, S.; Seladji, C.; Guendouz, B. An illustrated review on solar absorption cooling experimental studies. Renew. Sustain. Energy Rev. 2016, 65, 443–458. [Google Scholar] [CrossRef]
- Wu, W.; Wang, B.; You, T.; Shi, W.; Li, X. Configurations of solar air source absorption heat pump and comparisons with conventional solar heating. Appl. Therm. Eng. 2018, 141, 630–641. [Google Scholar] [CrossRef]
- Alahmer, A.; Ajib, S. Solar cooling technologies: State of art and perspectives. Energy Convers. Manag. 2020, 214, 112896. [Google Scholar] [CrossRef]
- Duffie, J.A.; Beckman, W.A. Solar Engineering of Thermal Processes; John Wiley & Sons, Inc.: Hoboken, NJ, USA, 2013; p. 910. [Google Scholar]
- Zambolin, E.; del Col, D. Experimental analysis of thermal performance of flat plate and evacuated tube solar collectors in stationary standard and daily conditions. Sol. Energy 2010, 84, 1382–1396. [Google Scholar] [CrossRef]
- Makki, A.; Omer, S.; Sabir, H. Advancements in hybrid photovoltaic systems for enhanced solar cells performance. Renew. Sustain. Energy Rev. 2015, 41, 658–684. [Google Scholar] [CrossRef]
- Daghigh, R.; Ruslan, M.H.; Sopian, K. Advances in liquid based photovoltaic/thermal (PV/T) collectors. Renew. Sustain. Energy Rev. 2011, 15, 4156–4170. [Google Scholar] [CrossRef]
- Busato, F.; Lazzarin, R.; Noro, M. Experimental analysis of photovoltaic cogeneration modules. Int. J. Low Carbon Technol. 2008, 3, 221–244. [Google Scholar] [CrossRef]
- Lazzarin, R.; Noro, M. Photovoltaic/Thermal (PV/T)/ground dual source heat pump: Optimum energy and economic sizing based on performance analysis. Energ. Build. 2020, 211, 109800. [Google Scholar] [CrossRef]
- Klein, S.A.; Beckman, W.A.; Mitchell, J.W.; Duffie, J.A.; Duffie, N.A.; Freeman, T.L.; Mitchell, J.C.; Braun, J.E.; Evans, B.L.; Kummer, J.P.; et al. TRNSYS 17: A Transient System Simulation Program; Solar Energy Laboratory, University of Wisconsin: Madison, WI, USA, 2010. Available online: http://sel.me.wisc.edu/trnsys (accessed on 14 December 2019).
- Noro, M.; Lazzarin, R.; Busato, F. Solar cooling and heating plants: An energy and economic analysis of liquid sensible vs phase change material (PCM) heat storage. Int. J. Refrig. 2014, 39, 104–116. [Google Scholar] [CrossRef]
- EN ISO 15927-4:2005. Hygrothermal Performance of Buildings—Calculation and Presentation of Climatic Data—Part 4: Hourly Data for Assessing the Annual Energy Use for Heating and Cooling; International Organization for Standardization: Geneva, Switzerland, 2005. [Google Scholar]
- Busato, F.; Lazzarin, R.; Noro, M. Ground or solar source heat pump systems for space heating: Which is better? Energetic assessment based on a case history. Energy Build. 2015, 102, 347–356. [Google Scholar] [CrossRef]
- Lazzarin, R.; Noro, M. Lessons learned from long term monitoring of a multisource heat pump system. Energy Build. 2018, 174, 335–346. [Google Scholar] [CrossRef]
© 2020 by the authors. Licensee MDPI, Basel, Switzerland. This article is an open access article distributed under the terms and conditions of the Creative Commons Attribution (CC BY) license (http://creativecommons.org/licenses/by/4.0/).