
Potentials and Limits of Photovoltaic Systems Integration in Historic Urban Structures: The Case Study of Monument Reserve in Bratislava, Slovakia


Abstract
1. Introduction
1.1. Global Approach to Energy-Efficient Retrofitting of Historic Buildings in the Context of Cultural Sustainability
- (i)
- Elaboration of the energy model of the building (i.e., with Energy Plus), considering the current status of the structure, both in terms of architectural and technical elements;
- (ii)
- Simulation of the year-round energy performance of the building in terms of heating and cooling primary energy requirements before the energy retrofit;
- (iii)
- Proposition of a new integrated configuration of the energy systems, considering all the architectural and technical constraints due to the historical value of the pilot case study building.
1.2. Scope
2. Framework
2.1. Review of the Current State-of-Art and Valid Legislation Framework in Bratislava, Slovakia
2.2. Principles and Recommendations Applicable
3. Materials and Methods
3.1. Study Area
3.2. Classification of Roof Plane Polygons
4. Results
4.1. Pitched Roofs
4.2. Flat Roofs
4.3. Identification of Suitable RPs for PV Integration
- (i)
- The threshold of annual irradiance of RPs (AM–PI) AI calculated as the lower bound of 50% probability interval (PI). It meant that 75% or RPs in a particular group reached a higher and 25% a lower values of annual irradiance than this threshold;
- (ii)
- Sum of the area of all RPs within the group (Σ RPs);
- (iii)
- Sum of the annual irradiance of all RPs within the group (Σ RPs AI).
4.4. Scenarios Calculation
5. Discussion and Conclusions
Author Contributions
Funding
Institutional Review Board Statement
Informed Consent Statement
Data Availability Statement
Conflicts of Interest
Appendix A

| Category/Group | Group A-I. (1st 20%) (Azimuth 70°) | Group A-II. (1st 20%) (Azimuth 160°) | Group A-III. (1st 20%) (Azimuth 250°) | Group A-IV. (1st 20%) (Azimuth 340°) | |||||
|---|---|---|---|---|---|---|---|---|---|
| PI | PI | PI | PI | ||||||
| A–ALL | RPs count | 163.0 | 161.0 | 165.0 | 150.0 | ||||
| AM NVA (°) | 71.2 | 14.8 | 161.7 | 13.8 | 255.3 | 15.1 | 340.1 | 15.1 | |
| AM RPs slope (°) | 43.4 | 11.7 | 43.5 | 14.0 | 44.4 | 14.4 | 43.0 | 13.3 | |
| Σ RPs area (m²) | 1083.6 | 1462.4 | 1257.9 | 842.6 | |||||
| AM RPs area (m²) | 7.1 | 1.0 | 7.3 | 1.1 | 7.2 | 1.0 | 7.3 | 1.0 | |
| Σ RPs AI (MWh) | 1083.6 | 1462.4 | 1257.9 | 842.6 | |||||
| AM RPs AI (kWh/m²) | 936.7 | 304.8 | 1241.9 | 402.4 | 1059.1 | 369.7 | 761.2 | 258.4 | |
| B–IC | RPs count | 57.0 | 61.0 | 63.0 | 60.0 | ||||
| AM NVA (°) | 73.1 | 12.7 | 163.0 | 11.5 | 255.9 | 14.4 | 341.5 | 15.6 | |
| AM RPs slope (°) | 40.5 | 13.0 | 45.9 | 15.3 | 47.0 | 16.6 | 41.3 | 13.9 | |
| Σ RPs area (m²) | 410.8 | 448.7 | 444.1 | 436.3 | |||||
| AM RPs area (m²) | 7.2 | 1.1 | 7.4 | 1.2 | 7.0 | 1.0 | 7.3 | 1.1 | |
| Σ RPs AI (MWh) | 402.9 | 526.0 | 433.3 | 343.0 | |||||
| AM RPs AI (kWh/m²) | 1003.8 | 337.9 | 1174.7 | 456.1 | 982.1 | 390.2 | 763.9 | 250.2 | |
| C–OTHER | RPs count | 106.0 | 100.0 | 102.0 | 90.0 | ||||
| AM NVA (°) | 70.2 | 15.8 | 160.9 | 15.1 | 255.0 | 15.6 | 339.2 | 14.8 | |
| AM RPs slope (°) | 44.9 | 10.9 | 42.1 | 13.2 | 42.7 | 12.8 | 44.1 | 12.8 | |
| Σ RPs area (m²) | 757.2 | 727.2 | 748.5 | 664.2 | |||||
| AM RPs area (m²) | 7.1 | 1.0 | 7.3 | 1.0 | 7.3 | 1.0 | 7.4 | 1.0 | |
| Σ RPs AI (MWh) | 680.7 | 936.3 | 824.6 | 499.6 | |||||
| AM RPs AI (kWh/m²) | 900.6 | 284.1 | 1282.8 | 365.5 | 1106.7 | 354.5 | 759.4 | 265.1 | |
| Category/Group | Group B-I. (2nd 20%) (Azimuth 70°) | Group B-II. (2nd 20%) (Azimuth 160°) | Group B-III. (2nd 20%) (Azimuth 250°) | Group B-IV. (2nd 20%) (Azimuth 340°) | |||||
|---|---|---|---|---|---|---|---|---|---|
| PI | PI | PI | PI | ||||||
| A–ALL | RPs count | 186.0 | 151.0 | 168.0 | 177.0 | ||||
| AM NVA (°) | 74.4 | 13.8 | 163.3 | 14.1 | 254.8 | 13.4 | 341.9 | 14.4 | |
| AM RPs slope (°) | 43.6 | 12.4 | 41.7 | 13.2 | 44.2 | 12.2 | 43.9 | 12.4 | |
| Σ RPs area (m²) | 2833.1 | 2345.8 | 2536.4 | 2702.9 | |||||
| AM RPs area (m²) | 15.2 | 2.4 | 15.5 | 2.2 | 15.1 | 2.2 | 15.3 | 2.2 | |
| Σ RPs AI (MWh) | 2587.9 | 3264.2 | 2777.2 | 1841.8 | |||||
| AM RPs AI (kWh/m²) | 907.6 | 305.6 | 1371.1 | 353.3 | 1098.7 | 326.6 | 684.4 | 232.0 | |
| B–IC | RPs count | 78.0 | 68.0 | 77.0 | 68.0 | ||||
| AM NVA (°) | 74.6 | 13.7 | 164.1 | 15.4 | 255.1 | 13.1 | 342.4 | 13.9 | |
| AM RPs slope (°) | 37.3 | 10.9 | 38.8 | 12.9 | 43.0 | 13.4 | 39.0 | 11.1 | |
| Σ RPs area (m²) | 1155.5 | 1056.8 | 1167.2 | 1016.8 | |||||
| AM RPs area (m²) | 14.8 | 2.3 | 15.5 | 2.0 | 15.2 | 2.3 | 15.0 | 2.3 | |
| Σ RPs AI (MWh) | 1088.4 | 1506.4 | 1270.4 | 739.3 | |||||
| AM RPs AI (kWh/m²) | 936.2 | 280.7 | 1404.5 | 347.1 | 1097.5 | 362.6 | 729.8 | 208.4 | |
| C–OTHER | RPs count | 108.0 | 83.0 | 91.0 | 109.0 | ||||
| AM NVA (°) | 74.3 | 14.0 | 162.8 | 13.1 | 254.5 | 13.7 | 341.5 | 14.7 | |
| AM RPs slope (°) | 48.1 | 12.6 | 44.1 | 13.2 | 45.2 | 11.1 | 47.0 | 12.7 | |
| Σ RPs area (m²) | 1677.6 | 1288.9 | 1369.2 | 1686.1 | |||||
| AM RPs area (m²) | 15.5 | 2.4 | 15.5 | 2.3 | 15.0 | 2.1 | 15.5 | 2.1 | |
| Σ RPs AI (MWh) | 1499.5 | 1757.8 | 1506.8 | 1102.6 | |||||
| AM RPs AI (kWh/m²) | 887.0 | 323.0 | 1343.8 | 359.4 | 1099.8 | 294.9 | 656.1 | 244.6 | |
| Category/Group | Group C-I. (3rd 20%) (Azimuth 70°) | Group C-II. (3rd 20%) (Azimuth 160°) | Group C-III. (3rd 20%) (Azimuth 250°) | Group C-IV. (3rd 20%) (Azimuth 340°) | |||||
|---|---|---|---|---|---|---|---|---|---|
| PI | PI | PI | PI | ||||||
| A–ALL | RPs count | 158.0 | 178.0 | 167.0 | 174.0 | ||||
| AM NVA (°) | 72.8 | 13.8 | 163.5 | 13.9 | 253.1 | 15.6 | 343.6 | 12.4 | |
| AM RPs slope (°) | 41.1 | 11.1 | 41.8 | 11.3 | 40.7 | 11.2 | 44.4 | 13.3 | |
| Σ RPs area (m²) | 4860.0 | 5437.3 | 5099.2 | 5256.5 | |||||
| AM RPs area (m²) | 30.8 | 4.0 | 30.5 | 4.1 | 30.5 | 3.9 | 30.2 | 3.8 | |
| Σ RPs AI (MWh) | 4537.8 | 7273.7 | 5976.9 | 3628.5 | |||||
| AM RPs AI (kWh/m²) | 929.4 | 284.2 | 1330.7 | 343.1 | 1163.4 | 302.9 | 692.2 | 256.6 | |
| B–IC | RPs count | 76.0 | 106.0 | 83.0 | 80.0 | ||||
| AM NVA (°) | 73.3 | 12.1 | 163.8 | 12.2 | 252.4 | 15.2 | 338.3 | 8.9 | |
| AM RPs slope (°) | 39.0 | 11.4 | 37.4 | 10.4 | 36.6 | 11.9 | 42.0 | 13.7 | |
| Σ RPs area (m²) | 2390.3 | 3260.4 | 2457.8 | 2973.0 | |||||
| AM RPs area (m²) | 31.5 | 4.0 | 30.8 | 3.9 | 29.6 | 3.7 | 31.6 | 3.8 | |
| Σ RPs AI (MWh) | 2261.6 | 4552.5 | 3035.2 | 2136.4 | |||||
| AM RPs AI (kWh/m²) | 956.3 | 289.8 | 1383.7 | 323.8 | 1228.3 | 315.4 | 724.0 | 254.5 | |
| C–OTHER | RPs count | 82.0 | 72.0 | 84.0 | 64.0 | ||||
| AM NVA (°) | 72.2 | 15.2 | 163.0 | 16.1 | 253.7 | 16.0 | 336.6 | 9.4 | |
| AM RPs slope (°) | 43.0 | 10.6 | 48.3 | 11.2 | 44.8 | 9.8 | 47.3 | 12.7 | |
| Σ RPs area (m²) | 2469.7 | 2176.9 | 2641.4 | 2283.5 | |||||
| AM RPs area (m²) | 30.1 | 3.9 | 30.2 | 4.4 | 31.4 | 4.1 | 28.5 | 3.5 | |
| Σ RPs AI (MWh) | 2276.2 | 2721.2 | 2941.7 | 1492.1 | |||||
| AM RPs AI (kWh/m²) | 904.5 | 279.7 | 1252.6 | 365.7 | 1099.3 | 285.4 | 654.8 | 258.3 | |
| Category/Group | Group D-I. (4th 20%) (Azimuth 70°) | Group D-II. (4th 20%) (Azimuth 160°) | Group D-III. (4th 20%) (Azimuth 250°) | Group D-IV. (4th 20%) (Azimuth 340°) | |||||
|---|---|---|---|---|---|---|---|---|---|
| PI | PI | PI | PI | ||||||
| A–ALL | RPs count | 173.0 | 185.0 | 177.0 | 172.0 | ||||
| AM NVA (°) | 76.1 | 13.6 | 165.2 | 12.7 | 255.1 | 13.3 | 345.9 | 13.0 | |
| AM RPs slope (°) | 38.6 | 8.8 | 37.9 | 7.5 | 37.3 | 7.9 | 40.4 | 9.6 | |
| Σ RPs area (m²) | 10,452.7 | 11,472.5 | 10,710.3 | 10,590.7 | |||||
| AM RPs area (m²) | 60.4 | 8.5 | 62.0 | 8.6 | 60.5 | 8.6 | 61.6 | 9.1 | |
| Σ RPs AI (MWh) | 11,175.4 | 17,628.5 | 13,369.4 | 7707.9 | |||||
| AM RPs AI (kWh/m²) | 1062.2 | 240.8 | 1529.1 | 234.1 | 1247.0 | 227.6 | 733.0 | 200.1 | |
| B–IC | RPs count | 82.0 | 82.0 | 89.0 | 86.0 | ||||
| AM NVA (°) | 73.6 | 12.5 | 164.1 | 11.2 | 252.9 | 11.0 | 349.3 | 11.6 | |
| AM RPs slope (°) | 35.5 | 9.2 | 36.6 | 6.9 | 35.6 | 7.8 | 41.9 | 11.0 | |
| Σ RPs area (m²) | 4887.9 | 5177.4 | 5397.4 | 5249.8 | |||||
| AM RPs area (m²) | 59.6 | 9.5 | 63.1 | 8.5 | 60.6 | 7.9 | 61.0 | 9.0 | |
| Σ RPs AI (MWh) | 5251.5 | 8061.3 | 6872.2 | 3534.0 | |||||
| AM RPs AI (kWh/m²) | 1064.6 | 254.6 | 1557.4 | 225.1 | 1275.6 | 221.6 | 683.3 | 211.9 | |
| C–OTHER | RPs count | 91.0 | 103.0 | 88.0 | 86.0 | ||||
| AM NVA (°) | 78.4 | 14.3 | 166.2 | 13.8 | 257.4 | 15.1 | 342.6 | 14.0 | |
| AM RPs slope (°) | 41.5 | 8.0 | 38.9 | 7.8 | 39.0 | 7.8 | 38.9 | 7.9 | |
| Σ RPs area (m²) | 5564.7 | 6295.0 | 5312.9 | 5341.0 | |||||
| AM RPs area (m²) | 61.2 | 8.8 | 61.1 | 8.6 | 60.4 | 9.3 | 62.1 | 9.1 | |
| Σ RPs AI (MWh) | 5923.8 | 9567.2 | 6497.2 | 4173.8 | |||||
| AM RPs AI (kWh/m²) | 1059.9 | 229.1 | 1506.5 | 241.1 | 1218.2 | 233.1 | 782.6 | 182.6 | |
| Category/Group | Group E-I. (5th 20%) (Azimuth 70°) | Group E-II. (5th 20%) (Azimuth 160°) | Group E-III. (5th 20%) (Azimuth 250°) | Group E-IV. (5th 20%) (Azimuth 340°) | |||||
|---|---|---|---|---|---|---|---|---|---|
| PI | PI | PI | PI | ||||||
| A–ALL | RPs count | 149.0 | 181.0 | 137.0 | 200.0 | ||||
| AM NVA (°) | 73.2 | 14.4 | 163.3 | 11.2 | 255.4 | 15.4 | 343.9 | 12.5 | |
| AM RPs slope (°) | 41.3 | 8.3 | 40.9 | 6.7 | 40.3 | 6.0 | 41.2 | 7.7 | |
| Σ RPs area (m²) | 27,012.9 | 31,417.9 | 22,408.4 | 34,341.1 | |||||
| AM RPs area (m²) | 181.3 | 95.6 | 173.6 | 82.4 | 163.6 | 59.5 | 171.7 | 82.6 | |
| Σ RPs AI (MWh) | 29,432.4 | 49,006.0 | 27,161.8 | 24,377.4 | |||||
| AM RPs AI (kWh/m²) | 1046.7 | 200.6 | 1561.9 | 205.9 | 1227.2 | 200.5 | 725.3 | 171.5 | |
| B–IC | RPs count | 61.0 | 85.0 | 64.0 | 80.0 | ||||
| AM NVA (°) | 71.3 | 12.5 | 165.5 | 12.6 | 255.4 | 13.9 | 343.0 | 10.9 | |
| AM RPs slope (°) | 40.2 | 8.0 | 39.6 | 5.0 | 39.8 | 5.6 | 37.2 | 6.3 | |
| Σ RPs area (m²) | 8918.6 | 12,358.3 | 8954.6 | 11535.1 | |||||
| AM RPs area (m²) | 146.2 | 44.2 | 145.4 | 40.5 | 139.9 | 36.3 | 144.2 | 38.1 | |
| Σ RPs AI (MWh) | 8779.5 | 19,569.6 | 10,787.1 | 9208.2 | |||||
| AM RPs AI (kWh/m²) | 987.6 | 213.6 | 1569.9 | 186.1 | 1226.9 | 189.9 | 791.8 | 171.3 | |
| C–OTHER | RPs count | 88.0 | 96.0 | 73.0 | 120.0 | ||||
| AM NVA (°) | 74.6 | 15.6 | 161.3 | 9.7 | 255.4 | 16.8 | 336.2 | 8.4 | |
| AM RPs slope (°) | 42.0 | 8.5 | 42.1 | 7.9 | 40.8 | 6.4 | 43.9 | 8.1 | |
| Σ RPs area (m²) | 18,094.2 | 19,059.7 | 13,453.8 | 22,806.0 | |||||
| AM RPs area (m²) | 205.6 | 116.4 | 198.5 | 103.9 | 184.3 | 71.5 | 190.0 | 100.3 | |
| Σ RPs AI (MWh) | 20,652.9 | 29,436.4 | 16,374.8 | 15,169.2 | |||||
| AM RPs AI (kWh/m²) | 1087.6 | 187.3 | 1554.8 | 222.8 | 1227.4 | 210.6 | 681.0 | 165.7 | |
| Category/Group | Group A-FR (1st 20%) | Group B-FR (2nd 20%) | Group C-FR (3rd 20%) | Group D-FR (4th 20%) | Group E-FR (5th 20%) | ||||||
|---|---|---|---|---|---|---|---|---|---|---|---|
| PI | PI | PI | PI | PI | |||||||
| A–ALL | RPs count | 169.0 | 134.0 | 135.0 | 114.0 | 167.0 | |||||
| Σ RPs area (m²) | 1208.8 | 2053.0 | 4006.5 | 7100.1 | 35,896.3 | ||||||
| AM RPs area (m²) | 7.2 | 1.0 | 15.3 | 2.3 | 29.7 | 3.9 | 62.3 | 9.5 | 214.9 | 140.7 | |
| Σ RPs AI (MWh) | 1796.0 | 2618.4 | 5318.1 | 9287.9 | 51,678.6 | ||||||
| AM RPs AI (kWh/m²) | 1498.7 | 292.8 | 1283.6 | 300.5 | 1327.2 | 287.4 | 1302.7 | 327.2 | 1396.5 | 275.6 | |
| B–IC | RPs count | 35.0 | 27.0 | 31.0 | 22.0 | 10.0 | |||||
| Σ RPs area (m²) | 264.7 | 396.0 | 903.6 | 1380.0 | 1911.6 | ||||||
| AM RPs area (m²) | 7.6 | 1.0 | 7.4 | 2.4 | 29.1 | 3.9 | 62.7 | 9.5 | 191.2 | 127.3 | |
| Σ RPs AI (MWh) | 391.9 | 664.4 | 1389.2 | 1728.6 | 2911.4 | ||||||
| AM RPs AI (kWh/m²) | 1490.1 | 251.0 | 1676.7 | 243.4 | 1530.8 | 309.8 | 1278.2 | 266.9 | 1425.4 | 265.7 | |
| C–OTHER | RPs count | 106.0 | 100.0 | 102.0 | 90.0 | 90.0 | |||||
| Σ RPs area (m²) | 757.2 | 727.2 | 748.5 | 664.2 | 664.2 | ||||||
| AM RPs area (m²) | 7.1 | 1.0 | 7.3 | 1.0 | 7.3 | 1.0 | 7.4 | 1.0 | 7.4 | 1.0 | |
| Σ RPs AI (MWh) | 680.7 | 936.3 | 824.6 | 499.6 | 499.6 | ||||||
| AM RPs AI (kWh/m²) | 900.6 | 284.1 | 1282.8 | 365.5 | 1106.7 | 354.5 | 759.4 | 265.1 | 759.4 | 265.1 | |
| Azimuth Interval Mid-Value (°) | Azimuth (°) | Slope (°) | Area (m²) | AI r-sun (kWh/m²) | AI PVGIS (kWh/m²) | Changes in Output (%) | Changes in Output AM (%) | Changes in Output MEDIAN (%) | Ratio PVGIS /r-sun | Ratio AM | Ratio MEDIAN |
|---|---|---|---|---|---|---|---|---|---|---|---|
| 70 | 88.5 | 31.7 | 88.2 | 1517.7 | 1201.2 | −11.4 | −11.5 | −11.5 | 0.8 | 0.8 | 0.8 |
| 64.5 | 12.9 | 91.7 | 1516.9 | 1205.7 | −12.1 | 0.8 | |||||
| 92.1 | 15.2 | 99.4 | 1462.9 | 1271.1 | −11.6 | 0.9 | |||||
| 99.1 | 37.9 | 108.8 | 1414.1 | 1239.9 | −11.1 | 0.9 | |||||
| 79.2 | 50.4 | 143.8 | 1752.2 | 1040.0 | −11.5 | 0.6 | |||||
| 107.1 | 36.4 | 146.2 | 1511.9 | 1291.1 | −11.0 | 0.9 | |||||
| 102.5 | 41.4 | 191.0 | 1405.9 | 1244.8 | −11.1 | 0.9 | |||||
| 50.3 | 19.1 | 192.9 | 1390.9 | 1117.8 | −12.5 | 0.8 | |||||
| 102.7 | 31.2 | 214.5 | 1636.0 | 1282.9 | −11.5 | 0.8 | |||||
| 95.6 | 37.7 | 404.4 | 1398.8 | 1222.4 | −11.2 | 0.9 | |||||
| 160 | 189.3 | 30.9 | 88.4 | 2062.9 | 1501.1 | −10.7 | −10.8 | −10.7 | 0.7 | 0.7 | 0.7 |
| 154.9 | 11.3 | 113.9 | 2044.6 | 1384.9 | −11.2 | 0.7 | |||||
| 161.3 | 16.3 | 116.7 | 1968.9 | 1425.2 | −11.0 | 0.7 | |||||
| 171.2 | 31.2 | 124.0 | 1978.7 | 1500.1 | −10.7 | 0.8 | |||||
| 189.2 | 30.1 | 148.5 | 1959.8 | 1498.9 | −10.7 | 0.8 | |||||
| 154.8 | 28.9 | 171.1 | 1985.6 | 1472.4 | −10.7 | 0.7 | |||||
| 153.9 | 27.1 | 172.0 | 1999.2 | 1465.6 | −10.8 | 0.7 | |||||
| 156.7 | 28.4 | 176.0 | 1971.7 | 1474.1 | −10.8 | 0.8 | |||||
| 161.9 | 25.4 | 282.6 | 2031.5 | 1472.7 | −10.8 | 0.7 | |||||
| 173.1 | 35.1 | 320.5 | 1977.9 | 1507.3 | −10.6 | 0.8 | |||||
| 250 | 218.1 | 41.7 | 93.8 | 1641.3 | 1439.8 | −10.7 | −10.9 | −10.9 | 0.9 | 0.8 | 0.8 |
| 220.4 | 26.1 | 100.9 | 1963.7 | 1433.9 | −10.9 | 0.7 | |||||
| 244.4 | 25.8 | 105.9 | 1764.8 | 1352.9 | −11.1 | 0.8 | |||||
| 221.1 | 29.0 | 114.7 | 1998.8 | 1436.0 | −10.9 | 0.7 | |||||
| 230.5 | 33.8 | 119.2 | 1762.8 | 1406.1 | −10.8 | 0.8 | |||||
| 251.0 | 31.6 | 128.2 | 1638.0 | 1316.5 | −11.1 | 0.8 | |||||
| 233.6 | 28.8 | 129.4 | 1666.4 | 1391.7 | −10.9 | 0.8 | |||||
| 216.8 | 33.4 | 130.4 | 1650.5 | 1451.3 | −10.8 | 0.9 | |||||
| 218.7 | 31.3 | 161.4 | 1713.2 | 1444.1 | −10.8 | 0.8 | |||||
| 230.4 | 29.7 | 221.5 | 1793.1 | 1406.6 | −10.9 | 0.8 | |||||
| 340 | 337.2 | 29.2 | 91.1 | 1200.2 | 931.5 | −13.8 | −13.1 | −13.0 | 0.8 | 0.7 | 0.8 |
| 334.2 | 17.7 | 94.3 | 1302.4 | 1071.8 | −13.0 | 0.8 | |||||
| 305.9 | 30.5 | 105.4 | 1190.1 | 1037.4 | −12.7 | 0.9 | |||||
| 297.0 | 32.2 | 106.9 | 1214.1 | 1068.0 | −12.3 | 0.9 | |||||
| 335.5 | 11.6 | 112.5 | 1423.0 | 1150.1 | −12.6 | 0.8 | |||||
| 302.6 | 89.5 | 134.5 | 1587.8 | 545.1 | −12.5 | 0.3 | |||||
| 336.6 | 23.5 | 136.3 | 1191.4 | 1007.9 | −13.3 | 0.9 | |||||
| 352.9 | 13.6 | 195.3 | 1345.50 | 1110.4 | −12.9 | 0.8 | |||||
| 325.9 | 25.0 | 230.8 | 1889.37 | 1009.5 | −13.2 | 0.5 | |||||
| 331.9 | 49.0 | 348.8 | 1437.63 | 708.5 | −14.3 | 0.5 | |||||
| ALL | −11.6 | −11.1 | 0.8 | 0.8 |
References
- United Nations Department of Economic and Social Affairs, Population Division (2022). World Population Prospects 2022: Summary of Results. 2022. Available online: https://www.un.org/development/desa/pd/sites/www.un.org.development.desa.pd/files/wpp2022_summary_of_results.pdf (accessed on 15 October 2022).
- United Nations Department of Economic and Social Affairs (2019). World Urbanization Prospects: The 2018 Revision; Statistical Papers—United Nations (Series A), Population and Vital Statistics Report; United Nations Department of Economic and Social Affairs: New York, NY, USA, 2019. [Google Scholar] [CrossRef]
- United Nations. Goal 11: Make Cities Inclusive, Safe, Resilient and Sustainable, Cities—United Nations Sustainable Development Action. 2015. Available online: https://www.un.org/sustainabledevelopment/cities/ (accessed on 5 August 2022).
- United Nations. Make Cities and Human Settlement Inclusive, Safe, Resilient and Sustainable, SDG Indicators, Development Data and Outreach Branch. 2022. Available online: https://unstats.un.org/sdgs/report/2019/goal-11/ (accessed on 5 August 2022).
- Němcová Zedníčková, Z. On the Edge—Future adaptation challenges: The role of futurology, scenario planning methodology and off grid design in architectural and urban teaching. ALFA Archit. Pap. Fac. Archit. Des. STU 2022, 3, 8–16. [Google Scholar] [CrossRef]
- United Nations General Assembly (2015). Transforming our World: The 2030 Agenda for Sustainable Development. Resolution Adopted by the General Assembly on 25 September 2015. A/RES/70/1. Available online: https://documents-dds-ny.un.org/doc/UNDOC/GEN/N15/291/89/PDF/N1529189.pdf?OpenElement (accessed on 15 October 2022).
- European Commission. Communication from the Commission to the European Parliament, the Council, the European Economic and Social Committee and the Committee of the Regions. An EU Strategy on Adaptation to Climate Change, COM/2013/0216 Final. 2013. Available online: https://eur-lex.europa.eu/legal-content/EN/TXT/?uri=celex%3A52013DC0216 (accessed on 9 September 2022).
- European Commission. Communication from the Commission the European Green Deal, COM/2019/640 final. 2019. Available online: https://eur-lex.europa.eu/legal-content/EN/TXT/?qid=1576150542719&uri=COM%3A2019%3A640%3AFIN (accessed on 28 September 2022).
- European Parliament. Climate and Environmental Emergency—2019/2930 (RSP). 2019. Available online: https://www.europarl.europa.eu/doceo/document/TA-9-2019-0078_EN.html (accessed on 30 November 2022).
- United Nations. Paris Agreement. 2015. Available online: https://unfccc.int/sites/default/files/resource/parisagreement_publication.pdf (accessed on 29 November 2022).
- Gremmelspacher, J.M.; Campamà Pizarro, R.; van Jaarsveld, M.; Davidsson, H.; Johansson, D. Historical building renovation and PV optimisation towards NetZEB in Sweden. Solar Energy 2021, 223, 248–260. [Google Scholar] [CrossRef]
- European Commission. In Focus: Energy Efficiency in Buildings. 2020. Available online: https://ec.europa.eu/info/sites/default/files/energy_climate_change_environment/events/documents/in_focus_energy_efficiency_in_buildings_en.pdf (accessed on 19 November 2022).
- European Commission. EU Building Stock Observatory—EU Buildings Database. 2015. Available online: https://ec.europa.eu/energy/eu-buildings-database_en (accessed on 19 November 2022).
- Moschella, A.; Salemi, A.; Lo Faro, A.; Sanfilippo, G.; Detommaso, M.; Privitera, A. Historic buildings in Mediterranean area and solar thermal technologies: Architectural integration vs preservation criteria. Energy Procedia 2013, 42, 416–425. [Google Scholar] [CrossRef]
- Lindkvist, C.; Karlsson, A.; Sørnes, K.; Wyckmans, A. Barriers and Challenges in nZEB Projects in Sweden and Norway. Energy Procedia 2014, 58, 199–206. [Google Scholar] [CrossRef]
- EN 16883:2017; Conservation of Cultural Heritage—Guidelines for Improving the Energy Performance of Historic Buildings. European Committee for Standardization (CEN): Brussels, Belgium, 2017.
- II International Congress of Architects and Technicians of Historic Monuments, Venice from May 25th to 31st 1964 (1964). The Venice Charter: International Charter for the Conservation and Restoration of Monuments and Sites. Available online: https://www.charta-von-venedig.de/venice-charter_home.html (accessed on 10 October 2022).
- Gregorová, J.; Špaček, R. Cultural Sustainability as a Condition of Refined Habitableness of Town. Zivotn. Prostr. 2008, 5, 227–234. Available online: https://publikacie.uke.sav.sk/sites/default/files/2008_5_227_234_gregorova_0.pdf (accessed on 10 October 2022). (In Slovak).
- Pisello, A.L.; Petrozzi, A.; Castaldo, V.L.; Cotana, F. Energy Refurbishment of Historical Buildings with Public Function: Pilot Case Study. Energy Procedia 2014, 61, 660–663. [Google Scholar] [CrossRef]
- Cabeza, L.F.; de Gracia, A.; Pisello, A.L. Integration of renewable technologies in historical and heritage buildings: A review. Energy Build. 2018, 177, 96–111. [Google Scholar] [CrossRef]
- Gregor, P. Obnova Pamiatok, 1st ed.; Perfekt: Bratislava, Slovakia, 2008; pp. 67–69. [Google Scholar]
- Melková, P. Prožívat Architekturu, 1st ed.; Arbor Vitae: Prague, Czech Republic, 2013; p. 15. [Google Scholar]
- Gregorová, J.; Pagáčová, P. Solar gains in monumental protected structures (case study—A traditional structure in the town of Modra, Slovakia). World Trans. Eng. Technol. Educ. 2015, 13, 397–401. [Google Scholar]
- Broström, T.; Svahnström, K.; Solar Energy and Cultural-Heritage Values. World Renewable Energy Congress 2011—Sweden, 8–13 May 2011, Linköping, Sweden. Low Energy Architecture (LEA). Available online: https://www.diva-portal.org/smash/get/diva2:461583/FULLTEXT01.pdf (accessed on 20 November 2022).
- Polo Lópeza, C.S.; Frontinia, F. Energy efficiency and renewable solar energy integration in heritage historic buildings. Energy Procedia 2014, 48, 1493–1502. [Google Scholar] [CrossRef]
- Lucchi, E.; Boarin, P.; Zuppiroli, M. GBC Historic Building®: A new certification tool for orienting and assessing environmental sus-tainability and energy efficiency of historic buildings. In Energy Efficincy and Comfort of Historic Buildings; Flanders Heritage Agency: Brussels, Belgium, 2016; pp. 250–256. Available online: https://www.researchgate.net/publication/352455532_Wooden_Buildings_in_Market_Squares_of_Polish_Small_Towns_Bielsk_Podlaski_and_Kleszczele-The_Issue_of_Preserving_and_Restoring_Historical_Values_of_Market_Spaces (accessed on 20 November 2022).
- UNESCO. Convention Concerning the Protection of the World Cultural and Natural Heritage. Adopted by the General Conference at its seventeenth session Paris, 16 November 1972. 1972. Available online: https://whc.unesco.org/archive/convention-en.pdf (accessed on 10 October 2022).
- UNESCO. The General Conference of UNESCO in 1976 of the Warsaw-Nairobi Recommendation, Recommendation Concerning the Safeguarding and Contemporary Role of Historic Areas. 1976. Available online: https://unesdoc.unesco.org/ark:/48223/pf0000114038.page=136 (accessed on 10 October 2022).
- ICOMOS. Charter for the Conservation of Historic Towns and Urban Areas (Washington Charter 1987). 1987. Available online: https://www.icomos.org/images/DOCUMENTS/Charters/towns_e.pdf (accessed on 10 October 2022).
- UNESCO. The Nara Document on Authenticity. 1994. Available online: https://whc.unesco.org/archive/nara94.htm (accessed on 10 October 2022).
- Council of Europe. Convention for the Protection of the Architectural Heritage of Europe (ETS No. 121). 1987. Available online: https://www.coe.int/en/web/conventions/full-list?module=treaty-detail&treatynum=121 (accessed on 20 October 2022).
- Lucchi, E. Integration between photovoltaic systems and cultural heritage: A socio-technical comparison of international policies, design criteria, applications, and innovation developments. Energy Policy 2022, 171, 113303. [Google Scholar] [CrossRef]
- Mayer-Schönberger, V.; Cukier, K. Big Data: A Revolution that Will Transform—How We Live, Work, and Think; Harper Business: New York, NY, USA, 2013; pp. 1–272. ISBN 978-1848547926. [Google Scholar]
- Directive (EU) 2018/2001 of the European Parliament and of the Council of 11 December 2018 on the Promotion of the Use of Energy from Renewable Sources (Recast) (Text with EEA Relevance.) PE/48/2018/REV/1. Available online: https://eur-lex.europa.eu/legal-content/EN/TXT/?uri=uriserv:OJ.L_.2018.328.01.0082.01.ENG (accessed on 19 November 2022).
- Lucchi, E.; Dall’Orto, I.; Peluchetti, A.; Toledo, L.; Pelle, M.; López, C.P.; Guazzi, G. Photovoltaic technologies in historic buildings and protected areas: Comprehensive legislative framework in Italy and Switzerland. Energy Policy 2022, 161, 112772. [Google Scholar] [CrossRef]
- Bruck, A.; Ruano, S.D.; Auer, H. One piece of the puzzle towards 100 Positive Energy Districts (PEDs) across Europe by 2025: An open-source approach to unveil favourable locations of PV-based PEDs from a techno-economic perspective. Energy 2022, 254, 124152. [Google Scholar] [CrossRef]
- European Commission. SET-Plan ACTION n°3.2 Implementation Plan. 2018. Available online: https://setis.ec.europa.eu/system/files/2021-04/setplan_smartcities_implementationplan.pdf (accessed on 15 December 2022).
- Albert-Seifried, V.; Murauskaite, L.; Massa, G.; Aelenei, L.; Baer, D.; Krangsås, S.G.; Alpagut, B.; Mutule, A.; Pokorny, N.; Vandevyvere, H. Definitions of Positive Energy Districts: A Review of the Status Quo and Challenges. In Sustainability in Energy and Buildings 2021; Smart Innovation, Systems and Technologies; Littlewood, J.R., Howlett, R.J., Jain, L.C., Eds.; Springer: Singapore, 2022; Volume 263, pp. 493–506. [Google Scholar] [CrossRef]
- Lindholm, O.; Rehman, H.U.; Reda, F. Positioning Positive Energy Districts in European Cities. Buildings 2021, 11, 19. [Google Scholar] [CrossRef]
- Legény, J.; Morgenstein, P.; Špaček, R. Sustainable solar urban design: Education linked with research. World Trans. Eng. Technol. Educ. 2014, 12, 344–349. [Google Scholar]
- Sonnleithner, M. New opportunities for increasing the renovation rate of buildings. ALFA Archit. Pap. Fac. Archit. Des. STU 2021, 6, 2–9. [Google Scholar] [CrossRef]
- The Monuments Office of the Slovak Republic. Register of National Cultural Monuments. Available online: https://www.pamiatky.sk/nkp-a-po/ (accessed on 20 November 2022).
- Štassel, I.; Gregorová, J. (Eds) Principles of Heritage Area Protection: Heritage zone Bratislava—Central Urban Area; Regional Monument Board—Bratislava: Bratislava, Slovakia, 2015; pp. 1–233. [Google Scholar]
- National Heritage Institute of the Czech Republic. Photovoltaic Systems and Monument Care: A Methodological Statement on the Evaluation of Plans for the Installation of Photovoltaic and other Solar Devices in Cultural Monuments, Heritage Protected Areas, and in the Protected Zones of Cultural Monuments and Heritage Protected Areas. Available online: https://www.npu.cz/portal/npu-a-pamatkova-pece/npu-jako-instituce/hlavni-temata-sezony/2022/fotovoltaika/fotovoltaicke-systemy-v-pamatkove-peci_final_27.10.pdf (accessed on 15 December 2022). (In Czech).
- CENELEC—EN 50583-1; Photovoltaics in Buildings—Part 1: BIPV Modules. European Committee for Electrotechnical Standardization: Brussels, Belgium, 2015.
- CENELEC—EN 50583-2.; Photovoltaics in Buildings—Part 2: BIPV Systems. European Committee for Electrotechnical Standardization: Brussels, Belgium, 2016.
- Solarti Zonneceldakpan. Available online: https://mobile.twitter.com/Solarti_nl/status/1440589432722059268/photo/1 (accessed on 15 December 2022).
- SolarGuide. Available online: https://www.solarguide.co.uk/tesla-energy/solar-roof-tiles#/ (accessed on 15 December 2022).
- Flickr. Available online: https://www.flickr.com/photos/eastpole/2224762452/in/photostream/ (accessed on 15 December 2022).
- Hofierka, J.; Kaňuk, J. Assessment of photovoltaic potential in urban areas using open-source solar radiation tools. Renew. Energy 2009, 34, 2206–2214. [Google Scholar] [CrossRef]
- Grass.osgeo.org. r.sun—Solar Irradiance and Irradiation Model. Available online: https://grass.osgeo.org/grass82/manuals/r.sun.html (accessed on 18 December 2022).
- European Commission. Photovoltaic Geographical Information System. 2022. Available online: https://re.jrc.ec.europa.eu/pvg_tools/en/tools.html#api_5.2 (accessed on 20 December 2022).
- Diego, J.C.; Bonete, S.; Chías, P. VIA-7 Method: A seven perceptual parameters methodology for the assessment of visual impact caused by wind and solar facilities on the landscape in cultural heritage sites. Renew. Sustain. Energy Rev. 2022, 165, 112528. [Google Scholar] [CrossRef]
- Lingfors, D.; Johansson, T.; Widén, J.; Broström, T. Target-based visibility assessment on building envelopes: Applications to PV and cultural-heritage values. Energy Build. 2019, 204, 109483. [Google Scholar] [CrossRef]
- The National Renewable Energy Laboratory (NREL). Best Research-Cell Efficiencies. 2022. Available online: https://www.nrel.gov/pv/assets/pdfs/best-research-cell-efficiencies.pdf (accessed on 20 December 2022).
- The Capital City of Slovak Republic Bratislava. Open data Bratislava: Electricity Consumption by Districts in Bratislava (MWh). 2019. Available online: https://opendata.bratislava.sk/en/dataset/show/spotreba-elektriny-v-mwh (accessed on 20 December 2022).
- European Commission. Solar Energy. 2022. Available online: https://energy.ec.europa.eu/topics/renewable-energy/solar-energy_en (accessed on 20 December 2022).
- Mejias, U.A.; Couldry, N. Datafication. Internet Policy Rev. 2019, 8, 1428. [Google Scholar] [CrossRef]
- Walentek, D. Datafication Process in the Concept of Smart Cities. Energies 2021, 14, 4861. [Google Scholar] [CrossRef]
- EA Solar. History and the Development of Photovoltaics. 2021. Available online: https://ae-solar.com/history-of-solar-module/#:~:text=Solar%20energy%20has%20exhibited%20the,to%20level%20off%20after%20that (accessed on 19 January 2023).
- IRENA. Renewable Power Generation Costs in 2021; International Renewable Energy Agency: Abu Dhabi, United Arab Emirates, 2022; ISBN 978-92-9260-452-3. Available online: https://www.irena.org/-/media/Files/IRENA/Agency/Publication/2022/Jul/IRENA_Power_Generation_Costs_2021.pdf?rev=34c22a4b244d434da0accde7de7c73d8 (accessed on 19 January 2023).


| Unit | <1945 | 1945– 1969 | 1970– 1979 | 1980– 1989 | 1990– 1999 | 2000– 2010 | >2010 | |
|---|---|---|---|---|---|---|---|---|
| Slovakia | % | 14.38 | 32.21 | 23.34 | 17.63 | 5.12 | 5.81 | 1.50 |
| EU | % | 22.69 | 26.19 | 15.98 | 12.54 | 9.34 | 9.56 | 3.69 |
| City District | INCM in Total | Buildings | Other 1 |
|---|---|---|---|
| I. | 1308 | 951 | 357 |
| II. | 34 | 26 | 8 |
| III. | 73 | 58 | 15 |
| IV. | 124 | 105 | 19 |
| V. | 36 | 24 | 12 |
| In total | 1575 | 1164 | 411 |
| Type of PV System | Subtype of PV System | Description | |
|---|---|---|---|
| Pros (+) | Cons (−) | ||
| Lean to | - | Simple design, structurally noninvasive intervention. Do not change the material substance of buildings. | Causes a change in the visual perception of object and territory. * |
| Partially embedded / / building-attached photovoltaics (BAPVs) | - | Minimal (but not zero) intervention into the material substance of the object and degree of reversibility. | Change in the volume and silhouettes of the building. * |
| Embedded/building integrated photovoltaics (BIPVs) | Systems replacing the entire structural element of a building. | The integration follows the existing material substance and volume. The silhouette of the building is retained. | Reversibility of the intervention. *,** |
| Systems replacing part of the building | The integration follows the existing material substance and volume. | Reversibility of the intervention. *,** | |
| Semitransparent systems | The volume of the construction remains preserved and is reversible. | Change the original transparency of the glass. * | |
| Area Interval (m2) | Annual Irradiance (MWh) | (%) | Area (m2) | (%) | Σ RPs | (%) |
|---|---|---|---|---|---|---|
| All polygons | 306,194 | 100 | 259,211 | 100 | 9150 | 100 |
| <0, 5) | 12,017 | 3.9 | 9976 | 3.9 | 4934 | 53.9 |
| <5, max.> | 294,178 | 96.1 | 249,235 | 96.2 | 4216 | 46.1 |
| Slope Interval (°) | Annual Irradiance (MWh) | (%) | Area (m2) | (%) | Σ RPs | (%) |
|---|---|---|---|---|---|---|
| All polygons | 294,178 | 100 | 249,235 | 100 | 4 216 | 100 |
| <0, 10) | 77,785 | 26.4 | 55,121 | 22.1 | 844 | 20.0 |
| <10, 90> | 216,393 | 73.7 | 194,115 | 77.9 | 3 372 | 80.0 |
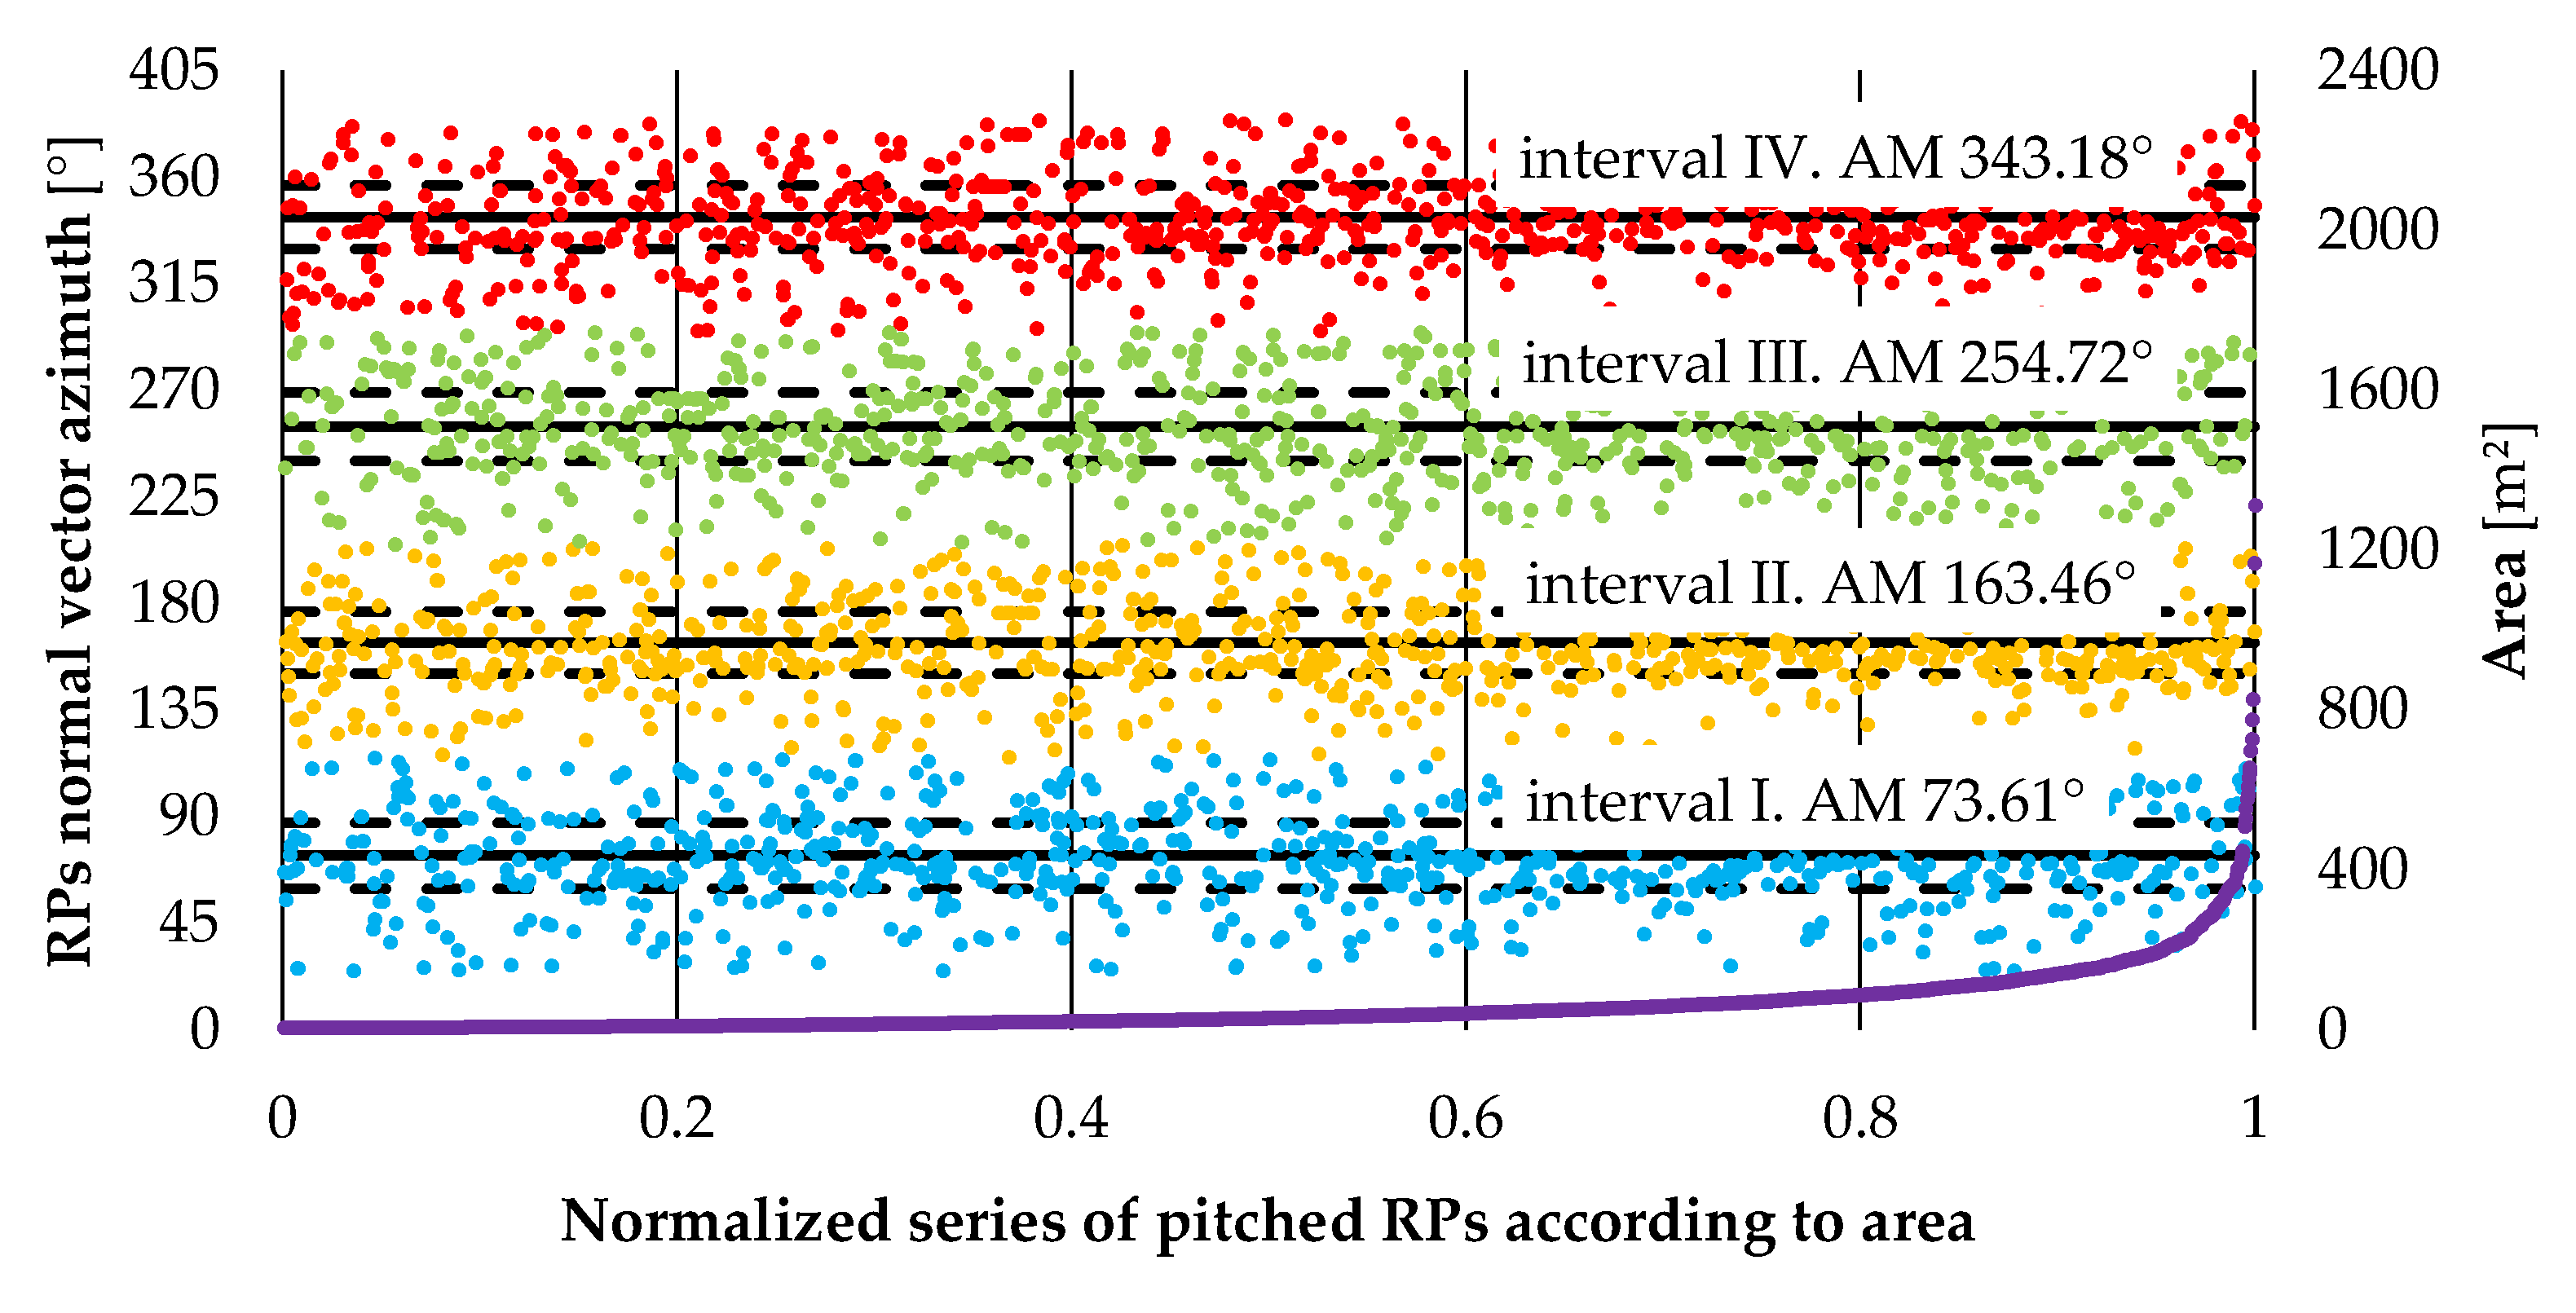
| Interval | Prevalent Azimuth (°) | Azimuth Interval (°) | AM (°) | 50% PI (°) |
|---|---|---|---|---|
| I | 70 | <25, 115) | 73.6 | ±14.1 |
| II | 160 | <115, 205) | 163.5 | ±13.1 |
| III | 250 | <205, 295) | 254.7 | ±14.5 |
| IV | 340 | <295, 385) | 343.2 | ±13.5 |
| RPs Normal Vector Azimuth of RPs | ||||||
|---|---|---|---|---|---|---|
| I | II | III | IV | |||
| Interval | <25, 115) | <115, 205) | <205, 295) | <295, 385) | ||
| Normalized series of pitched RPs according to area | A | (0.0, 0.2) | Group A-I. | Group A-II. | Group A-III. | Group A-IV. |
| B | <0.2, 0.4) | Group B-I. | Group B-II. | Group B-III. | Group B-IV. | |
| C | <0.4, 0.6) | Group C-I. | Group C-II. | Group C-III. | Group C-IV. | |
| D | <0.6, 0.8) | Group D-I. | Group D-II. | Group D-III. | Group D-IV. | |
| E | <0.8, 1.0> | Group E-I. | Group E-II. | Group E-III. | Group E-IV. | |
| Group | A-I./i | A-II./i | A-III./i | A-IV./i | A-I./c | A-II./c | A-III./c | A-IV./c | A-FR/i | A-FR/c |
| (AM–PI) AI (kWh/m²) | 665.9 | 718.7 | 591.9 | 513.7 | 616.5 | 917.3 | 752.2 | 494.3 | 1239.2 | 1205.9 |
| Σ RPs area (m²) | 410.8 | 448.7 | 444.1 | 436.3 | 757.2 | 727.2 | 748.5 | 664.2 | 264.7 | 1208.8 |
| Σ RPs AI (MWh) | 402.9 | 526.0 | 433.3 | 343.0 | 680.7 | 936.3 | 824.6 | 499.6 | 391.9 | 1796.0 |
| Group | B-I./i | B-II./i | B-III./i | B-IV./i | B-I./c | B-II./c | B-III./c | B-IV./c | B-FR/i | B-FR/c |
| (AM–PI) AI (kWh/m²) | 655.5 | 1057.4 | 734.9 | 521.5 | 564.0 | 984.4 | 804.9 | 411.5 | 1433.3 | 983.1 |
| Σ RPs area (m²) | 1155.5 | 1056.8 | 1167.2 | 1016.8 | 1677.6 | 1288.9 | 1369.2 | 1686.1 | 396.0 | 2053.0 |
| Σ RPs AI (MWh) | 1088.4 | 1506.4 | 1270.4 | 739.3 | 1499.5 | 1757.8 | 1506.8 | 1102.6 | 664.4 | 2618.4 |
| Group | C-I./i | C-II./i | C-III./i | C-IV./i | C-I./c | C-II./c | C-III./c | C-IV./c | C-FR/i | C-FR/c |
| (AM–PI) AI (kWh/m²) | 666.6 | 1059.9 | 912.9 | 469.5 | 624.8 | 887.0 | 813.9 | 396.5 | 1221.0 | 1039.9 |
| Σ RPs area (m²) | 2390.3 | 3260.4 | 2457.8 | 2973.0 | 2469.7 | 2176.9 | 2641.4 | 2283.5 | 903.6 | 4006.5 |
| Σ RPs AI (MWh) | 2261.6 | 4552.5 | 3035.2 | 2136.4 | 2276.2 | 2721.2 | 2941.7 | 1492.1 | 1389.2 | 5318.1 |
| Group | D-I./i | D-II./i | D-III./i | D-IV./i | D-I./c | D-II./c | D-III./c | D-IV./c | D-FR/i | E-FR/c |
| (AM–PI) AI (kWh/m²) | 810.1 | 1332.3 | 1054.0 | 471.3 | 830.8 | 1265.4 | 985.0 | 600.0 | 1011.2 | 975.5 |
| Σ RPs area (m²) | 4887.9 | 5177.4 | 5397.4 | 5249.8 | 5564.7 | 6295.0 | 5312.9 | 5341.0 | 1380.0 | 7100.1 |
| Σ RPs AI (MWh) | 5251.5 | 8061.3 | 6872.2 | 3534.0 | 5923.8 | 9567.2 | 6497.2 | 4173.8 | 1728.6 | 9287.9 |
| Group | E-I./i | E-II./i | E-III./i | E-IV./i | E-I./c | E-II./c | E-III./c | E-IV./c | E-FR/i | E-FR/c |
| (AM–PI) AI (kWh/m²) | 774.0 | 1383.8 | 1037.0 | 620.5 | 900.3 | 1332.0 | 1016.9 | 515.2 | 1159.7 | 1120.8 |
| Σ RPs area (m²) | 8918.6 | 12358.3 | 8954.6 | 11535.1 | 18094.2 | 19059.7 | 13453.8 | 22806.0 | 1911.6 | 35896.3 |
| Σ RPs AI (MWh) | 8779.5 | 19569.6 | 10787.1 | 9208.2 | 20652.9 | 29436.4 | 16374.8 | 15169.2 | 2911.4 | 51678.6 |
| RPs | Pitched/I RPs/i | Pitched/c RPs/c | All Pitched RPs | Flat/I RPs/i | Flat/c RPs/c | All Flat RPs | All RPs | ||||||||
|---|---|---|---|---|---|---|---|---|---|---|---|---|---|---|---|
| CTA (%) | CTA (%) | CTA (%) | CTA (%) | CTA (%) | CTA (%) | CTA (%) | |||||||||
| All | ΣA | 79.7 | 32.0 | 114.4 | 45.9 | 194.1 | 77.9 | 4.9 | 1.9 | 50.3 | 20.2 | 55.1 | 22.1 | 249.2 | 100.0 |
| ΣAI | 90.4 | 36.3 | 126.0 | 42.8 | 216.4 | 73.6 | 7.1 | 2.4 | 70.7 | 24.0 | 77.8 | 26.4 | 294.2 | 100.0 | |
| best | ΣA | 27.3 | 10.9 | 25.4 | 10.2 | 52.6 | 21.1 | 3.5 | 1.4 | 37.1 | 14.9 | 40.6 | 16.3 | 93.2 | 37.4 |
| 25% | ΣAI | 40.6 | 13.8 | 39.0 | 13.3 | 79.6 | 27.0 | 5.4 | 1.8 | 53.5 | 18.2 | 58.8 | 20.0 | 138.4 | 47.0 |
| best | ΣA | 38.7 | 15.5 | 66.4 | 26.6 | 105.1 | 42.2 | 4.9 | 1.9 | 50.3 | 20.2 | 55.1 | 22.1 | 160.2 | 64.3 |
| 50% | ΣAI | 54.4 | 18.5 | 87.9 | 29.9 | 142.3 | 48.4 | 7.1 | 2.4 | 70.7 | 24.0 | 77.8 | 26.4 | 220.1 | 74.8 |
| ICB | ΣA | 11.4 | 4.6 | 41.1 | 16.5 | 52.5 | 21.1 | 1.4 | 0.6 | 13.2 | 5.3 | 14.5 | 5.8 | 67.0 | 26.9 |
| 25% | ΣAI | 13.8 | 4.7 | 48.9 | 16.6 | 62.8 | 21.3 | 1.7 | 0.6 | 17.2 | 5.9 | 19.0 | 6.4 | 81.7 | 27.8 |
| best | ΣA | 52.9 | 21.2 | 76.7 | 30.8 | 129.7 | 52.0 | - | - | - | - | - | - | 184.8 | 74.1 |
| 75% | ΣAI | 68.9 | 23.4 | 99.1 | 33.7 | 168.1 | 57.1 | - | - | - | - | - | - | 245.9 | 83.6 |
| ICB | ΣA | 14.3 | 5.7 | 10.3 | 4.1 | 24.6 | 9.9 | - | - | - | - | - | - | 24.6 | 9.9 |
| 50% | ΣAI | 14.6 | 4.9 | 11.2 | 3.8 | 25.8 | 8.8 | - | - | - | - | - | - | 25.8 | 8.8 |
| best | ΣA | 79.7 | 32.0 | 114.4 | 45.9 | 194.1 | 77.9 | - | - | - | - | - | - | 249.2 | 100.0 |
| 100% | ΣAI | 90.4 | 30.7 | 126.0 | 42.8 | 216.4 | 73.6 | - | - | - | - | - | - | 294.2 | 100.0 |
| ICB | ΣA | 26.8 | 10.7 | 37.7 | 15.1 | 64.5 | 25.9 | - | - | - | - | - | - | 64.5 | 25.9 |
| 75% | ΣAI | 21.4 | 7.3 | 26.9 | 9.1 | 48.3 | 16.4 | - | - | - | - | - | - | 48.3 | 16.4 |
| Cell Type/Efficiency | |||||||||
|---|---|---|---|---|---|---|---|---|---|
| NonMJC | MJC | BIPV | |||||||
| 22% | 39% | 7% | |||||||
| Area (×1000 m²) | AI (GWh) | Area Reduction Factor | PVGIS R-Sun Reduction Factor | PV Efficiency Losses (%) | Conversion Losses (%) | POP (GWh) | POP (GWh) | POP (GWh) | |
| Pitched RPs/i/hap | 65.9 | 94.9 | 0.8 | 0.79 | 11.1 | 14 | 10.1 | 17.9 | 3.2 |
| Pitched RPs/c/hap | 25.4 | 39.0 | 0.8 | 0.79 | 11.1 | 14 | 4.1 | 7.3 | 1.3 |
| Pitched RPs/i/ap | 132.6 | 159.3 | 0.5 | 0.79 | 11.1 | 14 | 10.6 | 18.8 | 3.4 |
| Pitch RPs/c/ap | 66.4 | 87.9 | 0.5 | 0.79 | 11.1 | 14 | 5.8 | 10.4 | 1.9 |
| Flat RPs/i/hap | 8.3 | 12.4 | 0.8 | 0.79 | 11.1 | 14 | 1.3 | 2.3 | 0.4 |
| Flat RPs/c/hap | 87.4 | 124.2 | 0.8 | 0.79 | 11.1 | 14 | 13.2 | 23.4 | 4.2 |
| Total | 386.0 | 517.8 | 65.6 | ||||||
| Bratislava City District I (BAI) | |||||
| Area: 9.59 km² | |||||
| Annual BAI power consumption: 352.5 GWh | |||||
| Annual BAI power consumption per area: 36.76 GWh/km² | |||||
| Monument Reserve (MR) | |||||
| Area: 0.55 km² | |||||
| Scenario | RPs Included | Annual MR POP (GWh) | MR POP Compared to BAI PC (%) | MR POP Per Area (GWh/km²) | MR POP Per Area Compared to BAI PC Per Area (%) |
| I. | Flat RPs, Non-MJC | 14.5 | 4% | 26.4 | 72% |
| II. | Flat RPs, Non-MJC Pitched RPs/i, Non-MJC | 35.2 | 10% | 64.0 | 174% |
| III. | Flat RPs, MJC pitched RPs/i, MJC | 62.4 | 18% | 113.5 | 309% |
| IV. | Flat RPs, MJC Pitched RPs/i, MJC Pitched RPs/c, BIPV | 65.6 | 19% | 119.3 | 324% |
Disclaimer/Publisher’s Note: The statements, opinions and data contained in all publications are solely those of the individual author(s) and contributor(s) and not of MDPI and/or the editor(s). MDPI and/or the editor(s) disclaim responsibility for any injury to people or property resulting from any ideas, methods, instructions or products referred to in the content. |
© 2023 by the authors. Licensee MDPI, Basel, Switzerland. This article is an open access article distributed under the terms and conditions of the Creative Commons Attribution (CC BY) license (https://creativecommons.org/licenses/by/4.0/).
Share and Cite
Hubinský, T.; Hajtmanek, R.; Šeligová, A.; Legény, J.; Špaček, R. Potentials and Limits of Photovoltaic Systems Integration in Historic Urban Structures: The Case Study of Monument Reserve in Bratislava, Slovakia. Sustainability 2023, 15, 2299. https://doi.org/10.3390/su15032299
Hubinský T, Hajtmanek R, Šeligová A, Legény J, Špaček R. Potentials and Limits of Photovoltaic Systems Integration in Historic Urban Structures: The Case Study of Monument Reserve in Bratislava, Slovakia. Sustainability. 2023; 15(3):2299. https://doi.org/10.3390/su15032299
Chicago/Turabian StyleHubinský, Tomáš, Roman Hajtmanek, Andrea Šeligová, Ján Legény, and Robert Špaček. 2023. "Potentials and Limits of Photovoltaic Systems Integration in Historic Urban Structures: The Case Study of Monument Reserve in Bratislava, Slovakia" Sustainability 15, no. 3: 2299. https://doi.org/10.3390/su15032299
APA StyleHubinský, T., Hajtmanek, R., Šeligová, A., Legény, J., & Špaček, R. (2023). Potentials and Limits of Photovoltaic Systems Integration in Historic Urban Structures: The Case Study of Monument Reserve in Bratislava, Slovakia. Sustainability, 15(3), 2299. https://doi.org/10.3390/su15032299