Article

Computational Solutions Based on Bayesian Networks to Hierarchize and to Predict Factors Influencing Gender Fairness in the Transport System: Four Use Cases

by
Gemma Dolores Molero
1,*,
Sara Poveda-Reyes
1,
Ashwani Kumar Malviya
1,
Elena García-Jiménez
1,
Maria Chiara Leva
2 and
Francisco Enrique Santarremigia
1
1
Research & Innovation Projects, AITEC, Paterna, 46980 Valencia, Spain
2
School of food Science and Environmental Health, Technological University Dublin, D07 H6K8 Dublin, Ireland
*
Author to whom correspondence should be addressed.
Sustainability 2021, 13(20), 11372; https://doi.org/10.3390/su132011372
Submission received: 10 September 2021 / Revised: 1 October 2021 / Accepted: 7 October 2021 / Published: 14 October 2021
(This article belongs to the Special Issue Mobility for Sustainable Societies: Challenges and Opportunities)

Abstract

:
Previous studies have highlighted inequalities and gender differences in the transport system. Some factors or fairness characteristics (FCs) strongly influence gender fairness in the transport system. The difference with previous studies, which focus on general concepts, is the incorporation of level 3 FCs, which are more detailed aspects or measures that can be implemented by companies or infrastructure managers and operators in order to increase fairness and inclusion in each use case. The aim of this paper is to find computational solutions, Bayesian networks, and analytic hierarchy processes capable of hierarchizing level 3 FCs and to predict by simulation their values in the case of applying some improvements. This methodology was applied to data from women in four use cases: railway transport, autonomous vehicles, bicycle sharing stations, and transport employment. The results showed that fairer railway transport requires increased personal space, hospitality rooms, help points, and helpline numbers. For autonomous vehicles, the perception of safety, security, and sustainability should be increased. The priorities for bicycle sharing stations are safer cycling paths avoiding hilly terrains and introducing electric bicycles, child seats, or trailers to carry cargo. In transport employment, the priorities are fair recruitment and promotion processes and the development of family-friendly policies.

1. Introduction

The transport sector cannot evolve without including a gendered perspective. A sustainable society cannot be reached without improving the understanding of the relationships between gender and mobility and developing measures to achieve a fair transport system. Extensive work has been developed analyzing barriers and factors affecting the safe and secure use of the transport system by women [1,2,3,4,5], as well as on the gender gap and the need of equal employment opportunities and conditions, and on improving these employment conditions to better adjust them to women’s needs [1,6,7,8,9,10,11,12].
Within this paper, we wanted to go further than a qualitative analysis of the inclusion of women in the transport sector. We aimed to gather real data and to analyze it using probabilistic methods, such as Bayesian networks (BNs), to achieve a more complete picture of the current situation of society.
BN learning methods can be divided into parametric learning and structural learning. Parametric learning consists of obtaining the conditional probabilities given by the structure of the network using the observed frequencies of a database, while structural learning tries to find the graph that best represents the probability distribution of a given database. Structural learning methods can be divided into independence-based or constraint-based methods and search and score methods. On the one hand, independence-based or constraint-based methods involve detecting the probabilistic conditional independences present in the database; one of the most famous algorithms pertaining to this type is the PC (Peter and Clark) algorithm [13]. On the other hand, search and score methods, also known as methods based on a heuristic search, involves performing a heuristic search through the space of possible structures using a metric that measures how well each structure can represent the probability distribution of the variables in the database. Several metrics have been used in the literature: Bayesian (which include K2, the Bayesian information criterion [BIC], the Bayesian Dirichlet equivalent uniform [BDe], and others), cross-entropy, the Akaike information criterion (AIC), or minimum description length (MDL) [14,15,16], among others.

1.1. Bayesian Networks Applied to Public Transport

Many studies have indicated different aspects that affect women when using the public transport system. One of the main differing aspects of the use of the public transport by men and women is the fact that women suffer more episodes of harassment than men [17]. Some studies have indicated that stations with poor lightning conditions or sidewalk maintenance have more probability of harassment or aggression episodes [17]. Other aspects have been studied, such as the differing travel purposes between men and women, where studies have shown that women tend to do more trip chaining while men tend to go from point A to point B. This might be due a higher percentage of women being in charge of caring responsibilities and everyday household tasks or other errands.
Harvey et al. [18] indicated that some of the factors that show differences between genders were: women are more concerned with travel security than men, women perceive less than men the importance of high-speed rail prestige, and women also value their use of travelling time more (it is important for them to do something when travelling).
There are not many studies using Bayesian networks applied to public transport. Nguyen et al. [19] analyzed the ride comfort of bus passengers, because comfort is a critical factor when attracting users to a specific mode of public transport. They used as inputs vehicle-related parameters, passenger-related features (including posture, location, direction faced, gender, age, weight, and height), and ride comfort index based on ISO 2631-1997; they used the passenger rating (collected from a mobile application) as the output. They built an artificial neural network model and found that passenger-related factors contribute slightly higher than vehicle-related factors to the ride comfort estimation. The analysis between gender showed that the average comfort ratings are similar; however, there are some variations in the rating distribution, where it is more symmetric for men and skews toward lower values for women. The development of machine learning models is becoming an important tool in guiding an autonomous bus.

1.2. Bayesian Networks Applied to Autonomous Vehicles-Driver Interaction

Previous studies have highlighted some differences between men and women and their use and interaction with private and public transport; differences in driving behavior, gender-specific use (women tend to trip-chain more), economic level, technology acceptance, safety concerns, or the willingness to buy a new car are some of the aspects that have been mentioned as those influencing the interaction and willingness of women and men to buy or use a vehicle [2,20,21]. New technologies used in vehicles should focus on meeting the real needs of citizens and then consider the different needs of society and men and women.
There has been limited quantitative analysis using BNs related to the analysis of gender differences in transport. Febres et al. [22] analyzed how the sex and age of the driver could impact the probability of having a road traffic accident when driving a vehicle. They showed that men have a greater probability of suffering a serious and/or fatal injury. Regarding age, they found that male drivers <18 years of age are particularly affected on business trips, with a 20.1% probability of sustaining an injury, while the probability of young women drivers sustaining an injury is 18.7%. They also found that people >60 years of age have a lower risk of experiencing a serious accident. Catalina et al. [23] analyzed the effect of music while driving in young men and women by using BN analysis. They found that when there is no music while driving, women drive at a more appropriate speed than men, while in the presence of music women have a greater chance of committing either a minor or a major speed violation, with music acting as a factor of distraction. Ji et al. [24] used different tools including factor analysis, structural equation modeling (SEM), and BNs to evaluate factors influencing the willingness to use parking guidance and information (PGI) systems and the different perceptions of men and women. They found that female drivers are more likely to use PGI to get help when they realized that it is hard to find a parking space, with a level of willingness of 63.6% compared with 10.9% for male drivers.

1.3. Bayesian Networks Applied to Bicycle Sharing Services

The main differences between men and women in barriers to cycling that have been reported in the literature, including individual mobility patterns, convenience, harassment, or abuse by other road users; traveling with children or goods; cost, access, and logistics; and knowledge and experience.
Some studies using computational methods, such as Bayesian networks, can be found to be applied to shared mobility. Aman et al. [25] analyzed e-scooter mobility of two micromobility companies using machine learning techniques to identify the factors that influence rider satisfaction. They used the latent Dirichl et al. location model to identify the topics discussed in 12,000 reviews of driver and logistic regression to identify the most significant factors. The factors with greater influence on the overall rider satisfaction for both men and women were refund, payment, battery, and customer service. When analyzing only men, the factors with greater influence on their satisfaction were refund, ease of use, payment, and pricing. For women, the factors with greater influence on their satisfaction were refund, payment, and pricing. They also found that safety (speed and riding lane) was not significant for male and female models. In general, women were more satisfied with the services and exhibited more positive sentiment than men, although the percentage of women using the service (29%) was less than the percentage of men (71%).
Le et al. [26] analyzed the attitudes and perceptions of female cyclists from Canada and the United States. They used as input data an online survey and analyzed it through tree-based machine learning methods (e.g., bagging, random forests, and boosting) to select the most common motivations and concerns of these cyclists, and then they applied chi-squared and non-parametric tests to analyze differences between groups. The survey asked about aspects that could affect the decision of using a bicycle for transport or recreation such as cycling skills, attitude, perceptions of safety, and surrounding environment. Their results indicated that the most important factors for women to cycle for transport or recreation are the lack of bicycle facilities, cycling culture, the practicality of cycling, sustainability, and health. They also found that very few cyclists cycled by necessity, and that most cyclists preferred cycling in facilities that were separated from vehicular traffic (e.g., separated bicycle lanes or trails). Based on their results, they suggested that to enhance cycling rates, women’s safety should be improved by tailoring policy prescriptions for cyclists of different skill groups, investing in bicycle facilities, and building a cycling culture in communities and at the workplace.

1.4. Bayesian Networks Applied to Transport Employment

The involvement of women in transport-related jobs is much lower than the involvement of men. In 2020, only 22% of transport workers were women in the EU-27 [27]. The barriers underlying this low involvement have been analyzed in other studies [1,11,28] and include, among others, (i) sociocultural aspects related to the historical roles established for men and women in societies in which men have traditionally been seen as in charge of the family economy, and women have been viewed as in charge of taking care of the family; (ii) the increase in the percentage of women employed, a phenomenon that has produced new needs in the employment sector; and (iii) the fact that women tend to experience more harassment and feel more unsafe and unsecure than men when using public or private transport, and in their workplace. Society is progressing from this old perspective, but additional efforts should be made to change from this “antique organization of society” to an egalitarian society in which every person can have the same opportunities, without barriers, with the ability to feel free to make their own decisions, to work in what sector they want in a comfortable environment, with an employment system that can cover family needs related to care responsibilities, and to feel safe when developing their mobility needs.
Some computational methods can be found analyzing aspects influencing employment in the transport sector. Chen et al. [29] analyzed inter-city commuting decisions in Germany using machine learning techniques (i.e., linear regression, decision trees, and random forest). They analyzed the influence of gross domestic product (GDP), housing, and the labor market on the decision to commute, and reached the conclusion that access to employment opportunities, housing prices, income, and the distribution of the location’s industry sectors are important factors in commuting decisions. Moreover, different age, gender, and income groups have different commuting patterns.
Other machine learning methods have been used to analyze the role of gender in the transport sector. Luo et al. [30] analyzed the effects of transport infrastructure connectivity (TIC) on conflict resolution through dual machine learning using global conflict data from 2010 to 2017. Their results indicated that TIC, in addition to being a trade facilitator, could improve conflict resolution, gender employment, and income growth [30].
Regarding employment, Esser et al. [31] examined the impact of technological innovations (information and communication technology [ICT] and automation) on future professions and specializations in maritime and non-maritime jobs in the port of Antwerp, and identified the skills that need to be developed by education. They conducted a literature review, analyzed quantitative data on the characteristics of employment in the port, and performed a qualitative analysis through interviews. Regarding gender issues, they found that ICT introduction and automation would lead to the disappearance of a lot of middle-paying paperwork jobs, management jobs will become more and more complex with multi-skilling becoming a key, and there is a need to motivate and to host females and non-natives in the port job market.
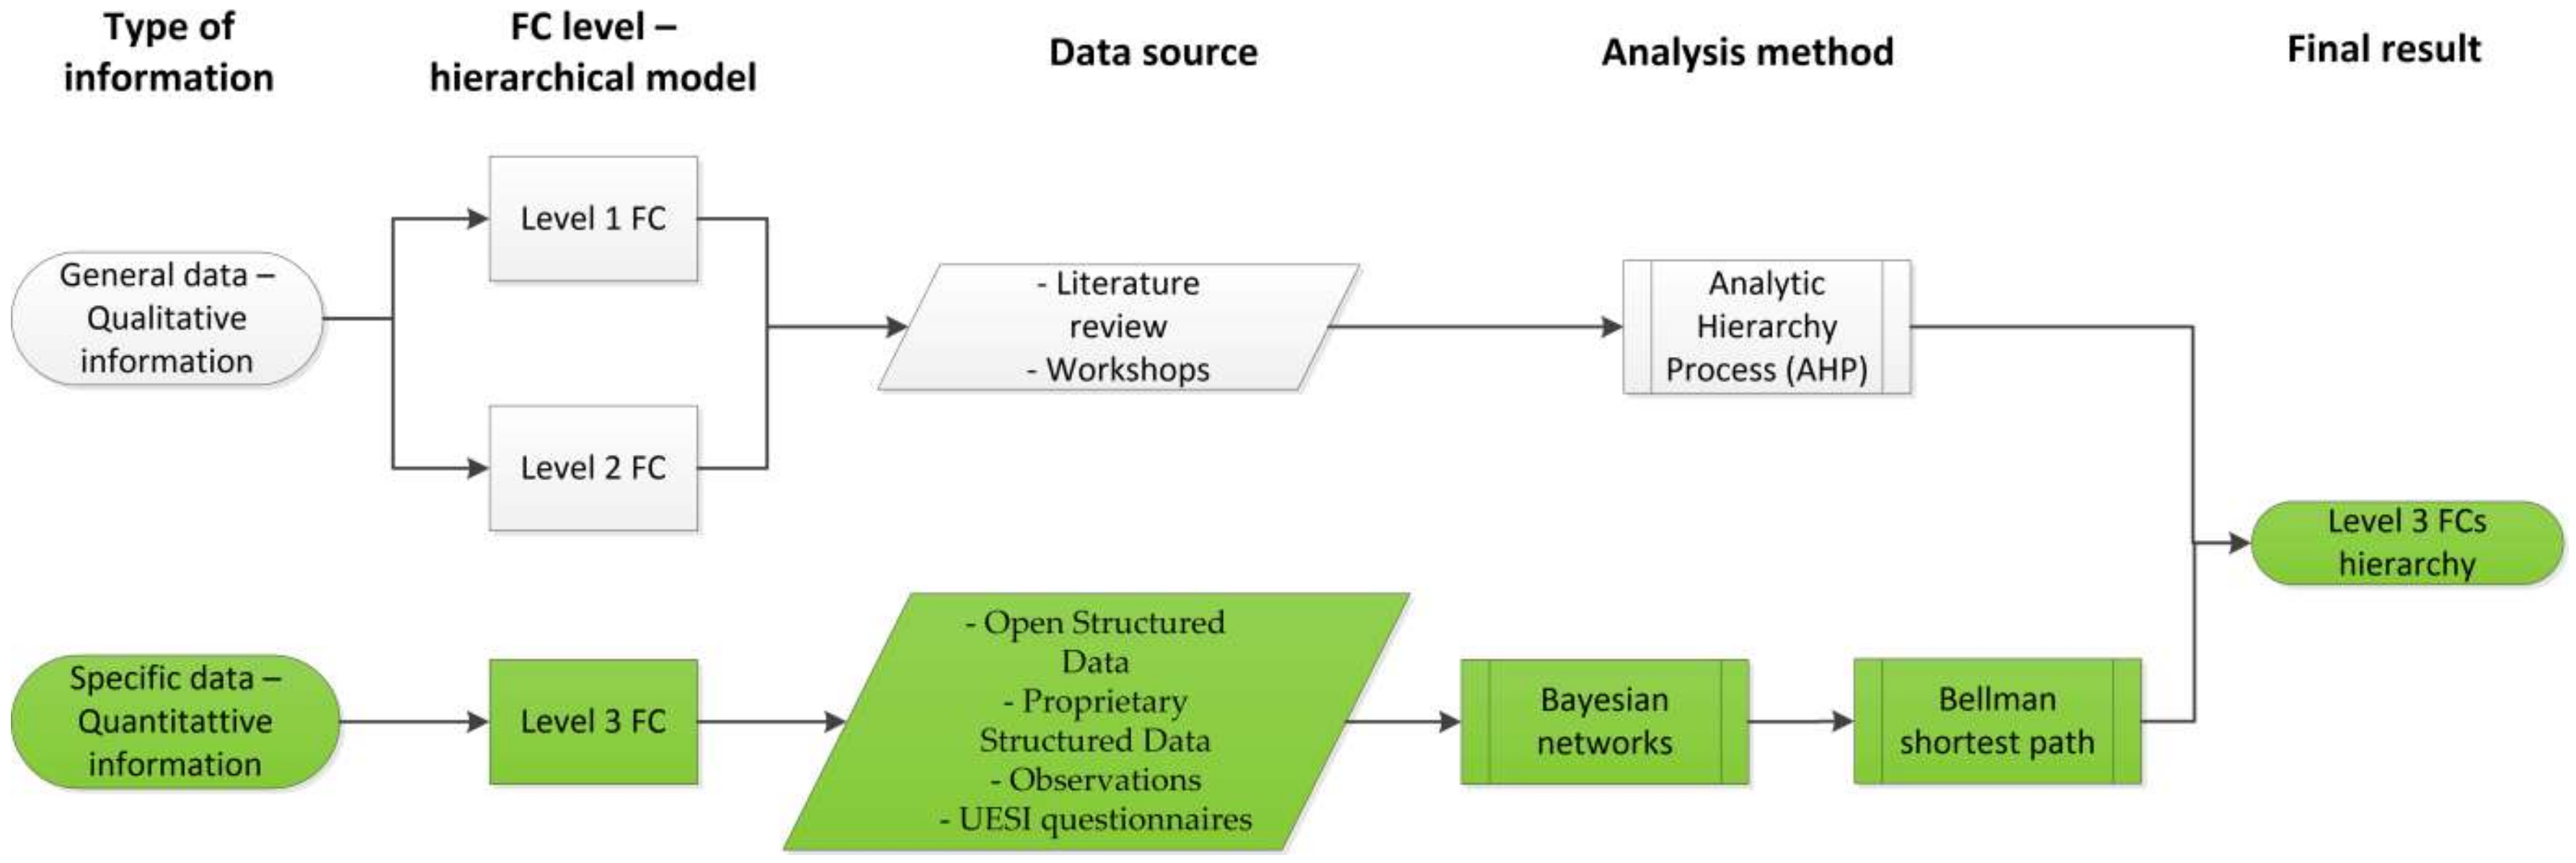
Our objective in this paper is to hierarchize the different factors that influence a fair transport system in four different transport scenarios or use cases (UCs): railway stations, autonomous vehicles (AVs), bicycle sharing systems, and employment in the transport sector. The novelty with previous work is that we do not focus the analysis in general aspects but rather go a step forward and define specific aspects that service providers or employers of transport companies can understand and develop measures to improve them, in fact some level 3 FCs are themselves a fairness measure to be implement in order to increase the fairness and inclusion in each use case from a gendered perspective. The hierarchization of these detailed aspects allows the development of actionable knowledge. To develop this study, we have gathered quantitative data and analyzed it through BNs. Hail and McQuaid [32] defined fairness for each of these transport scenarios. We previously defined a list of fairness characteristics (FCs) and prepared a hierarchical model with two levels of these FCs [1]. In this previous work, we analyzed general concepts as service availability, travel purpose, facilities, harassment, vehicle behaviour, job segregation, etc. In this paper, we analyzed more specific aspects that sometimes are by themselves measures to implement and what we call in this paper level 3 fairness characteristics, characteristics that further develop the level 2 FCs defined in [1]. We weighed level 1 and level 2 FCs using a multi-criteria decision-making method, the analytic hierarchy process (AHP) [33,34], used in a previous publication [35]. Levels 1 and 2 FCs are qualitative factors. In the case of level 3 FCs, each has been defined using one or more quantitative variables obtained by user satisfaction questionnaires, observations in railway stations and bicycle sharing docking stations, through simulation in an AV simulator, and through structured data sets from companies (railway and bicycle sharing companies involved in the DIAMOND project). We have analyzed the quantitative data obtained through these data collection tools by using BNs [36,37,38].

2. Materials and Methods

2.1. Hierarchy of Factors Influencing Gender Fairness

To hierarchize the different factors that influence a fair transport system in four different transport scenarios or UCs, we examined the AHP weights of level 1 and level 2 FCs [35] and combined them with those obtained through BN analysis for level 3 FCs. The combination of results from the AHP and BN analyses has been reported previously [38].
Figure 1 shows a scheme of the process we followed. The four UCs analyzed were: railway stations (UC 1), AVs (UC 2), bicycle sharing systems (UC 3), and employment in the transport sector (UC 4).
Level 3 FC weights were obtained through BN analysis. For that, each level 3 FC was assigned one or more variables that influence it (see Tables S1–S4, which show the level 3 FCs, their corresponding level 1 and level 2 FCs, and the variables included within each level 3 FC to be evaluated through BNs). Data for these variables were obtained from proprietary structured data, observations, and the Users and Employees Satisfaction Index (UESI) [39], and analyzed together through BNs to rank and to weigh all of the level 3 FCs. A total of 522 responses were analyzed for UC 1, 20 for UC 2, 201 for UC 3, and 165 for UC 4.

2.1.1. Building the Bayesian Network Model

A BN analysis was carried out, by using the free Julia programming language (version 1.0; https://julialang.org/ (accessed on 1 October 2021)) and by using the K2 algorithm and the Bellman–Ford algorithm.
The limitations of the method were overcome as follows: (i) to avoid the influence of the topological order of the variables in the K2 procedure, programming involved a random initial ordering in a high number of iterations (until the convergence of the likelihood of the network or the score was obtained); and (ii) to minimize the limitations of reaching local maximums, five hierarchies achieved after a sufficient number of iterations according to the convergence criterion were executed and averaged.
This computational solution allows the automation of the process to perform the analysis for different polyhedral individual (PI) profiles [40,41]. PI refer to the different characteristics of a person (i.e., age, gender, culture, family, religion, disability, economic level, sexuality, and appearance) that can influence their relation with the transport system as users or as workers of the sector [40,41,42].
We used the K2 metric (see Equation (1)) for the BN analysis to determine the dependencies among the different level 3 FCs for each UC for women. This algorithm analyzes the different combinations of responses among parent and child nodes to determine the network that provides the best results.
L = P B S , D = P B S · i = 1 n j = 1 q i r i 1 ! N i j + r i 1 ! · k = 1 r i N i j k !
  • P B S is the probability to obtain the network B S (initially all B S are considered to have the same probability, so P B S is 1/number of possible networks).
  • n is the number of variables.
  • r i is the number of possible values for each variable x i .
  • q i is the number of possible configurations of the parents (given the network B S ) of the variable x i . Parents are configured based on the following: If we consider a network B S where variable i has two parents, a configuration is the adoption of a specific value for each parent (e.g., 1 and 5).
  • N i j is the number of times that parents of variable i adopt a specific configuration j . For example, if we consider a network B S where the variable i has two parents, N i j will be the number of times that these parents have the configuration j or specific values (e.g., 1 and 5).
  • N i j k is the number of times that variable i adopts a specific value (e.g., 2) when the parent variables adopt the configuration j   (e.g., 1 and 5). For example, when the two parent variables adopt values 1 and 5, variable i adopts 2 times the value 2. In this case, N i j k = 2.
Using the logarithmic expression in Equation (1), we obtained what we called the Bayes score or K2 score (see Equation (2)). The use of logarithmic expression and of addition and subtraction operations results in computational run time savings.
B a y e s   s c o r e = l o g L = l o g P B S + i = 1 n j = 1 q i l o g r i 1 ! N i j + r i 1 ! + k = 1 r i l o g N i j k !
The Bayes score or K2 score can also be defined by using the logarithmic gamma function (lgamma; see Equation (3)), which is easier to use in computation.
B a y e s   s c o r e = l o g P B S + i = 1 n j = 1 q i l g a m m a r i l g a m m a N i j + r i + k = 1 r i l g a m m a N i j k + 1  
The main weakness of this K2 algorithm is the sensitivity to the initial order of nodes established by the user, a factor that can be reduced if the order is established by an expert [43]. We introduced a random high number of iterations with different node orders to overcome this drawback.
Algorithms developed to automate this process were based on the Bayesian learning of belief networks (BLN) method presented by Cooper and Herskovits [36], which includes the K2 learning algorithm with the K2 score. The K2 algorithm used can be found in a previous publication [44]. Table S5 includes a schematic of the computational solution in Julia for the K2 algorithm functions. The outputs obtained after this process were the directed acyclic graph (DAG), which shows the interdependencies between the probability distribution of different variables or nodes considered in the analysis, and the Bayes score of the obtained DAG, which is a metric that measures the fitness of each structure B S to represent these interdependencies based on the database (the graphical models obtained can be seen in Supplementary Materials, Figures S1–S4).
To learn the BN structure, the algorithm starts randomly from one variable, establishing it as main parent, and starts calculating probabilities following the K2 algorithm and calculating its Bayes score. This process is repeated for the number of iterations that the user introduces in the algorithm. For each UC, the number of iterations needed was identified by performing different tests and determining the number of iterations by which the Bayes score obtained varied by <0.10%. Figure 2 shows an example of the values obtained for UC 2, where the Bayes score reaches its maximum value with 5000 iterations.

2.1.2. Obtaining the Local Weights of Variables through Bayesian Networks and the Bellman–Ford Algorithm

To obtain the weights of each UC, the analysis was repeated five times with the number of iterations according to the method described above, obtaining five DAGs with their corresponding Bayes score. For each DAG, the Bellman–Ford algorithm was used to obtain the hierarchy of variables through the automatic identification of the shortest path to the main parent for each node [45,46]. The Bellman–Ford algorithm we used can be found in a previous publication [47]. The Bellman–Ford algorithm is a graph search algorithm to find the shortest route. Given a graph G V ,   E (directed or undirected), where V is the set of vertexes and E V × V is the set of edges, a source vertex S and a weight function w :   E R , the Bellman–Ford algorithm visits G and finds the shortest path to reach the source vertex S by a vertex V , taking into account the weight function of edges from V to S . In our case, the weight function of each edge connecting the different nodes of the DAG is the K2 score, which is used to find the shortest paths from all vertexes V (nodes in B S ) to a single source vertex S (main parent in B S ).
The pseudocode of the sequential algorithm in Julia can be seen in Figure S5. Figure S6 and Figure S7 show the code used to obtain the shortest path for each variable. The addition of all K2 scores to reach the main parent of B S following the shortest path according to this Bellman–Ford algorithm for a specific variable in B S is a distance associated with the importance of this BN variable. This distance indicates whether the probability distribution of this variable is influencing strongly or weakly the probability distribution of other variables. Specifically, the greater the distance, the lower the influence of this variable in the network. Figure 3 shows as an example of a simple graphical representation of four nodes, made by the main parent and three other vertexes, and the K2 scores associated with each of the arrows connecting the nodes. The distance of Vertex 3 according to the Bellman–Ford algorithm would be:
  • Option A: Distance = K2 Score 4 + K2 Score 3, if K2 Score 3 is ≤ K2 Score 1 + K2 Score 2;
  • Option B: Distance = K2 Score 4 + K2 Score 1 + K2 Score 2, if K2 Score 3 > K2 Score 1 + K2 Score 2.
An importance of 10 is assigned to the BN variable with the minimum distance and an importance of 1 to the BN variable with the maximum distance. The importance for the rest of variables is assigned by a linear interpolation (see Figure S8). The weight of each variable is obtained by normalizing the importance assigned to each one in a way that the addition is 1 (see Figure S9). Because the process is repeated five times, five different weights are obtained for each BN variable. These weights are averaged to obtain the final weight of each variable.

2.1.3. Combination of Bayesian Network Variables into Level 3 Fairness Characteristics

Some level 3 FCs are composed of several BN variables. Tables S1–S4 show the level 3 FCs and the BN variables included within each to be evaluated through BNs. Each FC has been codified in a way so that the first digit corresponds to the level 1 FC, the second digit corresponds to the level 2 FC, and the third and fourth digits correspond to the number of the level three FC within the level two FC; for those level three FCs with more than one variable, a letter (a, b, c, etc.) has been added at the end of the code. Therefore, the FC local weight of a level 3 FC with only one variable in the BN is the weight of that variable. However, the local weight of a level 3 FC with more than one variable is calculated by using the arithmetic mean of the variables. After completing this transformation between variable or node of the BN and the level 3 FC, the weights were normalized again so that the sum of all the weights was 1. Supplementary Word S1 shows the scripts used.

2.1.4. Combination of Bayesian Networks and Analytic Hierarchy Process Weights

Finally, the global weights of level 3 FCs were obtained by multiplying the local weight obtained by BNs and their corresponding level 1 and level 2 FC weights obtained in the AHP analysis, and normalizing the results. Level 1 and level 2 FC weights were obtained from a previous publication [35]. This combination of BN and AHP weights was automated by applying MATLAB R2020b to allow an intersectional analysis according to the different possible profiles defined in the PI [40,41].

2.2. Simulation through Inferences to Make Predictions

Transport service providers and employers could be interested in improving these most relevant factors to increase fairness in their organizations and in knowing how these improvements are affecting other factors (level 3 FCs). BNs were used to simulate by inferences the impact of a change in a BN variable on the others.
Inferences for each UC were made by sampling with the Bayesian model that best fit the data [48,49]; the best model was determined by calculating the AIC of each network [50] (see Equation (4) and Figure S10).
A I C = 2 k 2 ln L
In Equation (4), k is the number of BN variables in the model and L is the maximum likelihood function, which measures the goodness of fit of the BN model to a sample of data of the variables. It is formed from the joint probability distribution of the sample, but viewed and used only as a function of the parameters, thus treating the random variables as fixed at the observed values [50].
After selecting the Bayesian model with the lowest AIC, the development of the simulations allowed us to analyze how changes in one variable (e.g., instantiating the selected BN variable with the best score) influence on probabilities of the values of others. The code used to develop these simulations is shown in Figure S11. As an example, a change in a meaningful variable selected from the top 10 factors obtained after the application of BN and AHP is described for each of the UCs.

3. Results and Discussion

The results have been obtained by considering the data restricted to women as a homogeneous group. Further analysis could apply the same methodology and algorithms to different profiles of women according to the different characteristics shown in the PI approach [40,41].

3.1. Use Case 1: Railway Stations

3.1.1. Hierarchy of Factors to Improve Fairness in Public Railway Transport

Table 1 shows the top 10 factors or FCs from a total of 67 considered as most important for women after combining the results obtained for qualitative and quantitative information through AHP and BNs, respectively (see Figure 1). The results were obtained after performing five tests of 20 iterations each, calculating the weights using the Bellman–Ford algorithm and obtaining the average of the five tests. No more iterations could be done due to computer memory limitations when learning the structured network from the dataset through BNs. The computer used was an Intel Corei5 10th generation with 8 GB of RAM. The full list of weights for all level 3 FCs can be seen in Table S1.
In the first position (see Table 1), it appears that people prefer that the seating layout is implemented so that there is less social interaction. This is a safety and security factor within the level two FC of overcrowding and emergency situations. The modified seating would allow fewer interactions with people to increase comfort and the feeling of safety. However, being with many people could increase the probability that someone could help you in the case of an emergency situation, and this factor is also something to consider. The factor in the seventh position is also in line with this result. Offering adequate personal space would help women feel more comfortable and safer because there would be less harassment and undesired contact by other users of the transport system.
The second most important factor for using a railway service, and then to increase its usage by women in a fair way, is the provision by the station of on-demand transport services such as taxis and paratransit services that allow customers to reach destinations that do not have a predefined route using public transport services, or that allow them to reach the railway station from their origin. A good multimodal connection is also highlighted in the third most important factor. Integration of the railway station with alternative shared mobility services such as bicycle, scooter, and car sharing is seen as a very good option to connect the needs for last-mile connection with the medium to long distances covered by the railway service [51,52,53]. The more multimodal options and on-demand services are available, the higher the probability of connection with other areas, and then the higher the probability of using the station. In addition to the number of modes available and areas that are connected with the station, it is also crucial that the service modes are reliable.
Accessibility of the service and safety are the two most important main criteria that influence a fair rail transport system; both of them have a very similar weight. The analysis revealed that women consider building a fair rail transport system and increasing its use requires the availability of hospitality rooms where they can ask for help in case of any aggression or other help needed when using the rail transport system. This type of action would make women feel that someone can support them in case any problem arises, help them in the case of any problem, and it would also make aggressors and pickpockets think twice before acting. Consistently, the sixth factor on the list also indicates that the availability of helpline numbers and their advertisement would improve and help in building a fair rail transport system.
The number and typologies of incidents influence the use of a station by women and the development of a fair transport system. If there is a station with more episodes of harassment of women, they would tend to not use that station.
Finally, comfort and safety conditions within the station are also critical for its use. Improved ventilation and air-conditioning would help users feel comfortable in the station. Moreover, in an emergency situation such as a fire, good ventilation could help eliminate harmful gases and reduce stress and hot conditions when there are a large number of people using the facility at the same time.

3.1.2. Simulation of Improvements in Public Railway Transport

From the five tests developed with 20 iterations, the Bayesian model with the lowest AIC (40207), and consequently the best fit to predict values from the dataset, was selected to carry out the simulation. The Bayesian model with this AIC can be seen in the Supplementary Materials.
From the top 10 FCs for UC 1, the first two fairness characteristics (FC323 and FC118) could not be simulated because the most probable values are the maximum possible. For FC117, the maximum satisfaction is represented by an improvement in the walking time from the points of interest to the public transport access points from a most probable value of 2 to 3. This outcome is because the most probable value for the variable FC117 does not belong to maximum satisfaction. This improvement in the satisfaction score could be achieved, for example, by adding information indicating how to access key points, improving station surroundings to be more comfortable, or engaging with local transport services to provide maps and additional information to travelers. This improvement would impact the probabilities of the other top 10 FCs, related to the UESI, as shown in Table 2. This table includes the probabilities of getting low values (from 1 to 4, on a scale up to 8) and high values (from 5 to 8) on the UESI considering the most probable value for FC117 according to the current database (a score of 2 in this case), as well as the probabilities after setting FC117 to the maximum satisfaction score registered in the database (3). An increase in the satisfaction with the walking time from the points of interest to the public transport access points seems to be related to greater satisfaction with the number of services available within the transport infrastructure (with a 0.116 increase in the probability of getting a high score), with greater reliability in the service modes available (with a 0.047 increase in the probability of getting a high score), and with the level of service at the public transport access points (with a 0.088 increase in the probability of getting a high score). In addition, when increasing the maximum value of FC117 from 2 to 3, people with the greatest satisfaction with the walking time to points of interest also evaluate higher their satisfaction with improving the seating layout so there is less social interaction (with a 0.140 increase in the probability of getting a high score).

3.2. Use Case 2: Autonomous Vehicles

3.2.1. Hierarchy of Factors to Improve Fairness in Autonomous Vehicles

From a total of 103 level 3 FCs identified, Table 3 presents the top 10 most important factors identified as most influential in the acceptance of AVs by women. The results were obtained after performing five tests of 5000 iterations each, which was the number of iterations at which the Bayes scores obtained vary by <0.10%. At this point a convergence has been reached, and the weights were calculated using the Bellman–Ford algorithm to obtain the average of the five tests.
The top factor is the perception that an AV is safer than the use of a conventional car. People answering the UESI rated this factor higher than the others, and the BN model combined with the AHP results showed that this perception has a strong influence on the other factors. Specifically, if people do not feel AVs are a safer transport system, then the change from conventional cars to AVs would not happen or would be much more difficult. The second factor is the perception of reduced safety of AVs, which, as the opposite of the top factor, appears to be contradictory. However, it just marks the fact that the population is unsure whether AVs are safer than conventional cars; this uncertainty has a strong impact on the other factors influencing the use of AVs and, ultimately, on their acceptance.
The third to sixth factors show a very small difference in weight, so they can be considered to have similar importance. This group of factors includes a perception of reducing the ecological impact of the use of cars due, for example, to higher efficiency in accelerations and decelerations and thus optimized driving [35,54]. Other safety factors included in the top 10 list are a perception of a reduction in accidents; feeling comfortable and trusting the system when sharing data with others, including other users of the transport system and the infrastructure; a reduction in accidents thanks to the use of AVs; and the perception of safety in any conditions. The seventh factor refers to feeling happy when traveling in AVs without a steering wheel. For this point, 62.5% of the responses showed people do not place special importance on the steering wheel while 22.5% rated it high, indicating that they would be happy in an AV without a steering wheel, and 15% indicated that they would not feel good in a vehicle without a steering wheel. Other advantages that can increase the acceptance of AVs by women are improved traffic management due to their use, easier training needs and then easier access and use of the vehicle, and the fact that they would be able to perform additional tasks while driving, a phenomenon termed simultaneity.

3.2.2. Simulation of Improvements in Autonomous Vehicles

Of the five tests developed with 5000 iterations, the BN model with the lowest AIC (1410) was used for the simulation (the graphical model can be found in Supplementary Materials). From the top 10 FCs for this UC, the first five could not be improved because the most probable values are the maximum possible. For FC112, related to the perception of safety in any driving conditions, considering that AVs are safer than conventional cars, the most probable value was changed from 4 to 8, which represents the maximum level of satisfaction. This improvement would impact the probabilities of the other top 10 FCs, related to the UESI, as shown in Table 4. An increase in the agreement to this statement would produce, as expected, an increase in the perception of the safety of AVs, with an increase of 0.05, a corresponding decrease of 0.25 in the perception of reduced safety of AVs, and an increase of 0.04 in the comfort of sharing data with others. In the latter case, potential users would understand that sharing data is a way to increase their safety, and they would see this sharing as a positive factor. In addition, those people who evaluated higher the perception of safety of AVs would also feel better and would be more satisfied with the fact that the car does not have a steering wheel, with an increase of 0.09. On the other hand, if people evaluated higher the perception of safety, they would evaluate lower the perception of reducing the ecological impact of cars when comparing AVs with conventional cars. More surprisingly, even if they considered AVs safer compared with conventional cars, this would not translate into an increase in the perception of reduction in accidents when using AVs. On the contrary, the scores obtained for the statement “AVs will reduce the accident rate” are lower, with a 0.25 increase in the probability of lower scores. Something similar happens with perception of improved traffic management; there is a 0.08 increase in the probability of lower values. Finally, the changes in probabilities are very low when evaluating easier training needs and simultaneity.

3.3. Use Case 3: Bicycle Sharing Stations

3.3.1. Hierarchy of Factors to Improve Fairness in Bicycle Sharing Stations

Table 5 shows the top 10 factors or FCs from a total of 69 considered as most important for women after combining the results obtained for qualitative and quantitative information through AHP and BNs, respectively. The results were obtained after performing five tests of 500 iterations each, which was the number of iterations at which the Bayes scores vary by <0.10%. At this point a convergence has been reached, and the weights were calculated using the Bellman–Ford algorithm to obtain the average of the five tests.
The top four most important factors or FCs that influence women regarding the use of a bicycle sharing station depend on the weather and topography of the area and how to deal with it. First, when possible, it is better to develop cycling networks by avoiding hilly terrain. In addition, more people would consider the use of electric bicycles if there is hilly terrain when this type of bicycle is included in the shared fleet. The development of weather-friendly infrastructure when possible would improve cycling conditions and the willingness of women to use bicycle sharing schemes. This could be improved through the development of, for example, sheltered paths that could help in the case of rainy and very sunny conditions as well as making rain ponchos available for use when raining, perhaps through the incorporation of vending machines selling ponchos in the stations.
The fifth through eighth factors refer to social and personal constraints. Three of them consider the need to make modifications to allow traveling with children. These include having bicycles with child seats and trailers that allow carrying kids as well as carting cargo; availability of educational courses on cycling with children and cargo; and the development and/or identification of safe cycling routes when cycling with children. Another measure that could help increase of the use of the bicycle sharing system by women would be the availability of end-of-trip cycling facilities (e.g., toilets, changing rooms). These facilities would allow users to, for example, tidy themselves up before reaching their final destination or attending a meeting on a very hot day.
The ninth factor includes the presence of sheltered docking stations. Currently, most docking stations are not sheltered because the user would only spend a short time in the station. However, mainly in rainy countries, a sheltered station would keep the seats of the bicycles drier. Finally, the tenth most important factor is the need to develop better and safer cycling facilities to encourage cycling with children, so that the use of bicycles is seen as a safe transport option.

3.3.2. Simulation of Improvements of Bicycle Sharing Stations

From the five tests developed with 500 iterations, the BN model with the lowest AIC (22175) can be found in Supplementary Materials. In this case, we evaluated as an example FC412 because it is the top-ranked FC. In this case, people in the questionnaire evaluated the statement “Hilly terrains along cycling routes significantly deter me from cycling”; lower values of this statement would mean a positive evaluation of the statement and thus the need of an improvement. In this case, the average value before the investment was 4; therefore, the improvement was analyzed by instantiating the value 2. Table 6 lists the changes in the probabilities considering the current situation and the simulation improvement so that hilly terrains would not be a barrier to using the bicycle sharing system. The results showed that improving this FC does not lead to a higher presence of electric bicycles in the bicycle sharing fleet or the availability of accessories for cycling with children or goods, because in most cases ponchos or electric bicycles were not available in the bicycle sharing system used. FC422 was evaluated with the statement “Weather such as rain and extreme cold significantly affect my rate of cycling and bike share use”; low values are desirable in this case. When simulating that all people considered hilly terrain does not affect whether they cycling, there was an improvement of 0.11 in their perception that weather does not affect whether they use the bicycle sharing system. Therefore, people not affected by the hilly terrain tend to evaluate better the use of bicycles with bad weather.
FC332 was evaluated through the statement “The existing cycle infrastructure is socially accepted to provide a safe environment for cycling with children.” A decrease in the FC412 score and then an increase in feeling comfortable when cycling in hilly terrain increased FC332 by 0.04. As expected, the model indicates that if the routes do not have hilly terrain or if there are measures to make it more comfortable, it would be more suitable for cycling with children. In addition, those evaluating better cycling in hilly terrain evaluated higher the availability of end-of-trip cycling facilities (FC321), with an increase of 0.04. However, this improvement in FC412 did not produce significant improvement in FC312, which evaluated whether cycling facilities are sufficient, safe, and adjusted to the needs of cycling with children.

3.4. Use Case 4: Employment in the Transport Sector

3.4.1. Hierarchy of Factors to Improve Fairness in Transport Employment

Table 7 shows the top 10 factors or FCs from a total of 71 considered as most important for women after combining the results obtained for qualitative and quantitative information through AHP and BNs, respectively. The results were obtained after performing five tests of 1000 iterations each, which was the number of iterations at which the Bayes scores obtained vary by <0.10%. At this point a convergence has been reached, and the weights were calculated using the Bellman–Ford algorithm to obtain the average of the five tests.
The top two factors are related to socioeconomic conditions. To increase the participation of women in transport-related jobs, first, employment opportunities should be widely advertised and all the applications must be welcomed without bias, in a fair way—for example, using blind curriculum vitae. This issue has also been highlighted in previous research. Keinert-Kisin [55] analyzed the impact of stereotypes in the organizational context and conducted a personnel selection experiment for a “masculine”-type profession. In her study, women and men who asserted themselves as highly qualified for the position were evaluated in two ways: without knowing their gender and knowing it. When recruiters were unaware of the applicant’s gender, women were accurately identified as qualified talent and selected for a job interview. However, once recruiters recognized applicants by gender, women faced significantly worse chances to be selected compared with a gender-blind setting. In addition, selection arguments of recruiters made it clear that women’s personal and functional qualities were overlooked once they were identified as women, and also some highly qualified women were considered worse than less qualified male competitors. Hence, women’s talent and suitability for some job positions are overlooked due to gender bias. This unconscious bias or stereotypical thinking needs to be solved through fairer selection processes to develop fair employment in the transport sector as well as other types of positions that have been traditionally considered for men. In line with this view is the FC in the fifth position. Companies should ensure in the human resources (HR) procedures that all the employment decisions are based on objective issues related to the job and not based on prejudices. In addition, because this is a social aspect and many times discrimination is done unconsciously, training at work for both men and women should be implemented, with the aim of dealing with these cultural stereotypes associated with women and specific roles and tasks in the transport sector.
The second factor, although with a weight very similar to the first factor, is the development of family-friendly policies, including aspects of maternity and paternity leave, more adjusted to family needs. The third FC is also related to family needs. Transport companies should give the opportunity to change shifts or to reduce the working time of those with small children so they can balance work and family life. Related to having a balance between work and family, human resources policies and job conditions should offer the possibility of part-time work, flexible working hours, or working from home. They should also consider procedures to allow some leave for caring responsibilities.
Another factor to develop a fair transport sector that is more attractive for women is to consider and make all jobs suitable for men and women as well as fomenting an equal balance between genders across all occupations and at all levels in the company. Indeed, within the top 10 FCs to have a fair transport system is to ensure gender pay equality for equivalent positions.
Another factor is related to safety and security of women in some transport-related jobs were they could experience harassment or any other undesired action. To make these type of positions more attractive for women, there should be security staff that could intervene in the case of need (for example, in the public transport system, or in rest areas or parking for truck drivers).

3.4.2. Simulation of Improvements in Transport Employment

From the five tests developed for 1000 iterations, a graphical representation of the BN model with the lowest AIC (18073) is shown in Supplementary material. From the top 10 FCs for UC 4, the top three do not have room for improvement because the most probable values are the maximum possible. For FC111, related to the availability, suitability, and gender balance at all levels of transport jobs, the average value was a 5. It could be improved, for example, through the inclusion in HR policies and Corporate Social Responsibility (CSR) protocols of blind recruitment processes, the availability of suitable personal equipment for both genders, and fostering an equal balance of men and women in all occupations. For the simulation, it was instantiating as 8. This improvement would impact the probabilities of the other top 10 FCs as shown in Table 8.
The results showed an improvement in gender equality and work conditions translated by a 0.04 increase in the probability of satisfaction with the fact that employment decisions are based on objective issues related to the job (FC125) and a 0.03 increase in the probability of satisfaction with the possibility of working part-time work, flexible working hours, or working from home (FC316). This result is expected because both recruitment and promotion based only on objective decisions and flexible working conditions contribute toward building an egalitarian and suitable employment environment considering personal needs. FC112 is related to how much workers agree with the need of having specific training that allows changing cultural stereotypes associated with women and specific roles and tasks in the transport sector. The results showed that a more egalitarian and suitable working environment in transport does not influence directly the perception that specific training is needed to avoid unconscious bias and predefined ideas about the roles or work positions of women in the transport sector.

4. Conclusions

We have presented a methodology to hierarchize and to predict factors influencing gender fairness in the transport system by applying BNs.
In addition, we have also presented computational solutions to automate algorithms underlying the methodology in this work. These solutions would allow additional analysis for specific profiles of women according to the PI approach [43,44].
For UC 1, to develop fairer railway transport in which women would feel more comfortable and safer and increase the use of railways, efforts should focus on improving the layout of seating to reduce social interaction and increase personal space, increasing the availability of on-demand services as well as integrating shared mobility services for last-mile connections, building hospitality rooms or help points for users in case of aggression or need, advertising helpline numbers as well as promoting campaigns to reduce incidents, and finally increasing the availability and the reliability of the different service modes available at the station.
In UC 2, to increase the acceptance of AVs by women, efforts should focus first on increasing the users’ perception of safety of these vehicles. The use of AVs could reduce environmental impact and help build a more sustainable society. In different studies, women have shown that they are more concerned with the environment than men, and this factor could lead them to accept the use of AVs, and also increase their perception that using AVs could reduce accidents. Other issues to deal with are data security, so that personal data and control of the car do not get into the wrong hands, the fact that less training would be needed to use AVs, and the fact that using AVs will permit doing additional things while the car drives by itself (e.g., watching a film or working on a laptop). An improvement in the perception of the safety of AVs in any driving conditions would be translated into an increase in the satisfaction with the safety of AVs and an increase in the comfort of sharing data with others.
For UC 3, to increase the use of bicycle sharing stations by women, the FCs with the highest priority or influence concern aspects such as developing cycling networks that avoid hilly terrain as much as possible, the introduction of electric vehicles to make travel easier, developing weather friendly infrastructure, as well as making rain ponchos available. Other factors consider family responsibilities and include bicycles with child seats and trailers for carrying kids and carting cargo, education on cycling with children and cargo, development of safe routes when cycling with children, and incorporating end-of-trip cycling facilities in the stations. When selecting only those people who consider that a route including hilly terrain does not deter them from using the bicycle, there was a higher percentage of people evaluating more positively cycling in rainy or bad weather conditions as well as the presence of end of trip facilities compared with the overall sample. We noted the same outcome with the perception of having a safe cycling network for cycling with children: If the routes do not have hilly terrain or if there are measures to make it more comfortable, it would be more suitable for cycling with children.
Inclusion of women in the transport sector is very low. The results showed that to enhance the employment of women in the transport sector, first, recruitment processes should be fair, with all positions advertised widely and all the applications welcomed no matter the sociodemographic characteristics of the person applying for the position (e.g., blind CV), ensuring that employment decisions are based on objective issues related to the job. Measures should also focus on reducing the gender gap, ensuring gender pay equality for equivalent positions, and achieving a more equal balance between genders across all occupations and levels (e.g., through new HR policies and CSR protocols). Family-friendly policies should also be developed to provide more support to maternity and paternity leave, flexible working conditions, and allow leave for taking care of the family. The presence of security staff in some positions that are in greater contact with people and in which the probability that women could be harassed is higher would increase the perception of safety and would provide women with support. Finally, because the low presence of women in transport-related jobs is a result of the societal perceptions, special training should be developed for both women and men to negate cultural stereotypes associated with women and specific roles and tasks associated with men in the transport sector.
Future studies should focus on exploring other predictive methods to compare the results regarding the simulation and to validate these conclusions. Moreover, this same methodology and algorithms should be applied to filtered datasets to examine specific profiles of women to conduct an intersectional analysis and draw conclusions that go beyond considering women as a homogeneous group.

Supplementary Materials

The following material is available online at https://www.mdpi.com/article/10.3390/su132011372/s1. Excel S1. Ranking of BN variables and FCs for the four UCs. Table S1. BNs variables and hierarchical model (level 1, 2 and 3) of fairness characteristics analyzed for use case 1 railway stations. Weights (w) are included between parenthesis, normalized weights for level 1 and 2 FC, and global normalized weights for level 3. Table S2. BNs variables and hierarchical model (level 1, 2 and 3) of fairness characteristics analyzed for use case 2 autonomous vehicles. Weights (w) are included between parenthesis, normalized weights for level 1 and 2 FC, and global normalized weights for level 3. Table S3. BNs variables and hierarchical model (level 1, 2 and 3) of fairness characteristics analyzed for use case 3 bicycle sharing stations. Weights (w) are included between parenthesis, normalized weights for level 1 and 2 FC, and global normalized weights for level 3. Table S4. BNs variables and hierarchical model (level 1, 2 and 3) of fairness characteristics analyzed for use case 4 employment in the transport sector. Weights (w) are included between parenthesis, normalized weights for level 1 and 2 FC, and global normalized weights for level 3. Table S5. K2 algorithm with K2 score code in Julia (adapted from [45]). Word S1. Code used to convert BN variables into FCs. Figure S1. UC1_AIC_40207 model. Figure S2. UC2_AIC_1410 model. Figure S3. UC3_AIC_ 22175 model. Figure S4. UC4_AIC_18073 model. Figure S5. Bellman-Ford algorithm reproduced from [46]. Figure S6. Shortest path function using Bellman-Ford algorithm [48]. Figure S7. Obtainment of shortest path. Figure S8. Code of the weight function used to interpolate. Figure S9. Source code for the translation from shortest path scores into BNs variables weights in Julia through normalization. Figure S10. Julia code to calculate the AIC score of a Bayesian Network graph. Figure S11. Development of inferences in Julia, using as an example FC132b Bayesian network variable and assigning to it a value of 1.

Author Contributions

Conceptualization, G.D.M., F.E.S., M.C.L. and S.P.-R.; methodology, G.D.M., F.E.S., M.C.L., E.G.-J. and S.P.-R.; software or computational analysis, A.K.M. and F.E.S.; formal analysis, S.P.-R. and F.E.S.; investigation, G.D.M., S.P.-R., F.E.S., E.G.-J. and A.K.M.; resources G.D.M. and F.E.S.; data curation E.G.-J., S.P.-R. and A.K.M.; writing—original draft preparation, S.P.-R.; writing—review and editing, G.D.M., F.E.S. and S.P.-R.; visualization, S.P.-R.; supervision, F.E.S., G.D.M. and S.P.-R.; project administration, G.D.M. and F.E.S.; funding acquisition, F.E.S., M.C.L., G.D.M. and S.P.-R. All authors have read and agreed to the published version of the manuscript.

Funding

This research was funded by the European Horizon 2020 program within the DIAMOND project, grant number 824326.

Institutional Review Board Statement

The study was conducted according to the guidelines of the Declaration of Helsinki, and approved by the Ethics Committee of DIAMOND project (on 29 July 2019 for UESI questionnaires and on 11 July and 18 November 2019 for observations data for use case 1 and 3 respectively).

Informed Consent Statement

Informed consent was obtained from all subjects involved in the study.

Data Availability Statement

The data presented in this study are available on request from the corresponding author. The data are not publicly available due to a privacy statement was included in the consent form signed by the people participating in the study.

Acknowledgments

The authors want to thank all DIAMOND project partners involved in the dissemination of the UESI and the collection of data, and especially Wave and Genre&Ville (France); SYS (France); STIR and ENU (Scotland); TUDublin (Ireland); ZTM (Poland); and EUT, FGC, IBV, and AITEC (Spain). Proof-reading process and processing charges were co-funded by the regional funding ITATUT/2021/10 from IVACE, supported by the European Regional Development Funds (FEDER).

Conflicts of Interest

The authors declare no conflict of interest.

References

  1. García-Jiménez, E.; Poveda-Reyes, S.; Molero, G.D.; Santarremigia, F.E.; Gorrini, A.; Hail, Y.; Ababio-Donkor, A.; Leva, M.C.; Mauriello, F. Methodology for gender analysis in transport: Factors with influence in women’s inclusion as professionals and users of transport infrastructures. Sustainability 2020, 12, 3656. [Google Scholar] [CrossRef]
  2. Hanson, S. Gender and mobility: New approaches for informing sustainability. Gender Place Cult. 2010, 17, 5–23. [Google Scholar] [CrossRef]
  3. Duchène, C. Gender and transport. OECD. Int. Transp. Forum 2011, 11, 1–18. [Google Scholar] [CrossRef]
  4. Hudson, C. Sharing fairly? Mobility, citizenship, and gender relations in two Swedish city-regions. J. Urban Aff. 2018, 40, 82–97. [Google Scholar] [CrossRef] [Green Version]
  5. Miralles-Guasch, C.; Melo, M.M.; Marquet, O. A gender analysis of everyday mobility in urban and rural territories: From challenges to sustainability. Gender Place Cult. 2015, 23, 398–417. [Google Scholar] [CrossRef]
  6. French, E.; Strachan, G. Evaluating equal employment opportunity and its impact on the increased participation of men and women in the transport industry. Transp. Res. Part A Policy Pract. 2009, 43, 78–89. [Google Scholar] [CrossRef] [Green Version]
  7. European Commission. Business Case to Increase Female Employment in Transport; EU Publications: Brussels, Belgium, 2018. [Google Scholar]
  8. Turnbull, P. Working Paper No. 298—Promoting the Employment of Women in the Transport Sector—Obstacles and Policy Options; International Labour Office: Geneva, Switzerland, 2013. [Google Scholar]
  9. Lodovici, M.; Orlando, N.; Loi, D.; Drufuca, S.M.; Orlando, N.; Pesce, F.; Greve, B.; Eydoux, A.; Grabarek, M.; Przybysz, I.; et al. Discrimination and Access to Employment for Female Workers with Disabilities; Hamers, L., Ed.; European Union: Brussels, Belgium, 2017; pp. 29–83. [Google Scholar]
  10. Kurshitashvili, N. Promoting women’ s employment in the transport sector. In Proceedings of the ADB Conference: Gender in Urban Governance and Transport, Tbilisi, Georgia, 24–25 April 2018; Available online: https://k-learn.adb.org/system/files/materials/2018/04/201804-facilitating-women-s-employment-transport-sector.pdf (accessed on 8 September 2021).
  11. Kurshitashvili, N.; Isik, G. Lifting Legal Barriers on Women’s Employment: How it Impacts Ukraine’s Logistics and Transport Sector. Available online: https://blogs.worldbank.org/europeandcentralasia/lifting-legal-barriers-women-s-employment-how-it-impacts-ukraine-s-logistics-and-transport-sector (accessed on 3 July 2019).
  12. European Transport Workers’ Federation. UITP Joint Recommendations: Strengthening Women Employment in Urban Public Transport 2014. Available online: https://www.etf-europe.org/resource/uitp-etf-joint-recommendations-on-womens-employment-in-upt/ (accessed on 8 September 2021).
  13. Spirtes, P.; Glymour, C. An algorithm for fast recovery of sparse causal graphs. Soc. Sci. Comput. Rev. 1991, 9, 62–72. [Google Scholar] [CrossRef] [Green Version]
  14. Schwarz, G. Estimating the dimension of a model. Ann. Stat. 1978, 6, 590–606. [Google Scholar] [CrossRef]
  15. Scutari, M.; Graafland, C.E.; Gutiérrez, J.M. Who learns better Bayesian network structures: Accuracy and speed of structure learning algorithms. Int. J. Approx. Reason. 2019, 115, 235–253. [Google Scholar] [CrossRef] [Green Version]
  16. Bermejo, I.; Oliva, J.; Díez, F.J.; Arias, M. Interactive learning of Bayesian networks using OpenMarkov. In Proceedings of the Sixth European Workshop on Probabilistic Graphical Models PGM 2012, Granada, Spain, 19–21 September 2012; pp. 27–34. [Google Scholar]
  17. International Transport Forum. Women’s Safety and Security: A Public Transport Priority; OECD Publishing: Paris, France, 2018. [Google Scholar]
  18. Harvey, J.; Thorpe, N.; Caygill, M.; Namdeo, A. Public attitudes to and perceptions of high speed rail in the UK. Transp. Policy 2014, 36, 70–78. [Google Scholar] [CrossRef] [Green Version]
  19. Nguyen, T.; Nguyen-Phuoc, D.Q.; Wong, Y.D. Developing artificial neural networks to estimate real-time onboard bus ride comfort. Neural Comput. Appl. 2021, 33, 5287–5299. [Google Scholar] [CrossRef]
  20. Balkmar, D. Violent mobilities: Men, masculinities and road conflicts in Sweden. Mobilities 2018, 13, 717–732. [Google Scholar] [CrossRef]
  21. Payre, W.; Cestac, J.; Delhomme, P. Intention to use a fully automated car: Attitudes and a priori acceptability. Transp. Res. Part F Traffic Psychol. Behav. 2014, 27, 252–263. [Google Scholar] [CrossRef] [Green Version]
  22. Febres, J.D.; Mohamadi, F.; Mariscal, M.A.; Herrera, S.; García-Herrero, S. The role of journey purpose in road traffic injuries: A Bayesian network approach. J. Adv. Transp. 2019, 2019, 1–10. [Google Scholar] [CrossRef]
  23. Catalina, C.A.; García-Herrero, S.; Cabrerizo, E.; Herrera, S.; García-Pineda, S.; Mohamadi, F.; Mariscal, M.A. Music distraction among young drivers: Analysis by gender and experience. J. Adv. Transp. 2020, 2020, 6039762. [Google Scholar] [CrossRef]
  24. Ji, Y.; Fu, P.; Blythe, P.T.; Guo, W.; Wang, W. An examination of the factors that influence drivers’ willingness to use the parking guidance information. KSCE J. Civ. Eng. 2015, 19, 2098–2107. [Google Scholar] [CrossRef]
  25. Aman, J.J.C.; Smith-Colin, J.; Zhang, W. Listen to E-scooter riders: Mining rider satisfaction factors from app store reviews. Transp. Res. Part D Transp. Environ. 2021, 95, 102856. [Google Scholar] [CrossRef]
  26. Le, H.T.; West, A.; Quinn, F.; Hankey, S. Advancing cycling among women: An exploratory study of North American cyclists. J. Transp. Land Use 2019, 12, 355–374. [Google Scholar] [CrossRef] [Green Version]
  27. Eurostat. Employment by Sex, Age and Economic Activity (from 2008 Onwards, NACE Rev.2)-1000. Available online: http://appsso.eurostat.ec.europa.eu/nui/submitViewTableAction.do (accessed on 1 July 2021).
  28. Turnbull, P.; Lear, J.; Thomas, H. Women in the Transport Sector—Promoting Employment by Preventing Violence against Women Transport Workers; International Labour Office: Geneva, Switzerland, 2013. [Google Scholar]
  29. Chen, H.; Voigt, S.; Fu, X. Data-driven analysis on inter-city commuting decisions in Germany. Sustainability 2021, 13, 6320. [Google Scholar] [CrossRef]
  30. Luo, J.; Wang, G.; Li, G.; Pesce, G. Transport infrastructure connectivity and conflict resolution: A machine learning analysis. Neural Comput. Appl. 2021, 5, 1–17. [Google Scholar] [CrossRef]
  31. Esser, A.; Sys, C.; Vanelslander, T.; Verhetsel, A. The labour market for the port of the future: A case study for the port of Antwerp. Case Stud. Transp. Policy 2020, 8, 349–360. [Google Scholar] [CrossRef]
  32. Hail, Y.; McQuaid, R. The concept of fairness in relation to women transport users. Sustainability 2021, 13, 2919. [Google Scholar] [CrossRef]
  33. Saaty, T.L. The Analytic Hierarchy Process, Planning, Priority Setting, Resource Allocation; McGraw-Hill: New York, NY, USA, 1980. [Google Scholar]
  34. Saaty, T.L. The analytic hierarchy and analytic network processes for the measurement of intangible criteria and for decision-making. In Multiple Criteria Decision Analysis: International Series in Operations Research & Management Science; Greco, S., Ehrgott, M., Figueira, J., Eds.; Springer: New York, NY, USA, 2016; Volume 233, pp. 363–419. [Google Scholar]
  35. Poveda-Reyes, S.; Malviya, A.K.; García-Jiménez, E.; Molero, G.D.; Leva, M.C.; Santarremigia, F.E. Application of mathematical and computational methods to identify women’s priorities in transport. Sustainability 2021, 13, 2845. [Google Scholar] [CrossRef]
  36. Cooper, G.F.; Herskovits, E. A Bayesian method for the induction of probabilistic networks from data. Mach. Learn. 1992, 9, 309–347. [Google Scholar] [CrossRef]
  37. Gámez, J.A.; Mateo, J.L.; Puerta, J.M. Learning Bayesian networks by hill climbing: Efficient methods based on progressive restriction of the neighborhood. Data Min. Knowl. Discov. 2011, 22, 106–148. [Google Scholar] [CrossRef]
  38. Molero, G.D.; Santarremigia, F.E.; Poveda-Reyes, S.; Mayrhofer, M.; Awad-Núñez, S.; Kassabji, A. Key factors for the implementation and integration of innovative ICT solutions in SMEs and large companies involved in the multimodal transport of dangerous goods. Eur. Transp. Res. Rev. 2019, 11, 28. [Google Scholar] [CrossRef]
  39. Gorrini, A.; Bruce, C.; Hail, Y.; Albarrilla Alonso, C.; Carcía, E.; Santarremigia, F.; Ozbolt, M.; Mateo, B.; Recio Naranjo, L. DIAMOND Project D4.1 Datasets Description. 2021. Available online: https://diamond-project.eu/download/d4-1-datasets-description-full-paper/ (accessed on 8 September 2021).
  40. Santarremigia, F.E.; Molero, G.D.; Poveda-Reyes, S.; Breuil, F.; Hail, Y. Women inclusion in the transport system by applying a novel structured methodology: The inclusion diamond and polyhedral individual model. In Proceedings of the 6th International Conference on Women’s Issues in Transportation “Insights, Inclusion, and Impact: Framing the Future for Women in Transportation”, Irvine, CA, USA, 10–13 September 2019; pp. 1–9. [Google Scholar]
  41. DIAMOND Project. A Method to Better Structure Your Transport Research: The Inclusion Diamond and Polyhedral Individual. Available online: https://diamond-project.eu/a-method-to-better-structure-your-transport-research-the-inclusion-diamond-and-polyhedral-individual/ (accessed on 19 November 2020).
  42. García-Jiménez, E.; Poveda-Reyes, S.; Molero, G.D.; Santarremigia, F.E.; Leva, M.C.; Kinahan, M.; D’Alonzo, L.; Fabbri, F.; Cid, G.; Aragón, P.; et al. D4.3 Computational Analysis Report—Full Paper—Diamond-Project.eu. Available online: https://diamond-project.eu/download/d4-2-socio-economic-demographic-and-psychological-analysis-full-paper/ (accessed on 29 July 2021).
  43. Ramírez Hereza, P. Redes Bayesianas para Predicción y Descubrimiento de Relaciones con Señales Procedentes de Sensores Industriales. Master’s Thesis, Máster Universitario en Investigación e Innovación en Inteligencia Computacional y Sistemas Interactivos. Universidad Autónoma de Madrid, Madrid, Spain, September 2020. [Google Scholar]
  44. Brittain, M. K2_GraphSearch/k2Algorithm.jl at Master Marcbrittain/K2_GraphSearch GitHub. Available online: https://github.com/marcbrittain/K2_GraphSearch/blob/master/k2Algorithm.jl (accessed on 2 July 2021).
  45. Sulaiman, O.K.; Siregar, A.M.; Nasution, K.; Haramaini, T. Bellman Ford algorithm—In Routing Information Protocol (RIP). J. Phys. Conf. Ser. 2018, 1007, 012009. [Google Scholar] [CrossRef]
  46. Ekpanyapong, M.; Waterwai, T.; Lim, S.K. Statistical Bellman-Ford algorithm with an application to retiming. In Proceedings of the Asia and South Pacific Conference on Design Automation 2006, Yokohama, Japan, 24–27 January 2006; pp. 959–964. [Google Scholar]
  47. Conway, M.W. LightGraphs.jl/bellman-ford.jl. Available online: https://github.com/JuliaGraphs/LightGraphs.jl/blob/master/src/shortestpaths/bellman-ford.jl (accessed on 2 July 2021).
  48. Gauthier, T.D.; Hawley, M.E. Statistical Methods. In Introduction to Environmental Forensics, 3rd ed.; Murphy, B.L., Morrison, R.D., Eds.; Elsevier: Cambridge, MA, USA, 2015; pp. 99–148. [Google Scholar]
  49. Mazzocchi, M. Statistics for Marketing and Consumer Research; SAGE Publications: Los Angeles, CA, USA, 2008; pp. 103–129. [Google Scholar]
  50. Akaike, H. A new look at the statistical model identification. IEEE Trans. Autom. Control 1974, 19, 716–723. [Google Scholar] [CrossRef]
  51. Yao, Y.; Zhang, Y.; Tian, L.; Zhou, N.; Li, Z.; Wang, M. Analysis of network structure of urban bike-sharing system: A case study based on real-time data of a public bicycle system. Sustainability 2019, 11, 5425. [Google Scholar] [CrossRef] [Green Version]
  52. Cheng, M.; Wei, W. An AHP-DEA Approach of the bike-sharing spots selection problem in the free-floating bike-sharing system. Discret. Dyn. Nat. Soc. 2020, 2020, 1–15. [Google Scholar] [CrossRef]
  53. Campbell, A.A.; Cherry, C.R.; Ryerson, M.S.; Yang, X. Factors influencing the choice of shared bicycles and shared electric bikes in Beijing. Transp. Res. Part C Emerg. Technol. 2016, 67, 399–414. [Google Scholar] [CrossRef] [Green Version]
  54. Haboucha, C.J.; Ishaq, R.; Shiftan, Y. User preferences regarding autonomous vehicles. Transp. Res. Part C Emerg. Technol. 2017, 78, 37–49. [Google Scholar] [CrossRef]
  55. Keinert-Kisin, C. Corporate social responsibility and discrimination. In Gender Bias in Personnel Selection; Springer: Cham, Switzerland, 2016. [Google Scholar]
Figure 1. General scheme of the methodology followed to hierarchize level 3 fairness characteristics (FCs). In green are highlighted those aspects that will be addressed within this paper. The other steps were developed in our previous publication [35].
Sustainability 13 11372 g001
Figure 2. Bayes or K2 scores of the networks obtained for each number of iterations and for five different tests for use case 2 data. The error bars indicate the standard deviation.
Sustainability 13 11372 g002
Figure 3. Graphical example of a graph with the K2 scores of each arrow connecting the different nodes (main parent and other vertexes).
Sustainability 13 11372 g003
Table 1. The top 10 level 3 fairness characteristics (FCs) for use case 1: Public railway transport.
NoCharacteristicCodeNormalized FC Weight
1Improved layout of seating (longitudinal seating with less social interaction compared with transverse seating)FC3230.03545
2Availability of on-demand transport services including taxi and paratransitFC1180.03217
3Integration with alternative shared mobility service for last-mile connections, including bicycles, scooters, and car sharingFC1170.03152
4Availability of hospitality rooms to ask for help in case of aggression or needFC3170.02948
5Number and typology of incidentsFC3110.02943
6Display advertisements for public awareness campaigns and to publicize helpline numbersFC3180.02913
7Offer adequate personal spaceFC3210.02903
8Reliability of the available service modesFC1120.02808
9Number of services available within the transport infrastructureFC1150.02778
10Improved ventilation and air-conditioningFC3220.02752
Table 2. Simulation of an improvement in FC117—walking time from the points of interest to the public transport access points—to fully satisfied, showing the probabilities to get low (1–4) and high scores (5–8) before ( P L o w _ B and P H i g h _ B ) and after ( P L o w _ A and P H i g h _ A ) simulation of the improvement. UESI: users and employees satisfaction index.
FC321: Number of Services Available Within the Transport Infrastructure—UESI
P L o w _ B P L o w _ A Δ L o w P H i g h _ B P H i g h _ A Δ H i g h
0.275860.16026−0.115610.724140.839740.11561
FC112: Reliability of the Service Modes Available—UESI
P L o w _ B P L o w _ A Δ L o w P H i g h _ B P H i g h _ A Δ H i g h
0.157090.11000−0.047090.842910.890000.04709
FC115: Improved Layout of Seating (Longitudinal Seating with Less Social Interaction Compared with Transverse Seating)—UESI
P L o w _ B P L o w _ A Δ L o w P H i g h _ B P H i g h _ A Δ H i g h
0.247130.10687−0.140260.752870.893130.14026
FC322: Level of Service at the Public Transport Access Point—UESI
P L o w _ B P L o w _ A Δ L o w P H i g h _ B P H i g h _ A Δ H i g h
0.272030.18433−0.087700.727970.815670.08770
Table 3. Top 10 level 3 fairness characteristics (FCs) for use case 2: Autonomous vehicles (AVs).
NoCharacteristicFC CodeNormalized FC Weight
1Perception of increased safety of AVsFC1210.03787
2Perception of reduced safety of AVsFC1220.03439
3Perception of reduction in ecological impactFC5210.02716
4Perception of comfort in sharing data with othersFC1410.02697
5Perception of reduction in accidents thanks to AVsFC1110.02697
6Perception of safety in any conditionsFC1120.02584
7Perception of driving without a steering wheelFC5310.02369
8Perception of improved traffic management with AVsFC1420.02352
9Perception of the need of less trainingFC1310.02240
10Perception of the degree of simultaneityFC2220.01929
Table 4. Simulation of an improvement in FC112—perception of safety in any driving conditions—to fully satisfied, showing the probabilities to get low (1–4) and high scores (5–8) before ( P L o w _ B and P H i g h _ B ) and after ( P L o w _ A and P H i g h _ A ) simulation of the improvement. AVs: autonomous vehicles; UESI: users and employees satisfaction index.
FC121: Perception of Increased Safety of AVs—UESI
P L o w _ B P L o w _ A Δ L o w P H i g h _ B P H i g h _ A Δ H i g h
0.05263160−0.05263160.94736810.0526316
FC122: Perception of Reduced Safety of AVs—UESI
P L o w _ B P L o w _ A Δ L o w P H i g h _ B P H i g h _ A Δ H i g h
0.5789470.8280.2490530.4210530.172−0.249053
FC521: Perception of Reduction of Ecological Impact—UESI
P L o w _ B P L o w _ A Δ L o w P H i g h _ B P H i g h _ A Δ H i g h
0.05263160.1153850.0627530.9473680.884615−0.062753
FC141: Perception of Comfort Sharing Data to Others—UESI
P L o w _ B P L o w _ A Δ L o w P H i g h _ B P H i g h _ A Δ H i g h
0.3157890.275748−0.0400420.6842110.7242520.040042
FC111: Perception of Reduction of Accidents Thanks to AVs—UESI
P L o w _ B P L o w _ A Δ L o w P H i g h _ B P H i g h _ A Δ H i g h
0.05263160.3026320.250.9473680.697368−0.25
FC531: Perception of Driving Without Steering Wheel—UESI
P L o w _ B P L o w _ A Δ L o w P H i g h _ B P H i g h _ A Δ H i g h
0.4736840.378182−0.09550240.5263160.6218180.0955024
FC142: Perception of Improved Traffic Management with AVs—UESI
P L o w _ B P L o w _ A Δ L o w P H i g h _ B P H i g h _ A Δ H i g h
00.08085110.080851110.919149−0.0808511
FC131: Perception of the Need of Less Training—UESI
P L o w _ B P L o w _ A Δ L o w P H i g h _ B P H i g h _ A Δ H i g h
0.3684210.365957−0.002463610.6315790.6340430.00246361
FC222: Perception of the Degree of Simultaneity—UESI
P L o w _ B P L o w _ A Δ L o w P H i g h _ B P H i g h _ A Δ H i g h
00.003521130.0035211310.996479−0.00352113
Table 5. Top 10 level 3 fairness characteristics (FCs) for use case 3: Bicycle sharing stations.
NoCharacteristicCodeNormalized FC Weight
1Where possible, avoid hilly terrain in the development of cycling networks FC4120.06102
2Electric bicycles in bicycle-sharing fleetFC4110.05049
3Cycling infrastructure that is friendly for all weather conditionsFC4210.04934
4Availability of rain ponchosFC4220.04643
5Bicycles with child seats and trailers for carrying kids and carting cargoFC3330.04627
6Education on practical cycling (cycling with children and cargo)FC3310.04509
7Safe routes for cycling with childrenFC3320.03692
8Availability of end-of-trip cycling facilitiesFC3210.03044
9Sheltered docking stationFC1430.02960
10Better and safer cycling facilities to encourage cycling with childrenFC3120.02885
Table 6. Simulation of an improvement in FC412—avoid hilly terrain in the development of cycle networks where possible—to the lowest value (2), showing the probabilities to get low (1–4) and high scores (5–8) before ( P L o w _ B and P H i g h _ B ) and after ( P L o w _ A and P H i g h _ A ) simulation of the improvement. UESI: users and employees satisfaction index.
FC411: Electric Bicycles in Bicycle-Sharing Fleet—UESI
P L o w _ B P L o w _ A Δ L o w P H i g h _ B P H i g h _ A Δ H i g h
110000
FC422: Availability of Rain Ponchos—UESI
P L o w _ B P L o w _ A Δ L o w P H i g h _ B P H i g h _ A Δ H i g h
0.8457710.9584720.1127010.1542290.0415279−0.112701
FC333: Bicycles with Child Seats and Trailers for Carrying Kids and Carting Cargo—UESI
P L o w _ B P L o w _ A Δ L o w P H i g h _ B P H i g h _ A Δ H i g h
110000
FC331: Education on Practical Cycling (Cycling with Children and Cargo)—UESI
P L o w _ B P L o w _ A Δ L o w P H i g h _ B P H i g h _ A Δ H i g h
110000
FC332: Safe Routes for Cycling with Children—UESI
P L o w _ B P L o w _ A Δ L o w P H i g h _ B P H i g h _ A Δ H i g h
0.2338310.196074−0.03775720.7661690.8039260.0377572
FC321: Availability of End-of-Trip Cycling Facilities—UESI
P L o w _ B P L o w _ A Δ L o w P H i g h _ B P H i g h _ A Δ H i g h
0.2686570.230351−0.03830590.7313430.7696490.0383059
FC312: Better and Safer Cycling Facilities to Encourage Cycling—UESI
P L o w _ B P L o w _ A Δ L o w P H i g h _ B P H i g h _ A Δ H i g h
0.2835820.27854−0.005042390.7164180.721460.00504239
Table 7. Top 10 level 3 fairness characteristics (FCs) for use case 4: Employment in the transport sector.
NoCharacteristicCodeNormalized FCs Weight
1Employment opportunities should be advertised widely and all applications should be welcomedFC1230.05264
2Family friendly policies—maternity and paternity leaveFC1330.05155
3Those with small children should be given the opportunity to change shifts or to reduce their working timeFC3130.04745
4All jobs are available and suitable for both men and women (and there is a more equal balance between genders across all occupations, levels, and jobs in transport)FC1110.03985
5Ensure employment decisions are based on objective issues related to the jobFC1250.03628
6Security staff available to intervene in case of needFC2550.03337
7Ensure gender pay equality for equivalent positionsFC1150.03253
8Part-time work, flexible working hours, and work-from-home optionsFC3160.03103
9Leave for caring responsibilitiesFC4440.03071
10On-the-job training for men and women to negate cultural stereotypes associated with women and specific roles and tasks in the transport sectorFC1120.03033
Table 8. Simulation of an improvement in FC111—all jobs are available and suitable for both men and women (and there is a more equal balance between genders across all occupations, levels and jobs in transport)—to fully satisfied, showing the probabilities to get low (1–4) and high scores (5–8) before ( P L o w _ B and P H i g h _ B ) and after ( P L o w _ A and P H i g h _ A ) simulation of the improvement.
FC123: Employment Opportunities Should be Advertised Widely and All Applications Welcomed—Proprietary Data
P L o w _ B P L o w _ A Δ L o w P H i g h _ B P H i g h _ A Δ H i g h
110000
FC133: Family Friendly Policies—Maternity and Paternity Leave—Proprietary Data
P L o w _ B P L o w _ A Δ L o w P H i g h _ B P H i g h _ A Δ H i g h
110000
FC313: Those with Small Children Should be Given the Opportunity to Change Shifts or to Reduce Their Working Time—Proprietary Data
P L o w _ B P L o w _ A Δ L o w P H i g h _ B P H i g h _ A Δ H i g h
110000
FC125: Ensure Employment Decisions are Based on Objective Issues Related to the Job—UESI
P L o w _ B P L o w _ A Δ L o w P H i g h _ B P H i g h _ A Δ H i g h
0.2147240.16966−0.04506350.7852760.830340.0450635
FC255: Security Staff Available to Intervene in Case of Need—Proprietary Data
P L o w _ B P L o w _ A Δ L o w P H i g h _ B P H i g h _ A Δ H i g h
110000
FC115: Ensuring Gender Pay Equality for Equivalent Positions—Proprietary Data
P L o w _ B P L o w _ A Δ L o w P H i g h _ B P H i g h _ A Δ H i g h
110000
FC316: Part-Time Work, Flexible Working Hours, and Work-From-Home Options—UESI
P L o w _ B P L o w _ A Δ L o w P H i g h _ B P H i g h _ A Δ H i g h
0.3742330.347641−0.02659180.6257670.6523590.0265918
FC444: Leave for Caring Responsibilities—Proprietary Data
P L o w _ B P L o w _ A Δ L o w P H i g h _ B P H i g h _ A Δ H i g h
110000
FC112: On-the-Job Training for Men and Women to Negate Cultural Stereotypes Associated with Women and Specific Roles and Tasks in the Transport Sector—UESI
P L o w _ B P L o w _ A Δ L o w P H i g h _ B P H i g h _ A Δ H i g h
0.06748470.060491−0.006993690.9325150.9395090.00699369
Publisher’s Note: MDPI stays neutral with regard to jurisdictional claims in published maps and institutional affiliations.

