
Spatial and Seasonal Dynamics of Inorganic Nitrogen and Phosphorous Compounds in an Orchard-Dominated Catchment with Anthropogenic Impacts


Abstract
1. Introduction
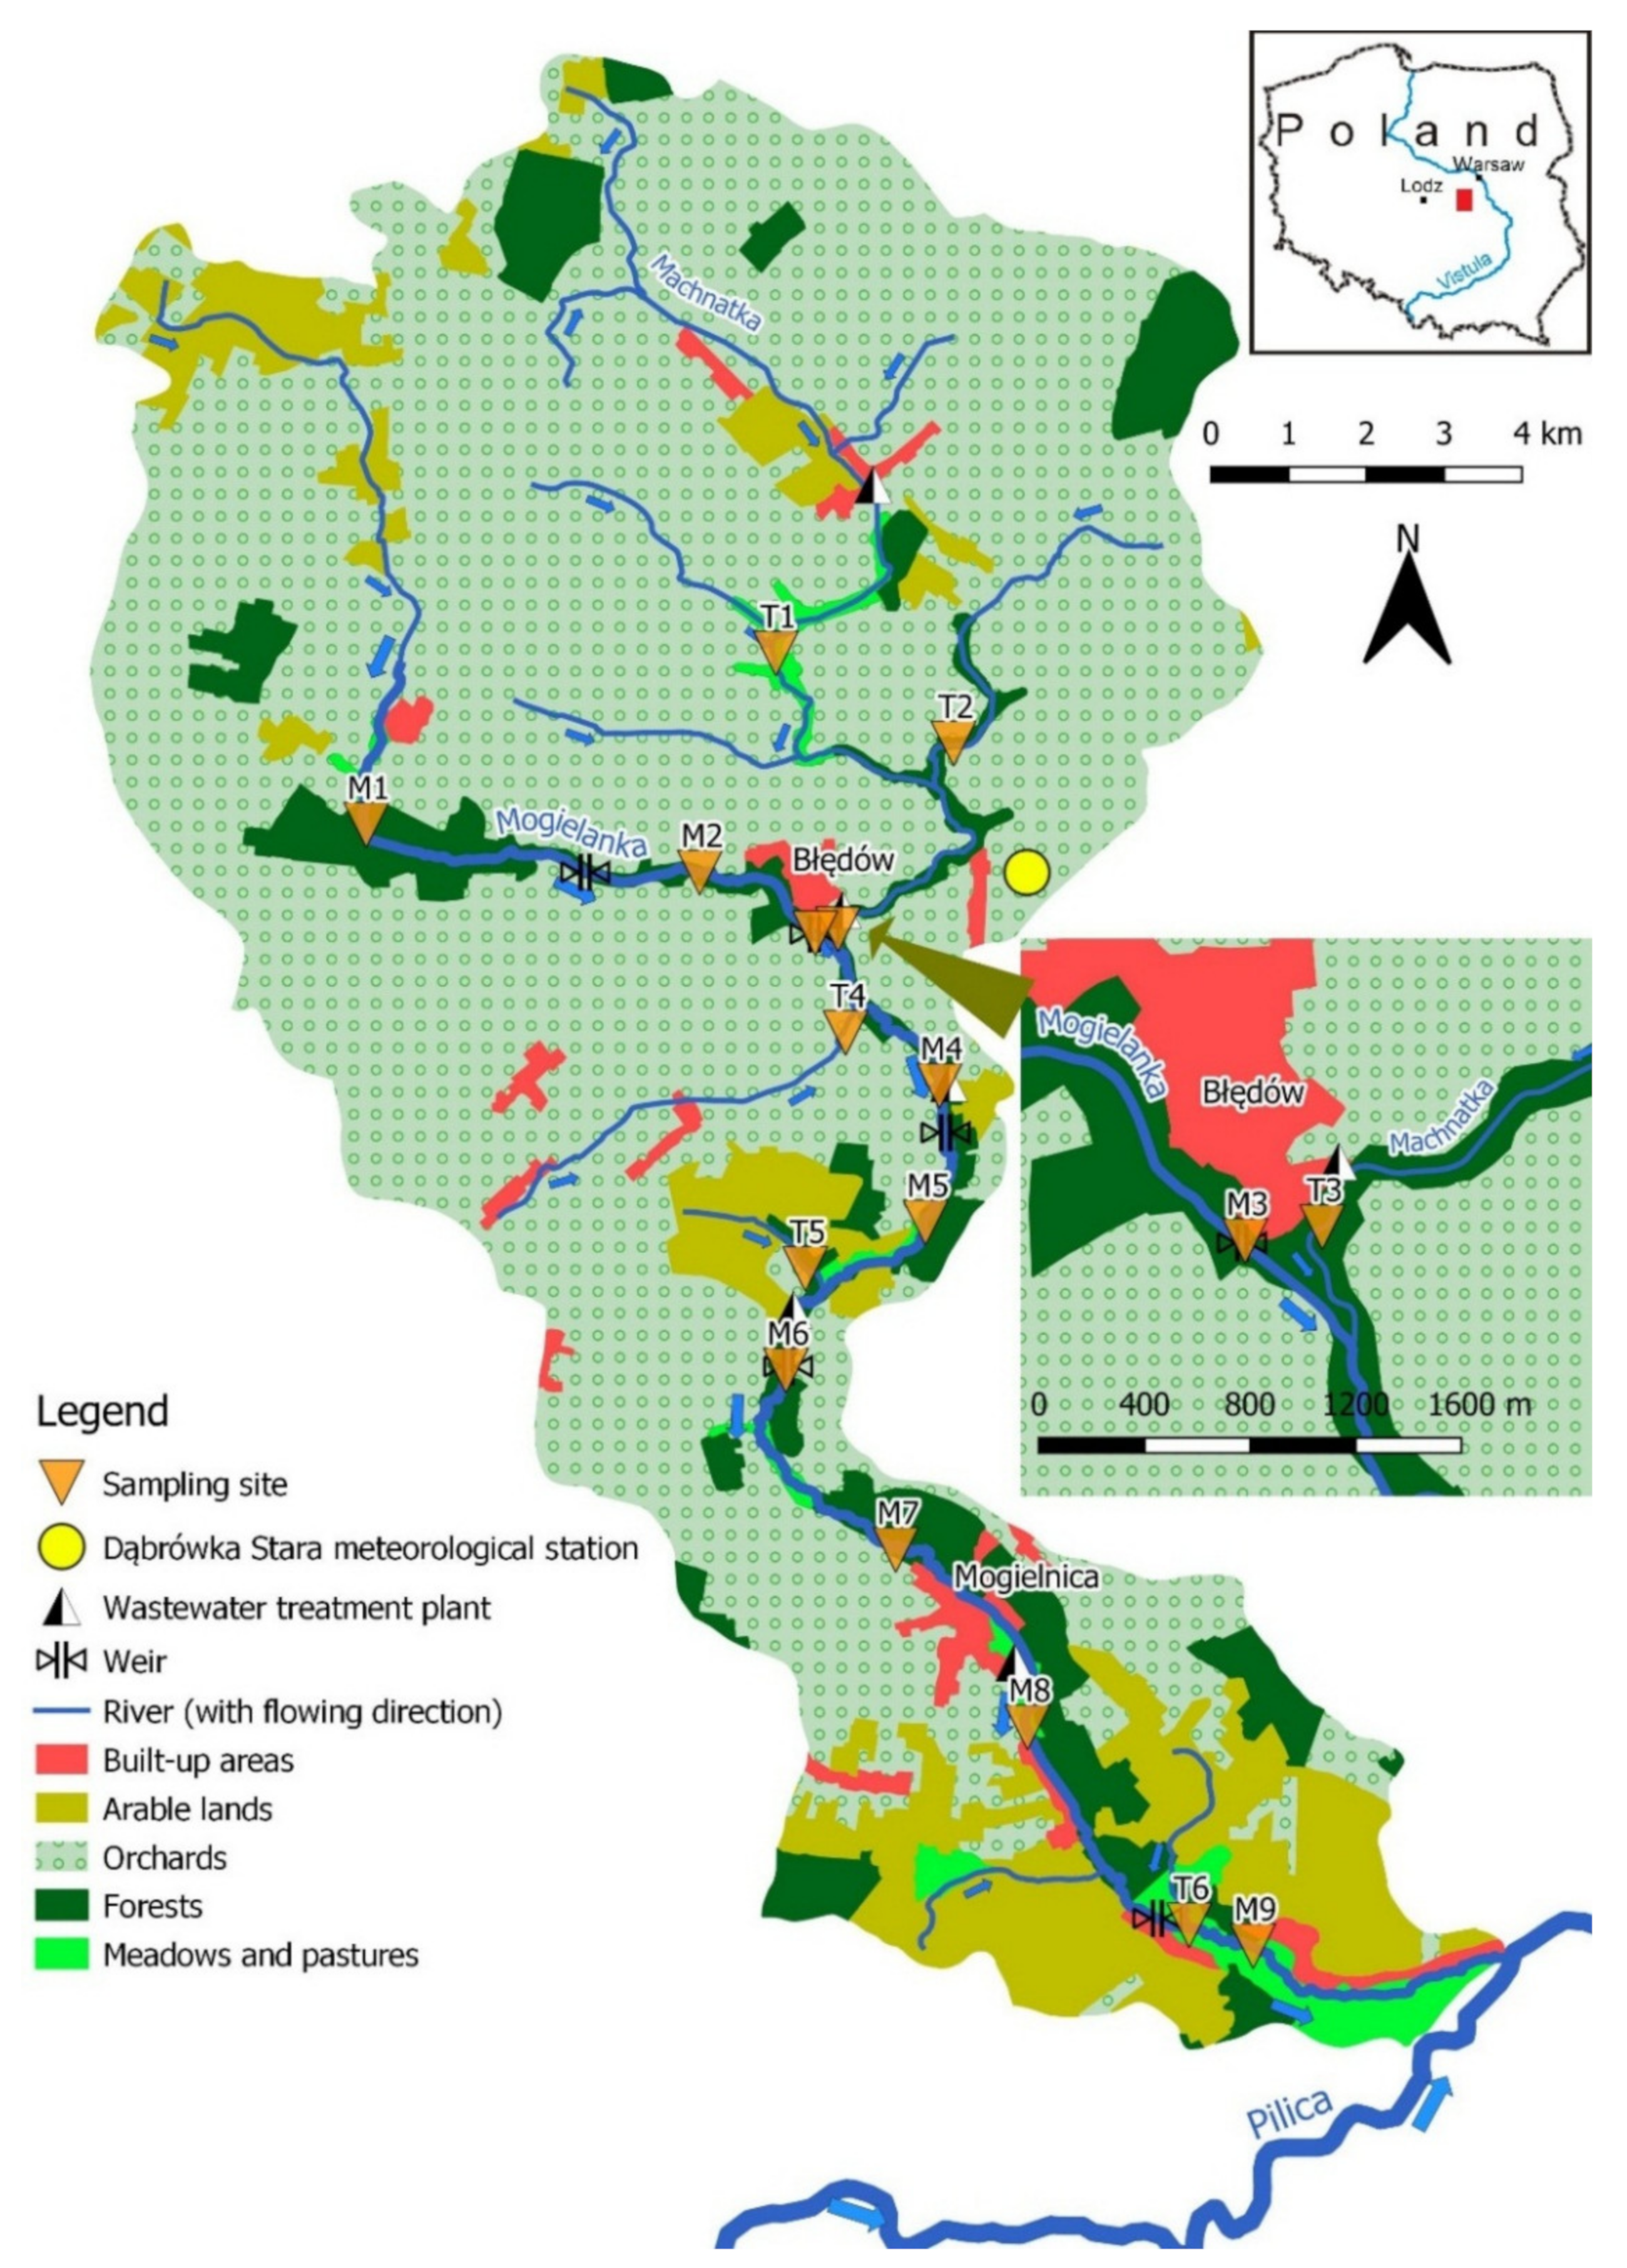
2. Study Area
3. Materials and Methods
4. Results
4.1. Hydrometeorological Background
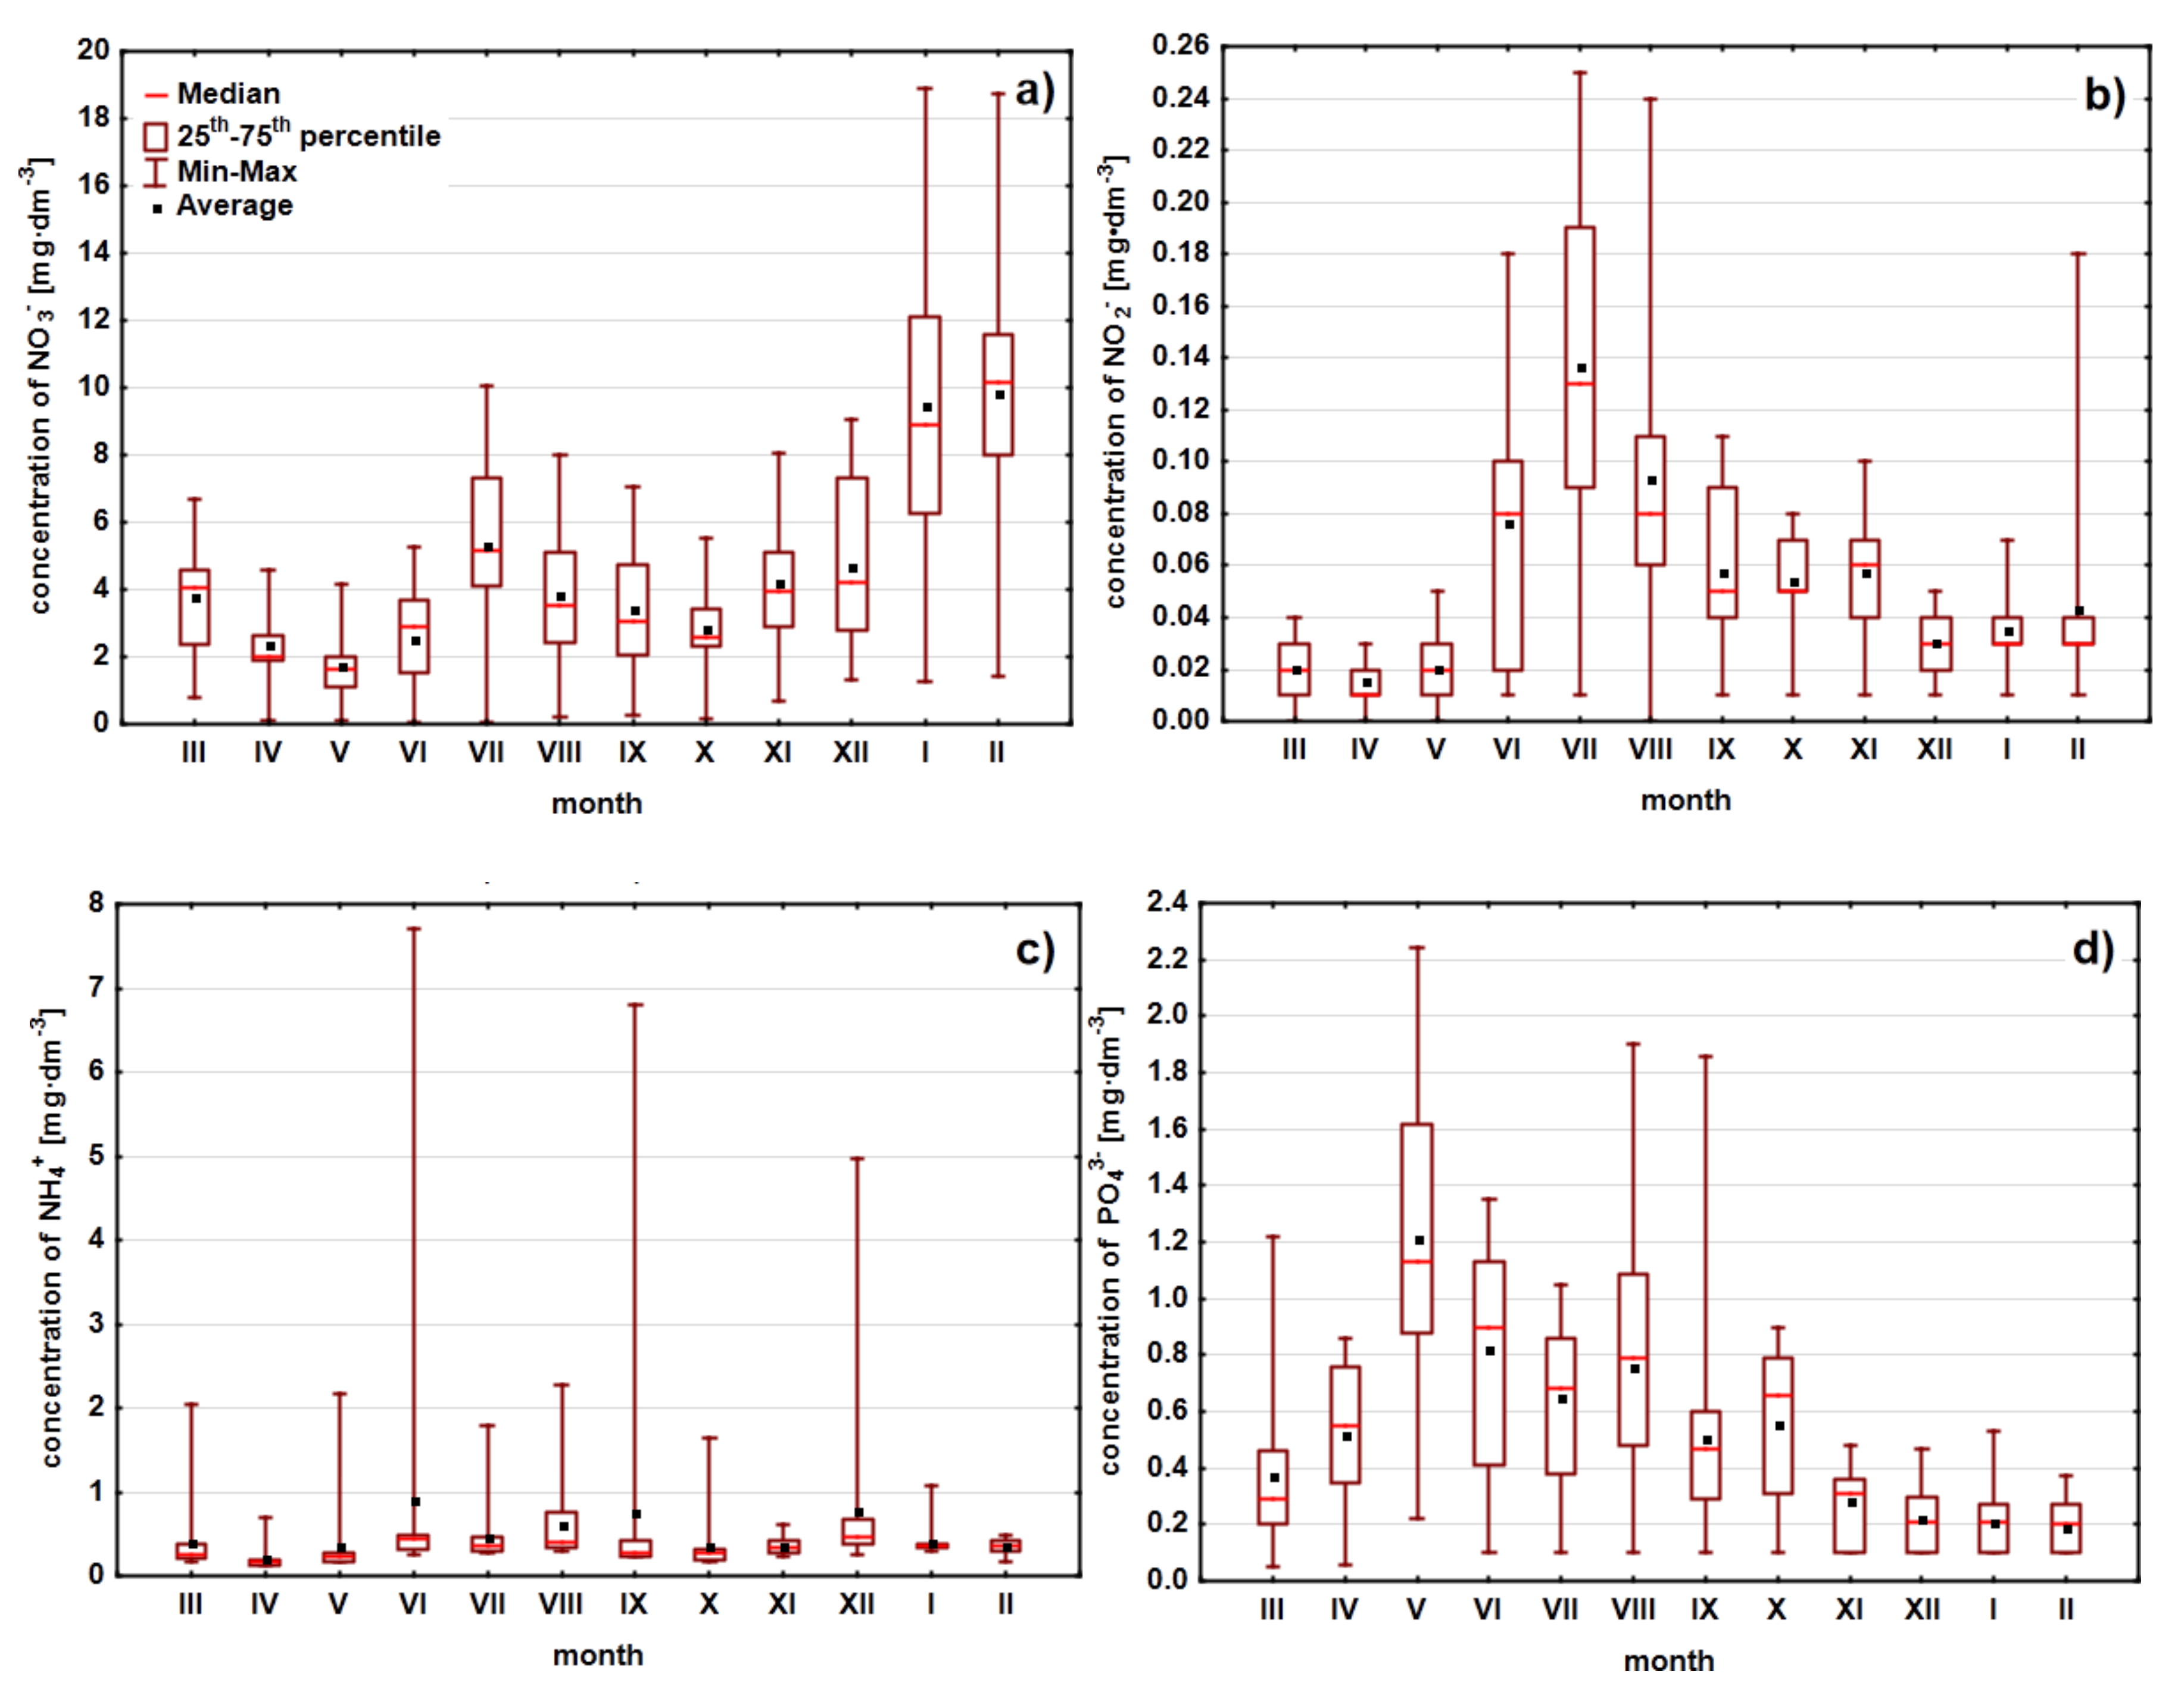
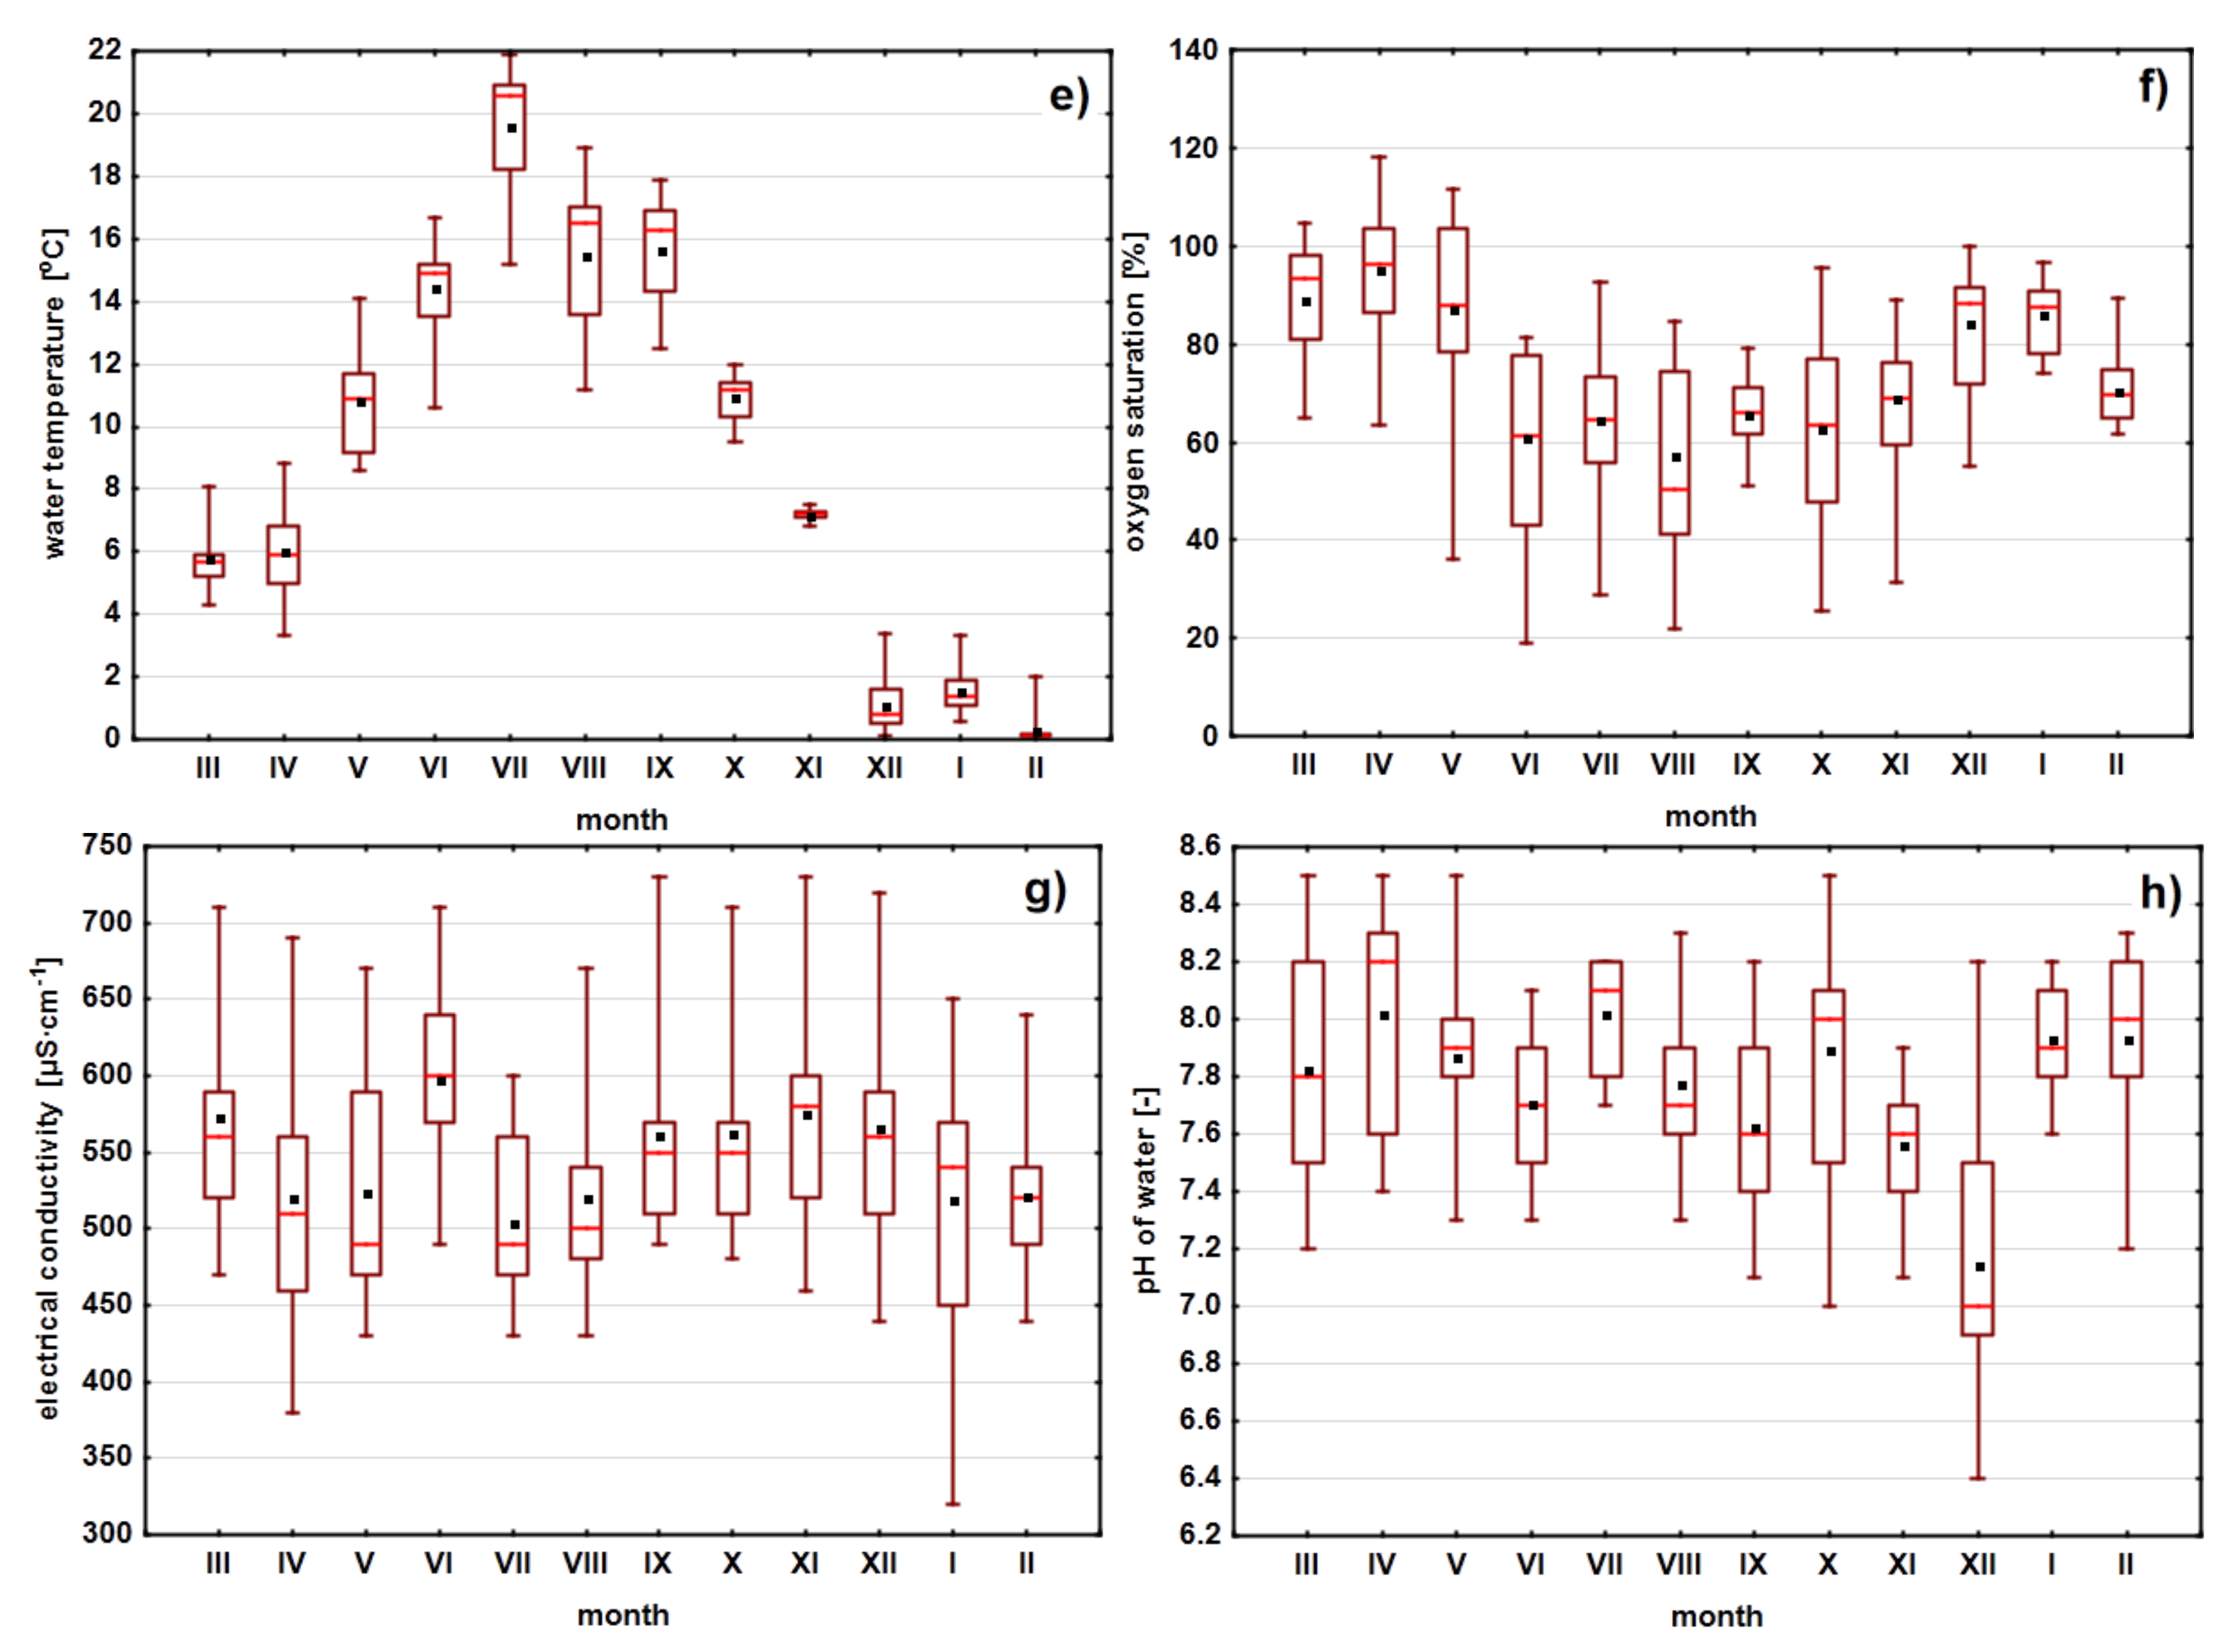
4.2. Seasonal and Spatial Differentiation of Selected Water Quality Parameters
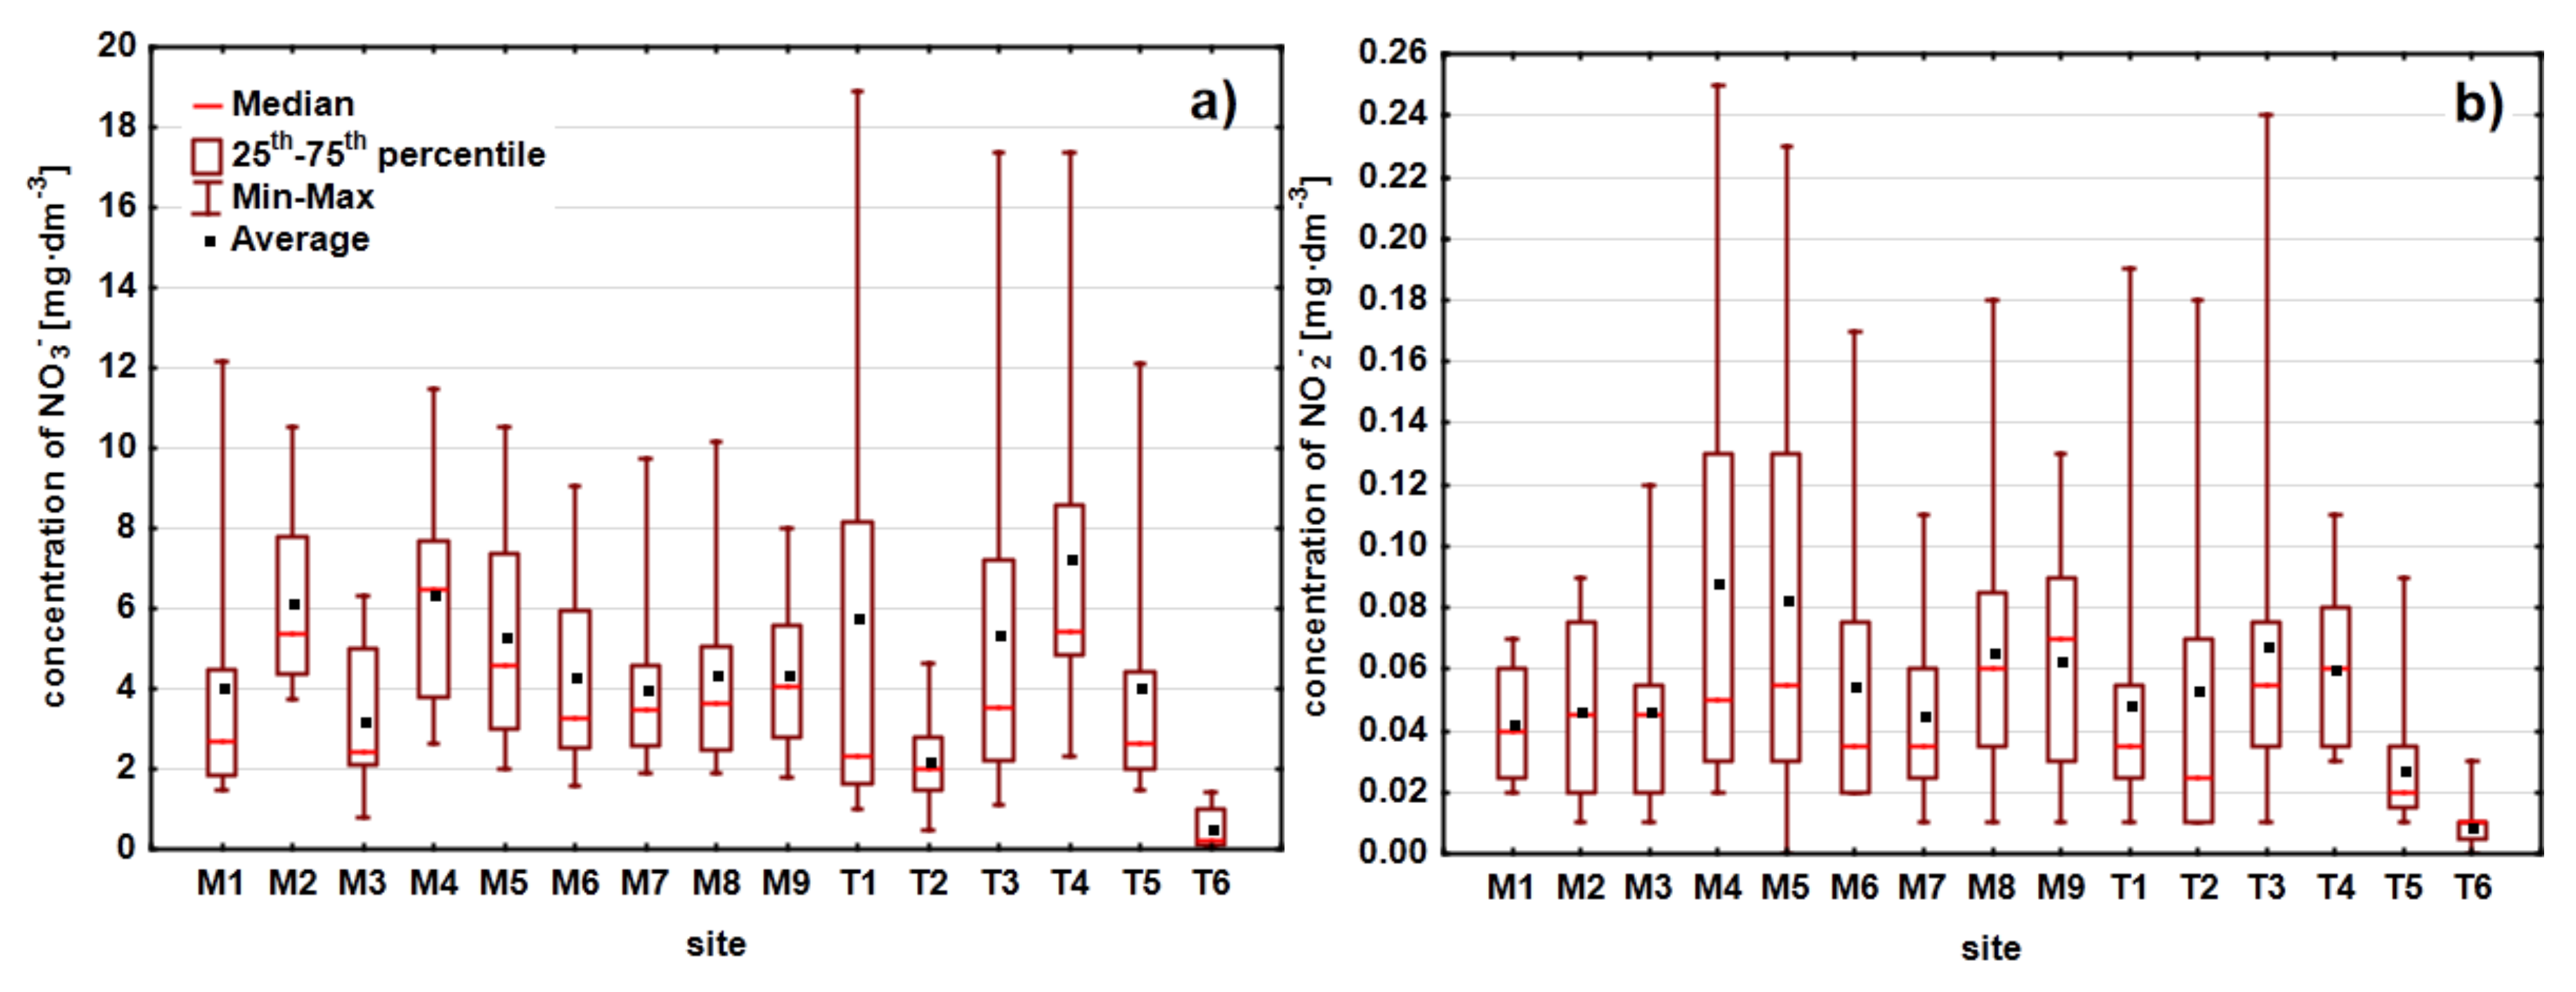
4.3. Anthropogenic Influences on Stream Water Quality
4.4. Relationships between Precipitation and Biogenic Concentrations and between Chemical Compounds
5. Discussion and Conclusions
5.1. Seasonal and Spatial Differentiation of Water Quality Parameters
5.2. Human Impact on Water Quality
5.3. Recommendations for Improving Water Quality
Author Contributions
Funding
Institutional Review Board Statement
Informed Consent Statement
Data Availability Statement
Acknowledgments
Conflicts of Interest
References
- Zobrist, J.; Schoenenberger, U.; Figura, S.; Hug, S.J. Long-term trends in Swiss rivers sampled continuously over 39 years reflect changes in geochemical processes and pollution. Environ. Sci. Pollut. Res. 2018, 25, 16788–16809. [Google Scholar] [CrossRef]
- Burt, T.P.; Worrall, F.; Howden, N.J.K.; Jarvie, H.P.; Pratt, A.; Hutchinson, T.H. A 50-year record of nitrate concentrations in the Slapton Ley Catchment, Devon, United Kingdom. Hydrol. Process. 2021, 35, 13955. [Google Scholar] [CrossRef]
- Anderson, D.M.; Glibert, P.M.; Burkholder, J.M. Harmful algal blooms and eutrophication: Nutrient sources, composition. and consequences. Estuaries 2002, 25, 704–726. [Google Scholar] [CrossRef]
- Fernández-Nava, Y.; Marañón, E.; Soons, J.; Castrillón, L. Denitrification of high nitrate concentration wastewater using alternative carbon sources. J. Hazard. Mater. 2010, 173, 682–688. [Google Scholar] [CrossRef] [PubMed]
- Badruzzaman, M.; Pinzon, J.; Oppenheimer, J.; Jacangelo, J.G. Sources of nutrients impacting surface waters in Florida: A review. J. Environ. Manage. 2012, 109, 80–92. [Google Scholar] [CrossRef] [PubMed]
- Withers, P.J.A.; Neal, C.; Jarvie, H.P.; Doody, D.G. Agriculture and eutrophication: Where do we go from here? Sustainability 2014, 6, 5853–5875. [Google Scholar] [CrossRef]
- Carpenter, S.R.; Caraco, N.F.; Correll, D.L.; Howarth, R.W.; Sharpley, A.N.; Smith, V.H. Nonpoint pollution of surface waters with phosphorus and nitrogen. Ecol. Appl. 1998, 8, 559–568. [Google Scholar] [CrossRef]
- Zhao, B.Q.; Li, X.Y.; Liu, H.; Wang, B.R.; Zhu, P.; Huang, S.M.; Bao, D.J.; Li, Y.T.; So, H.B. Results from long-term fertilizer experiments in China: The risk of groundwater pollution by nitrate. NJAS Wagen. J. Live Sci. 2011, 58, 177–183. [Google Scholar] [CrossRef]
- Misselbrook, T.H.; Van der Weerden, T.J.; Pain, B.F.; Jarvis, S.C.; Chambers, B.J.; Smith, K.A.; Phillips, V.R.; Demmers, T.G.M. Ammonia emission factors for UK agriculture. Atmos. Environ. 2000, 34, 871–880. [Google Scholar] [CrossRef]
- Aneja, V.P.; Nelson, D.R.; Roelle, P.A.; Walker, J.T.; Battye, W. Agricultural ammonia emissions and ammonium concentrations associated with aerosols and precipitation in the southeast United States. J. Geophys. Res. Atmos. 2003, 108, 4152. [Google Scholar] [CrossRef]
- Walker, J.; Nelson, D.; Aneja, V.P. Trends in ammonium concentration in precipitation and atmospheric ammonia emissions at a coastal plain site in North Carolina. USA. Environ. Sci. Technol. 2000, 34, 3527–3534. [Google Scholar] [CrossRef]
- Judová, P.; Janský, B. Water quality in rural areas of the Czech Republic: Key study Slapanka River catchment. Limnologica 2005, 35, 160–168. [Google Scholar] [CrossRef]
- Żarnowiec, W.; Policht-Latawiec, A.; Pytlik, A. Dynamics of physicochemical parameter concentration in the Graniczna Woda stream water. J. Water Land Dev. 2017, 35, 281–289. [Google Scholar] [CrossRef]
- Łaszewski, M.; Fedorczyk, M.; Gołaszewska, S.; Kieliszek, Z.; Maciejewska, P.; Miksa, J.; Zacharkiewicz, W. Land Cover Effects on Selected Nutrient Compounds in Small Lowland Agricultural Catchments. Land 2021, 10, 182. [Google Scholar] [CrossRef]
- Mbuligwe, S.E.; Kaseva, M.E. Pollution and self-cleansing of an urban river in a developing country: A case study in Dar es Salaam, Tanzania. Environ. Manage. 2005, 36, 328–342. [Google Scholar] [CrossRef] [PubMed]
- Koda, E.; Sieczka, A.; Osiński, P. Ammonium Concentration and Migration in Groundwater in the Vicinity of Waste Management Site Located in the Neighborhood of Protected Areas of Warsaw Poland. Sustainability 2016, 8, 1253. [Google Scholar] [CrossRef]
- Smith, V.H.; Tilman, G.D.; Nekola, J.C. Eutrophication: Impacts of excess nutrient inputs on freshwater, marine and terrestrial ecosystems. Environ. Pollut. 1999, 100, 179–196. [Google Scholar] [CrossRef]
- Mankiewicz-Boczek, J.; Palus, J.; Gągała, I.; Izydorczyk, K.; Jurczak, T.; Dziubałtowska, E.; Stępnik, M.; Arkusz, J.; Komorowska, M.; Skowron, A.; et al. Effects of microcystins-containing cyanobacteria from a temperate ecosystem on human lymphocytes culture and their potential for adverse human health effects. Harmful Algae 2011, 10, 356–365. [Google Scholar] [CrossRef]
- Sadeq, M.; Moe, C.L.; Attarassi, B.; Cherkaoui, I.; El Aouad, R.; Idrissi, L. Drinking water nitrate and prevalence of methemoglobinemia among infants and children aged 1–7 years in Moroccan areas. Int. J. Hyg. Environ. Health 2008, 211, 546–554. [Google Scholar] [CrossRef]
- Królak, E.; Raczuk, J. Nitrate concentration-related safety of drinking water from various sources intended for consumption by neonates and infants. Arch. Environ. Prot. 2018, 44, 3–9. [Google Scholar]
- Larsen, T.; Broch, K.; Andersen, M.R. First flush effects in an urban catchment area in Aalborg. Water Sci. Technol. 1998, 37, 251–257. [Google Scholar] [CrossRef]
- Qin, H.; Su, Q.; Khu, S.; Tang, N. Water Quality Changes during Rapid Urbanization in the Shenzhen River Catchment: An Integrated View of Socio-Economic and Infrastructure Development. Sustainability 2014, 6, 7433–7451. [Google Scholar] [CrossRef]
- Puczko, K.; Jekatierynczuk-Rudczyk, E. Extreme Hydro-Meteorological Events Influence to Water Quality of Small Rivers in Urban Area: A Case Study in Northeast Poland. Sci. Rep. 2020, 10, 10255. [Google Scholar] [CrossRef]
- Kosmowska, A.; Żelazny, M.; Małek, S.; Siwek, J.P.; Jelonkiewicz, Ł. Effect of deforestation on stream water chemistry in the Skrzyczne massif (the Beskid Śląski Mountains in southern Poland). Sci. Total Environ. 2016, 568, 1044–1053. [Google Scholar] [CrossRef] [PubMed]
- Zhu, J.; Yu, L.; Xu, T.; Wei, X.; Yang, K. Comparison of water quality in two catchments with different forest types in the headwater region of the Hun River, Northeast China. J. For. Res. 2019, 30, 565–576. [Google Scholar] [CrossRef]
- Pekárová, P.; Pekár, J. The impact of land use on stream water quality in Slovakia. J. Hydrol. 1996, 180, 333–350. [Google Scholar] [CrossRef]
- Hooda, P.S.; Moynagh, M.; Svoboda, I.F.; Thurlow, M.; Stewart, M.; Thomson, M.; Anderson, H.A. Streamwater nitrate concentrations in six agricultural catchments in Scotland. Sci. Total Environ. 1997, 201, 63–78. [Google Scholar] [CrossRef]
- Huebsch, M.; Fenton, O.; Horan, B.; Hennessy, D.; Richards, K.G.; Jordan, P.; Goldscheider, N.; Butscher, C.; Blum, P. Mobilisation or dilution? Nitrate response of karst springs to high rainfall events. Hydrol. Earth Syst. Sci. 2014, 18, 4423–4435. [Google Scholar] [CrossRef]
- Van Metre, P.C.; Frey, J.W.; Musgrove, M.; Nakagaki, N.; Qi, S.; Mahler, B.J.; Wieczorek, M.E.; Button, D.T. High Nitrate Concentrations in Some Midwest United States Streams in 2013 after the 2012 Drought. J. Environ. Qual. 2016, 45, 1696–1704. [Google Scholar] [CrossRef] [PubMed]
- Kuczyńska, A.; Jarnuszewski, G.; Nowakowska, M.; Wexler, S.K.; Wiśniowski, Z.; Burczyk, P.; Durkowski, T.; Woźnicka, M. Identifying causes of poor water quality in a Polish agricultural catchment for designing effective and targeted mitigation measures. Sci. Total Environ. 2021, 765, 144125. [Google Scholar] [CrossRef]
- Lintern, A.; Webb, J.A.; Ryu, D.; Liu, S.; Bende-Michl, U.; Waters, D.; Leahy, P.; Wilson, P.; Western, W. Key factors influencing differences in stream water quality across space. WIREs Water 2018, 5, e1260. [Google Scholar] [CrossRef]
- Staponites, L.R.; Barták, V.; Bílý, M.; Simon, O.P. Performance of landscape composition metrics for predicting water quality in headwater catchments. Sci. Rep. 2019, 9, 14405. [Google Scholar] [CrossRef] [PubMed]
- Lei, C.; Wagner, P.D.; Fohrer, N. Effects of land cover, topography, and soil on stream water quality at multiple spatial and seasonal scales in a German lowland catchment. Ecol. Indic. 2021, 120, 106940. [Google Scholar] [CrossRef]
- Nafi’Shehab, Z.; Jamil, N.R.; Aris, A.Z.; Shafie, N.S. Spatial variation impact of landscape patterns and land use on water quality across an urbanized watershed in Bentong, Malaysia. Ecol. Indic. 2021, 122, 107254. [Google Scholar]
- Omernik, J.M. Nonpoint Source Stream Nutrient Level Relationships: A Nationwide Study; Special Studies Branch, Corvallis Environmental Research Laboratory, Office of Research and Development, US Environmental Protection Agency: Washington, DC, USA, 1977. [Google Scholar]
- Żelazny, M.; Siwek, J. Determinants of Seasonal Changes in Streamwater Chemistry in Small Catchments with Different Land Use: Case Study from Poland’s Carpathian Foothills. Pol. J. Environ. Stud. 2012, 21, 791–804. [Google Scholar]
- White, S.A.; Santos, I.R.; Hessey, S. Nitrate loads in sub-tropical headwater streams driven by intensive horticulture. Environ. Pollut. 2018, 243, 1036–1046. [Google Scholar] [CrossRef] [PubMed]
- Lisboa, M.S.; Schneider, R.L.; Sullivan, P.J.; Walter, M.T. Drought and post-drought rain effect on stream phosphorus and other nutrient losses in the Northeastern USA. J. Hydrol. Reg. Stud. 2020, 28, 100672. [Google Scholar] [CrossRef]
- Ou, Y.; Wang, X.; Wang, L.; Rousseau, A.N. Landscape influences on water quality in riparian buffer zone of drinking water source area. Northern China. Environ. Earth Sci. 2016, 75, 1–13. [Google Scholar] [CrossRef]
- Epelde, A.M.; Cerro, I.; Sanchez-Pérez, J.M.; Sauvage, S.; Srinivasan, R.; Antiguedad, I. Application of the SWAT model to assess the impact of changes in agricultural management practices on water quality. Hydrol. Sci. J. 2015, 60, 825–843. [Google Scholar] [CrossRef]
- Marcinkowski, P.; Piniewski, M.; Kardel, I.; Srinivasan, R.; Okruszko, T. Challenges in modelling of water quantity and quality in two contrasting meso-scale catchments in Poland. J. Water Land Dev. 2016, 31, 97–111. [Google Scholar] [CrossRef]
- Noori, N.; Kalin, L.; Isik, S. Water quality prediction using SWAT-ANN coupled approach. J. Hydrol. 2020, 590, 125220. [Google Scholar] [CrossRef]
- Arheimer, B.; Lidén, R. Nitrogen and phosphorus concentrations from agricultural catchments—influence of spatial and temporal variables. J. Hydrol. 2000, 227, 140–159. [Google Scholar] [CrossRef]
- Melland, A.R.; Mellander, P.E.; Murphy, P.N.C.; Wall, D.P.; Mechan, S.; Shine, O.; Shortle, G.; Jordan, P. Stream water quality in intensive cereal cropping catchments with regulated nutrient management. Environ. Sci. Policy 2012, 24, 58–70. [Google Scholar] [CrossRef]
- Wang, Y.; Li, Y.; Liu, X.; Liu, F.; Li, Y.; Song, L.; Li, H.; Ma, Q.; Wu, J. Relating land use patterns to stream nutrient levels in red soil agricultural catchments in subtropical central China. Environ. Sci. Pollut. Res. 2014, 21, 10481–10492. [Google Scholar] [CrossRef] [PubMed]
- Heaney, C.D.; Myers, K.; Wing, S.; Hall, D.; Baron, D.; Stewart, J.R. Source tracking swine fecal waste in surface water proximal to swine concentrated animal feeding operations. Sci. Total Environ. 2015, 511, 676–683. [Google Scholar] [CrossRef] [PubMed]
- White, S.A.; Conrad, S.R.; Woodrow, R.L.; Tucker, J.P.; Wong, W.W.; Cook, P.M.; Sanders, C.J.; Wadnerkar, P.D.; Davis, K.L.; Holloway, C.J.; et al. Nutrient Transport and Sources in Headwater Streams Surrounded by Intensive Horticulture; National Marine Science Centre, Southern Cross University: Coffs Harbour, Australia, 2020. [Google Scholar]
- Mottes, C.; Jannoyer, M.L.; Bail, M.; Guene, M.; Carles, C.; Malezieux, E. Relationships between past and present pesticide applications and pollution at a watershed outlet: The case of a horticultural catchment in Martinique, French West Indies. Chemosphere 2017, 184, 762–773. [Google Scholar] [CrossRef]
- Wójcik, M.; Traczyk, A. The development of orchard fruit-growing in Poland in the period of impact of the Common Agricultural Policy. Production-related and spatial issues. Bull. Geogr. Socio-Econ. Ser. 2020, 49, 19–30. [Google Scholar] [CrossRef]
- Kulikowski, R. Ogrodnictwo w Polsce. Rozmieszczenie, struktura upraw i rola w produkcji rolniczej. Przegląd Geogr. 2007, 79, 79–98. [Google Scholar]
- Zhang, Q.; Shi, F.; Abdullahi, N.M.; Shao, L.; Huo, X. An empirical study on spatial–temporal dynamics and influencing factors of apple production in China. PLoS ONE 2020, 15, e0240140. [Google Scholar] [CrossRef]
- Kondracki, J. Geografia Regionalna Polski; Wydawnictwo Naukowe PWN: Warszawa, Poland, 2000. [Google Scholar]
- Solon, J.; Borzyszkowski, J.; Bidłasik, M.; Richling, A.; Badora, K.; Balon, J.; Brzezińska-Wójcik, T.; Chabudziński, Ł.; Dobrowolski, R.; Grzegorczyk, I.; et al. Physico-geographical mesoregions of Poland: Verification and adjustment of boundaries on the basis of contemporary spatial data. Geogr. Pol. 2018, 91, 143–170. [Google Scholar] [CrossRef]
- Piniewski, M. Classification of natural flow regimes in Poland. River Res. Appl. 2017, 33, 1205–1218. [Google Scholar]
- Wrzesiński, D. Reżimy rzek Polski. In Hydrologia Polski, 1st ed.; Jokiel, P., Marszelewski, W., Pociask-Karteczka, J., Eds.; PWN: Warszawa, Poland, 2017; pp. 215–221. [Google Scholar]
- Albrycht, A. Szczegółowa Mapa Geologiczna Polski 1:50,000, Arkusz Mogielnica (632) Wraz z Objaśnieniami; Centralne Archiwum Geologiczne Państwowego Instytutu Geologicznego: Warszawa, Poland, 2009. [Google Scholar]
- Wójcik, M.; Traczyk, A. Changes in the Spatial Organisation of Fruit Growing at the Beginning of the 21st Century: The Case of Grójec Poviat (Mazovia Voivodeship. Poland). Quaest. Geogr. 2017, 36, 71–84. [Google Scholar] [CrossRef][Green Version]
- Nowakowski, E. Physiographical characteristics of Warsaw and the Mazovian Lowland. Memorabilia Zool. 1981, 34, 13–31. [Google Scholar]
- Andersen, C.B.; Lewis, G.P.; Sargent, K.A. Influence of wastewater-treatment effluent on concentrations and fluxes of solutes in the Bush River, South Carolina, during extreme drought conditions. Environ. Geosci. 2004, 11, 28–41. [Google Scholar] [CrossRef]
- Wiatkowski, M. Influence of Słup Dam Reservoir on Flow and Quality of Water in the Nysa Szalona River. Pol. J. Environ. Stud. 2011, 20, 469–478. [Google Scholar]
- Ignatius, A.R.; Rasmussen, T.C. Small reservoir effects on headwater water quality in the rural-urban fringe, Georgia Piedmont, USA. J. Hydrol. Reg. Stud. 2016, 8, 145–161. [Google Scholar] [CrossRef]
- Kanownik, W.; Policht-Latawiec, A.; Gajda, A. Influence of Sitkówka sewage treatment plant on the Bobrza River water quality. J. Water Land Dev. 2017, 34, 153–162. [Google Scholar] [CrossRef]
- Lenart-Boroń, A.; Bojarczuk, A.; Jelonkiewicz, Ł.; Żelazny, M. The effect of a Sewage Treatment Plant modernization on changes in the microbiological and physicochemical quality of water in the receiver. Arch. Environ. Prot. 2019, 45, 37–49. [Google Scholar]
- Tomczyk, A.M.; Szyga-Pluta, K.; Bednorz, E. The effect of macro-scale circulation types on the length of the growing season in Poland. Meteorol. Atmospheric Phys. 2019, 131, 1315–1325. [Google Scholar] [CrossRef]
- Zhang, J.; Li, F.; Zhang, Q.; Li, J.; Liu, Q. Tracing nitrate pollution sources and transformation in surface- and ground-waters using environmental isotopes. Sci. Total Environ. 2014, 490, 213–222. [Google Scholar] [CrossRef]
- Mrkva, L.; Janský, B. Surface water quality in the Mastnik stream catchment area: The situation in the Czech countryside. Geografie 2018, 123, 479–505. [Google Scholar] [CrossRef]
- Richards, G.; Gilmore, T.E.; Mittelstet, A.R.; Messer, T.L.; Snow, D.D. Baseflow nitrate dynamics within nested watersheds of an agricultural stream in Nebraska, USA. Agric. Ecosyst. Environ. 2021, 308, 107223. [Google Scholar] [CrossRef]
- Song, M.; Jiang, Y.; Liu, Q.; Tian, Y.; Liu, Y.; Xu, X.; Kang, M. Catchment versus Riparian Buffers: Which Land Use Spatial Scales Have the Greatest Ability to Explain Water Quality Changes in a Typical Temperate Watershed? Water 2021, 13, 1758. [Google Scholar] [CrossRef]
- Khamis, K.; Blaen, P.J.; Comer-Warner, S.; Hannah, D.M.; MacKenzie, A.R.; Krause, S. High-Frequency Monitoring Reveals Multiple Frequencies of Nitrogen and Carbon Mass Balance Dynamics in a Headwater Stream. Front. Water 2021, 3, 668924. [Google Scholar] [CrossRef]
- Winter, C.; Lutz, S.R.; Musolff, A.; Kumar, R.; Weber, M.; Fleckenstein, J.H. Disentangling the impact of catchment heterogeneity on nitrate export dynamics from event to long-term time scales. Water Resour. Res. 2021, 57, e2020WR027992. [Google Scholar] [CrossRef]
- Ławniczak, A.E.; Zbierska, J.; Nowak, B.; Achtenberg, K.; Grześkowiak, A.; Kanas, K. Impact of agriculture and land use on nitrate contamination in groundwater and running waters in central-west Poland. Environ. Monit. Assess. 2016, 188, 172. [Google Scholar] [CrossRef]
- Weber, G.; Honecker, U.; Kubiniok, J. Nitrate dynamics in springs and headwater streams with agricultural catchments in southwestern Germany. Sci. Total Environ. 2020, 722, 137858. [Google Scholar] [CrossRef]
- Agricultural Census. Statistics Poland. 2010. Available online: https://geo.stat.gov.pl/imap/ (accessed on 18 August 2021).
- Withers, P.J.A.; Jarvie, H.P.; Stoate, C. Quantifying the impact of septic tank systems on eutrophication risk in rural headwaters. Environ. Int. 2011, 37, 644–653. [Google Scholar] [CrossRef]
- Łaszewski, M. Human Impact on Spatial Water Temperature Variability in Lowland Rivers: A Case Study from Central Poland. Pol. J. Environ. Stud. 2018, 27, 191–200. [Google Scholar] [CrossRef]
- Graf, R. A multifaceted analysis of the relationship between daily temperature of river water and air. Acta Geophys. 2019, 67, 905–920. [Google Scholar] [CrossRef]
- Kail, J.; Palt, M.; Lorenz, A.; Hering, D. Woody buffer effects on water temperature: The role of spatial configuration and daily temperature fluctuations. Hydrol. Process. 2021, 35, e14008. [Google Scholar] [CrossRef]
- Szczucińska, A.M.; Wasielewski, H. Seasonal water temperature variability of springs from porous sediments in Gryżynka Valley, western Poland. Quaest. Geogr. 2013, 32, 111–117. [Google Scholar] [CrossRef]
- Moniewski, P. Rola zbiorników wodnych w kształtowaniu cech fizykochemicznych wód rzecznych na przykładzie Ciosenki. Prace Stud. Geogr. 2015, 58, 7–23. [Google Scholar]
- Hoorman, J.; Hone, T.; Sudman, T.; Dirksen, T.; Iles, J.; Islam, K.R. Agricultural impacts on lake and stream water quality in Grand Lake St. Marys, Western Ohio. Water Air Soil Pollut. 2008, 193, 309–322. [Google Scholar] [CrossRef]
- Rajwa-Kuligiewicz, A.; Bialik, R.J.; Rowiński, P.M. Dissolved oxygen and water temperature dynamics in lowland rivers over various timescales. J. Hydrol. Hydromech. 2015, 63, 353–363. [Google Scholar] [CrossRef]
- Jabłońska, E.; Wiśniewska, M.; Marcinkowski, P.; Grygoruk, M.; Walton, C.R.; Zak, D.; Hoffmann, C.C.; Larsen, S.E.; Trepel, M.; Kotowski, W. Catchment-Scale Analysis Reveals High Cost-Effectiveness of Wetland Buffer Zones as a Remedy to Non-Point Nutrient Pollution in North-Eastern Poland. Water 2020, 12, 629. [Google Scholar] [CrossRef]
- Shen, W.; Li, S.; Mi, M.; Zhuang, Y.; Zhang, L. What makes ditches and ponds more efficient in nitrogen control? Agric. Ecosyst. Environ. 2021, 314, 107409. [Google Scholar] [CrossRef]
- Hubačíková, V.; Oppeltová, P. The impact of pond on water quality in the Čermna Stream. J. Ecol. Eng. 2017, 18, 42–47. [Google Scholar] [CrossRef]
- Gruss, Ł.; Wiatkowski, M.; Pulikowski, K.; Kłos, A. Determination of Changes in the Quality of Surface Water in the River—Reservoir System. Sustainability 2021, 13, 3457. [Google Scholar] [CrossRef]
- Bayram, A.; Önsoy, H.; Ihsan Kömürcü, M.; Bulut, V.N. Effects of Torul dam on water quality in the stream Harşit, NE Turkey. Environ. Earth Sci. 2012, 65, 713–723. [Google Scholar] [CrossRef]
- Rigacci, L.N.; Giorgi, A.D.N.; Vilches, C.S.; Ossana, N.A.; Salibián, A. Effect of a reservoir in the water quality of the Reconquista River, Buenos Aires, Argentina. Environ. Monit. Assess. 2013, 185, 9161–9168. [Google Scholar] [CrossRef]
- Figueroa-Nieves, D.; McDowell, W.H.; Potter, J.D.; Martínez, G.; Ortiz-Zayas, J.R. Effects of sewage effluents on water quality in tropical streams. J. Environ. Qual. 2014, 43, 2053–2063. [Google Scholar] [CrossRef] [PubMed]
- Izydorczyk, K.; Michalska-Hejduk, D.; Frątczak, W.; Bednarek, A.; Łapińska, M.; Jarosiewicz, P.; Kosińska, A.; Zalewski, M. Strefy Buforowe i Biotechnologie Ekohydrologiczne w Ograniczaniu Zanieczyszczeń Obszarowych; Europejskie Regionalne Centrum Ekohydrologii Polskiej Akademii Nauk: Łódź, Poland, 2015. [Google Scholar]
- Sweeney, B.W.; Newbold, J.D. Streamside forest buffer width needed to protect stream water quality, habitat, and organisms: A literature review. J. Am. Water Resour. Assoc. 2014, 50, 560–584. [Google Scholar] [CrossRef]
- Izydorczyk, K.; Michalska-Hejduk, D.; Jarosiewicz, P.; Bydałek, F.; Frątczak, W. Extensive grasslands as an effective measure for nitrate and phosphate reduction from highly polluted subsurface flow—Case studies from Central Poland. Agric. Water Manage. 2018, 203, 240–250. [Google Scholar] [CrossRef]
- Šaulys, A.; Survile, O.; Stankeviciene, R. An Assessment of Self-Purification in Streams. Water 2020, 12, 87. [Google Scholar] [CrossRef]
- Cui, M.; Zeng, L.; Qin, W.; Feng, J. Measures for reducing nitrate leaching in orchards: A review. Environ. Pollut. 2020, 263, 114553. [Google Scholar] [CrossRef]
- Dąbrowska, J.; Bawiec, A.; Pawęska, K.; Kamińska, J.; Stodolak, R. Assessing the impact of wastewater effluent diversion on water quality. Pol. J. Environ. Stud. 2017, 26, 9–16. [Google Scholar] [CrossRef]
- Napiórkowska-Krzebietke, A.; Wierzchowska, M.; Błocka, B.; Hutorowicz, J.; Hutorowicz, A.; Zdanowski, B. Changes in the Trophic State of Lake Niegocin after the Modernization of a Local Wastewater Treatment Plant. Limnol. Rev. 2007, 3, 153–159. [Google Scholar]
- Marszelewski, W.; Piasecki, A. Changes in Water and Sewage Management after Communism: Example of the Oder River Basin (Central Europe). Sci. Rep. 2020, 10, 6456. [Google Scholar] [CrossRef] [PubMed]
- Piasecki, A. Water and Sewage Management Issues in Rural Poland. Water 2019, 11, 625. [Google Scholar] [CrossRef]


| Sampling Site | River/ Stream | A [km2] | Land Cover Classes | Site Description | ||||
|---|---|---|---|---|---|---|---|---|
| FOR | MEAD | ORCH | ARA | ANTR | ||||
| M1 | Mogielanka | 30.5 | 4.6 | 0.8 | 77.9 | 15.8 | 0.9 | Regulated reach |
| M2 | Mogielanka | 44.6 | 9.3 | 0.6 | 78.7 | 10.8 | 0.6 | Natural reach |
| M3 | Mogielanka | 53.0 | 9.1 | 0.5 | 80.3 | 9.1 | 1.0 | Site located directly below a dam reservoir, regulated reach |
| M4 | Mogielanka | 158.7 | 7.4 | 0.8 | 84.9 | 5.1 | 1.8 | Natural reach |
| M5 | Mogielanka | 162.3 | 7.7 | 0.8 | 84.5 | 5.2 | 1.8 | Natural reach |
| M6 | Mogielanka | 171.1 | 8.0 | 0.9 | 82.5 | 6.9 | 1.7 | Site located directly below a dam reservoir, regulated reach |
| M7 | Mogielanka | 182.5 | 8.3 | 1.0 | 82.5 | 6.5 | 1.7 | Natural reach |
| M8 | Mogielanka | 192.5 | 9.1 | 1.2 | 81.1 | 6.3 | 2.3 | Site located circa 700 m below an effluent discharge, regulated reach |
| M9 | Mogielanka | 218.8 | 10.0 | 1.7 | 74.4 | 11.4 | 2.5 | Natural reach |
| T1 | Machnatka | 52.6 | 9.5 | 1.1 | 83.5 | 4.4 | 1.5 | Regulated reach |
| T2 | Rębowola Stream | 13.4 | 3.0 | 0.0 | 93.3 | 3.7 | 0.0 | Site located circa 200 m below a small pond, tributary was regulated during investigation |
| T3 | Machnatka | 84.7 | 7.5 | 1.2 | 86.3 | 3.3 | 1.7 | Site located 250 m below an effluent discharge, end of regulated reach |
| T4 | Huta Błędowska Stream | 16.5 | 0.0 | 0.0 | 92.5 | 2.0 | 5.5 | Regulated reach |
| T5 | Dańków Stream | 1.6 | 10.5 | 0.0 | 13.7 | 75.8 | 0.0 | End of natural reach |
| T6 | Jastrzębia Stream | 10.1 | 18.4 | 4.2 | 31.9 | 45.5 | 0.0 | Site located below a peat bog, natural reach |
| Month | Sum of Precipitation | |||
|---|---|---|---|---|
| 5 Days | 10 Days | 15 Days | 30 Days | |
| IV | 0.0 | 0.0 | 0.6 | 8.7 |
| V | 17.9 | 17.9 | 17.9 | 18.1 |
| VI | 16.6 | 36.0 | 42.0 | 64.8 |
| VII | 33.8 | 59.1 | 138.5 | 222.1 |
| VIII | 0.6 | 0.6 | 14.2 | 36.9 |
| IX | 6.4 | 18.4 | 54.0 | 82.6 |
| X | 8.3 | 28.3 | 63.3 | 63.3 |
| XI | 6.0 | 8.0 | 9.2 | 93.8 |
| XII | 0.0 | 0.0 | 2.5 | 3.2 |
| I | 16.7 | 2.6 | 25.9 | 45.1 |
| II | 11.6 | 15.4 | 22.3 | 34.4 |
| Parameter | Metric | 5 Days | 10 Days | 15 Days | 30 Days | ||||
|---|---|---|---|---|---|---|---|---|---|
| IV-II | IV-XI | IV-II | IV-XI | IV-II | IV-XI | IV-II | IV-XI | ||
| NO3− | Mean | 0.460 | 0.571 | 0.487 | 0.714 | 0.345 | 0.500 | 0.509 | 0.905 |
| Median | 0.606 | 0.714 | 0.497 | 0.667 | 0.327 | 0.429 | 0.473 | 0.810 | |
| NO2− | Mean | 0.806 | 0.810 | 0.642 | 0.690 | 0.436 | 0.405 | 0.327 | 0.429 |
| Median | 0.749 | 0.762 | 0.666 | 0.667 | 0.409 | 0.333 | 0.451 | 0.357 | |
| NH4+ | Mean | −0.141 | 0.143 | −0.196 | 0.071 | −0.327 | −0.190 | −0.164 | 0.071 |
| Median | −0.123 | 0.214 | −0.141 | 0.095 | −0.300 | −0.214 | −0.145 | 0.048 | |
| PO43− | Mean | −0.077 | −0.143 | −0.360 | −0.500 | −0.318 | −0.262 | −0.655 | −0.762 |
| Median | 0.014 | 0.048 | −0.223 | −0.262 | −0.227 | −0.119 | −0.664 | −0.810 | |
| Parameter | O2 | EC | pH | NO3− | NO2− | NH4+ | PO43− |
|---|---|---|---|---|---|---|---|
| O2 | 1.000 | ||||||
| EC | −0.095 | 1.000 | |||||
| pH | 0.260 | −0.740 | 1.000 | ||||
| NO3− | −0.098 | −0.319 | 0.081 | 1.000 | |||
| NO2− | −0.907 | −0.042 | −0.165 | 0.298 | 1.000 | ||
| NH4+ | −0.476 | 0.308 | −0.628 | 0.077 | 0.480 | 1.000 | |
| PO43− | −0.371 | 0.011 | 0.046 | −0.720 | 0.270 | 0.196 | 1.000 |
Publisher’s Note: MDPI stays neutral with regard to jurisdictional claims in published maps and institutional affiliations. |
© 2021 by the authors. Licensee MDPI, Basel, Switzerland. This article is an open access article distributed under the terms and conditions of the Creative Commons Attribution (CC BY) license (https://creativecommons.org/licenses/by/4.0/).
Share and Cite
Stępniewski, K.; Łaszewski, M. Spatial and Seasonal Dynamics of Inorganic Nitrogen and Phosphorous Compounds in an Orchard-Dominated Catchment with Anthropogenic Impacts. Sustainability 2021, 13, 11337. https://doi.org/10.3390/su132011337
Stępniewski K, Łaszewski M. Spatial and Seasonal Dynamics of Inorganic Nitrogen and Phosphorous Compounds in an Orchard-Dominated Catchment with Anthropogenic Impacts. Sustainability. 2021; 13(20):11337. https://doi.org/10.3390/su132011337
Chicago/Turabian StyleStępniewski, Krzysztof, and Maksym Łaszewski. 2021. "Spatial and Seasonal Dynamics of Inorganic Nitrogen and Phosphorous Compounds in an Orchard-Dominated Catchment with Anthropogenic Impacts" Sustainability 13, no. 20: 11337. https://doi.org/10.3390/su132011337
APA StyleStępniewski, K., & Łaszewski, M. (2021). Spatial and Seasonal Dynamics of Inorganic Nitrogen and Phosphorous Compounds in an Orchard-Dominated Catchment with Anthropogenic Impacts. Sustainability, 13(20), 11337. https://doi.org/10.3390/su132011337