Article

Are PM2.5 in the Atmosphere of a Small City a Threat for Health?

by
Glykeria Loupa
*,
Zoi Panagiota Kryona
,
Varvara Pantelidou
and
Spyridon Rapsomanikis
Laboratory of Atmospheric Pollution and Pollution Control Engineering of Atmospheric Pollutants, Department of Environmental Engineering, Faculty of Engineering, Democritus University of Thrace, 67100 Xanthi, Greece
*
Author to whom correspondence should be addressed.
Sustainability 2021, 13(20), 11329; https://doi.org/10.3390/su132011329
Submission received: 21 July 2021 / Revised: 15 September 2021 / Accepted: 10 October 2021 / Published: 14 October 2021
(This article belongs to the Special Issue Urban Air Pollution: Monitoring, Impact, and Mitigation)

Abstract

:
A number of time series from two local PM2.5 monitoring stations were analyzed, for a small city, in North East Greece. They coincided with SARS-CoV-2 pandemic lockdowns and lifting restrictions. The aim of this analysis was to establish concentration exceedances and roughly apportion sources of the PM2.5 concentration problem. This was established by analyzing 24-h filter samples of trace elements using WD-XRF. It was found that the restrictions and their lifting did not significantly affect these concentrations. The main problems were assigned to emissions from biomass burning central heating and Saharan dust episodes. The study results indicate that even in small cities the air quality as far as PM2.5 is concerned can still be deleterious to the local population according to the WHO restricting levels but not according to the EU levels. The fact that PM2.5 is not a single chemical pollutant makes matters more complicated and renders such concentration upper levels, of little significance.

1. Introduction

Air pollution is a threat to our lives [1,2]. All over the world, the reduction of the atmospheric concentrations of the PM2.5 (particulate matter with aerodynamic diameter < 2.5 μm) can promote health and prevent millions of premature deaths each year [3]. The exposure to PM2.5 has been associated with respiratory and cardiopulmonary diseases among other health issues. Lately, it has also been reported that such an exposure may make the population more susceptible to COVID-19 [4,5].
In an extensive European study, the exposure to PM2.5 has been found to be associated with natural-cause mortality, even at concentrations well below the present European annual mean limit value [6]. The EU limit value for the fine particles is 25 μg m−3, as an annual mean. The WHO air quality guideline values are: 10 μg m−3 annual mean and 25 μg m−3 as a 24-h mean. The US EPA in 2020 announced the National Ambient Air Quality Standards (NAAQS) for PM2.5. The primary (health-based) and the secondary (welfare-based) standards, are: 12 μg m−3 annual average standards and 15 μg m−3, respectively as annual averages; 24-h standard at the level of 35 μg m−3. Similar standards were set for China and Japan [7].
The reference methods for measuring PM2.5 by the European Committee for Standardisation [8] and by the US EPA Federal Reference Methods [9] are gravimetric methods, which are usually laborious. Thus, new methods that need calibration with the gravimetric method have been used by scientists. These methods are characterized by their ease of use and their ability to monitor the PM2.5 concentrations with a very short time step. Common examples are those methods which are based on optical aerosol properties (e.g., a nephelometer) [10]. In the present work, both approaches were implemented.
In the urban environment or other agglomerations, PM2.5 national or international limit values or guideline values are often exceeded. However, human activities (industrial, agricultural, traffic), the transport of air pollutants from an area to another, as well as natural phenomena such as the Saharan dust, are present everywhere. PM2.5 may originate from diverse sources, both anthropogenic and natural ones, as well as the fact that they can be generated through atmospheric chemical reactions. Thus, PM2.5 is a complex air pollutant that its chemical composition depends on the emission source and the chemical transformation that it can undergo during its travel from the source to the receptor.
The recorded PM2.5 concentrations in a monitoring station depend on its location (urban, suburban, rural etc.). PM2.5 concentrations depend on the air pollutants that are emitted locally, as well as on those that are transported from other areas, sometimes many kilometers away. They can be primarily emitted or they can be secondary formatted from precursor pollutants [11,12,13]. Unexpected events can also affect PM2.5 concentrations in the atmosphere. For example, during periods of severe lockdown due to COVID-19 pandemic, the PM2.5 concentrations in some areas have decreased due to minimized human activity, but this was not always the case [14].
The European project “Urban PM2.5 Atlas-Air Quality in European cities”, which provides information on the levels of air pollution in 150 European cities aims to promote mitigation strategies for the PM2.5 concentrations [15]. In this project, it is emphasized the need to acquire data from as many as possible monitoring stations. These data are a valuable tool for the local authorities that may assist them to implement effective measures to improve the air quality of the city [15].
In not densely urbanized environments, PM2.5 mass concentrations are expected to be below to legislation limits. However, local sources, as the biomass burning and vehicle traffic, can result at enhanced PM2.5 levels [16]. The other issue that may deteriorate the air quality in an area is the long-range transport of the aerosol [17]. The aim of the present study is to characterize the seasonal, monthly and daily variations of the PM2.5 mass concentration through continuous monitoring in a small city, supported by gravimetric measurements and elemental analysis. Thus, to trace the origin of elevated PM2.5 levels, when such concentrations were recorded and to propose possible mitigation measures.

2. Materials and Methods

An air quality monitoring station was installed in the campus of the Democritus University of Thrace (DUTH), in Xanthi Greece. This station (DUTH station) photo presented in the graphical abstract is located in a terrace of a building, 8 m above the ground (41°8′31.11″ N, 24°53′26.48″ E). The nearest road is about 50 m from the station due north and the seashore is about 30 km away, due South. Xanthi has ca. 65,000 inhabitants, with few industries located mainly in the south of the city. Xanthi is 83 m above sea level, surrounded by hills, except from the south and its climate is warm and temperate. The station can be considered as urban background (please see the map provided in the Supplementary Material, Figures S1 and S2). The data processed in the present publication cover a period of 13 months, from June 2020 to June 2021.
Meteorological data were obtained with a 10-min time interval. Air temperature and relative humidity were monitored with two sensors (Vaisala HMP45C, Vaisala HUMICAP®, Helsinki, Finland). Wind speed and direction were recorded by a Young anemometer (R. M. Young Company, Traverse City, MI, USA).
Additionally, the air masses origin (as for example the arrival of Saharan dust) was investigated with a backward trajectory analysis. For this analysis, the HYbrid Single-Particle Lagrangian Integrated Trajectory (HYSPLIT) model was applied [18]. Τhe GDAS (Global Data Analysis System) meteorological files (spatial resolution of 1° × 1°, every 3 h) were used as data input. The kinematic backward trajectories were calculated using the vertical velocity component given by the meteorological model with a 48–96 h pathway (2–4 days back). Three simultaneous trajectories were calculated at three levels. The heights selected for the summer were 1500 m, 2500 m and 4000 m above model ground level and in the winter, the respective heights were 500 m, 1000 m and 2000 m.
Particle scattering was measured with an integrating nephelometer (Particle Soot Absorption Photometer, Radiance Research, wavelength at 565 nm; Radiance Research; Seattle, WA, USA), at 14-min time interval. The nephelometer operated with a Nafion™ dryer in place to avoid RH interference [10]. The nephelometer readings were converted to PM2.5 mass concentrations, based on in situ gravimetric measurement’s calibration, to obtain the PM2.5 diurnal variation [10].
From March to June 2021, air samples were acquired with a laboratory made 90 mm diameter Dichotomous Stack Filter Units (DSFUs) [19], with filter packs, for ca. 24-h periods to obtain PM2.5 mass concentration and their elemental composition. During days with cold weather 27 filters were collected and 26 filters in warm days. The filters were analyzed for trace elements in the Laboratory of Atmospheric Pollution and Pollution Control Engineering, in Thrace, Greece. The analysis was conducted by a Wavelength Dispersive X-Ray Fluorescence system (WD-XRF, Rigaku, ZSX Primus II, Tokyo, Japan) to determine the concentrations of Al, Si, Br, P, S, Na, K, Mg, Ca, Co, Cr, Cu, Fe, Mn, Ni, Pb, Ti and Zn, in PM2.5 [19]. The maximum voltage-intensity of 50-80 kV was used to ensure that all peaks would be seen and measured. Two kinds of analysis took place for all blanks and the samples: a qualitative and a quantitative one. The analysis time of the qualitative one was 12 min, while the time of the quantitative analysis was 24 min for each sample. Each element was scanned by the X-Ray beam for approximately 1 min. For the quantitative analysis, two standards were used (SRM 1648a and SRM 2584, NIST, Gaithersburg, Maryland 20899, USA). The qualitative analysis was used in order to confirm the quantification of the elements.
The PM2.5 mass concentrations acquired by the gravimetric method was applied to convert nephelometer readings (i.e., the light scattering coefficient of PM2.5 (Bsp)) to mass concentration, with the followings Equations (1) and (2):
PM2.5 (μg m−3) = 0.61 × Bsp (Mm−1) + 2.10 (wind direction from South)
PM2.5 (μg m−3) = 0.49 × Bsp (Mm−1) + 1.17 (wind direction from North)
In May 2021, a new air quality and meteorological station was inaugurated inside the university campus, hereafter referred as Kimmeria station (Figures S1 and S3), which is a suburban station. It is located 2.8 km east of the city center and at 1.5 m above the ground level. The station has two instruments. The first is an AQY-1 (AEROQUAL HQ, Auckland, New Zeeland) that records PM2.5 mass concentrations and the gaseous air pollutants ΝO2 and O3, every minute. The second is a weather station (Atmos-41/ZL6 Data Logger, METER Group, Pullman, WA, USA) that monitors air temperature, relative humidity, wind speed and direction, atmospheric pressure, solar radiation, precipitation, all in a time step of 5 min. The PM2.5 mass readings of this station were cross-checked two times per day with an AEROCET 531S Particle Mass Profiler and Counter (Met One Instruments, Inc., Grants Pass, OR, USA). An inter-comparison between PM2.5 mass concentrations recorded by the two stations were conducted with this hand-held instrument.

3. Results

3.1. Meteorological Parameters

Xanthi belongs to the climatic zone C. In Table 1 are summarized the monthly averaged values of the meteorological parameters.
During days with an air temperature below 15 °C were considered hereafter as “cold” days, otherwise as “warm” days. Wind speed ranged between 0.0 and 6.7 m s−1, throughout the period under study, with an average value 1.5 m s−1. As will be shown below, the air masses arrived in the station had variable origin and they are also affected by the city topography (Figure S2). Saharan dust episodes are very common in the area [20].

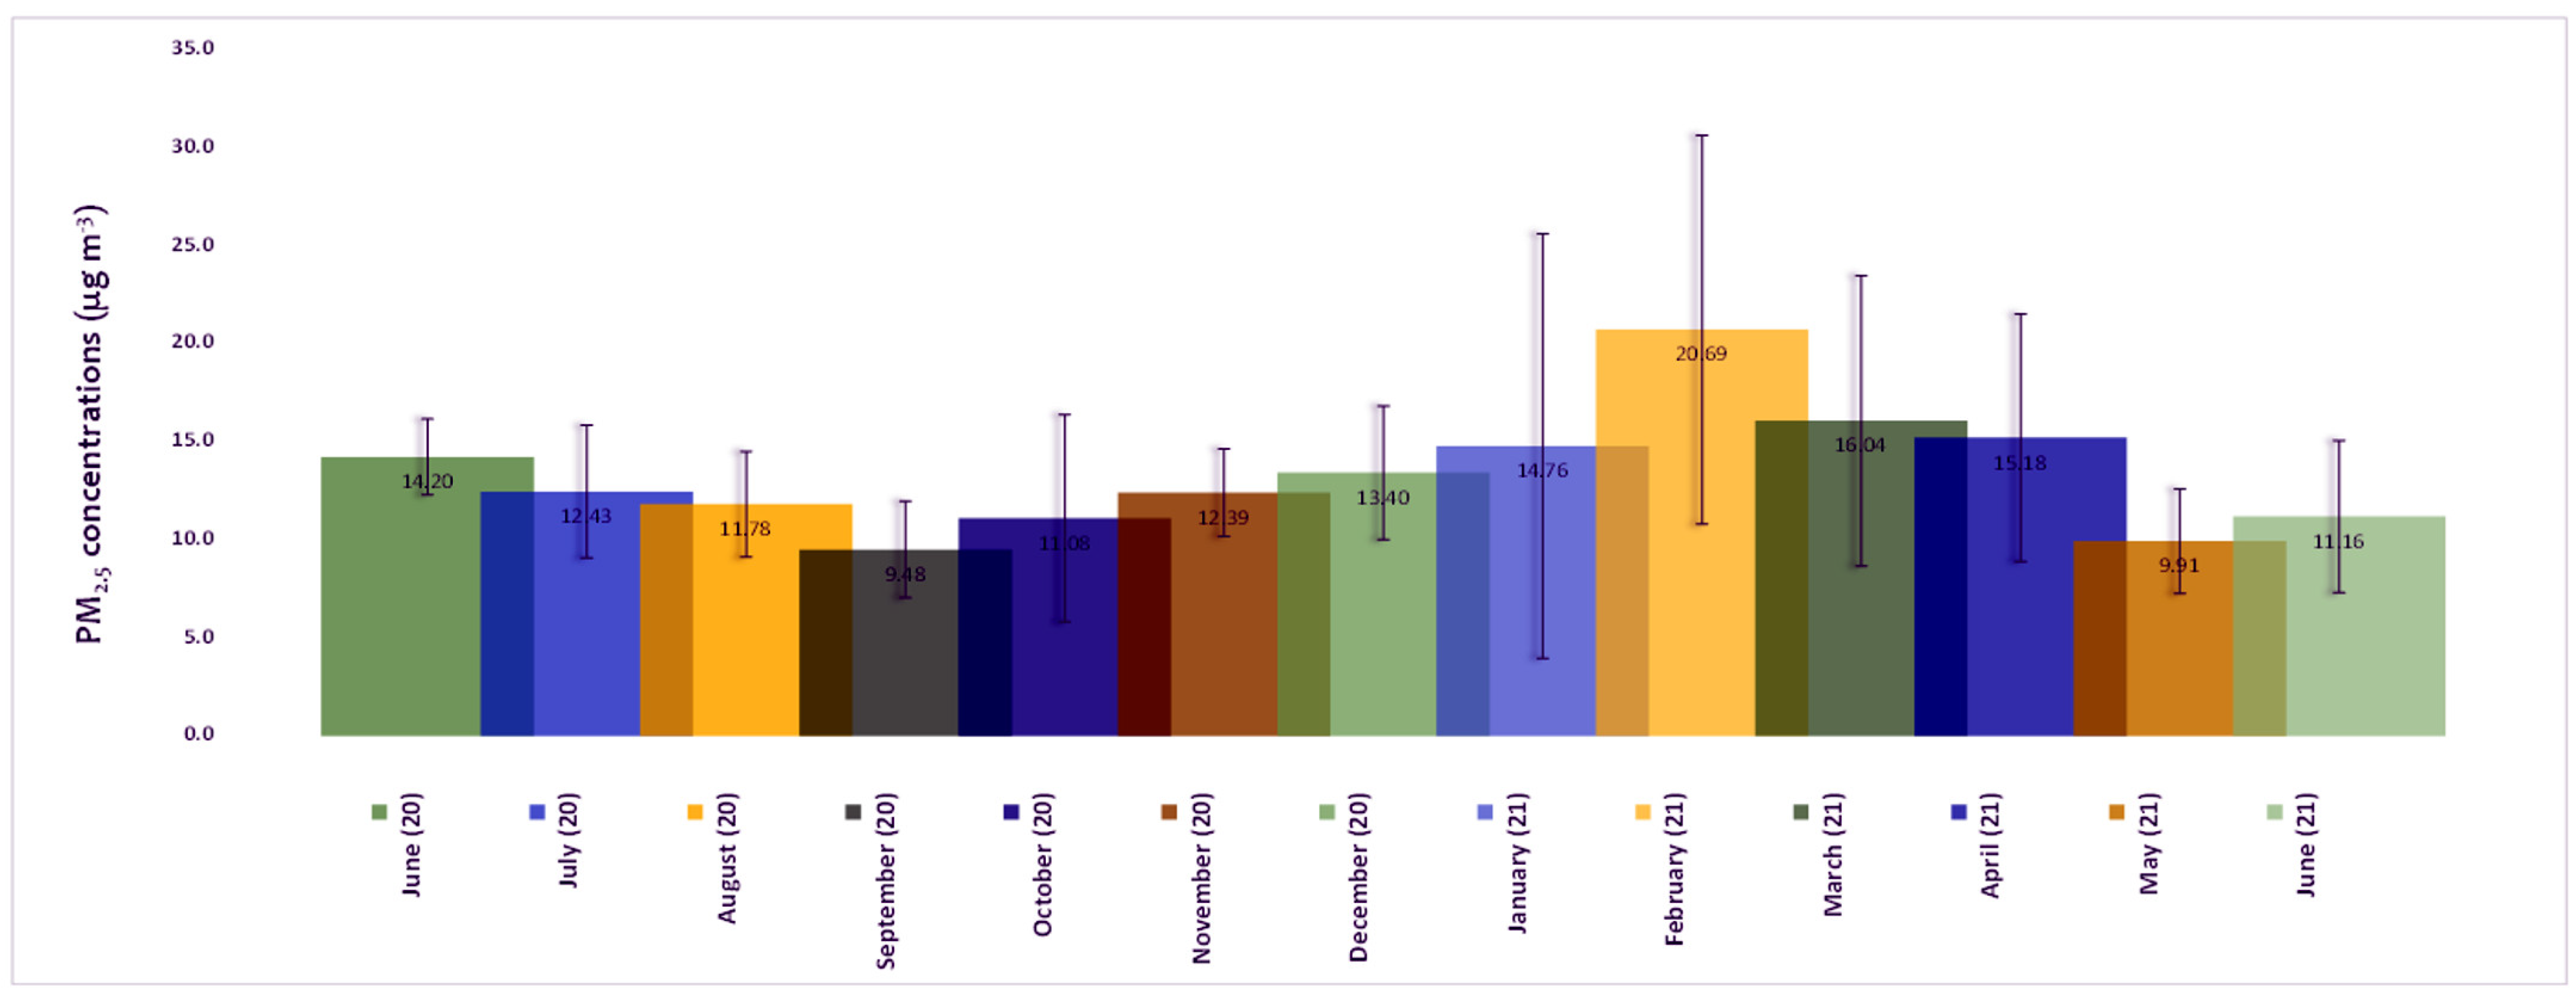
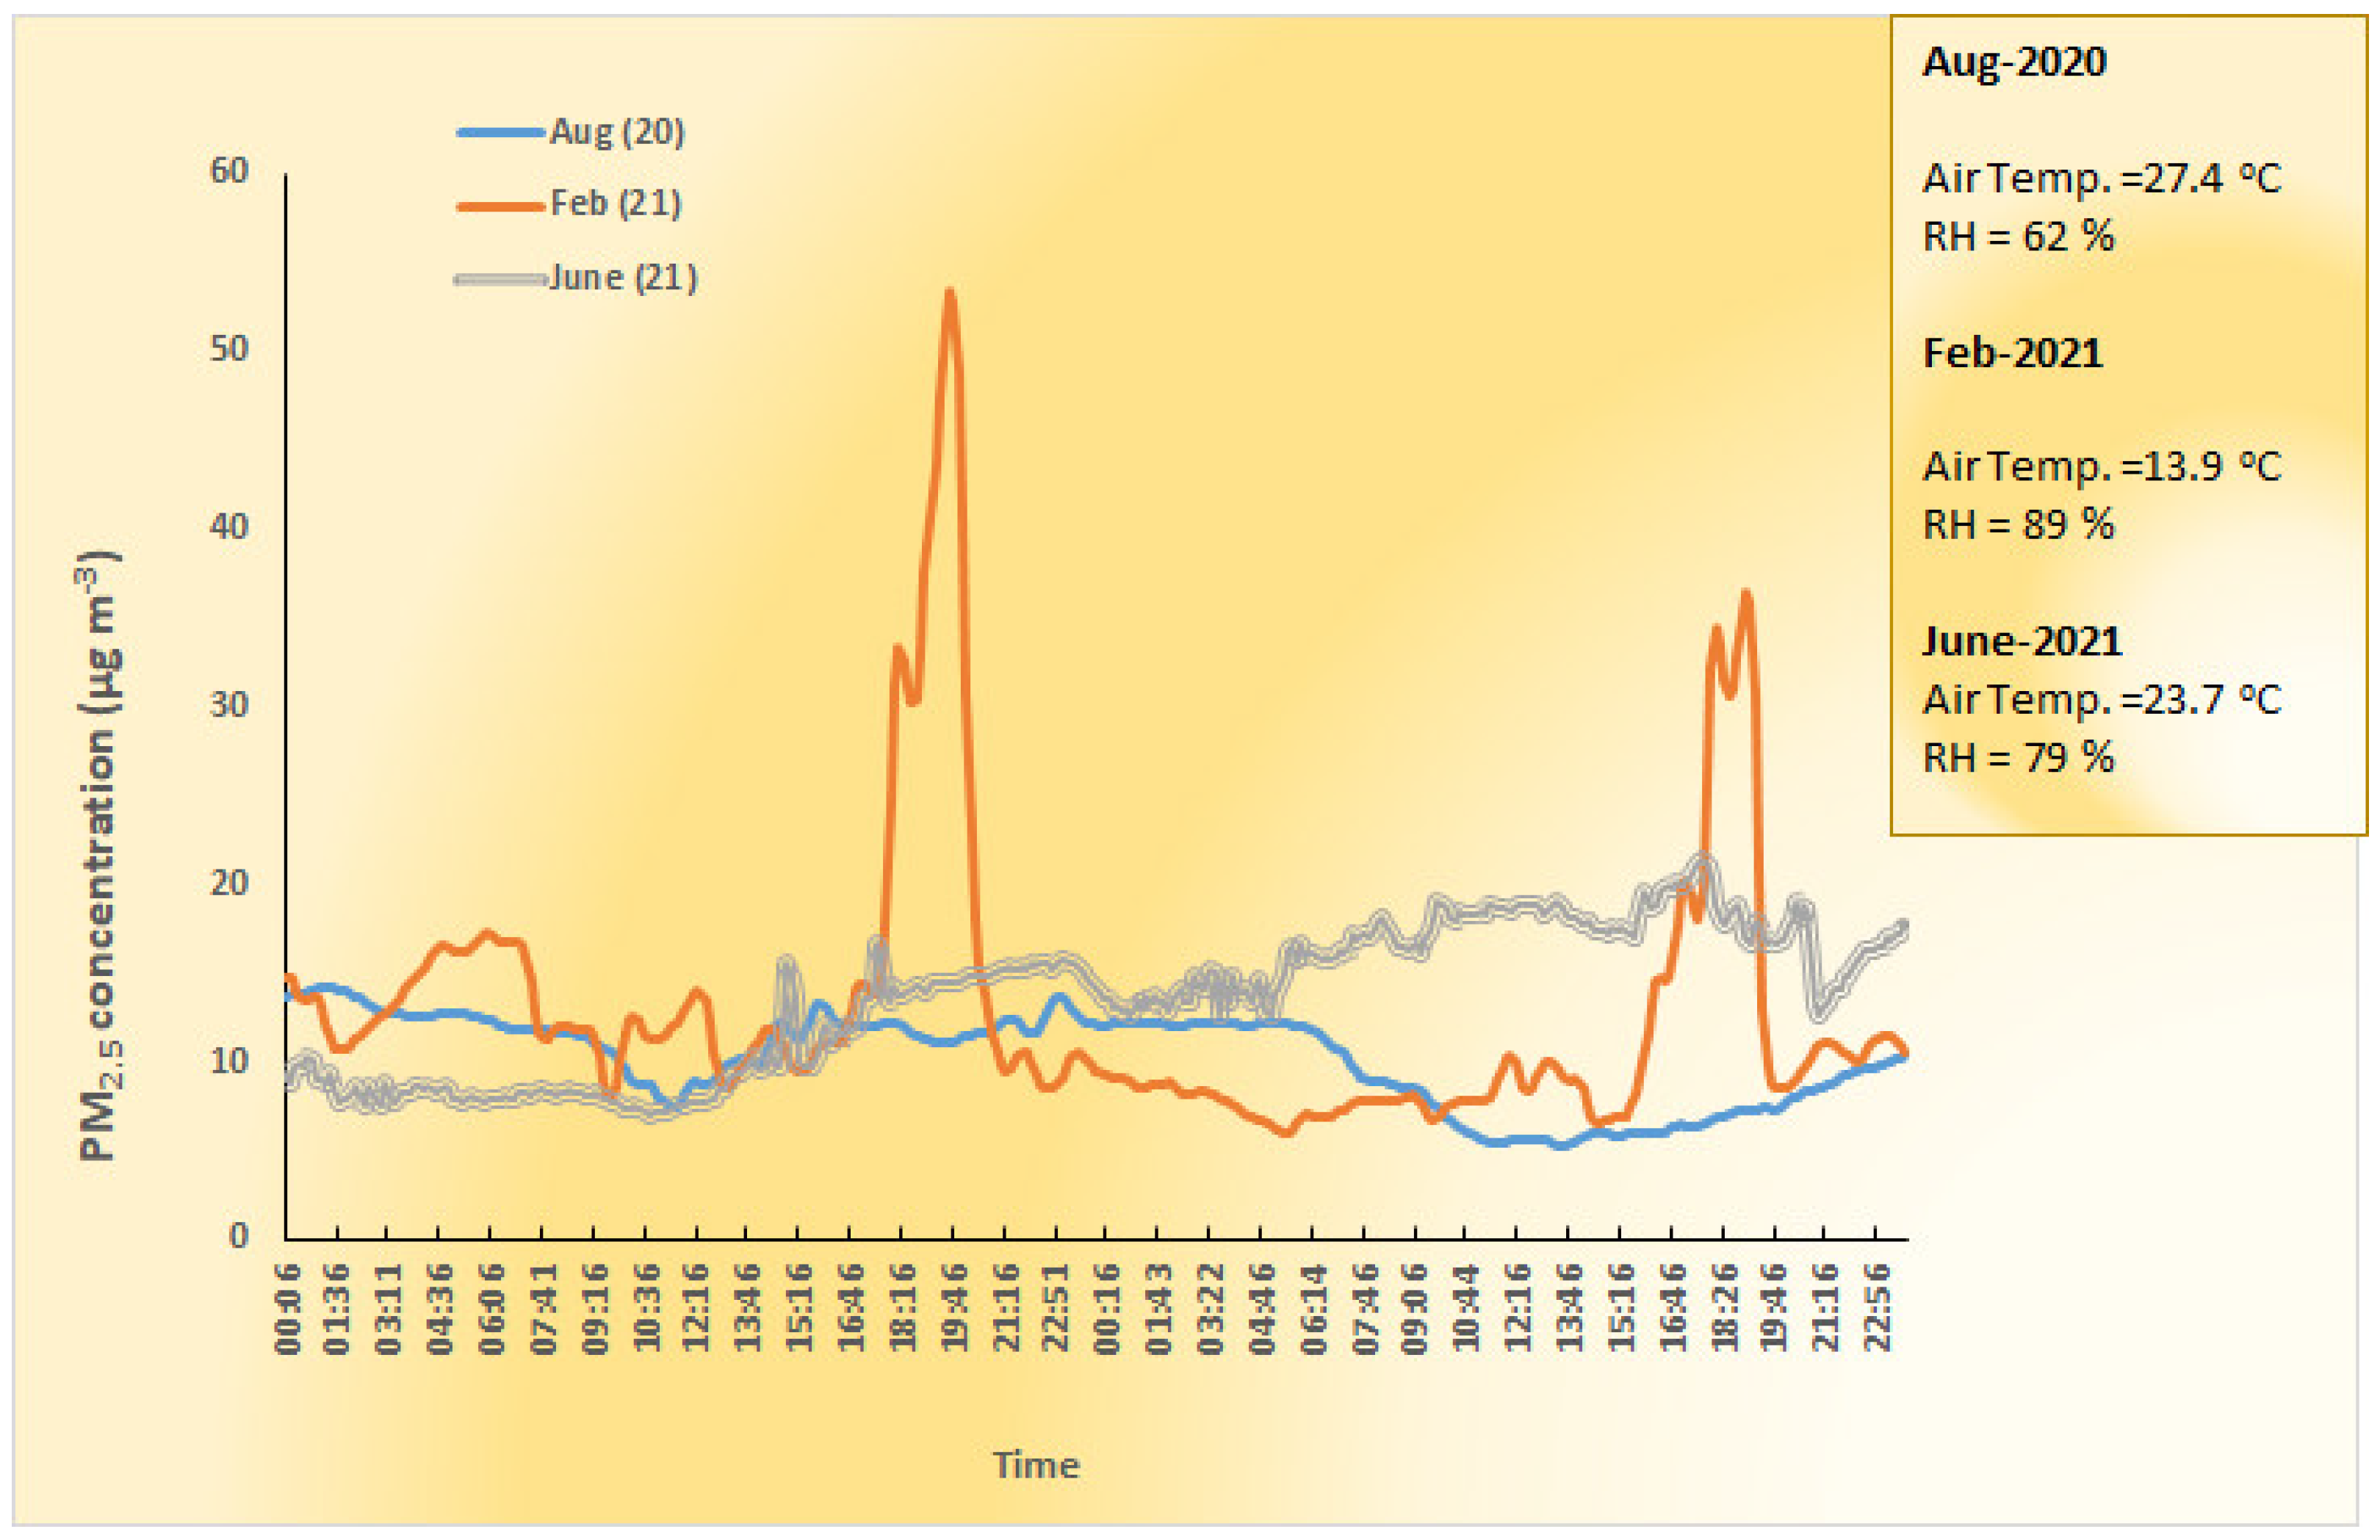
3.2. PM2.5 Mass Concentrations

Figure 1 presents the monthly average PM2.5 mass concentrations for more than one year. January, February and March 2021 were the coldest months and wood burning for residential heating was used at many homes. November, December 2020 and partially January 2021 were months with severe lockdown due to COVID-19 pandemic. The market begun to open the last days of January 2021 and during February 2021. In 15 May 2021, all market restriction were lifted and free movement of the citizens was reestablished. The highest PM2.5 mass concentrations were recorded during February 2021. Before 15 May 2021 and after, no significant change in PM2.5 mass concentrations was observed (please see also Figure S4 presents the detailed PM2.5 mass concentration time-series in the DUTH station for a whole year).
Figure 2 focuses on the diurnal PM2.5 mass concentration variations for a 2-day period, during three months, to highlight special events that affect the observed levels of the ambient aerosol. August 2020 is a month that most of people have vacations and hotels, restaurants (with outdoor charbroiling facilities), coffee shops were all opened. However, due to the threat of the spread of the virus SARS-CoV-2 and the traveling restrictions, limited activity was observed. In this month, low PM2.5 mass concentrations were observed, especially during days when the air masses arrived from north (see Figure S5).
The highest PM2.5 mass concentrations were recorded in February (2021). In these 2 days presented in Figure 2, Saharan dust affected the aerosol concentrations together with the local central heating activities. Traffic was not a main source, since the people movement was limited and the station was not very close to the road. June 2021 represents the period after severe lockdown period. During this month, the highest PM2.5 levels were coincided with a Saharan dust event (see Figure S5) while the lifting of the restrictions of the lockdown did not appear to have significant impact on PM2.5 concentrations. A t-test applied to compare the means of PM2.5 mass concentration between June 2020 (a month with partial lockdown) and June 2021 (no lockdown), with the same instrumentation and in the same location, reveals that PM2.5 levels were significantly lower in June 2021 than in June 2020 (t = 8.36 at p < 0.001).
In Figure 3, data from the second rural station (Kimmeria), are presented, during the Saharan dust episode (20 June 2021 before the arrival of the dust and 21, 22 June 2021 during the episode). The PM2.5 concentrations were lower than in DUTH station (mainly due to the height difference and the local topography). However, they also increased during the episode. The diurnal variations in PM2.5 mass concentrations between the two stations were similar and thus the notion of the contribution of the Saharan dust on the aerosol levels is supported. The NO2 concentrations were decreased, as well as the solar radiation, but O3 concentrations were unaffected.

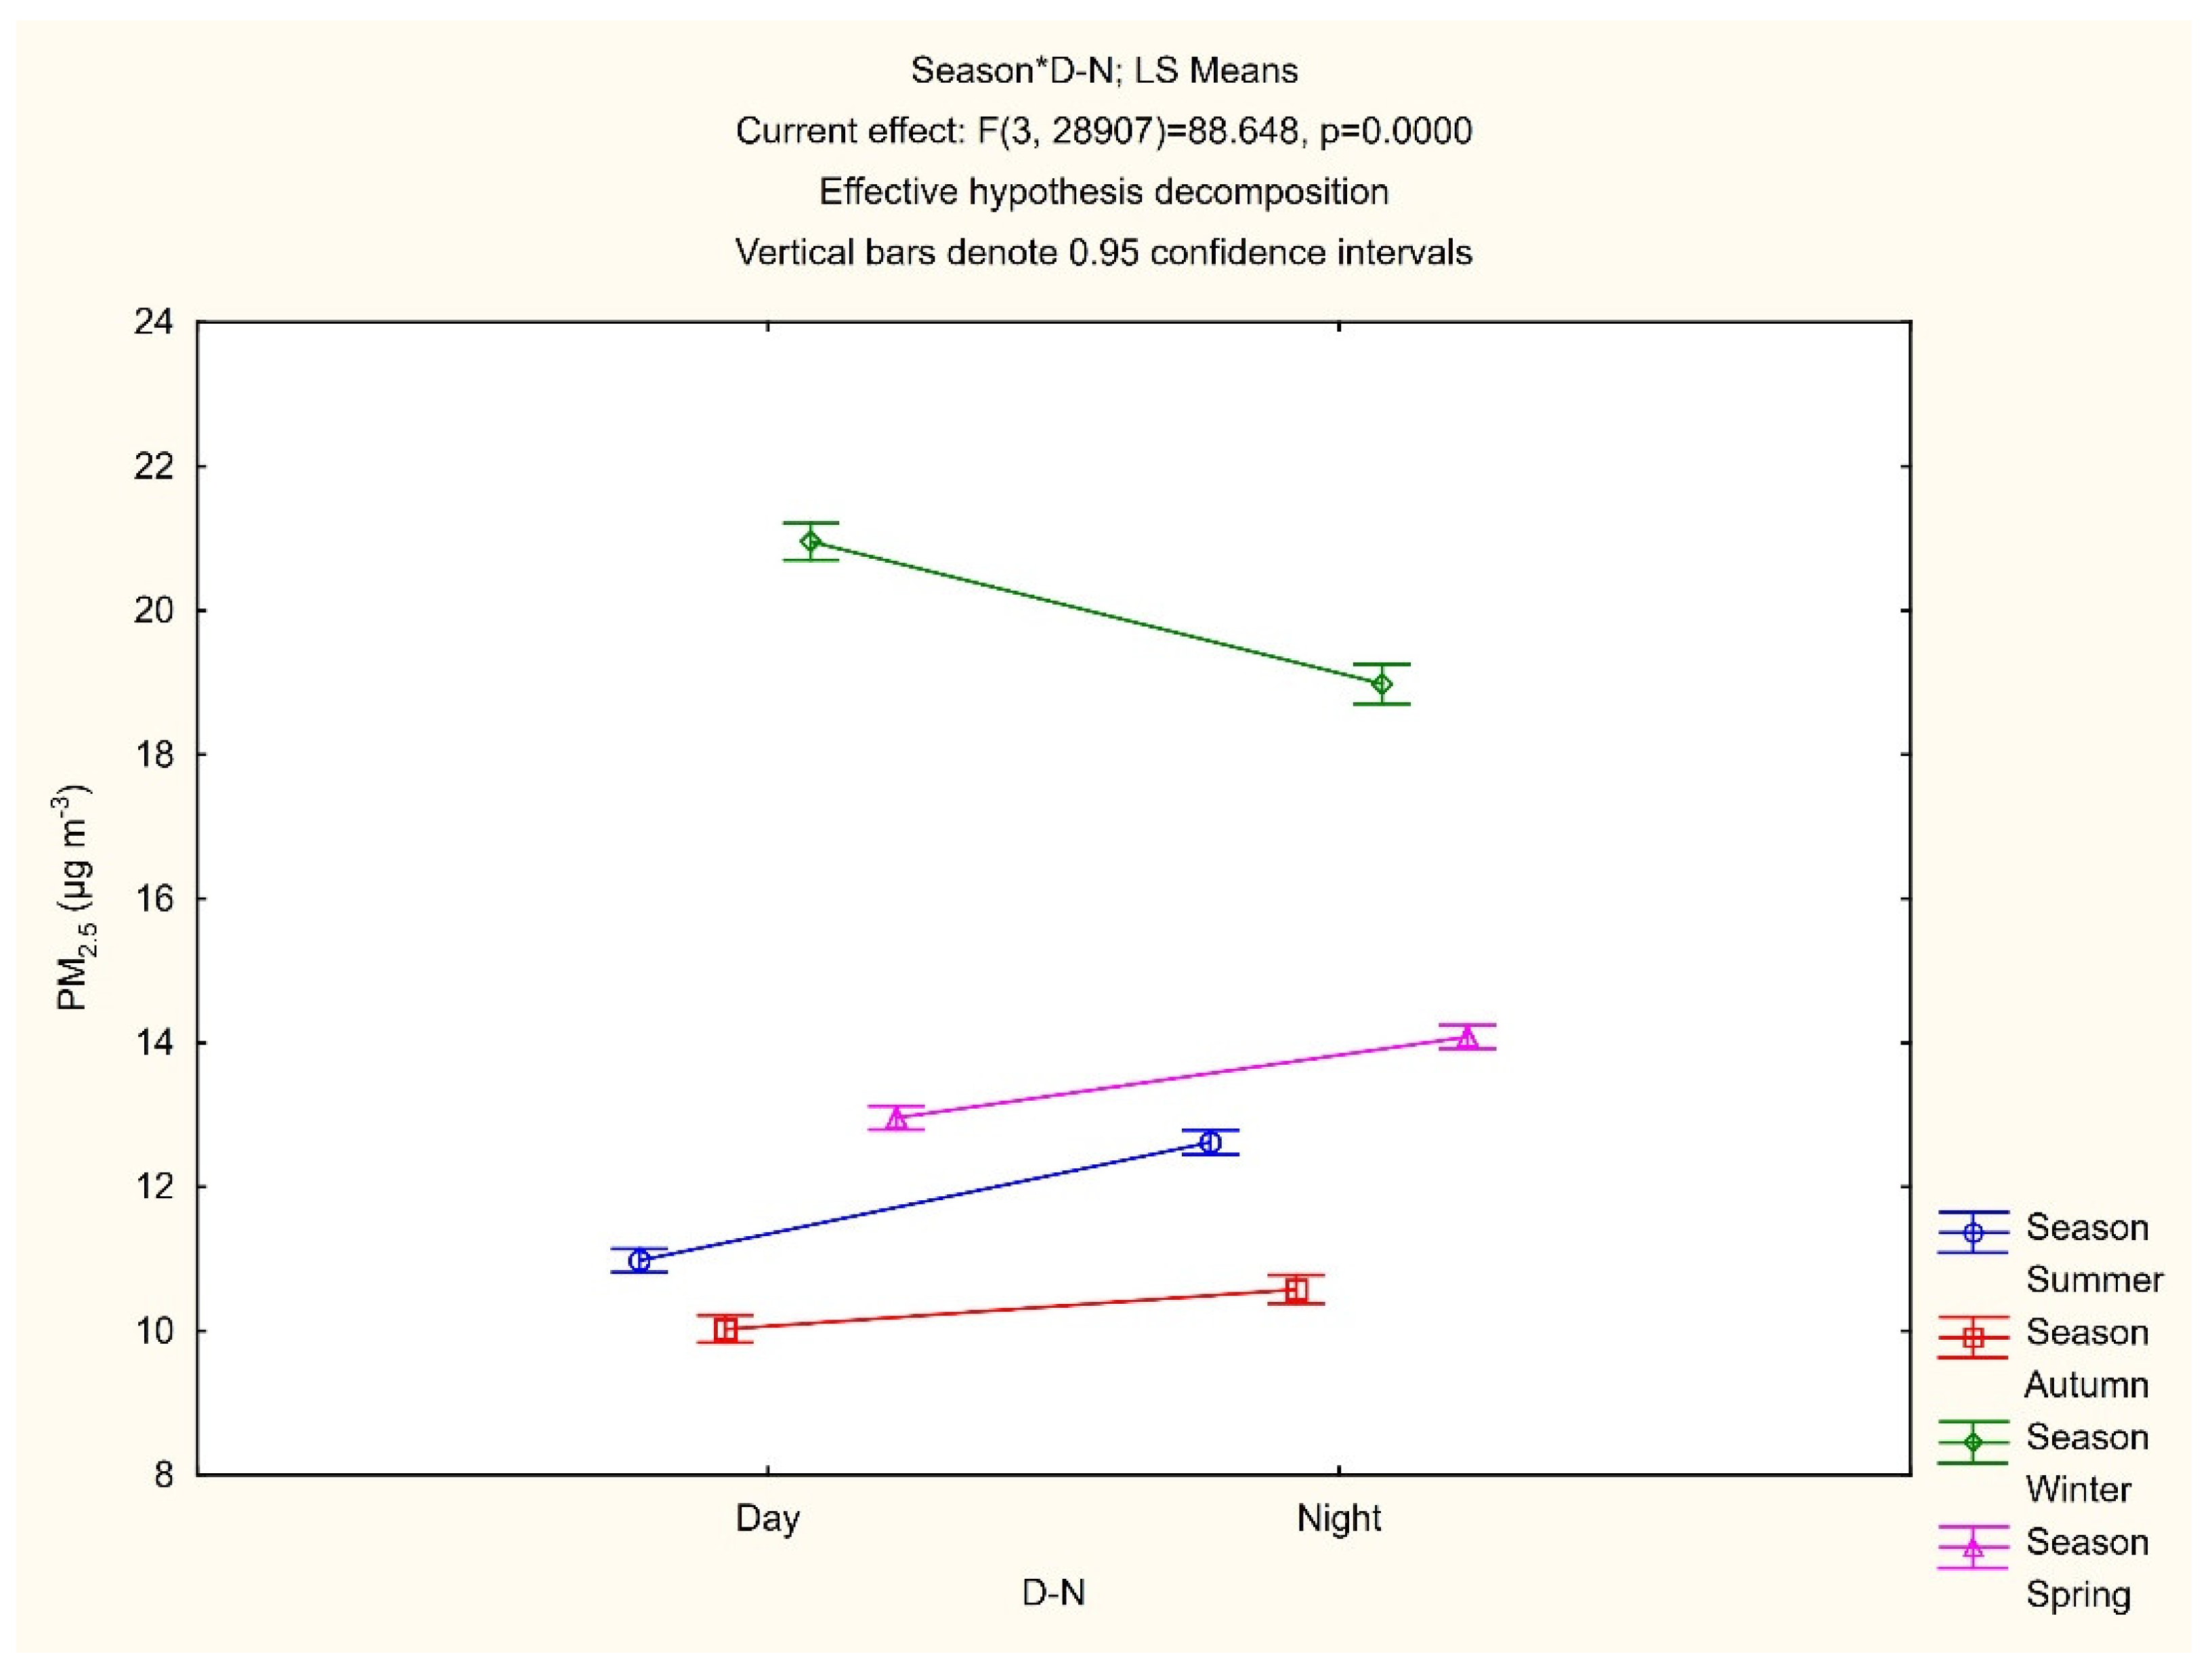
3.3. ANOVA-Seasonal and Daily Effect on PM2.5 Mass Concentrations

An Analysis of Variance (ANOVA) was used to examine the effect of two categorical variables (factors), i.e., the season and the time of the day (day or night, day means times between 8:00 and 19:59 h), as well as their interaction effect, to the PM2.5 mass concentrations. The results of the ANOVA were found statistically significant (p < 0.001) and they are presented in Figure 4 During winter, higher concentrations were recorded, especially during the day, i.e., times between 8:00 and 19:59 h. On the contrary, during the other three seasons, the PM2.5 levels were higher in the nighttime than in the daytime. In winter, due to the cold weather and the severe lockdown people were gathering at home, early. During good weather and the lift of restrictions, people enjoyed the outdoors and restaurants (with outdoor charbroiling facilities), nearby to the monitoring station.

3.4. PM2.5 Elemental Composition

Twenty-four-hour average mass concentrations of PM2.5 that obtained gravimetrically and the related trace elements measured in the DUTH station are presented in Table 2.
During the cold period, the elements K and S prevailed. On the contrary, during the warm days, Al and Si exhibited the highest concentrations.

4. Discussion

Urban environments are the hot spot of air pollution, globally. The denser the population of the city, the poorer its air quality [21]. However, it appears that residents in small cities can also breathe air with poor quality [22].
Xanthi, is a small residential city, surrounded by forested hills in the north and lowlands in the south. The average PM2.5 mass concentration during 13 months was 13.5 (±6.6) μg m−3, in an urban station (DUTH). The EU limit value (25 μg m−3, annual mean) was not exceeded, but the WHO air quality guideline value of 10 μg m−3 annual mean, was. In the city and in its surroundings, our lab had conducted small PM2.5 monitoring campaigns, mainly with the gravimetric method, from 2014 to 2019. In the city center, the PM2.5 mass concentrations were found to be on average 2.3 larger than those in the suburbs and in some cases, they have reached a 24-h average value of 79.1 μg m−3. Hence, it is expected that residents of the city center are exposed to higher PM2.5 levels that those residing at the east suburbs (as recorded in the Kimmeria station).
The severe lockdown in the most part of the years 2020 and 2021 had minimized the human activities. After the 15 May 2021, the lockdown restrictions were lifted but people were hesitant to return soon to their old behavior. By chance, they were available data from past studies for May 2019 and new data for May 2021, from the same location. The PM2.5 levels were less by 25% in May 2021 (no lockdown after 15 May 2021) than in May 2019, mainly due to less vehicle traffic, since there is no household heating during this season. However, there was no enough information to support that this reduction was related solely to the preceded lockdown of May 2021.
The continuous PM2.5 monitoring helped to focus on special events and to identify their two main sources: residential heating, mainly by biomass burning in stoves and fire places and the long-range transport of the Saharan dust and other components found in the path of the air mass travel.
Short events with elevated PM2.5 mass concentrations were recorded during very cold evenings, with a temperature below 0 °C, between 18:00 and 22:00 h, local time, times that people were at home and they needed heating. If it coincided with a transport of Saharan dust event, the PM2.5 mass concentration increased to levels more than 50 μg m−3, but for 3–4 h only. Thus, the 24-h average PM2.5 mass concentrations were below the WHO air quality guideline value of 25 μg m−3, as 24-h mean.
The effect of the arrival of the dust from the Sahara Desert was traced by the calculation of the backward trajectories. These episodes were further confirmed by the information provided by The SKIRON/Dust modelling system (https://forecast.uoa.gr/en/forecast-maps/dust/north-atlantic accessed on 9 October 2021). When air masses originated from the south and southwest, the aerosol that arrived in the area was enriched with marine components and with anthropogenic contribution from other areas, such as the Athens and Thessaloniki conurbations [23]. During the dust episodes, in both stations (DUTH and Kimmeria) the PM2.5 exhibited the same pattern. These episodes increased the PM2.5 mass concentrations by 22% during June 2021. In the Demokritos suburban station, in Athens Greece, a 14% increase in PM2.5 was observed. The NO2 and the solar radiation in Kimmeria station were decreased during the episode, but O3 was unaffected.
Elemental analysis corroborates that in cold days, the fingerprints of the biomass burning were in the air (K and S) and in warm days mineral dust prevailed (Al, Si) [24].
The above findings confirm that the biggest threat for the air quality in Xanthi, is the biomass burning. That threat can be mitigated locally. Biomass (wood) burning was also reported to be an important contributor in the deterioration of the air quality in the two metropolitan Greek cities, due to the emerged financial crisis [25]. New approaches for residential heating, and generally, approaches that improve the quality of life, will benefit the air quality of each city. Long-range transport of air pollutants, either from natural or anthropogenic sources, is much more difficult to mitigate.

Supplementary Materials

The following are available online at https://www.mdpi.com/article/10.3390/su132011329/s1, Figure S1: Map of the city of Xanthi. The two stations location: DUTH station and Kimmeria station. Figure S2: DUTH station and a view in N-NE direction. Figure S3: Kimmeria station. Figure S4: PM2.5 mass concentration time-series in the DUTH station for the years 2020–2021. Dashed line denotes the year 2020 or 2021. Figure S5: Back trajectories in the left and mean PM2.5 mean mass concentrations (μg m−3) grouped by the wind direction.

Author Contributions

Conceptualization and methodology, S.R.; software calculations, S.R. and G.L.; validation, V.P.; formal analysis, G.L. and Z.P.K.; writing—original draft preparation, G.L.; writing—review and editing, S.R.; visualization, S.R. and G.L.; supervision S.R. All authors have read and agreed to the published version of the manuscript.

Funding

The present work was funded by Democritus University of Thrace (Greece) funds.

Data Availability Statement

Not applicable.

Acknowledgments

Authors acknowledge D. Karali and N. Kokkos for the setup of the DUTH monitoring station.

Conflicts of Interest

The authors declare no conflict of interest.

References

  1. Cohen, A.J.; Brauer, M.; Burnett, R.; Anderson, H.R.; Frostad, J.; Estep, K.; Balakrishnan, K.; Brunekreef, B.; Dandona, L.; Dandona, R.; et al. Estimates and 25-year trends of the global burden of dis-ease attributable to ambient air pollution: An analysis of data from the Global Burden of Diseases Study 2015. Lancet 2017, 389, 1907–1918. [Google Scholar] [CrossRef] [Green Version]
  2. Stanaway, J.D.; Afshin, A.; Gakidou, E.; Lim, S.S.; Abate, D.; Abate, K.H.; Abbafati, C.; Abbasi, N.; Abbastabar, H.; Abd-Allah, F.; et al. Global, regional, and national comparative risk assessment of 84 behavioural, environmental and occupational, and metabolic risks or clusters of risks for 195 countries and territories, 1990–2017: A systematic analysis for the Global Burden of Disease Study 2017. Lancet 2018, 392, 1923–1994. [Google Scholar]
  3. Apte, J.S.; Marshall, J.D.; Cohen, A.J.; Brauer, M. Addressing Global Mortality from Ambient PM2.5. Environ. Sci. Technol. 2015, 49, 8057–8066. [Google Scholar] [CrossRef] [PubMed]
  4. Chakrabarty, R.K.; Beeler, P.; Liu, P.; Goswami, S.; Harvey, R.D.; Pervez, S.; van Donkelaar, A.; Martin, R.V. Ambient PM2.5 exposure and rapid spread of COVID-19 in the United States. Sci. Total. Environ. 2020, 760, 143391. [Google Scholar] [CrossRef] [PubMed]
  5. Nor, N.S.M.; Yip, C.W.; Ibrahim, N.; Jaafar, M.H.; Rashid, Z.Z.; Mustafa, N.; Hamid, H.H.A.; Chandru, K.; Latif, M.T.; Saw, P.E.; et al. Particulate matter (PM2.5) as a potential SARS-CoV-2 car-rier. Sci. Rep. 2021, 11, 2508. [Google Scholar] [CrossRef]
  6. Beelen, R.; Raaschou-Nielsen, O.; Stafoggia, M.; Andersen, Z.J.; Weinmayr, G.; Hoffmann, B.; Wolf, K.; Samoli, E.; Fischer, P.; Nieuwenhuijsen, M.; et al. Effects of long-term exposure to air pollution on natural-cause mortality: An analysis of 22 European cohorts within the multicentre ESCAPE project. Lancet 2013, 383, 785–795. [Google Scholar] [CrossRef]
  7. Zhao, B.; Su, Y.; He, S.; Zhong, M.; Cui, G. Evolution and comparative assessment of ambient air quality standards in China. J. Integr. Environ. Sci. 2016, 13, 85–102. [Google Scholar] [CrossRef] [Green Version]
  8. Polish Committee for Standardization. PN-EN12341 Ambient Air-Standard Gravimetric Measurement Method for the Determination of the PM10 or PM2.5 Mass Concentration of Suspended Particulate Matter; Polish Committee for Standardization: Warsaw, Poland, 2014. [Google Scholar]
  9. US-EPA. Ambient Air Monitoring Reference and Equivalent Methods; Environmental Protection Agency: Washington, DC, USA, 1997; p. 50. [Google Scholar]
  10. Karali, D.; Loupa, G.; Rapsomanikis, S. Nephelometer Sensitivities for the Determination of PM2.5 Mass Concentration in Ambient and Indoor Air. Aerosol Air Qual. Res. 2021, 20, 200159. [Google Scholar] [CrossRef]
  11. Karageorgos, E.T.; Rapsomanikis, S. Assessment of the sources of the inorganic fraction of aerosol in a conurbation. Int. J. Environ. Anal. Chem. 2009, 90, 64–83. [Google Scholar] [CrossRef]
  12. Juda-Rezler, K.; Reizer, M.; Maciejewska, K.; Błaszczak, B.; Klejnowski, K. Characterization of atmospheric PM2.5 sources at a Central European urban background site. Sci. Total Environ. 2020, 713, 136729. [Google Scholar] [CrossRef]
  13. Sofowote, U.; Healy, R.; Su, Y.; Debosz, J.; Noble, M.; Munoz, A.; Jeong, C.-H.; Wang, J.; Hilker, N.; Evans, G.; et al. Understanding the PM2.5 imbalance between a far and near-road location: Results of high temporal frequency source apportionment and parameterization of black carbon. Atmos. Environ. 2018, 173, 277–288. [Google Scholar] [CrossRef]
  14. Chen, L.-W.A.; Chien, L.-C.; Li, Y.; Lin, G. Nonuniform impacts of COVID-19 lockdown on air quality over the United States. Sci. Total Environ. 2020, 745, 141105. [Google Scholar] [CrossRef] [PubMed]
  15. Thunis, P.; Degraeuwe, B.; Peduzzi, E.; Pisoni, E.; Trombetti, M.; Vignati, E.; Wilson, J.; Belis, C.; Pernigotti, D. Urban PM2.5 Atlas: Air Quality in European Cities; Publications Office of the European Union: Luxembourg, 2017. [Google Scholar]
  16. Silva, A.V.; Oliveira, C.M.; Canha, N.; Miranda, A.I.; Almeida, S.M. Long-Term Assessment of Air Quality and Identification of Aerosol Sources at Setúbal, Portugal. Int. J. Environ. Res. Public Health 2020, 17, 5447. [Google Scholar] [CrossRef] [PubMed]
  17. Agrawal, G.; Mohan, D.; Rahman, H. Ambient air pollution in selected small cities in India: Observed trends and future challenges. IATSS Res. 2021, 45, 19–30. [Google Scholar] [CrossRef]
  18. Stein, A.F.; Draxler, R.R.; Rolph, G.D.; Stunder, B.J.B.; Cohen, M.; Ngan, F. NOAA’s HYSPLIT Atmospheric Transport and Dispersion Modeling System. Bull. Am. Meteorol. Soc. 2015, 96, 2059–2077. [Google Scholar] [CrossRef]
  19. Loupa, G.; Zarogianni, A.-M.; Karali, D.; Kosmadakis, I.; Rapsomanikis, S. Indoor/outdoor PM2.5 elemental composition and organic fraction medications, in a Greek hospital. Sci. Total Environ. 2016, 550, 727–735. [Google Scholar] [CrossRef]
  20. Diapouli, E.; Manousakas, M.I.; Vratolis, S.; Vasilatou, V.; Pateraki, S.; Bairachtari, K.A.; Quero, X.; Amato, F.; Alastuey, A.; Karanasiou, A.A.; et al. AIRUSE-LIFE+: Estimation of natural source contributions to urban ambient air PM10 and PM2.5 concentrations in southern Europe–implications to compliance with limit values. Atmos. Chem. Phys. 2017, 17, 3673–3685. [Google Scholar] [CrossRef] [Green Version]
  21. Carozzi, F.; Roth, S. Dirty Density: Air Quality and the Density of American Cities; Centre for Economic Performance, LSE: London, UK, 2020. [Google Scholar]
  22. Byun, J.-Y.; Kim, H.; Han, Y.-J.; Lee, S.-D.; Park, S.-W. High PM2.5 Concentrations in a Small Residential City with Low Anthropogenic Emissions in South Korea. Atmosphere 2020, 11, 1159. [Google Scholar] [CrossRef]
  23. Vasilatou, V.; Diapouli, E.; Abatzoglou, D.; Bakeas, E.B.; Scoullos, M.; Eleftheriadis, K. Characterization of PM2.5 chemical composition at the Demokritos suburban station, in Athens Greece. The influence of Saharan dust. Environ. Sci. Pollut. Res. 2017, 24, 11836–11846. [Google Scholar] [CrossRef]
  24. Karageorgos, E.T.; Rapsomanikis, S. Chemical characterization of the inorganic fraction of aerosols and mechanisms of the neutral-ization of atmospheric acidity in Athens, Greece. Atmos. Chem. Phys. 2007, 7, 3015–3033. [Google Scholar] [CrossRef] [Green Version]
  25. Diapouli, E.; Manousakas, M.; Vratolis, S.; Vasilatou, V.; Maggos, T.; Saraga, D.; Grigoratos, T.; Argyropoulos, G.; Voutsa, D.; Samara, C.; et al. Evolution of air pollution source contributions over one decade, derived by PM10 and PM2.5 source apportionment in two metropolitan urban areas in Greece. Atmos-Pheric Environ. 2017, 164, 416–430. [Google Scholar] [CrossRef]
Figure 1. Monthly average PM2.5 mass concentrations (error bars denote the standard deviation of the average value).
Sustainability 13 11329 g001
Figure 2. Comparison of the PM2.5 mass concentration daily variations between days with Saharan dust episode (21, 22 June 2021), cold days (1, 2 February 2021, wood burning and Saharan dust) and normal summer days (1, 2 August 2020).
Sustainability 13 11329 g002
Figure 3. Comparison of the NO2, O3 and PM2.5 concentration daily variations, before and during a Saharan dust episode (20–22 June 2021), in Kimmeria. Average air temperature 24.3 °C and RH = 74%. (a) NO2 and PM2.5 concentrations; (b) O3 concentrations and solar radiation intensity.
Sustainability 13 11329 g003
Figure 4. ANOVA: PM2.5 concentrations dependence on season and on time (D-N).
Sustainability 13 11329 g004
Table 1. Average values of the meteorological parameters for each month at DUTH station.
Air Temperature (°C)RH (%)
MeanStd. Dev.MeanStd. Dev.
June (20)27.364.7855.9613.43
July (20)26.734.6849.5715.30
August (20)26.604.5652.5318.47
September (20)24.345.0548.8119.63
October (20)18.114.4068.7016.66
November (20)13.440.7162.2314.48
December (20)12.802.9065.0015.30
January (21)6.894.4270.0717.38
February (21)8.845.5069.7817.73
March (21)9.184.2962.9517.68
April (21)12.644.4867.8316.97
May (21)19.454.8961.8519.25
June (21)21.054.6971.0415.41
Wind speed (ms−1)Wind direction (deg)
MeanStd. Dev.MeanStd. Dev.
June (20)1.800.89116.76101.77
July (20)1.620.85134.15111.90
August (20)1.650.92132.33110.28
September (20)1.550.89127.94104.00
October (20)1.551.00125.12105.68
November (20)2.140.52148.23138.34
December (20)1.700.67156.45135.56
January (21)1.451.02118.7190.00
February (21)1.291.02123.13101.76
March (21)1.350.97124.07102.80
April (21)1.270.86126.48104.35
May (21)1.270.87135.85103.79
June (21)1.470.85137.39119.15
Table 2. Average PM2.5 mass concentrations (μg m−3) and elemental concentrations (ng m−3) at DUTH station.
Cold Weather
(SD)
Warm Weather
(SD)
PM2.5 (μg m−3)17.8 (0.67)12.5 (0.34)
Trace elements (ng m−3)
Al48 (37.7)176 (92.6)
Si211 (53.5)2261 (832.1)
Br18 (0.2)43 (0.1)
P18 (3.0)92 (2.1)
S697 (1792.3)285 (12.0)
Na496 (23.3)352 (242.3)
K923 (45.0)96 (87.7)
Mg134 (18.6)259 (2.8)
Ca3563 (424.5)2896 (34.5)
Co2 (0.2)2 (0.3)
Cr1 (0.1)13 (0.2)
Cu7 (2.1)4 (0.2)
Fe15 (7.3)7 (0.7)
Mn2 (2.8)9 (0.1)
Ni1 (0.2)1 (0.3)
Pb4 (3.2)3 (0.2)
Ti7 (4.0)35 (0.1)
Zn11 (0.5)17 (4.6)
Publisher’s Note: MDPI stays neutral with regard to jurisdictional claims in published maps and institutional affiliations.

