Article

Simulation and Analysis Approaches to Microgrid Systems Design: Emerging Trends and Sustainability Framework Application

1
Department of Electrical, Electronic and Computer Engineering, Bells University of Technology, Ota 231119, Nigeria
2
Department of Electrical and Electronic Engineering, Osun State University, Osogbo 230103, Nigeria
*
Author to whom correspondence should be addressed.
Sustainability 2021, 13(20), 11299; https://doi.org/10.3390/su132011299
Submission received: 28 August 2021 / Revised: 30 September 2021 / Accepted: 5 October 2021 / Published: 13 October 2021
(This article belongs to the Special Issue Software Engineering Development and Applications for Sustainability)

Abstract

:
Energy systems modelling and design are a critical aspect of planning and development among researchers, electricity planners, infrastructure developers, utilities, decision-makers, and other relevant stakeholders. However, to achieve a sustainable energy supply, the energy planning approach needs to integrate some key dimensions. Importantly, these dimensions are necessary to guide the simulation and evaluation. It is against this backdrop that this paper focuses on the simulation and analysis approaches for sustainable planning, design, and development of microgrids based on clean energy resources. The paper first provides a comprehensive review of the existing simulation tools and approaches used for designing energy generation technologies. It then discusses and compares the traditional strategies and the emerging trends in energy systems simulation based on the software employed, the type of problem to be solved, input parameters provided, and the expected output. The paper introduces a practical simulation framework for sustainable energy planning, which is based on the social-technical-economic-environmental-policy (STEEP) model. The STEEP represents a holistic sustainability model that considers the key energy systems planning dimensions compared to the traditional techno-economic model used in several existing simulation tools and analyses. The paper provides insights into data-driven analysis and energy modelling software development applications.

1. Introduction

Energy systems modelling and design are a critical part of planning, development, and management among researchers, electricity planners, infrastructure developers, utilities, government’s energy departments, and agencies, decision-makers, industries, and other relevant stakeholders. However, to achieve a sustainable energy supply, the energy planning approach needs to integrate some key dimensions [1,2,3,4,5]. Importantly, these dimensions are fundamentally crucial to the simulation and evaluation strategies employed for developing small-scale energy systems, regarded as microgrids.
Techno-economic (TE) planning model is a widely used approach for the simulation and evaluation of energy systems; this is based on the technical consideration and the design cost. This is found useful in feasibility studies and applications of small-scale energy systems, including decision-making purposes. However, the important criteria for achieving a sustainable energy system transcends the TE perspectives [6,7]. Such criteria involve multi-dimensional aspects that captures the users’ status, situation, demand and choice, demand growth, cost, revenue for system operation and maintenance, available energy resources, choice of technology used, environmental impact, enabling policy, community involvement, capacity building, security of the energy system, etc. [7]. These factors have also been grouped into four stages in energy systems planning, viz. preliminary, detailed engineering design, implementation, and the post-implementation phases, which align with the sustainability perspective [7,8].
It is important to state that it is impossible to achieve the sustainable planning and design of the energy system without a sound simulation and analysis. This is because several factors and dimensions are involved which need to be critically considered given that the overall aim of an energy system is to meet the users’ demand at a given time. Additionally, more than being technically and economically viable, energy system planning and design strategy must consider other aspects such as the social, environmental, and legal or institutional parts [6,9]. Therefore, it is of interest in this paper to present a simulation framework that will integrate the above-mentioned crucial factors. Though the complexity of the problem to be solved usually determines the choice of the simulation tools and analysis to be employed, it is still necessary to have a strategy or an approach that can guide the process and analysis.
Several studies have been presented in the literature in the aspect of modelling, design, and simulation of microgrid energy systems, which are useful for basic understanding of energy systems analysis. Some of these studies are reviewed in this paper to appreciate the existing academic contributions by different researchers and authors. The recent contributions, [10,11,12,13,14,15,16,17,18,19,20,21,22,23,24,25,26,27,28,29,30,31,32,33,34,35,36,37,38,39,40,41,42,43,44], are succinctly presented in Table 1 and they have in one way or the other enriched the body of knowledge in different perspectives within the scope of simulation and analysis strategies for energy generation. The value that these studies add to knowledge serves as relevant background to this current paper.
The review presented reveals various modelling, simulation, and analysis techniques, including some of the existing tools such as HOMER, PVSyst, MATLAB, RETScreen, DIgSILENT PowerFactory, Eco-SiM, and MS EXCEL spreadsheet. One of the findings peculiar to the contributions of the mentioned papers is the fact that the design and modelling of energy systems—microgrids, minigrids, stand-alone, or grid-connected distributed generation is associated with an optimization process. This has attracted different optimization techniques and solvers such as the genetic algorithm (GA), the simplex algorithm (CPLEX), multi-objective optimization (MOO), multi-criteria decision making (MCDM), the python optimal control problem (POCP) toolbox, mixed-integer linear programming (MILP), artificial neural network feed-back propagation (ANN-BP), the Levenberg–Marquardt (LM) data training optimum approach, the multi-stage energy optimization (MANGO) model, the general algebraic modelling system (GAMS), analytical hierarchy approach-based multi-criteria decision analysis (AHP-MCDA), the non-dominate Sorting Genetic Algorithm (NSGA), PSO, butterfly PSO, the mathematical programming model (MPM), and teaching-learning-based (TLBO) optimization techniques, etc. The other models or systems mentioned by some authors are the fuzzy logic controller, the agent-based model, model predictive control, energy management system, demand-side management, etc.
Importantly, the majority of the papers focused on the TE perspective of planning, while only a few others considered other aspects such as the social-technical and environmental (STE), and the techno-economic and the environmental (TEE), and the T dimensions. The requirements for realizing a sustainable energy supply transcends the TE, ST, STE, TEE or T planning perspectives. In addition, the complexity of the problem to be solved will determine the nature of simulation and analysis, and the software or tools to be employed. To consider sustainability in energy planning, which is a bit complex, simply implies that its dimensions or criteria have to be included in the simulation and analysis process. The sustainability dimensions include the social, technical, economic, environmental and policy (STEEP) aspects. This current paper, therefore, focuses on the simulation and analysis approaches for sustainable planning and design of clean energy systems. It provides a comprehensive review of the existing simulation tools and approaches used for designing energy technologies for electricity supply applications. It then discusses the traditional strategies and the emerging trends in energy systems simulation based on the software employed, type of problem to be solved, input parameters provided, calculation and optimization process, and the expected output.
The study introduces a practical simulation framework for sustainable energy planning, which is based on the social-technical-economic-environmental-policy (STEEP) model. This model is comprehensive than the other models such as TE, ST, STE, TEE or T planning dimensions. In this paper, STEEP represents a holistic sustainability framework that considers the key planning dimensions for energy systems compared to the traditional TE model that has been used in several existing simulation and analysis research studies. This study aims to provide useful insights into energy modelling software design and development.
Energy shortage is one of the major issues affecting the socio-economic development in several communities in Nigeria. This development affects both urban and rural settings. However, the rural locations or villages have the largest percentage of electrification deficit rate in the country. This study focuses on planning microgrid systems for such energy-poor communities by using the sustainability framework. Such a framework is necessary to understand the critical parameters for the design, simulation and analysis with the possibility of suggesting useful policy directions.
The remaining aspect of the study is presented as follows: Section 2 provides a background on energy planning and simulation, existing energy systems tools and emerging simulation strategies, Section 3 presents the materials and methods, and example application of the simulation framework, Section 4 discusses the results, the need for energy systems software based on sustainability dimensions and future works while Section 5 is the conclusion.

2. Background on Energy Planning and Simulation Strategy

As mentioned earlier, the energy systems development life-cycle can be divided into four different stages—the preliminary, detailed engineering design, implementation, and the post-implementation phases [8]. These include tasks from the preliminary assessments to obtaining of data from the users at the sites, detailed design based on the data obtained, physical implementation of the design, to the issues associated with the energy system after it has been implemented, such as operation and maintenance, capacity building, etc. The implication of this is that it is one thing to conceptualize, plan, design, and install energy systems, and it is another important thing to be able to sustain them to achieve long-term viability and use. Therefore, the sustainability dimensions, i.e., the social, technical, economic, environmental, and policy, have to be adequately considered when planning energy systems, which are constituent parts of the phases mentioned above.
The detailed engineering design phase involves modelling, simulation, and analysis of energy systems. The complexity of the problem to be solved is expected to determine the nature of simulation and analysis and the software/tools to employ for the task. Considerations for sustainability in simulation and analysis imply that more parameters and factors are integrated, either directly or indirectly, in the process beyond the traditional techno-economic planning perspective. Apart from determining the users’ load demand profile, type of energy technology-solar PV, wind, hydro, biomass, biogas, etc. initial cost, net present cost, and the O and M cost, it is also necessary to figure out some critical aspects of the social, environmental and policy dimensions; these include the status and class of the users, willingness to pay for the energy service, revenue generation from using and maintaining the energy service, ownership of the system, incentives associated with the creation and/or use of the service, environmental impact, end-of-life management of the system, etc. These parameters are crucial when proposing energy systems, and the question is how to integrate the parameters in a simulation. This paper will contribute to knowledge in this regard by considering the social, technical, economic, environmental and policy (STEEP) dimensions in the simulation and system analysis, from the sustainability perspective.
A typical simulation process includes the input parameters fed into a software (with in-built mathematical models and functions) to generate the output results. The input parameters involve the necessary data that the simulator will process, while the simulation tool has in-built equations, functions, and algorithms to process the input data. The outcome of this exercise is presented as the output results, which will then be analyzed for decision-making purposes. This represents a generic basis for the simulation framework that will be introduced in the later section of this research paper, which will capture a range of perspectives and situations from the users’ point of view. The standpoint of this study is that the software or simulation tool has a crucial role to play in planning and designing sustainable energy systems. The problem to be solved will determine the type of software and tools to be employed based on the requirements.

2.1. Existing Simulation Tools

There are several simulation tools that are currently in use for energy systems planning and design. Table 2 presents a brief description of features and application of existing simulation tools, some of which have been employed in the previous works discussed in Section 1.

2.2. Emerging Simulation Strategies

The emerging simulation strategies are approaches with improved performance compared to traditional strategies used for the simulation and analysis of energy systems. For instance, the application of artificial intelligence (AI) techniques is proven to achieve a wide range of assessments of energy resources compared to some of the traditional methods and approaches earlier mentioned [1]. In addition, there is another trend of strategies that are based on improvements of or modifications to existing simulation methods, and the application of a combined or hybrid approach where two or more simulation tools and/or techniques are employed to solve the specified energy system design problem(s). One of the key aspects of energy systems simulation and analysis is the optimization of the components, design parameters, or the process. This is because optimization is at the heart of computer-based and simulation techniques for designing power/energy systems.
Importantly, the process of modelling and simulation of renewable energy resources, for example, is expected to include crucial parameters such as the time profile scale, uncertainties, temporal characteristics, availability, limitations, etc., to predict the real-life performance of the energy generation system [1]. This is key because the output of energy systems is a function of the available resource(s). On this note, there is an emerging trend of methods employed for analyzing the intermittency or uncertainty of renewable energy resources, such as stochastic programming, robust programming, fuzzy theory, chance-constrained programming, and the point estimate method, as presented in [116,117].
In addition, the users’ load demand also varies depending on the scale of consumption and the status of the users. A study has presented the correlation of time scale and uncertainty analysis in an energy management system [118]. It integrated the load and the wind energy uncertainties by using the mixed-integer stochastic programming approach. The authors maintained that renewable energy resources and electrical loads demonstrate a form of short-term variations in their profiles, which requires that they are modeled and analyzed from the point of view of time-scale and uncertainty. The need to study the correlation of time-scale, uncertainty, and simulation time was also established, as a means of realizing the optimal trade-off between the participating parameters. A model was introduced by the study based on mixed-integer stochastic programming with the analysis presented in a shorter time-scale, thus achieving more accurate results.
An experimental and simulation study has been published that investigated the capability of integrating multiple renewable energies such as wave, solar, and wind [119,120,121,122,123,124]. The authors presented a new simulation and analysis approach for integrating an intermittent energy system based on dynamic modelling and control strategy. An experimental test-bed was introduced for the renewable resources to ascertain and understand their integration and how to harmonize their electrical power generation. The simulation and analysis of the multi-source energy system were implemented using the MATLAB/Simulink tool.
A research paper has been published that presented the goal of harnessing households to mitigate renewable energy variability in a smart grid system [125]. The authors discussed and evaluated a novel demand response (DR) approach for households to mitigate the variability of renewable resources in smart grids. The innovative approach introduced is referred to as Dynamic-Active Demand Response (DADR), and its performance was assessed using a Monte-Carlo simulation model. Another scholarly work has considered the simulation of an electrical power system with a large percentage of renewable energy contribution [126]. The author proposed a modified simulation model and strategy for renewable energy integration with the existing power network. The simulation and analysis include a detailed transient evaluation of the balance between electrical power generation and the users’ load demand consumption. The simulation approach introduced was sectioned into three stages, such as pre-processing that comprises weather data, system composition, and the simulation parameters, the processing stage that involves mathematical analysis, and the post-processing that includes system autonomy, carbon emissions, energy cost, losses, and generation. It also provides the opportunity to fine-tune parameters within the simulation framework.
The capture and simulation of the ocean environment have been discussed for offshore-based renewable energy sources [127]. The authors maintained the need for understanding the complex marine environment as a requirement for engineers to gain insights on how to reproduce main elements and processes in simulation tools used for their operation, and also for developing improved devices and technologies. Furthermore, relevant background and approach were presented that categorized the iterative model into input data, data processing, and engineering tools. The processing of input data is necessary before engineering tools may be used. This process includes the characterization/measurement of the wave, tidal, and hybrid conditions, followed by potential simplification before the implementation in the specified simulation tool. The data processing stage involves the characterization and parameter selection before proceeding to the engineering tools, in which physical or numerical simulation is employed. The output of this process is essentially the results.
The application of AI methods has also been published for hybrid electrical power system optimization [128]. The authors presented a comprehensive review of the various AI techniques used for simulating and analyzing multi-source energy systems. Some of the approaches highlighted in this study include the artificial immune system algorithm, Tabu search, simulated annealing, Honey Bee algorithm, Bacteria algorithm, game theory, artificial neural networks (ANNs), evolutionary algorithm, and the combination of meta-heuristics algorithm such as GA/PSO method, hybrid optimization by GA (HOGA), adaptive neuro-fuzzy interference system (ANFIS), gravitational search algorithm (GSO), a genetic algorithm with linear programming (GALP), cuckoo search, artificial bee swarm optimization (ABSO), optimized fuzzy logic controlling device, multi-objective particle swarm optimization, etc. The authors attributed a growing interest in the application of AI algorithms over the years to the fact that it utilizes less computational time and achieves better results with good convergence compared to the traditional methods.
AI has been identified as one of the branches of computer science that looks into and develops “intelligent” software/tools and machines; it is also viewed as the investigation and scheme of intelligent entities or factors [129]. The intelligent factor, in this case, is designed to perform “actions” that will optimize the possibility of success. The study in [128] discussed the branches of AI such as GA, PSO, SA, ANN, and hybrid models, as previously presented. A comprehensive wind power forecasting system was proposed for integrating AI and numerical weather prediction [130]. The authors proposed an empirical electrical power conversion algorithm integrated with an analog ensemble (AnEn) approach to determine the uncertainty of wind power predictions. Table 1 summarizes the emerging computer-based simulation strategies discussed.

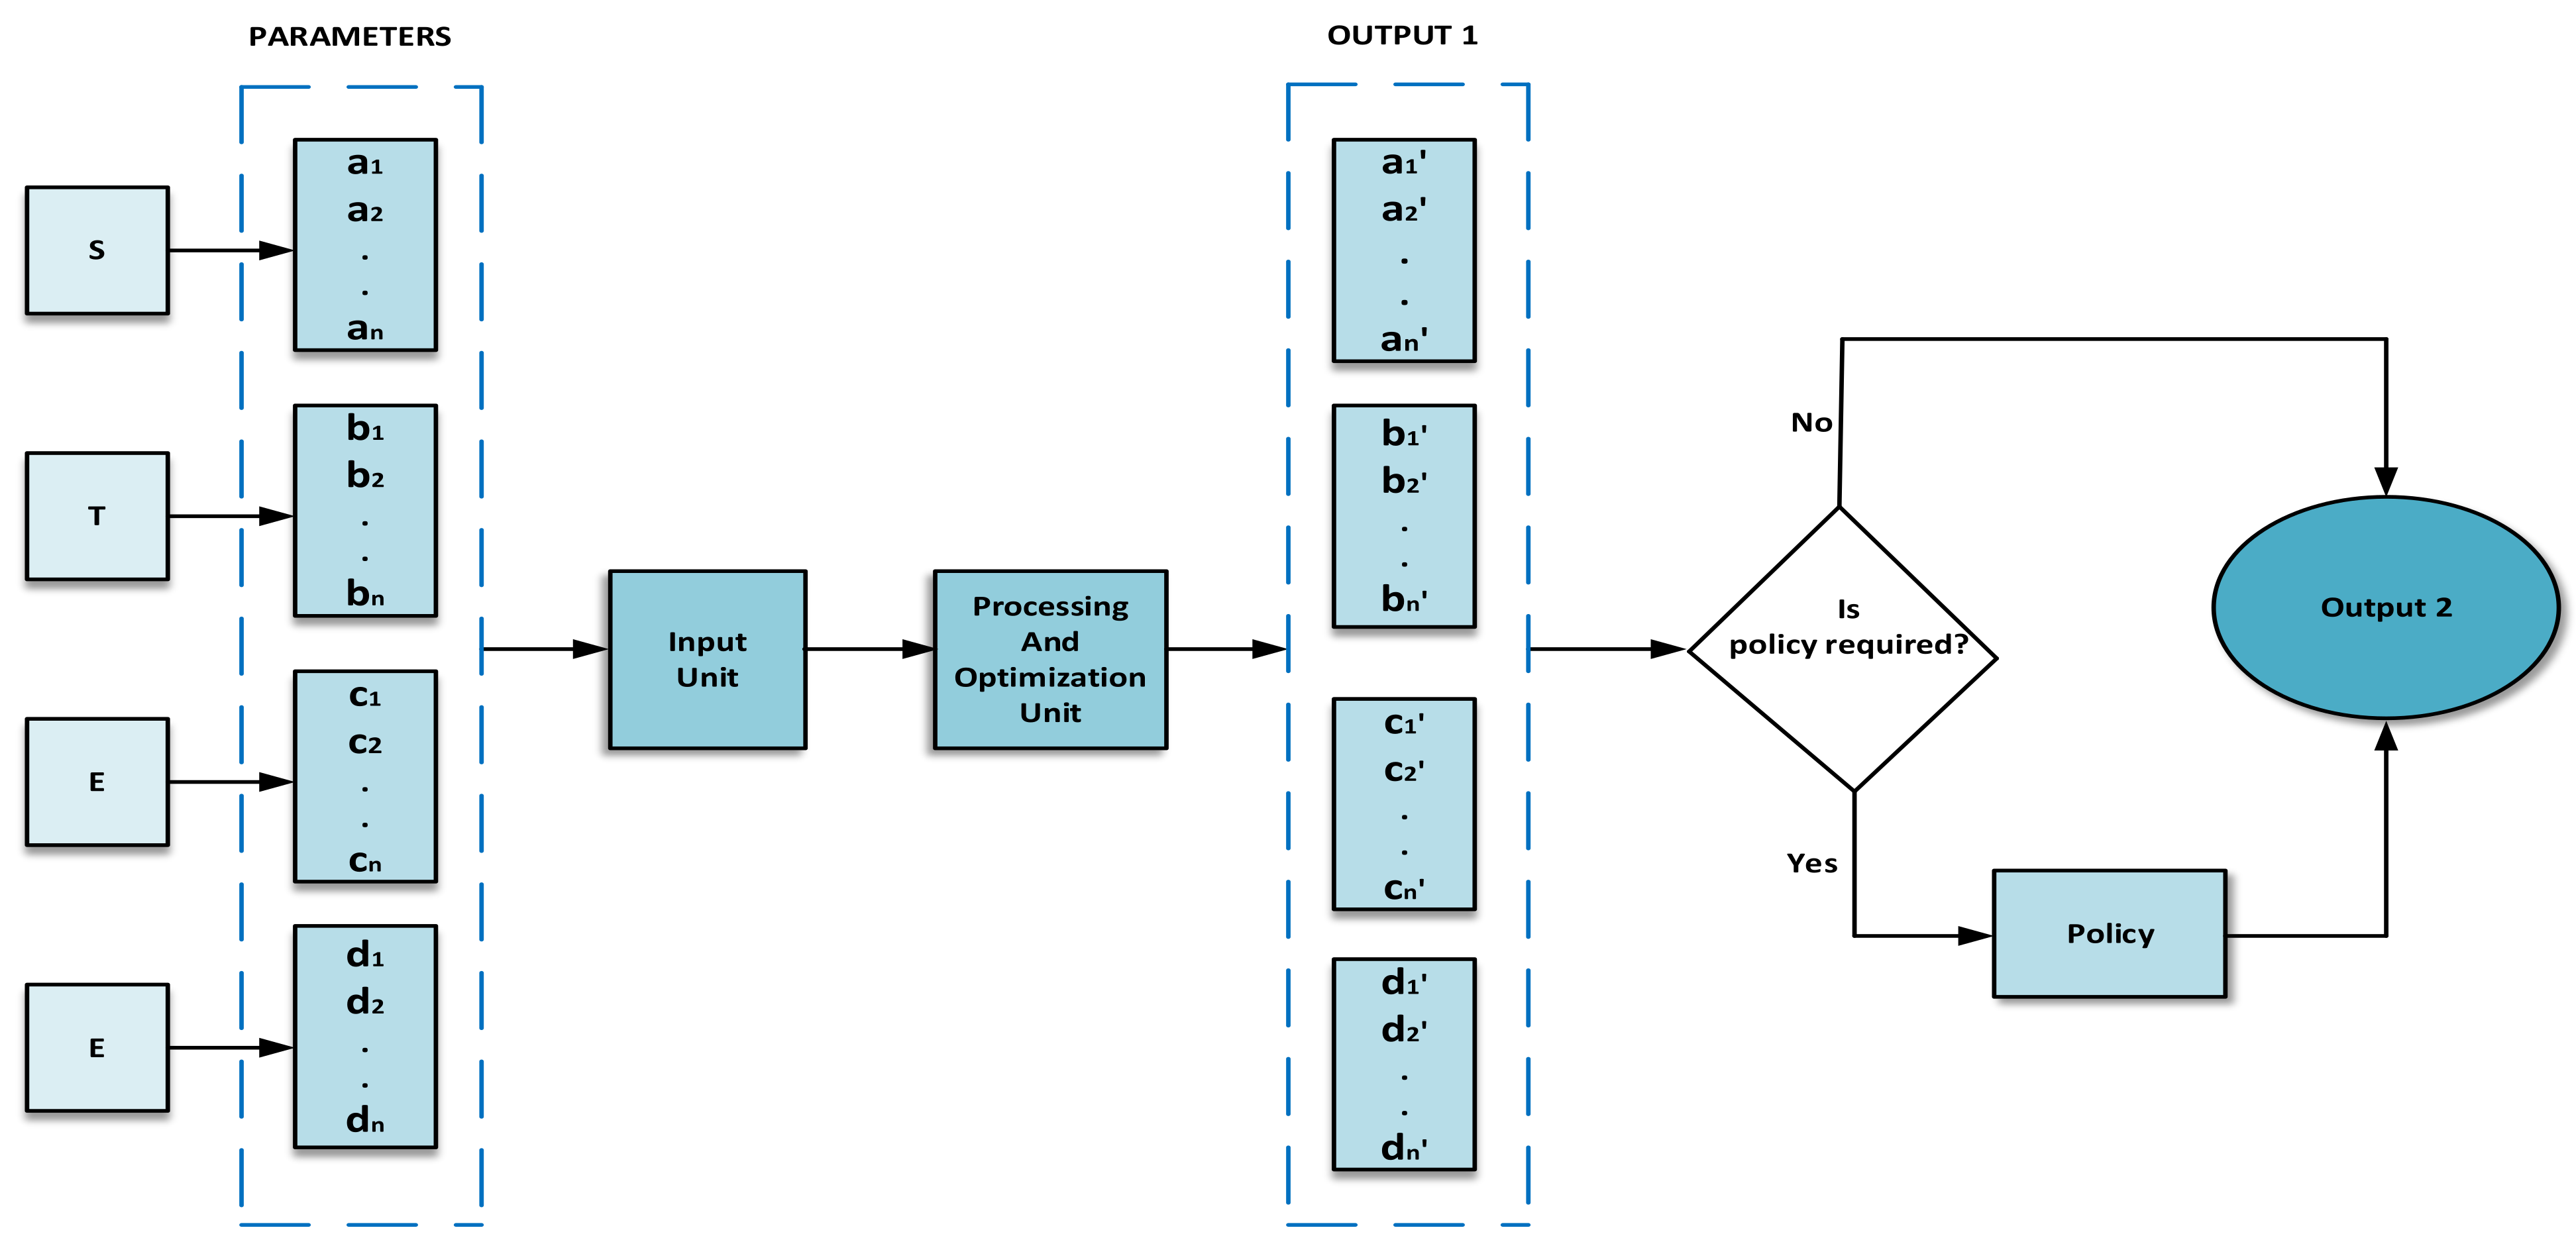
3. Materials and Methods

This study is not only interested in presenting the existing and the emerging simulation tools and strategies but also seeks to present a holistic approach to simulation and analysis of energy systems as means of addressing some gaps and shortcomings of the existing strategies. It has already been established that the requirement for achieving sustainable energy systems is multidisciplinary; because of this, the design, planning, simulation/modelling, and analysis must adequately consider the parameters associated with sustainability. This paper, therefore, proposes a simulation framework that is based on STEEP perspectives. The framework is shown in Figure 1.
A simulation process involves the introduction of certain input parameters to a particular simulation tool, with the expectation of some results after simulation, based on the specified calculations required. This forms the basis for simulation and it is explicitly and holistically presented in Figure 1, by detailing the key parameters and strategies involved in the analysis. The simulation framework is divided into the input, processing and optimization, and the output. The input unit is based on the social-technical-economic-environmental (STEE) perspectives, the processing and optimization unit involves the required mathematical models and calculations necessary to solve the problem, while the output unit is divided into two units such as output 1 that is based on the STEE perspective and output 2 that is either based on STEEP in case the policy dimension is required or on the STEE perspectives. Therefore, output 2 may either be based on STEE or STEEP perspective depending on the analysis to be carried out by the designer or researcher.

3.1. Input Unit

As mentioned earlier, energy systems planning has four stages from the sustainability point of view. These are the preliminary, detailed engineering design, implementation, and post-implementation phases. Basically, what is carried out at the preliminary stage is to obtain important data for the energy system design. The input unit, therefore, serves the purpose of putting together the critical parameters required to design and simulate the energy system. The input parameters in this study are based on the STEE dimensions. The input unit parameters are presented in detail in Table 3. The social aspect is represented by parameters a1, a2, a3, … an; the technical aspect is presented by parameters b1, b2, b3, … bn; the economic and environmental aspects are represented by parameters c1, c2, c3, …..cn and d1, d2, d3, … dn, respectively. These parameters are supplied to the input unit to proceed with the simulation of the energy system. The parameters are part of the information obtained during the pre-design phase of the energy systems planning.

3.2. Processing and Optimization Unit

This unit is concerned with the processing of the parameters supplied to the input unit. Such a task is achieved by employing standard mathematical equations to obtain the required results. Besides, one thing is to obtain results, another thing is to ensure that the results are optimal. This is why is the optimization process is included in the processing unit. The proposed simulation framework considers different energy technologies such as solar, wind, hydro, biomass, and diesel systems. Importantly, the processing unit combines the users’ demand profile with the energy resource data and other parameters to estimate the component sizes of the system—energy generating component, battery, inverter, and the energy delivered per kWh, including the economic and environmental results.

3.2.1. Solar Photovoltaic Power Model

The power output of a photovoltaic power generator is represented by Equation (1) [131,132]:
P s = S r c d r G S R G S R , S T C 1 + α s T c T c , S T C
where P s , S r c , d r , G S R , G S R , S T C , α s , T c , and T c , S T C are the power output of the solar power system, rating of solar PV modules, PV derating factor, solar irradiance incident on the PV modules, irradiance at standard test condition (STC), temperature coefficient of solar power (%/ ° C ), PV cell temperature ( ° C ) and PV cell temperature at STC, as obtained from [126]. The solar PV temperature is calculated by Equation (2) [131,133]:
T c = N O C T 20 ° C G R f G S R
where N O C T and G R f are the nominal operating cell temperature and the reference solar irradiance of 0.8 kW/m2, respectively.

3.2.2. Wind Power Model

The power output of a wind power generator is given by Equation (3) [131,133]:
P w = 1 2 ρ A v 3
where ρ , A and v are the air density (1.225 kg/m3), swept area of the turbine rotor (m2) and the wind speed (m/s). It is also necessary to state that the wind speed of a site is affected by the hub-height as represented by the power law of Equation (4) [131]:
v h u b = v a n ( h h h a n ) α
where v h u b , v a n , h h , h a n and α are the speed at the hub-height (m/s), wind speed at anemometer height (m/s), turbine hub height (m) and the anemometer height (m).

3.2.3. Hydropower Model

The output of a hydroelectric power system is given by Equation (5) [131]:
P h d = g   n e f f H n e t Q d ρ w
where g , n e f f , H n e t , Q d and ρ w are acceleration due to gravity (9.81 m/s2), hydro-turbine efficiency (%), net head (m), water flow rate (cumecs) and the water density (1000 kg/m3).

3.2.4. Diesel Power Model

The size of a diesel generator (DG) is estimated by the users’ peak load requirement with just a little percentage more. This is because the DG is expected to meet the maximum load all the time. The mathematical relation can be described by Equation (6).
D G c = D p k 1 + σ
where D p k and σ are the peak load (kW) and safety factor (%) that determines the difference between the DG capacity and the peak load. In addition, the fuel consumption of DG is calculated by Equation (7) [131,134]:
D G f c = A P o + B P r
where P o , P r , A and B are DG’s operating power output (kW), DG’s rated power (kW), fuel curve slope (0.246 L per kWh) and fuel curve intercept coefficient (0.08415 L per kWh), respectively [134].

3.2.5. Battery Model

The battery charge power, in kW, at the maximum charge rate (MCR) is calculated by Equation (8) [131,135]:
P M C R = 1 e α c Δ t Q m Q Δ t
where α c , Δ t , Q m and Q is the battery MCR (A/Ah), the length of time step (hr), battery size (kWh), and total battery energy at the beginning of time step (kWh), respectively. The battery maximum charge power (MCP) at the maximum charge current (MCC) can be calculated by Equation (9) [131,135]:
P M C C = N b t I m V n 10 3
where N b t , I m and V n is the number of battery cells, battery MCC (A), and the single battery cell voltage (V), respectively. The maximum P M C R is equated to the minimum values of the three key parameters shown in Equation (10) assuming that each applies after the battery charging losses:
P M = m i n P K B M P M C R P M C C n b e f f
where P M , P K B M and n b e f f is battery MCP (kW), maximum power that can be absorbed by the battery each time step as defined by the kinetic battery model principle, and the round-trip efficiency of the battery (%), respectively [55,58]. The battery size, daily electricity demand and the autonomy are connected by Equation (11) [131,135,136]:
A d D e d = N b t V n Q n n b e f f 1 Q m i n 100
where A d , D e d , Q n , and Q m i n is the autonomy, daily energy demand, capacity of a single cell (Ah) and the minimum state of charge of battery (%), respectively. The minimum state of charge of battery corresponds to 100% minus the maximum depth of discharge of battery (%). The battery size in (Ah), is the product of N b t Q n , which is calculated by Equation (12):
N b t Q n = A d D e d n b e f f V n D o D
where DoD is depth of discharge of battery (%).

3.2.6. Inverter Model

The output of energy systems such as solar PV, fuel cells, batteries, etc., is direct current (DC). However, the appliances and loads at the users’ premises are commonly alternating current (AC) operated. The purpose of the inverter, in this case, is to convert the DC to AC output for powering the users’ appliances. The inverter capacity (kVA) may be determined by Equation (13) [135]:
I s i z e = 3 L i n + L o a p . f
where L i n , L o a and p . f is inductive load (kW), other loads (kW) and power factor of the system, respectively.

3.2.7. Hybrid Power Model

The hybrid power model essentially combines any two or more energy systems to meet the users’ load requirement. The hybrid energy system size is the sum of all the energy output of the participating sources, which is represented by Equation (14):
E H = E 1 + E 2 + E 3 + E n
where E 1 to E n represent the output of the participating energy resources in the system, and the subscript n serves as the number of different power generation sources that makes up the system.

3.2.8. Users’ Daily Demand Profile

The user’s daily load demand profile is determined by Equation (15) [21]:
P t d = 0.5 p j t j + 2 j k 1 p 1 + j t 1 + j + p n t n
where j = 1, n = 24, and k = 23 (i.e., the number of intervals or segments in the profile). Additionally, p j represents the electrical load at time t j ; p n is the load at time t n , while P t d is the total users’ daily demand.

3.2.9. Reliability of the System

The energy system reliability is quantified based on the loss of load probability and the availability indices, as represented by Equations (16) and (17), respectively [135,137]:
L O L P = j = 1 8760 ( P u n ) j j = 1 8760 ( P t d y ) j
A v = 1 L O L P
where P u n and P t d y represent the unmet demand and total annual demand, both measured in kWh/yr. The LOLP may then be defined according to Equation (16) as the ratio of the users’ unmet energy demand to the total demand during the year (i.e., 8760 h).
The renewable energy fraction is given by Equation (18) [138]:
R F % = 1 D P T P × 100
where D P and T P represent the diesel power output and total power output. Of course, the total power output is the sum of the diesel power and renewable power output.

3.2.10. Economic Analysis

The yearly cash flow of the system is represented by Equation (19) [135,139]:
C j = C c j + C o j + C m j + C r j
where C , C c , C o , C m and C r stand for energy system cost, the capital cost of project, operational cost of the energy system, the maintenance cost of system component incurred or to be incurred, and the components replacement cost, respectively, all in year j.
The total life-cycle cost (TLCC) is the entire system cost, and it can be calculated by Equation (20) [139,140]. This is achieved by adding the expected annual energy systems costs, returned to the present value cost.
T L C C = j = 1 N C j ( 1 + d ) j = C 1 ( 1 + d ) 1 + C 2 ( 1 + d ) 2 + C 3 ( 1 + d ) 3 + .... + C N ( 1 + d ) N
where C, N and d represent the cost in year j, years in the project, and the annual discount rate. The capital recovery factor and the annualized cost are presented in Equations (21) and (22) [131,140,141]:
C R F d , N = d ( 1 + d ) N ( 1 + d ) N 1
C a n n = C R F d , P l s . L C C
where P l s represents the project lifespan.
The cost of electricity is given by Equation (23) [139,140,142,143]:
C o E = T L C C j = 1 N E p r o d j ( 1 + d ) j
where E p r o d represents the energy system output (kWh/yr), in the specific year j. The operational system cost is calculated by Equation (24) [139]:
C o p j = C o j + C m j + C r j

3.2.11. Environmental Analysis

The environmental impact of the system is determined by the type of energy resource or the fuel employed. Supposed that the energy system is purely fossil fuel-based, such as a diesel power system, then the emissions produced are carbon dioxide, carbon monoxide, unburned hydrocarbons, particulate matter, sulfur dioxide, and nitrogen oxides of A, B, C, D, E, and F, kg/yr, respectively, which are obtainable in HOMER. A purely renewable energy-based system is assumed to generate zero emissions per year. However, in a situation where there is a hybrid configuration of diesel and renewable energy fuel resources, the resulting emissions may then be calculated by multiplying the emissions A, B, C, D, E, and F by the percentage contribution of diesel fuel in the energy mix.

3.3. Output Unit

The output unit is divided into two, namely, the one based on STEE (Output 1) and the other one that is based on STEEP (Output 2). This implies that the output based on the STEE is taking through a decision-making process to ascertain whether or not the policy dimension is required, necessary, or to be added. In case the policy is required, then the results based on STEE dimension will be used to propose a suitable policy for the widespread application of the energy system, thus generating the output or results based on the STEEP model—sustainability criteria, as shown in Figure 1. However, if a policy is not required or added, then the output or results based on the STEE model will be recognized as the final output, i.e., Output 1 will then be equal to Output 2. The output parameters based on the STEE perspective are summarized in Table 4. The STEE parameters are represented by a 1 , to a n , , b 1 , to b n , , c 1 , to c n , , and d 1 , to d n , , respectively. The parameters are represented from 1 to n depending on the design and the prevailing issues. This implies that the parameters associated with the STEE criteria depend on the type of scenario considered by the designer or researcher.
One of the shortcomings of several existing designs, simulation, and analysis studies is the difficulty in quantifying or representing the social aspect, unlike the technical, economic, and environmental dimensions that have standard mathematical approaches for their assessments. This study makes efforts to integrate some social characteristics with the techno-economic and environmental aspects as presented in Table 3 and Table 4, as a basis for making useful planning decisions. Therefore, a deepened social characteristic in addition to the technical, economic, and environmental aspects will be instrumental to making a policy proposal and developing an energy modelling software.

Policy Integration with STEE Model (Output 2)

The results presented in Table 4 can be used as a basis for decision-making and policy formulation. An ideal situation, for example, may be that parameter a 1 , is consistent with the users’ financial capacity. However, the complexity of the social characteristic in energy systems planning parlance is that the members of the community do not have the same income or financial power, in terms of being able to pay for the services, i.e., meeting the cost of the energy system ( c 1 , and c 5 , ). In this case, the users need to be grouped according to their status in a range of income to understand what is feasible for the intended community or users. Another possible direction for a 1 , is for it to be more than the financial capacity of the specified users. In this case, a subsidy or an incentive mechanism may be useful for driving the energy system. This is an example of a policy initiative that may be suggested and may be represented by e 1 .
In addition, the parameter a 2 , may practically suggest that not all the existing appliances will be powered by the proposed energy system, especially when a single-source system is being considered, which is based on solar electricity in an off-grid configuration, just as described by b 3 , for instance. An existing appliance such as the old refrigerator and other loads such as pumps with higher ratings, and high-current devices such as hot plates and cookers, etc., are usually not considered in practical situations because they are not energy-efficient. It is a common practice around the world that old/energy-draining appliances are replaced by energy-efficient appliances—a step towards achieving sustainability by reducing energy consumption and emissions. To achieve this, there is a need for an understanding and it will require a form of legislation or policy to drive such transitions. This idea may be represented by e 2 .
The users’ preference, a 3 , , may not be a cost-effective or suitable solution for their energy situation, in terms of demand and the energy systems components required. Additionally, a suitable energy solution may not be the cost-effective option. The users may prefer only solar PV solutions, for instance, for their location, whereas a hybrid solution of solar PV and diesel systems will deliver a reliable energy supply, but a higher renewable energy resource percentage is preferred. In this case, it may be necessary to ascertain how the energy system may be employed for productive uses, other than for domestic use since the energy supply is assumed to be reliable ( b 4 , and b 5 , ). This development can be a pathway for business opportunities in the community where revenue can be generated to sustain the energy system. Furthermore, the number of hours of electricity supply or usage, a 4 , , will be a basis for billing the proposed users at the end of every month (i.e., tariff). In this case, there must be an understanding or policy on the cost per kWh of electricity for the community under study. This aspect that relates a 3 , , a 4 , , b 4 , , b 5 , , and c 5 , may be represented by e 3 .The willingness of the users to pay for energy supply, a 5 , , is a key factor that will drive the planning and implementation of the energy supply system. This aspect is expected to facilitate, propel and strengthen the collaboration between the energy system provider and the communities. A sound policy framework will adequately integrate the proposed energy users and usage credit may be given to those users who subscribe to renewable energy-based energy services as a means to encourage clean or green energy options. The aspect concerning the willingness of the users to pay for the energy service may be represented by e 4 .
Technical issues about meeting the users’ daily energy requirements, system capacity, possible load growth, battery performance indices such as b 1 , , b 2 , , b 3 , , b 6 , , b 7 , , b 8 , , and b 9 , are also combined with the social and other dimensions in the context of sustainability. This is why the interwoven STEE parameters are crucial to proposing the policy parameters. The parameters d 8 , to d 31 , will affect the quantity of electricity delivered by the system. An unplanned increase in users’ energy demand (load growth), for example, may affect the performance and reliability of the energy system, or may even damage the energy system. The users’ load growth is a typical social issue, and adequate technical consideration for this will enhance the reliability of the energy system. This will also pave the way for the proliferation of sustainable energy systems with a positive users’ experience.
On the environmental side, for instance, it is desirable for the energy solutions to be eco-friendly in terms of less environmental impact—emissions and noise pollution, that is based on parameters d 1 , to d 6 , , and d 7 , , respectively. These parameters will reveal whether or not the proposed energy system will meet the environmental impact level. This aspect may also drive the implementation of the usage credit as represented by e 4 .The parameters for output 2 can be represented as e 1 to e n , depending on considerations of the designer or research, with e 1 , e 2 , e 3 and e 4 capturing the issues pertaining to subsidy or incentive, transition to the usage of smart and energy-efficient appliances, energy billing (tariff) and revenue generation, and collaboration and usage credit incentive, respectively.

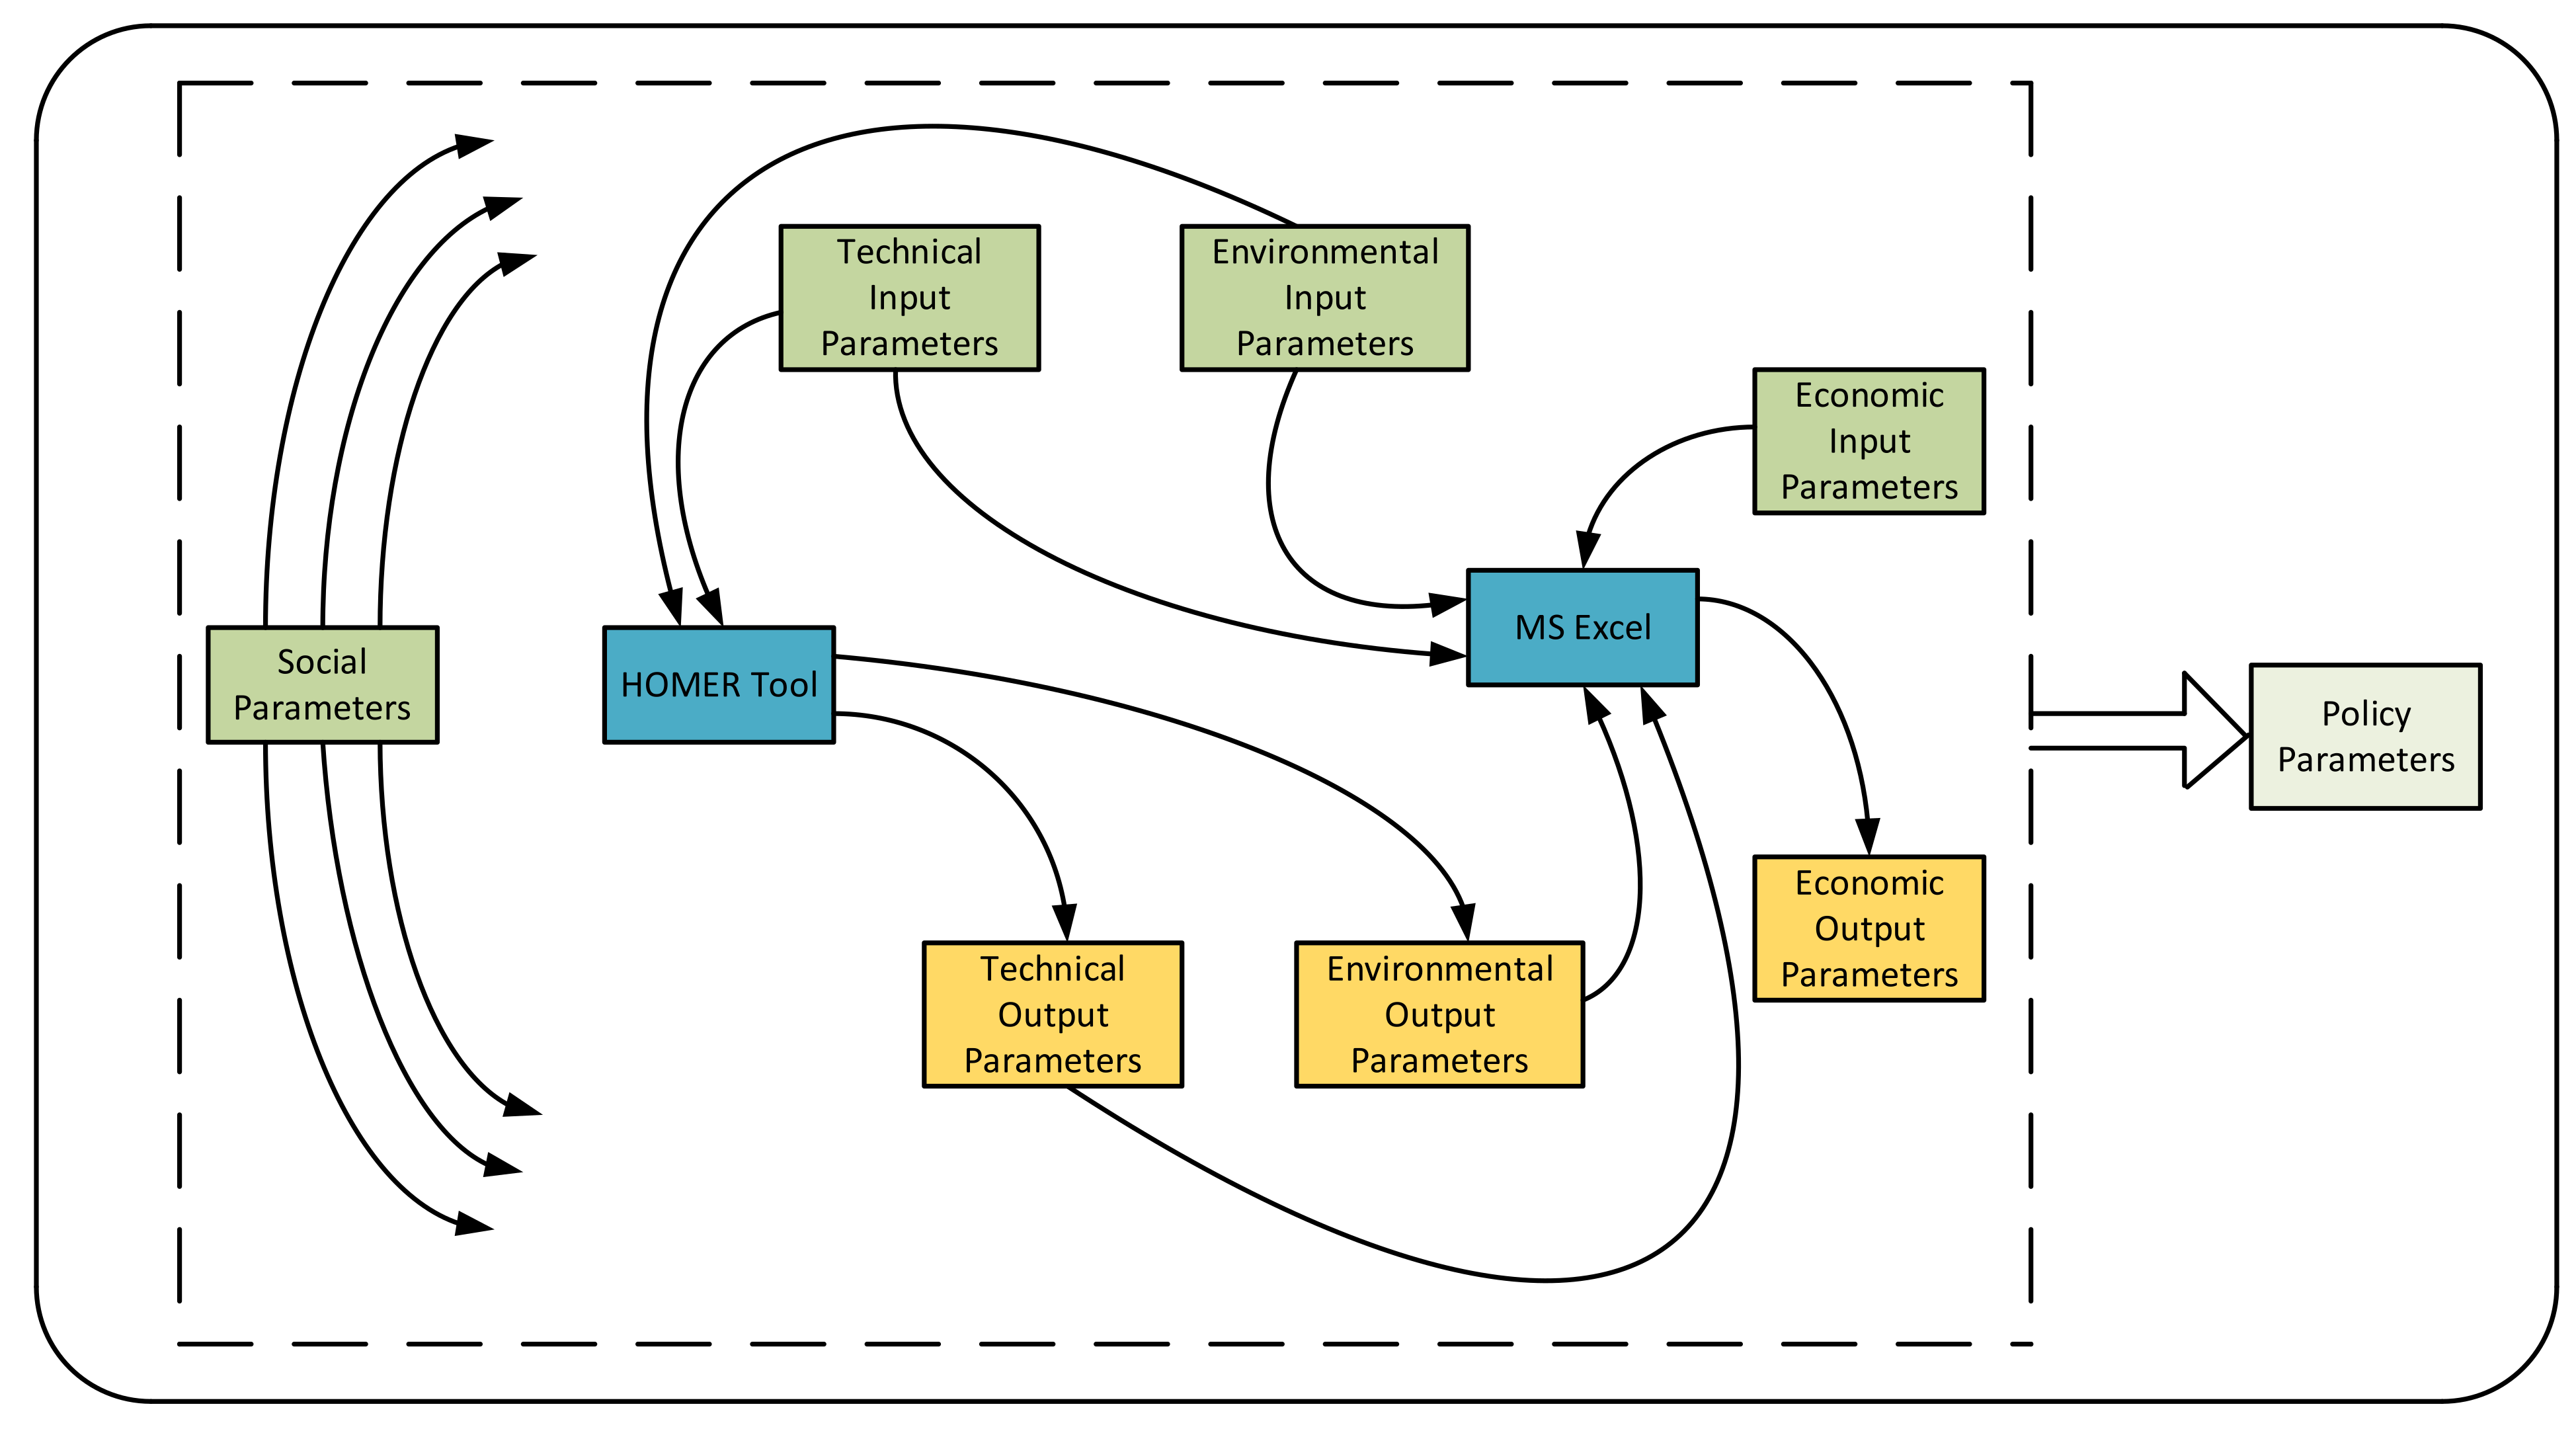
3.4. Application of the Proposed Simulation Framework

This study introduces a case study to test the proposed simulation framework presented in Figure 1. Adurasogo community in Ijoko-Ota, Ogun State, Nigeria is assumed for the case study. Some houses are supplied by the utility, while some houses are also not connected to the national grid. This is because of the poor and erratic power supply to this area. Fossil-fuel generators are run most of the time to meet the users’ basic energy requirements. A total number of 60 residential dwellings are used for this community. This location is blessed with a solar energy resource, and because of the noise pollution at night, solar electricity is the most preferred alternative electricity option. However, a combination of the solar and diesel electricity option will be a suitable option for the users from the point of view of reliability given that renewable energy resources are a variable source of electricity.
The strategy for the example simulation and analysis is presented in Figure 2. This strategy has presented the role of software in the planning and designing of energy systems from the point of view of sustainability. It is mentioned earlier in this study that providing energy solutions for people with different statuses in this situation requires a holistic approach with various perspectives [144], such as the social, technical, economic, environmental, and policy dimensions. A hybrid approach is employed that combines two energy software, HOMER and Microsoft EXCEL, to simulate an energy system for the specified community. In this case, HOMER is used to simulate the technical and environmental aspects, while Microsoft EXCEL is employed to simulate the economic aspect. Such an approach is expected to benefit from the complementary features of the two software. The HOMER simulation tool has the capability to determine optimal system component sizes. This study realizes the optimal sizes of PV, battery, generator and inverter based on the HOMER simulation output results.
Practically, the social dimension is central to the other dimensions. This is because it is directly related to the users and it surfaces at every stage of planning, i.e., from preliminary to post-implementation. The technical and environmental input parameters, i.e., b1 to b8 and d1 to d32 are supplied to HOMER, which is then processed and optimized to produce the technical and environmental output parameters, b 1 , to b 11 , and d 1 , to d 9 , . The technical and the environmental inputs and outputs parameters are then combined with the economic input parameters, c1 to c6, serving as input to the Microsoft EXCEL tool. The economic output parameters, c 1 , to c 6 , , are obtained after simulation. The social parameters before and after simulation are a1 to a5 and a 1 , to a 5 , . These STEE parameters are brought together to generate the policy parameters, e1 to e4. The policy parameters at this stage may be examined to propose relevant policies for the users and/or energy system.
There are four approaches to estimating users’ load requirements, such as bottom-up, survey, regression, and data-driven techniques [145]. The bottom-up approach was used in this study to first estimate the load for a single house by assigning an electrical power rating and the duration of operation of the appliance, in hours, including the loading percentage. The loading percentage is usually less than 100% for appliances such as freezers or refrigerators that do not continuously operate at rated power when they are switched on, while other appliances may be loaded 100%. The value obtained for a single house is then used as a basis for estimating the load requirements for a higher number of houses.
The load requirement of a single house is presented in Table 5; the total load requirement for 60 houses is then calculated as 38.1 kW. Figure 3 represents the load profile (usage of the appliances over 24 h period) for the 60 houses, the total demand being 388.2 kWh/d, which has been obtained by operating the appliances at different hours during the day using the Microsoft EXCEL. The peak load is 32.82 kW and it occurs at 8 p.m. The location’s solar irradiation and the temperature data are presented in Table 6 based on [146], while Table 7 shows the initial cost of the system components based on Nigerian situation and assumptions.

4. Results

Table 8 shows the input and output parameters for the case study described in Figure 2 based on the proposed framework in Figure 1. The output parameters are presented in terms of the social, technical, economic, environmental and policy dimensions. It is pertinent to state that a community-based energy system design is determined by the users, location, situation, and local conditions. This is why a practical approach such as the STEEP is required to deliver a sustainable energy system to a particular location or community. The strategy introduced in this study can be used as the basis for evolving simulation and analysis processes for designing energy systems from the point of view of sustainability.
The STEEP input and output parameters presented in Table 8 further demonstrate that the major factor associated with adapting the existing energy simulation tools and analysis strategies to the concept of sustainability is a question of requirements. This implies that the social, technical, economic, environmental and policy requirements need to be well understood for decision-making. For instance, the users’ requirements are key when designing, simulating, and analyzing energy systems. The values of 0.3 and 0.7 are used for the minimum battery state of charge and maximum depth of discharge in this study. The values used for other parameters such as PV module, battery and inverter efficiency, discount and inflation rates are also presented in Table 8.
The cost of energy per kWh, for example, obtained from the simulation is USD 0.314, i.e., NGN 128.74 (using an exchange rate of USD 1 to NGN 410). This is high compared to the tariff of NGN 26.97 (i.e., USD 0.0658) per kWh by the Ibadan Electricity Distribution Company (IBEDC) for service band E4H for poorly served areas. This result demonstrates that the cost of the new energy system for the intended community is about five times more than the tariff presented by the utility (IBEDC). Suppose that the energy system provides a 24 h supply to a single house in the community, the monthly cost of energy for a demand of 6.472 kWh/d is NGN 24,996 (i.e., USD 61). This is about 80% of the minimum wage (USD 73.2) in the country. What follows this is likely to be the issue of affordability, especially for the low-income earners in the community. This issue presents a link between the social, economic and the policy.
Furthermore, the STEEP model provides useful insights into asking critical questions that may be instrumental to formulating the structure and platform for sustainable community-based energy systems. From the point of view of social and policy, the questions may include: who owns the energy system? Is it the government agency or the utility or the community or through public–private partnership (PPP) or between the community and a private organization? Who is the energy system meant to serve? Is it for a single user or multiple users? etc.

4.1. Need for Energy Systems Software Based on Sustainability Dimensions

The role of software in energy systems design and planning cannot be over-emphasized, as it is also crucial to different other fields of practice such as business, agriculture, mathematics, etc. [147]. The designer’s needs determine the complexity of a software [148]. The complexity of the issues surrounding the conceptualization, planning, design, implementation, and management of energy systems require a sound simulation and analysis strategy. A computer-based technique, rather than manual calculation, provides a quicker and better solution, and this justifies the use of appropriate software.
Importantly, one thing is to design and implement an energy system, another crucial aspect is the capability to sustain what has been implemented. This is why the concept of sustainability needs to be given adequate considerations in energy systems planning and design, which is practical in terms of covering all the associated with the system, including the success and the failure factors. The sustainability dimensions such as social, technical, economic, environmental, and policy (STEEP) are key in this regard [4].
Most existing energy systems software can evaluate the technical, economic, and the environmental parameters based on standard mathematical models. This is not the case with the social parameters as they are not represented in the software. Therefore, this study demonstrates how the social aspects could be represented and then integrated with the technical, economic, and environmental parameters. This combination, referred to as the STEE model, is then used as the basis for proposing relevant policy. The necessity for the policy dimension is motivated by the fact that one of the major barriers to the proliferation of clean energy systems in some developing countries is the lack of enabling policy.
Though this study does not lead to the development of a software package, its strategy and results can be used to design an energy modelling simulation that will capture the relevant parameters such as those presented in this work. Such a tool will not only simulate and optimize the components’ sizes such as batteries, PV modules, inverters, wind generator, hydro generator, biomass generator, diesel generator, etc., but will also adequately consider the users’ perspective and the local conditions—deepened social characteristics, the issues pertaining to the long-term viability of the proposed system, and the other requirements presented in terms of policy parameters. Software engineering has a critical role to play by working on the existing software requirements modelling and analysis techniques in a manner that will adequately integrate sustainability requirements for decision-making processes [3,4].
The STEEP framework is based on microgrid systems for energy-poor communities, and it can be used for designing microgrid systems in other parts of the world. Importantly, the simulation strategy captures the sustainability dimensions and it can aid energy systems planning with policy perspective for the intended location based on the required parameters, i.e., input, in terms of the social, technical, economic and environmental (STEE) dimensions. The model can be used with the energy resources data, cost, and local condition of other countries, as presented in this paper to obtain results for the specified location. In addition, the framework can be a basis for requirements engineering that can facilitate the development of energy simulation software package.

4.2. Future Research Directions

The future work will consider the following:
  • Design and simulation of microgrid systems using the artificial intelligence technique such as the fuzzy-based multi-criteria decision-making (MCDM) analysis based on the STEE input parameters presented in the paper compared with the strategy presented in this study;
  • Development of a software based on STEEP criteria.

5. Conclusions

This paper has provided a comprehensive review of the existing simulation tools and approaches used for planning and designing microgrid technologies for electricity supply applications. It has discussed and compared the existing strategies and the emerging trends in energy systems modelling and simulation based on the software employed, type of problem to be solved, input parameters provided, processing and optimization, and the expected output. The study has introduced a practical simulation framework for energy systems design and analysis, which is based on the social-technical-economic-environmental-policy (STEEP) model. The STEEP was employed to represent a holistic sustainability model that considered the key energy systems planning dimensions compared to the traditional TE model commonly used in several existing simulation tools and analyzes.
The paper provides insights into data-driven analysis and applications in energy modelling software development. This study identified the difficulty in representing or quantifying the social aspect in several existing designs, simulation, and analysis studies, unlike the technical, economic, and environmental dimensions that are based on standard mathematical approaches for their assessments. It then made an effort to integrate some social parameters with the TE and environmental aspects to form the STEE perspective, whose parameters can be used to propose relevant policies, thereby leading to the STEEP model. The type of analysis required by the designer or research was used to determine whether or not a policy is required after the STEE perspective is realized.
The study used two software tools, HOMER and Microsoft EXCEL, to practically demonstrate the simulation and analysis of the proposed sustainability model (STEEP). This was achieved by using a location in Nigeria as a case study where it was required to design an energy system for 60 energy-poor houses. As it was established that the issue with adapting the existing simulation strategy to one with a sustainability perspective, is a question of requirements, this study represented these in terms of input parameters. The technical and environmental input parameters, i.e., b1 to b8 and d1 to d32, were first supplied to the HOMER tool, and then processed and optimized to generate the technical and environmental output parameters, b 1 , to b 11 , and d 1 , to d 9 , . The technical and the environmental inputs and outputs parameters were combined with the economic input parameters, c1 to c6, and these were supplied to the Microsoft EXCEL tool as input. The economic output parameters, c 1 , to c 6 , , were obtained after simulation. The social parameters before and after simulation are a1 to a5 and a 1 , to a 5 , , respectively. These STEE parameters were brought together and analyzed to generate the policy parameters, e1 to e4.
The policy parameters can be examined to propose relevant policies. This study provides insights into better understanding of the requirements for sustainability in energy systems simulation and decision-making, which are multi-dimensional in nature and beyond the traditional techno-economic dimensions. It showcases a basis and the need for developing energy system modelling software for sustainability analysis. Since the role of software cannot be over-emphasized, the framework/strategy and the analysis presented in this study can be useful for requirements engineering. Given the complexity of the subject of sustainability and its associated multi-parameters, there is indeed the need for an interdisciplinary network between energy engineering and software engineering for possible modalities.

Author Contributions

Conceptualization, methodology, simulation, writing and analysis, D.A.; methodology, writing—review and analysis, A.A.; methodology, critique, and editing, E.O.; software and analysis, A.O.; methodology and analysis, T.A. All authors have read and agreed to the published version of the manuscript.

Funding

This research study received no external funding.

Conflicts of Interest

The authors declare no conflict of interest.

References

  1. Yee, F.; Novak, P.Z.; Klemeš, J.J. Emerging tools for energy system design increasing economic and environmental sustainability. Energies 2020, 13, 4062. [Google Scholar]
  2. Feron, S. Sustainability of off-grid photovoltaic systems for rural electrification in developing countries: A review. Sustainability 2016, 8, 1326. [Google Scholar] [CrossRef] [Green Version]
  3. Becker, C.; Betz, S.; Chitchyan, R.; Duboc, L.; Easterbrook, S.; Penzenstadler, B.; Seyff, N.; Venters, C. Requirements: The Key to Sustainability. IEEE Softw. 2016, 33, 56–65. [Google Scholar] [CrossRef] [Green Version]
  4. Cabot, J.; Easterbrook, S.; Horkoff, J.; Lessard, L.; Liaskos, S.; Mazon, J.-N. Integrating sustainability in decision-making processes: A modelling strategy. In Proceedings of the 2009 31st International Conference on Software Engineering—Companion Volume, Vancouver, BC, Canada, 16–24 May 2009; pp. 207–210. [Google Scholar]
  5. Pereira, T. Sustainability: An integral engineering design approach. Renew. Sustain. Energy Rev. 2009, 13, 1133–1137. [Google Scholar] [CrossRef]
  6. Fonseca, J.D.; Commenge, J.-M.; Camargo, M.; Falk, L.; Gil, I.D. Multi-criteria optimization for the design and operation of distributed energy systems considering sustainability dimensions. Energy 2021, 214, 118989. [Google Scholar] [CrossRef]
  7. Akinyele, D.; Belikov, J.; Levron, Y. Challenges of Microgrids in Remote Communities: A STEEP Model Application. Energies 2018, 11, 432. [Google Scholar] [CrossRef] [Green Version]
  8. Akinyele, D.; Rayudu, R. Strategy for developing energy systems for remote communities: Insights to best practices and sustainability. Sustain. Energy Technol. Assess. 2016, 16, 106–127. [Google Scholar] [CrossRef]
  9. Fonseca, J.D.; Commenge, J.-M.; Camargo, M.; Falk, L.; Gil, I.D. Sustainability analysis for the design of distributed energy systems: A multi-objective optimization approach. Appl. Energy 2021, 290, 116746. [Google Scholar] [CrossRef]
  10. Xiang, Y.; Cai, H.; Liu, J.; Zhang, X. Techno-economic design of energy systems for airport electrification: A hydrogen-solar-storage integrated microgrid solution. Appl. Energy 2021, 283, 116374. [Google Scholar] [CrossRef]
  11. Murugaperumal, K.; Raj, P.A.D.V. Feasibility design and techno-economic analysis of hybrid renewable energy system for rural electrification. Sol. Energy 2019, 188, 1068–1083. [Google Scholar] [CrossRef]
  12. Sawle, Y.; Gupta, S.; Bohre, A.K. Socio-techno-economic design of hybrid renewable energy system using optimization techniques. Renew. Energy 2018, 119, 459–472. [Google Scholar] [CrossRef]
  13. Elkadeem, M.; Wang, S.; Sharshir, S.; Atia, E.G. Feasibility analysis and techno-economic design of grid-isolated hybrid renewable energy system for electrification of agriculture and irrigation area: A case study in Dongola, Sudan. Energy Convers. Manag. 2019, 196, 1453–1478. [Google Scholar] [CrossRef]
  14. Baseer, M.; Alqahtani, A.; Rehman, S. Techno-economic design and evaluation of hybrid energy systems for residential communities: Case study of Jubail industrial city. J. Clean. Prod. 2019, 237, 117806. [Google Scholar] [CrossRef]
  15. Walter, O.; Tremel, A.; Prenzel, M.; Becker, S.; Schaefer, J. Techno-economic analysis of hybrid energy storage concepts via flowsheet simulations, cost modeling and energy system design. Energy Convers. Manag. 2020, 218, 112955. [Google Scholar] [CrossRef]
  16. Mavromatidis, G.; Petkov, I. MANGO: A novel optimization model for the long-term, multi-stage planning of decentralized multi-energy systems. Appl. Energy 2021, 288, 116585. [Google Scholar] [CrossRef]
  17. Murugaperumal, K.; Srinivasn, S.; Prasad, G.S. Optimum design of hybrid renewable energy system through load forecasting and different operating strategies for rural electrification. Sustain. Energy Technol. Assess. 2020, 37, 100613. [Google Scholar] [CrossRef]
  18. Akinyele, D. Techno-economic design and performance analysis of nanogrid systems for households in energy-poor villages. Sustain. Cities Soc. 2017, 34, 335–357. [Google Scholar] [CrossRef]
  19. Shabani, M.; Dahlquist, E.; Wallin, F.; Yan, J. Techno-economic comparison of optimal design of renewable-battery storage and renewable micro pumped hydro storage power supply systems: A case study in Sweden. Appl. Energy 2020, 279, 115830. [Google Scholar] [CrossRef]
  20. Kiptoo, M.K.; Lotfy, M.E.; Adewuyi, O.B.; Conteh, A.; Howlader, A.M.; Senjyu, T. Integrated approach for optimal techno-economic planning for high renewable energy-based isolated microgrid considering cost of energy storage and demand response strategies. Energy Convers. Manag. 2020, 215, 112917. [Google Scholar] [CrossRef]
  21. Akinyele, D.; Rayudu, R.; Nair, N. Development of photovoltaic power plant for remote residential applications: The socio-technical and economic perspectives. Appl. Energy 2015, 155, 131–149. [Google Scholar] [CrossRef]
  22. Akinyele, D.; Olatomiwa, L.; Ighravwe, D.E.; Babatunde, M.O.; Monyei, C.; Aikhuele, D. Optimal planning and electricity sharing strategy of hybrid energy system for remote communities in Nigeria. Sci. Afr. 2020, 10, 589. [Google Scholar] [CrossRef]
  23. Heidari, M.; Parra, D.; Patel, M.K. Physical design, techno-economic analysis and optimization of distributed compressed air energy storage for renewable energy integration. J. Energy Storage 2021, 35, 102268. [Google Scholar] [CrossRef]
  24. Kalinci, Y.; Hepbasli, A.; Dincer, I. Techno-economic analysis of a stand-alone hybrid renewable energy system with hydrogen production and storage options. Int. J. Hydrogen Energy 2015, 40, 7652–7664. [Google Scholar] [CrossRef]
  25. Nadal, A.; Ruby, A.; Bourasseau, C.; Riu, D.; Berenguer, C. Accounting for techno-economic parameters uncertainties for robust design of remote microgrid. Int. J. Electr. Power Energy Syst. 2020, 116, 105531. [Google Scholar] [CrossRef] [Green Version]
  26. Sawle, Y.; Gupta, S.; Bohre, A.K. Review of hybrid renewable energy systems with comparative analysis of off-grid hybrid system. Renew. Sustain. Energy Rev. 2018, 81, 2217–2235. [Google Scholar] [CrossRef]
  27. Maisanam, A.K.S.; Biswas, A.; Sharma, K.K. An innovative framework for electrical energy storage system selection for remote area electrification with renewable energy system: Case of a remote village in India. J. Renew. Sustain. Energy 2020, 12, 024101. [Google Scholar] [CrossRef]
  28. Krishan, O.; Suhag, S. Techno-economic analysis of a hybrid renewable energy system for an energy poor rural community. J. Energy Storage 2019, 23, 305–319. [Google Scholar] [CrossRef]
  29. Van Der Heijde, B.; Vandermeulen, A.; Salenbien, R.; Helsen, L. Integrated Optimal Design and Control of Fourth Generation District Heating Networks with Thermal Energy Storage. Energies 2019, 12, 2766. [Google Scholar] [CrossRef] [Green Version]
  30. Ridha, H.M.; Gomes, C.; Hizam, H.; Ahmadipour, M.; Heidari, A.A.; Chen, H. Multi-objective optimization and multi-criteria decision-making methods for optimal design of standalone photovoltaic system: A comprehensive review. Renew. Sustain. Energy Rev. 2021, 135, 110202. [Google Scholar] [CrossRef]
  31. Siraganyan, K.; Perera, A.T.D.; Scartezzini, J.-L.; Mauree, D. Eco-Sim: A Parametric Tool to Evaluate the Environmental and Economic Feasibility of Decentralized Energy Systems. Energies 2019, 12, 776. [Google Scholar] [CrossRef] [Green Version]
  32. Hlal, I.M.; Ramachandaramurthy, V.K.; Hafiz, N.F.; Bin Tuan Addullah, T.R. Optimal Techno-Economic Design of Standalone Hybrid Renewable Energy System Using Genetic Algorithm. IOP Conf. Ser. Earth Environ. Sci. 2019, 268, 012012. [Google Scholar] [CrossRef]
  33. Rehman, S.; Habib, H.U.R.; Wang, S.; Buker, M.S.; Alhems, L.M.; Al Garni, H.Z. Optimal Design and Model Predictive Control of Standalone HRES: A Real Case Study for Residential Demand Side Management. IEEE Access 2020, 8, 29767–29814. [Google Scholar] [CrossRef]
  34. Mokhtara, C.; Negrou, B.; Bouferrouk, A.; Yao, Y.; Settou, N.; Ramadan, M. Integrated supply–demand energy management for optimal design of off-grid hybrid renewable energy systems for residential electrification in arid climates. Energy Convers. Manag. 2020, 221, 113192. [Google Scholar] [CrossRef]
  35. Salehin, S.; Ferdaous, M.; Chowdhury, R.M.; Shithi, S.S.; Rofi, M.B.; Mohammed, M.A. Assessment of renewable energy systems combining techno-economic optimization with energy scenario analysis. Energy 2016, 112, 729–741. [Google Scholar] [CrossRef]
  36. Rafique, M.M.; Rehman, S.; Alhems, L.M. Developing zero energy and sustainable villages – A case study for communities of the future. Renew. Energy 2018, 127, 565–574. [Google Scholar] [CrossRef]
  37. Gbadamosi, S.L.; Nwulu, N.I. Optimal power dispatch and reliability analysis of hybrid CHP-PV-wind systems in farming applications. Sustainability 2020, 12, 8199. [Google Scholar] [CrossRef]
  38. Jamal, T.; Urmee, T.; Shafiullah, G. Planning of off-grid power supply systems in remote areas using multi-criteria decision analysis. Energy 2020, 201, 117580. [Google Scholar] [CrossRef]
  39. Javed, K.; Ashfaq, H.; Singh, R.; Hussain, S.M.S.; Ustun, T.S. Design and Performance Analysis of a Stand-alone PV System with Hybrid Energy Storage for Rural India. Electronics 2019, 8, 952. [Google Scholar] [CrossRef] [Green Version]
  40. Benalcazar, P.; Suski, A.; Kamiński, J. Optimal Sizing and Scheduling of Hybrid Energy Systems: The Cases of Morona Santiago and the Galapagos Islands. Energies 2020, 13, 3933. [Google Scholar] [CrossRef]
  41. Opiyo, N. Different Storage-Focused PV-Based Mini-Grid Architectures for Rural Developing Communities. Smart Grid Renew. Energy 2018, 9, 75–99. [Google Scholar] [CrossRef] [Green Version]
  42. Barakat, S.; Ibrahim, H.; Elbaset, A.A. Multi-objective optimization of grid-connected PV-wind hybrid system considering reliability, cost, and environmental aspects. Sustain. Cities Soc. 2020, 60, 102178. [Google Scholar] [CrossRef]
  43. Nebey, A.H. Design of optimal hybrid power system to provide reliable supply to rural areas of Ethiopia using MATLAB and Homer. Renew. Wind. Water Sol. 2021, 8, 1–7. [Google Scholar] [CrossRef]
  44. Fortaleza, B.N.; Serfa Juan, R.O.; Tolentino, L.K.S. IoT-based pico-hydro power generation system using pelton turbine. J. Telecommun. Electron. Comput. Eng. 2018, 10, 189–192. [Google Scholar]
  45. Lambert, T.; Paul, G.; Peter, L. Micropower system modeling with HOMER. In Integration of Alternative Sources of Energy; John Wiley and Sons: Hoboken, NJ, USA, 2006; pp. 379–418. [Google Scholar] [CrossRef]
  46. Tozzi, P., Jr.; Jo, J.H. A comparative analysis of renewable energy simulation tools: Performance simulation model vs. system optimization. Renew. Sustain. Energy Rev. 2017, 80, 390–398. [Google Scholar] [CrossRef]
  47. Kikuchi, Y. Simulation-Based Approaches for Design of Smart Energy System: A Review Applying Bibliometric Analysis. J. Chem. Eng. Jpn. 2017, 50, 385–396. [Google Scholar] [CrossRef] [Green Version]
  48. Meitei, I.C.; Irungbam, A.K.; Shimray, B.A. Performance evaluation of hybrid renewable energy system for supplying electricity to an institution and a hospital using HOMER. In International Conference on Intelligent Computing and Smart Communication 2019; Springer: Singapore, 2020; pp. 1317–1326. [Google Scholar] [CrossRef]
  49. Kumar, P.; Deokar, S. Designing and Simulation Tools of Renewable Energy Systems: Review literature. In Progress in Advanced Computing and Intelligent Engineering; Springer: Singapore, 2018; pp. 315–324. [Google Scholar]
  50. Homer, J.; Tang, Y.; Taft, J.D.; Orrell, A.C.; Narang, D.; Coddingtion, M.; Ingram, M.; Hoke, A. Electric Distribution System Planning with DERs-High-level Assessment of Tools and Methods’. March 2020. Available online: https://epe.pnnl.gov/pdfs/Electric_Distribution_System_Planning_Tools_PNNL-28138.pdf (accessed on 15 August 2021).
  51. Thakur, G.; Sharma, K.K.; Kaur, I.; Singh, B. Cost analysis of hybrid power system design using homer. In Advances in Communication, Devices and Networking; Springer: Cham, Switzerland, 2018; pp. 247–257. [Google Scholar]
  52. Vendoti, S.; Muralidhar, M.; Kiranmayi, R. Techno-economic analysis of off-grid solar/wind/biogas/biomass/fuel cell/battery system for electrification in a cluster of villages by HOMER software. Environ. Dev. Sustain. 2021, 23, 351–372. [Google Scholar] [CrossRef]
  53. Restrepo, D.; Restrepo, B.; Trejos-Grisales, L.A. Microgrid analysis using HOMER: A case study. DYNA 2018, 85, 129–134. [Google Scholar] [CrossRef]
  54. AlIrsyad, M.I.; Halog, A.B.; Nepal, R.; Koesrindartoto, D.P. Selecting Tools for Renewable Energy Analysis in Developing Countries: An Expanded Review. Front. Energy Res. 2017, 5, 34. [Google Scholar] [CrossRef] [Green Version]
  55. Gabbar, H.A.; Abdussami, M.R.; Adham, I. Techno-Economic Evaluation of Interconnected Nuclear-Renewable Micro Hybrid Energy Systems with Combined Heat and Power. Energies 2020, 13, 1642. [Google Scholar] [CrossRef] [Green Version]
  56. Aghenta, L.O.; Iqbal, M.T. Design and Dynamic Modelling of a Hybrid Power System for a House in Nigeria. Int. J. Photoenergy 2019, 2019, 1–13. [Google Scholar] [CrossRef] [Green Version]
  57. Srivastava, R.; Giri, V.K. Design of grid connected PV system using PVsyst. Afr. J. Basic Appl. Sci. 2017, 9, 92–96. [Google Scholar]
  58. Matchanov, N.A.; Seok, K.O.; Mirzaev, A.A.; Malikov, M.A.; Saidov, D.S. Study of Energy Yield on Grid Connected Micro-Inverter Type 2.24 kW PV System Using PVsyst Simulation Software. Appl. Sol. Energy 2020, 56, 263–269. [Google Scholar] [CrossRef]
  59. Dey, D.; Subudhi, B. Design, simulation and economic evaluation of 90 kW grid connected Photovoltaic system. Energy Rep. 2020, 6, 1778–1787. [Google Scholar] [CrossRef]
  60. Rawat, R.; Chaudhary, V.; Dubey, H.M.; Pandit, M. Performance Evaluation of 30.5 kWp On-Grid Solar System Using PVsyst. In Proceedings of the Intelligent Computing Applications for Sustainable Real-World Systems; Springer: Cham, Switzerland, 2020; pp. 376–388. [Google Scholar]
  61. Ecike, D. Using microgrids featuring PV panels and batteries connected to the grid to improve the reliability of a low-voltage feeder in Kinshasa. Energy Procedia 2019, 159, 117–122. [Google Scholar] [CrossRef]
  62. Ahmad, F.F.; Abdelsalam, M.; Hamid, A.K.; Ghenai, C.; Obaid, W.; Bettayeb, M. Experimental Validation of PVSYST Simulation for Fix Oriented and Azimuth Tracking Solar PV System. In Lecture Notes in Electrical Engineering; Springer: Singapore, 2020; pp. 227–235. [Google Scholar]
  63. Saad, M.; Tofigh, M.A.; Zaheeda, F.; AL-Masri, A.N.; Othman, N.B.; Irsyad, M.; Abbas, A.; Youssef, E. Design and modeling an automated digsilent power system for optimal new load locations. Int. J. Sci. Technol. Res. 2015, 4, 1–6. [Google Scholar]
  64. Aeggegn, D.B.; Salau, A.O.; Gebru, Y. Load flow and contingency analysis for transmission line outage. Arch. Electr. Eng. 2020, 69, 581–594. [Google Scholar]
  65. Honrubia-Escribano, A.; Jimenez-Buendia, F.; Gómez-Lázaro, E.; Fortmann, J. Field validation of a standard Type 3 wind turbine model implemented in DIgSILENT-PowerFactory following IEC 61400-27-1. IEEE Trans. Energy Convers. 2018, 33, 137–145. [Google Scholar] [CrossRef]
  66. Adetokun, B.B.; Muriithi, C.M. Impact of integrating large-scale DFIG-based wind energy conversion system on the voltage stability of weak national grids: A case study of the Nigerian power grid. Energy Rep. 2021, 7, 654–666. [Google Scholar] [CrossRef]
  67. Rashidi, R.; Hatami, A.; Abedini, M. Multi-microgrid energy management through tertiary-level control: Structure and case study. Sustain. Energy Technol. Assess. 2021, 47, 101395. [Google Scholar]
  68. Hay, S.; Ferguson, A. A review of power system modelling platforms and capabilities. IET Spec. Interest Publ. Counc. Sci. Technol. 2015, 3–13. [Google Scholar]
  69. Venayagamoorthy, G.K. Comparison of power system simulation studies on different platforms rscad, pscad/emtdc, and simulink simpower systems. In International Conference on Power Systems, Operation and Planning; World Academy of Science, Engineering and Technology: Tokyo, Japan, 11–12 November 2021; pp. 38–41. [Google Scholar]
  70. Kenyon, R.W.; Wang, B.; Hoke, A.; Tan, J.; Antonio, C.; Hodge, B.-M. Validation of Maui PSCAD Model: Motivation, Methodology, and Lessons Learned. In Proceedings of the 2020 52nd North American Power Symposium (NAPS), Tempe, AZ, USA, 11–13 April 2021; pp. 1–6. [Google Scholar]
  71. Ashok, K.L.; Indragandhi, V.; Uma Maheswari, Y. Software tools for the simulation of electrical systems; Academic Press: Cambridge, MA, USA, 2020; pp. 287–347. [Google Scholar]
  72. Han, S.-G.; Park, M.; Yu, I.-K. A Novel Simulation Method for Wind Power Generation System Using PSCAD/EMTDC. In Proceedings of the IFAC Proceedings Volumes; Elsevier: Amsterdam, The Netherlands, 2003; Volume 36, pp. 767–772. [Google Scholar]
  73. Gorgan, B.; Busoi, S.; Tanasescu, G.; Notingher, P.V. PV plant modeling for power system integration using PSCAD software’. In Proceedings of the 2015 9th International Symposium on Advanced Topics in Electrical Engineering, ATEE, Bucharest, Romania, 7–9 May 2015; pp. 753–758. [Google Scholar]
  74. Ishak, N.H.; Isa, I.S.; Abdullah, S.; Masri, S.; Tawi, F.M.T. Performance comparison of electric power flow solutions using PSCAD. In Proceedings of the 2010 International Conference on Science and Social Research (CSSR 2010), Kuala Lumpur, Malaysia, 5–7 December 2010; pp. 542–547. [Google Scholar]
  75. Fadilah, S.N.; Saad, N.M.; Abas, M.F.; Ramli, N.L. Modeling and simulation of UPFC for dynamic voltage control in power system using PSCAD/EMTDC software. ARPN J. Eng. Appl. Sci. 2015, 10, 9943–9948. [Google Scholar]
  76. Zhao, P.; Yang, J.; Guo, M.; Fei, F.; Huang, R.; Pang, A.; Yang, M.; Huang, Q. Rapid Modeling of Large-Scale Power System Based on PSCAD. In Proceedings of the 2019 IEEE Asia Power and Energy Engineering Conference (APEEC), Chengdu, China, 29–31 March 2019; pp. 167–171. [Google Scholar]
  77. Yang, F.; Chen, K.; Qian, S.; Zhan, J.Y.; Yu, R.; Song, P. PSCAD-MATLAB coupled simulation method for power flow optimization using continuous reactive power controllable device. J. Phys. Conf. Ser. 2021, 1754, 1–5. [Google Scholar] [CrossRef]
  78. Shin, H.; Chae, S.; Kim, E.-H. Design of Microgrid Protection Schemes Using PSCAD/EMTDC and ETAP Programs. Energies 2020, 13, 5784. [Google Scholar] [CrossRef]
  79. Sahoo, A.K. Protection of microgrid through coordinated directional over-current relays. In Proceedings of the 2014 IEEE Global Humanitarian Technology Conference—South Asia Satellite, Trivandrum, India, 26–27 September 2014; pp. 129–134. [Google Scholar]
  80. Sharma, A.; Panigrahi, B.K. Phase Fault Protection Scheme for Reliable Operation of Microgrids. IEEE Trans. Ind. Appl. 2017, 54, 2646–2655. [Google Scholar] [CrossRef]
  81. Kadukar, P.R.; Shete, P.S.; Gawande, S.P. Transient analysis of distributed generation ac microgrid using ETAP. In Proceedings of the 2018 International Conference on Current Trends towards Converging Technologies, Coimbatore, India, 1–3 March 2018; pp. 1–8. [Google Scholar]
  82. Thangalakshmi, S. Planning and Coordination of Relays in Distribution System. Indian J. Sci. Technol. 2016, 9, 9. [Google Scholar] [CrossRef]
  83. Saad, S.M.; El-Naily, N.; Mohamed, F.A. A new constraint considering maximum PSM of industrial over-current relays to enhance the performance of the optimization techniques for microgrid protection schemes. Sustain. Cities Soc. 2019, 44, 445–457. [Google Scholar] [CrossRef]
  84. Khatua, S.; Mukherjee, V. Application of integrated microgrid for strengthening the station blackout power supply in nuclear power plant. Prog. Nucl. Energy 2019, 118, 103132. [Google Scholar] [CrossRef]
  85. Ali, Z.M.; Alenezi, F.Q.; Kandil, S.S.; Aleem, S.H.A. Practical considerations for reactive power sharing approaches among multiple-arm passive filters in non-sinusoidal power systems. Int. J. Electr. Power Energy Syst. 2018, 103, 660–675. [Google Scholar] [CrossRef]
  86. Siciliano, B.; Sciavicco, L.; Villani, L.; Oriolo, G. Robotics. Modelling, Planning and Control; Springer: Berlin/Heidelberg, Germany, 2009. [Google Scholar] [CrossRef]
  87. De Rose, L.; Padua, D. Techniques for the translation of MATLAB programs into Fortran 90. ACM Trans. Program. Lang. Syst. 1999, 21, 286–323. [Google Scholar] [CrossRef] [Green Version]
  88. Sumathi, S.; Ashok Kumar, L.; Surekha, P. Solar PV and Wind Energy Conversion Systems. In Green Energy and Technology; Springer International Publishing: Cham, Switzerland, 2015; pp. 1–807. [Google Scholar]
  89. Shaoyu, X.; Xiuli, W.; Chong, Q.; Xifan, W.; Jingli, G. Impacts of different wind speed simulation methods on conditional reliability indices. Int. Trans. Electr. Energy Syst. 2015, 25, 359–373. [Google Scholar] [CrossRef]
  90. Said, S.M.; Hartmann, B.; Aly, M.M.; Mosa, M.; Balog, R.S. Comparison between operating modes of distributed generation on voltage profile and stability of distribution systems. In Proceedings of the 2018 IEEE Texas Power and Energy Conference (TPEC), College Station, TX, USA, 8–9 February 2018; pp. 1–6. [Google Scholar]
  91. Nour, A.M.; Helal, A.A.; El-Saadawi, M.M.; Hatata, A.Y. A control scheme for voltage unbalance mitigation in distribution network with rooftop PV systems based on distributed batteries. Int. J. Electr. Power Energy Syst. 2021, 124, 106375. [Google Scholar] [CrossRef]
  92. Tégani, I.; Aboubou, A.; Ayad, M.; Becherif, M.; Saadi, R.; Kraa, O. Optimal Sizing Design and Energy Management of Stand-alone Photovoltaic/Wind Generator Systems. Energy Procedia 2014, 50, 163–170. [Google Scholar] [CrossRef] [Green Version]
  93. Nowak, S.; Wang, L.; Metcalfe, M.S. Two-level centralized and local voltage control in distribution systems mitigating effects of highly intermittent renewable generation. Int. J. Electr. Power Energy Syst. 2020, 119, 105858. [Google Scholar] [CrossRef]
  94. Sa’Ed, J.A.; Amer, M.; Bodair, A.; Baransi, A.; Favuzza, S.; Zizzo, G. A Simplified Analytical Approach for Optimal Planning of Distributed Generation in Electrical Distribution Networks. Appl. Sci. 2019, 9, 5446. [Google Scholar] [CrossRef] [Green Version]
  95. Cabrera, P.; Lund, H.; Thellufsen, J.Z.; Sorknæs, P. The MATLAB Toolbox for EnergyPLAN: A tool to extend energy planning studies. Sci. Comput. Program. 2020, 191, 102405. [Google Scholar] [CrossRef]
  96. Bhende, C.N.; Kalam, A.; Malla, S.G. Mitigation of Power Quality Problems in Grid-Interactive Distributed Generation System. Int. J. Emerg. Electr. Power Syst. 2016, 17, 165–172. [Google Scholar] [CrossRef]
  97. Yingram, M.; Premrudeepreechacharn, S. Over/Undervoltage and Undervoltage Shift of Hybrid Islanding Detection Method of Distributed Generation. Sci. World J. 2015, 2015, 1–11. [Google Scholar] [CrossRef] [Green Version]
  98. Tom, T.; Scaria, R. Active and reactive power compensation in distribution system based on biogeography based optimization technique. In Proceedings of the 2013 International Conference on Control Communication and Computing (ICCC), Thiruvananthapuram, India, 13–15 December 2013; pp. 216–220. [Google Scholar]
  99. Turchi, C.S.; Heath, G.A. Power Tower Plant Cost and Material Input to Life Cycle Assessment (LCA). Contract Des. 2012, 7, 1–53. [Google Scholar]
  100. Ezeanya, E.K.; Massiha, G.H.; Simon, W.E.; Raush, J.R.; Chambers, T.L. System advisor model (SAM) simulation modelling of a concentrating solar thermal power plant with comparison to actual performance data. Cogent Eng. 2018, 5, 1–26. [Google Scholar] [CrossRef]
  101. De Araujo, J.M.S. WRF wind speed simulation and SAM wind energy estimation: A case study in dili timor leste. IEEE Access 2019, 7, 35382–35393. [Google Scholar] [CrossRef]
  102. Umar, N.; Bora, B.; Banerjee, C.; Panwar, B.S. Comparison of different PV power simulation softwares: Case study on performance analysis of 1 MW grid-connected PV solar power plant. Int. J. Sci. Invent. 2018, 7, 11–24. [Google Scholar]
  103. De Araujo, J.M.S. A Case Study: Performance Comparison of Solar Power Generation between GridLAB-D and SAM in Dili Timor Leste. J. Power Energy Eng. 2020, 8, 1–22. [Google Scholar] [CrossRef]
  104. Liaqat, K.; Anss, M.; Ali, A.; Mengal, A.N. Modeling and Simulation of a 100 MW Concentrated Solar Thermal Power Plant Using Parabolic Trough Collectors in Pakistan. IOP Conf. Series: Mater. Sci. Eng. 2018, 414, 012032. [Google Scholar] [CrossRef]
  105. Vaderobli, A.; Parikh, D.; Diwekar, U. Optimization under Uncertainty to Reduce the Cost of Energy for Parabolic Trough Solar Power Plants for Different Weather Conditions. Energies 2020, 13, 3131. [Google Scholar] [CrossRef]
  106. Boretti, A.; Nayfeh, J.; Al-Kouz, W. Simulation of large PV energy facilities with SAM HCPV and PV detailed models. E3S Web Conf. 2020, 181, 03001. [Google Scholar] [CrossRef]
  107. Surendra, H.H.; Seshachalam, D.; Sudhindra, K.R. Design of standalone solar power plant using system advisor model in Indian Context. Int. J. Recent Technol. Eng. 2020, 8, 3154–3158. [Google Scholar]
  108. Guarino, F.; Cellura, M.; Longo, S.; Gulotta, T.M.; Mistretta, M.; Tumminia, G.; Ferraro, M.; Antonucci, V. Integration of Building Simulation and Life Cycle Assessment: A TRNSYS Application. Energy Procedia 2016, 101, 360–367. [Google Scholar] [CrossRef]
  109. Vorpahl, F.; Schwarze, H.; Fischer, T.; Seidel, M.; Jonkman, J. Offshore wind turbine environment, loads, simulation, and design. Wiley Interdiscip. Rev. Energy Environ. 2013, 2, 548–570. [Google Scholar] [CrossRef]
  110. Shrivastava, R.L.; Kumar, V.; Untawale, S.P. Modeling and simulation of solar water heater: A TRNSYS perspective. Renew. Sustain. Energy Rev. 2017, 67, 126–143. [Google Scholar] [CrossRef]
  111. Long, S.M.; Wood, B.D. A comparison of TRNSYS and WATSUN for the development of a SDHW modeling program. In Proceedings of the SOLAR’93 the 1993 American Solar Energy Society Annual Conference, Washington, DC, USA, 22–28 April 1993; pp. 297–302. [Google Scholar]
  112. Mazzeo, D.; Matera, N.; Cornaro, C.; Oliveti, G.; Romagnoni, P.; De Santoli, L. EnergyPlus, IDA ICE and TRNSYS predictive simulation accuracy for building thermal behaviour evaluation by using an experimental campaign in solar test boxes with and without a PCM module. Energy Build. 2020, 212, 109812. [Google Scholar] [CrossRef]
  113. Braas, H.; Jordan, U.; Best, I.; Orozaliev, J.; Vajen, K. District heating load profiles for domestic hot water preparation with realistic simultaneity using DHWcalc and TRNSYS. Energy 2020, 201, 117552. [Google Scholar] [CrossRef]
  114. Lund, H.; Thellufsen, J.Z.; Østergaard, P.A.; Sorknæs, P.; Skov, I.R.; Mathiesen, B.V. EnergyPLAN - Advanced analysis of smart energy systems. Smart Energy 2021, 1, 100007. [Google Scholar] [CrossRef]
  115. EnergyPLAN. Available online: www.energyplan.eu (accessed on 29 September 2021).
  116. Vergara-Dietrich, J.D.; Morato, M.M.; Mendes, P.; Cani, A.A.; Normey-Rico, J.E.; Bordons, C. Advanced chance-constrained predictive control for the efficient energy management of renewable power systems. J. Process. Control. 2019, 74, 120–132. [Google Scholar] [CrossRef]
  117. Alavi, S.A.; Ahmadian, A.; Golkar, M.A. Optimal probabilistic energy management in a typical micro-grid based-on robust optimization and point estimate method. Energy Convers. Manag. 2015, 95, 314–325. [Google Scholar] [CrossRef]
  118. Mehrjerdi, H.; Rakhshani, E. Correlation of multiple time-scale and uncertainty modelling for renewable energy-load profiles in wind powered system. J. Clean. Prod. 2019, 236, 117644. [Google Scholar] [CrossRef]
  119. Talaat, M.; Farahat, M.; Elkholy, M. Renewable power integration: Experimental and simulation study to investigate the ability of integrating wave, solar and wind energies. Energy 2019, 170, 668–682. [Google Scholar] [CrossRef]
  120. Olabode, O.; Ajewole, T.; Okakwu, I.; Alayande, A.; Akinyele, D. Hybrid power systems for off-grid locations: A comprehensive review of design technologies, applications and future trends. Sci. Afr. 2021, 13, e00884. [Google Scholar]
  121. Okakwu, I.K.; Olabode, O.E.; Alayande, A.S.; Somefun, T.E.; Ajewole, T.O. Techno-economic Assessment of Wind Turbines in Nigeria. Int. J. Energy Econ. Policy 2021, 11, 240–246. [Google Scholar] [CrossRef]
  122. Ajewole, T.O.; Olabode, O.E.; Alawode, K.O.; Lawal, M.O. Small-scale electricity generation through thermal harvesting in rooftop photovoltaic picogrid using passively cooled heat conversion devices. Environ. Qual. Manag. 2020, 29, 95–102. [Google Scholar] [CrossRef]
  123. Ajewole, T.O.; Momoh, O.D.; Ayedun, O.D.; Omoigui, M.O. Optimal component configuration and capacity sizing of a mini integrated power supply system. Environ. Qual. Manag. 2019, 28, 57–62. [Google Scholar] [CrossRef]
  124. Ajewole, T.O.; Olabode, O.; Babalola, O.S.; Omoigui, M.O. Use of experimental test systems in the application of electric microgrid technology across the sub-Saharan Africa: A review. Sci. Afr. 2020, 8, e00435. [Google Scholar] [CrossRef]
  125. Baum, Z.; Palatnik, R.R.; Ayalon, O.; Elmakis, D.; Frant, S. Harnessing households to mitigate renewables intermittency in the smart grid. Renew. Energy 2019, 132, 1216–1229. [Google Scholar] [CrossRef]
  126. Fiedler, T. Simulation of a power system with large renewable penetration. Renew. Energy 2019, 130, 319–328. [Google Scholar] [CrossRef]
  127. Draycott, S.; Sellar, B.; Davey, T.; Noble, D.; Venugopal, V.; Ingram, D. Capture and simulation of the ocean environment for offshore renewable energy. Renew. Sustain. Energy Rev. 2019, 104, 15–29. [Google Scholar] [CrossRef]
  128. Zahraee, S.M.; Assadi, M.K.; Saidur, R. Application of Artificial Intelligence Methods for Hybrid Energy System Optimization. Renew. Sustain. Energy Rev. 2016, 66, 617–630. [Google Scholar] [CrossRef]
  129. Russell, S.J.; Norvig, P. Artificial Intelligence: A Modern Approach, 2nd ed.; Pearson Education: Upper Saddle River, NJ, USA, 2003. [Google Scholar]
  130. Kosovic, B.; Haupt, S.E.; Adriaansen, D.; Alessandrini, S.; Wiener, G.; Monache, L.D.; Liu, Y.; Linden, S.; Jensen, T.; Cheng, W.; et al. A Comprehensive Wind Power Forecasting System Integrating Artificial Intelligence and Numerical Weather Prediction. Energies 2020, 13, 1372. [Google Scholar] [CrossRef] [Green Version]
  131. HOMER Simulation Software. Available online: www.homerenergy.com (accessed on 15 August 2021).
  132. Elsaraf, H.; Jamil, M.; Pandey, B. Techno-Economic Design of a Combined Heat and Power Microgrid for a Remote Community in Newfoundland Canada. IEEE Access 2021, 9, 91548–91563. [Google Scholar] [CrossRef]
  133. Olatomiwa, L.; Blanchard, R.; Mekhilef, S.; Akinyele, D. Hybrid renewable energy supply for rural healthcare facilities: An approach to quality healthcare delivery. Sustain. Energy Technol. Assess. 2018, 30, 121–138. [Google Scholar] [CrossRef] [Green Version]
  134. Akinyele, D. Analysis of photovoltaic mini-grid systems for remote locations: A techno-economic approach. Int. J. Energy Res. 2018, 42, 1363–1380. [Google Scholar] [CrossRef]
  135. Akinyele, D.; Belikov, J.; Levron, Y. Battery Storage Technologies for Electrical Applications: Impact in Stand-Alone Photovoltaic Systems. Energies 2017, 10, 1760. [Google Scholar] [CrossRef] [Green Version]
  136. Pradan, A.K.; Kar, S.K.; Mohanty, M.K. Modeling, simulation and economic analysis of offgrid hybrid renewable power system for an unelectrified village in Odisha. In Proceedings of the 2015 International Conference on Electrical, Electronics, Signals, Communication and Optimization (EESCO), Visakhapatnam, India, 24–25 January 2015; pp. 1–6. [Google Scholar]
  137. Posadillo, R.; Luque, R.L. A sizing method for stand-alone PV installations with variable demand. Renew. Energy 2008, 33, 1049–1055. [Google Scholar] [CrossRef]
  138. Almutairi, K.; Dehshiri, S.S.H.; Dehshiri, S.J.H.; Mostafaeipour, A.; Issakhov, A.; Techato, K. Use of a hybrid wind-solar-diesel-battery energy system to power buildings in remote areas: A case study. Sustainability 2021, 13, 8764. [Google Scholar] [CrossRef]
  139. International Electrotechnical Commission. Recommendations for Small Renewable Energy and Hybrid Systems for Rural Electrification—Part 4: System Selection and Design. IEC/TS 62257–4. 2005. [Google Scholar]
  140. Guney, I.; Onat, N. Cost calculation algorithm for photovoltaic systems. In Paths to Sustainable Energy; INTECH: Hong Kong, China, 2010; pp. 211–236. [Google Scholar]
  141. Ishraque, F.; Shezan, S.A.; Rashid, M.M.; Bhadra, A.B.; Hossain, A.; Chakrabortty, R.K.; Ryan, M.J.; Fahim, S.R.; Sarker, S.K.; Das, S.K. Techno-Economic and Power System Optimization of a Renewable Rich Islanded Microgrid considering different Dispatch Strategies. IEEE Access 2021, 9, 77325–77340. [Google Scholar] [CrossRef]
  142. Liu, J.; Wang, M.; Peng, J.; Chen, X.; Cao, S.; Yang, H. Techno-economic design optimization of hybrid renewable energy applications for high-rise residential buildings. Energy Convers. Manag. 2020, 213, 112868. [Google Scholar] [CrossRef]
  143. Ali, S.; Jang, C.-M. Optimum Design of Hybrid Renewable Energy System for Sustainable Energy Supply to a Remote Island. Sustainability 2020, 12, 1280. [Google Scholar] [CrossRef] [Green Version]
  144. Duboc, L.; Penzenstadler, B.; Porras, J.; Kocak, S.A.; Betz, S.; Chitchyan, R.; Leifler, O.; Seyff, N.; Venters, C.C. Requirements engineering for sustainability: An awareness framework for designing software systems for a better tomorrow. Requir. Eng. 2020, 25, 469–492. [Google Scholar] [CrossRef]
  145. Louie, H. Off-Grid Electrical Systems in Developing Countries, 1st ed.; Springer International Publishing: Cham, Switzerland, 2018. [Google Scholar]
  146. Akinyele, D.O.; Shomuyiwa, D.; Petinrin, J.O.; Alade, K.T. Electrical and environmental performance evaluation of a stand-alone solar power system. In Proceedings of the International Conference of Sciences, Engineering and Environmental Technology (ICONSEET 2016), Ede, Nigeria, 18–22 August 2016. [Google Scholar]
  147. Mancebo, J.; Calero, C.; Garcia, F.; Moraga, M.A.; de Guzman, I.G.-R. FEETINGS: Framework for Energy Efficiency Testing to Improve Environmental Goal of the Software. Sustain. Comput. Informatics Syst. 2021, 30, 100558. [Google Scholar] [CrossRef]
  148. Mishra, A.; Otaiwi, Z. DevOps and software quality: A systematic mapping. Comput. Sci. Rev. 2020, 38, 100308. [Google Scholar] [CrossRef]
Figure 1. Proposed simulation framework.
Sustainability 13 11299 g001
Figure 2. Simulation and analysis strategy for the case study.
Sustainability 13 11299 g002
Figure 3. Users’ daily load profile and the assumed load growth.
Sustainability 13 11299 g003
Table 1. Review of existing studies on design, simulation and analysis of microgrid energy systems.
Study PresentedPlanning
Dimension
Software/Technique
Technical and economic design, modelling and performance analysis of microgrid systems based on renewable and non-renewable resources and storage TE MILP [10]; HOMER/ANN-BP and LM [11]; optimal and sensitivity analysis [13]; HOMER/comparative analysis [14,15]; MANGO [16]; HOMER/integrated analysis [18]; modified non-dominated sorting GA [19]; MATLAB/MILP [20]; mixed integer MOO [22]; GA [23]; HOMER [24]; Monte Carlo simulation [25]; HOMER/PSO [26]; HOMER/TOPSIS [27]; HOMER/MATLAB [28]; GA [32]; HOMER/MATLAB [33]; HOMER/MATLAB/DSM [34]; HOHER RETScreen [35]; CPLEX [37], MATLAB/MPM-GAMS [40]; MOO [42]
Technical, economic and environmental design, simulation and performance analysis of microgrid system with storage TEEMILP [10]; Eco-SIM [31]; RETScreen [36]; AHP-MCDM [38]
Social, technical and economic design, modelling and analysis of microgrid systemsSTE GA, PSO and TLBO [12]; DIgSILENT PowerFactory, HOMER/integrated analysis [21]
Technical design, modelling and performance analysis of microgrid systemsTGA and Python optimal control problem [29]; MOO and MCDM [30]; fuzzy logic control strategy [39]; MATLAB Simulink/agent-based model [41]; MATLAB and HOMER [43], IoT-based approach [44]
Table 2. Some of the existing energy simulation tools.
ToolDescriptionFeatures/Application
HOMERHybrid Optimization Model for Electric Renewables [45,46,47,48,49,50,51,52,53,54,55,56]A commercial tool for district modeling of microgrids, advanced optimization modeling and simulation of solar PV, wind, fuel cells, and biomass energy systems with battery storage, including the performance analysis [46,47], cost and environmental evaluation [48,49,50]. It helps in determining the optimal component sizes. Advanced analysis such as harmonics, voltage and frequency analyses, dynamic simulation, etc., cannot be performed with HOMER.
PVSystThe name of the software is derived from PV and system [57,58,59,60,61,62] For pre-sizing inverter and solar PV module in the design of solar photovoltaic microgrids. It can also perform different analyses such technical, economic and carbon emission balance [58,59,60]. It is limited by the fact that it supports only a single-source renewable energy system, i.e., PV but can be integrated with other tools to achieve a desired goal [46]. The tool cannot perform advanced analysis such as harmonics, voltage and frequency analyses, dynamic simulation, etc.
DIgSILENT Digital Simulation and Electrical Network Calculation Program [63,64,65,66,67]A versatile tool used across the generation, transmission and distribution systems, including microgrids. It can perform technical and cost analyses. The DIgSILENT Programming Language (DPL) scrips [63] are embedded in the tool that enables it to perform different functions and rigorous simulations such balanced and un-balanced load flow, dynamic simulations, optimal and voltage stability issues, etc.
PSCADPower System Computer-Aided Design [68,69,70,71]A widely used software equipped with a flexible graphical user interface to the Electromagnetic Transients (EMTDC) simulation engine. It is sophisticated and can interface with Simulink similar to the Power Factory; it is employed for modelling AC/DC transmission [70,71], wind simulation [72]. It is also employed for advanced power systems analyses such as reactive control, integration of renewable energy and power flow [73,74,75,76,77].
ETAPElectrical Transient Analyzer Program [78,79,80,81] For designing protection systems in electrical grid systems, load flow and transient stability studies [82,83,84], including total harmonic distortion evaluation [85]. The tool can be used in simulating relay coordination in an electrical system with microgrids.
MATLABMatrix Laboratory [86,87,88,89,90,91,92,93,94,95,96,97,98]It performs numerical computations in such a manner that ensures flexibility of creating models and then using different blocks to represent the model; the tool can interoperate with Simulink tool box [87,88]. It is a sophisticated software that can model and simulate different aspects of electrical systems, including the technical, economic and control aspects of microgrids [89,90,91], optimization [92], voltage analysis, etc. [93,94,95].
SAM System Advisor Model [99]For residential and district modeling of energy systems [99]. Similar to the HOMER tool, SAM can model microgrids based on PV, wind fuel cells and biomass systems [100,101,102,103], including the concentrated solar thermal system [104]. The tool also supports weather-dependent data for simulating microgrid systems [105,106,107]. It is lacking in terms of optimization processes [46].
TRNSYSTransient System Simulation [108,109,110,111,112,113].For designing and studying the behavior of electrical power systems [49]. It can also be used for modeling RE, batteries and thermal storage systems and the performance of heating, ventilating and air conditioning (HVAC) system [109]. One of the challenges of the tool is that it is tedious and time-consuming to design and set up individual components [108,110,111].
EnergyPLANAdvanced energy system computer model [114]For designing and simulating the operation of energy systems on an hourly basis [115]. It has a user-friendly interface and can present a techno-economic performance evaluation of microgrid systems.
Table 3. The input parameters.
Sustainability DimensionParameters
SocialUsers’ status: this provides information about the proposed users and their financial capacity. This is represented by a1.
Users’ appliances: the kinds of appliances usually provide information about the electrical load requirements of the intended users. This is represented by a2.
Users’ preference: this indicates the choice of the energy system by the users, e.g., diesel/petrol, solar, wind, biomass, depending on the availability in the community. This is represented by a3.
Users’ availability: this provides information about the number of hours the proposed users are available at home to utilize the energy. For instance, some users can be available for 6 hrs, 9 hrs, 12 hrs, etc. This is represented by a4.
Willingness to pay for the energy supply is also key information, which is represented by a5.
TechnicalUsers’ energy demand: this describes the quantity of energy be utilized by the users on a daily basis. This is needed to ascertain the energy consumption over a period of 24 h, i.e., the users’ load demand profile. This is represented by b1.
Users’ energy demand growth: this describes the increase in the users’ energy consumption over time. This may be assessed in terms of percentage demand increase per year, represented by b2.
Energy system configuration: this describes whether the system model is grid-connected or off-grid, and it is represented by b3.
Battery state of charge (SoC) and depth of discharge (DoD): these are presented in percentage to describe the minimum and maximum state of charge, and the depth of discharge of the battery bank. These are represented by b4 and b5.
Efficiency of components: this describes the efficiency of the energy generator, battery, and inverter. These are represented by b6, b7 and b8.
Project lifespan: this is the lifespan of the energy system and is represented by b9.
Economic Initial capital cost of the participating components: this defines the initial component cost. This is represented by c1.
Discount rate: this is represented by c2
Inflation rate: this is represented by c3
Project lifetime: this is represented by c4
Operation cost: this is represented by c5
Environmental Types of fuel used by the system: this ascertains whether the fuels used by the system is fossil fuel or renewable energy-based. It is represented by d1.
Emission rate of the energy system: this describes the amount of emissions in kg released by the energy system per kWh of energy produced. These emissions carbon dioxide, carbon monoxide, unburned hydrocarbon, particulate matter, sulfur dioxide and nitrogen oxides are represented by d2, d3, d4, d5, d6 and d7.
Noise level of the energy system: this parameter describes the noise level of the energy system in decibel (dB). It is represented by d8.
Location’s energy resource: this describes the energy resource of the site for a whole year. The energy resources could be solar, wind, hydro, biomass, diesel/petrol, etc. These values from January to December are represented by d9 to d20.
Location’s ambient temperature: this describes the ambient temperature of the location for a year. These values are represented by d21 to d32.
Table 4. The output parameters based on STEE perspective.
Sustainability DimensionParameters
SocialIt is necessary to ascertain whether or not the energy system suits the users’ financial status. This aspect of the result is represented by a 1 , .
Users’ electrical load being powered by the energy system. This is represented by a 2 , .
It is a crucial aspect of the result to indicate whether or not the users’ energy system preference has been met. This is represented by a 3 , .
An aspect of the result is also meant to answer the question of whether or not the energy supply meets the users’ availability in terms of how many hours of users’ demand met. This is represented by a 4 , .
Information about the number of people within the community or location who are willing to pay for the energy supply is represented by a 5 , .
TechnicalThe users’ energy demand over a 24-h being satisfied by the energy system is represented by b 1 , . It is necessary to showcase this to ascertain whether or not the energy generation meets the demand.
An aspect of the result needs to reveal the amount of users’ energy demand growth catered for in terms of percentage demand increase per year. This is represented by b 2 , .
The result obtained is also determined by whether the system is off-grid or grid-connected. This is represented by b 3 , .
The value of availability and loss of load probability are represented by b 4 , and b 5 , .
Results of the battery SoC and DoD over the daily profile are represented by b 6 , and b 7 , .
The capacity of the energy system in (kW) is represented by b 8 , .
The annual energy generation of the energy system, measured in kWh/yr, is represented by b 9 , .
Renewable energy contribution versus diesel fuel contribution is represented by b 10 , and b 11 , .
Economic Total initial capital cost of the energy system is represented by c 1 , .
Total cost of replacement of components is represented by c 2 , .
Total operation and maintenance (O and M) is represented by c 3 , .
Net present cost (NPC) is represented by c 4 , .
Cost of Energy (CoE) is represented by c 5 , .
EnvironmentalThe emission rate is measured in kg/kWh. The carbon dioxide, carbon monoxide, unburned hydrocarbon, particulate matter, sulfur dioxide and the nitrogen oxides emissions of the energy system (kg/yr) are represented by d 1 , , d 2 , , d 3 , , d 4 , , d 5 , and d 6 , .
Noise level of the energy system is represented by d 7 , , especially by rotating systems such as wind and diesel/petrol generators.
The average monthly value of the location’s energy resource is represented by d 8 ,
The average monthly location’s ambient temperature is represented by d 9 ,
Table 5. Load requirement of a single house.
Appliance (a2)Rating (W)UnitTotal Load (kW)
Indoor lighting1560.09
Outdoor lighting15100.15
TV15010.15
DVD2510.025
Fridge15010.15
Fan6010.06
Clipper1010.01
Total0.635
Table 6. Location’s solar and ambient temperature data [146].
MonthSolar Irradiation (kWh/m2/hr) Ambient   Temperature   ( ° C )
January5.2828.3
February5.4928.5
March5.4628
April5.2128
May4.7627.9
June4.0426.9
July3.9525.9
August3.9825.6
September4.0926.1
October4.5526.6
November 4.9527.3
December5.1728
Table 7. Initial cost of system components.
ComponentUnitCost/Unit (USD)Total Cost (USD)
PV module per W120,0000.5487865,853.66
Battery cell48416.6720,000.16
Inverter114,048.7814,048.78
Installation4250010,000
Gen113609.76
113,512.36
Table 8. Input and output parameters for the energy system.
Sustainability DimensionInput ParametersOutput Parameters
Sociala1: Low and medium income earners a 1 , : Users have different income and financial status and capability such as low to medium earners between less than USD 100 to USD 1000. For instance, minimum wage is NGN 30,000 (USD 73.2) and some earners exist with about USD 600 per month.
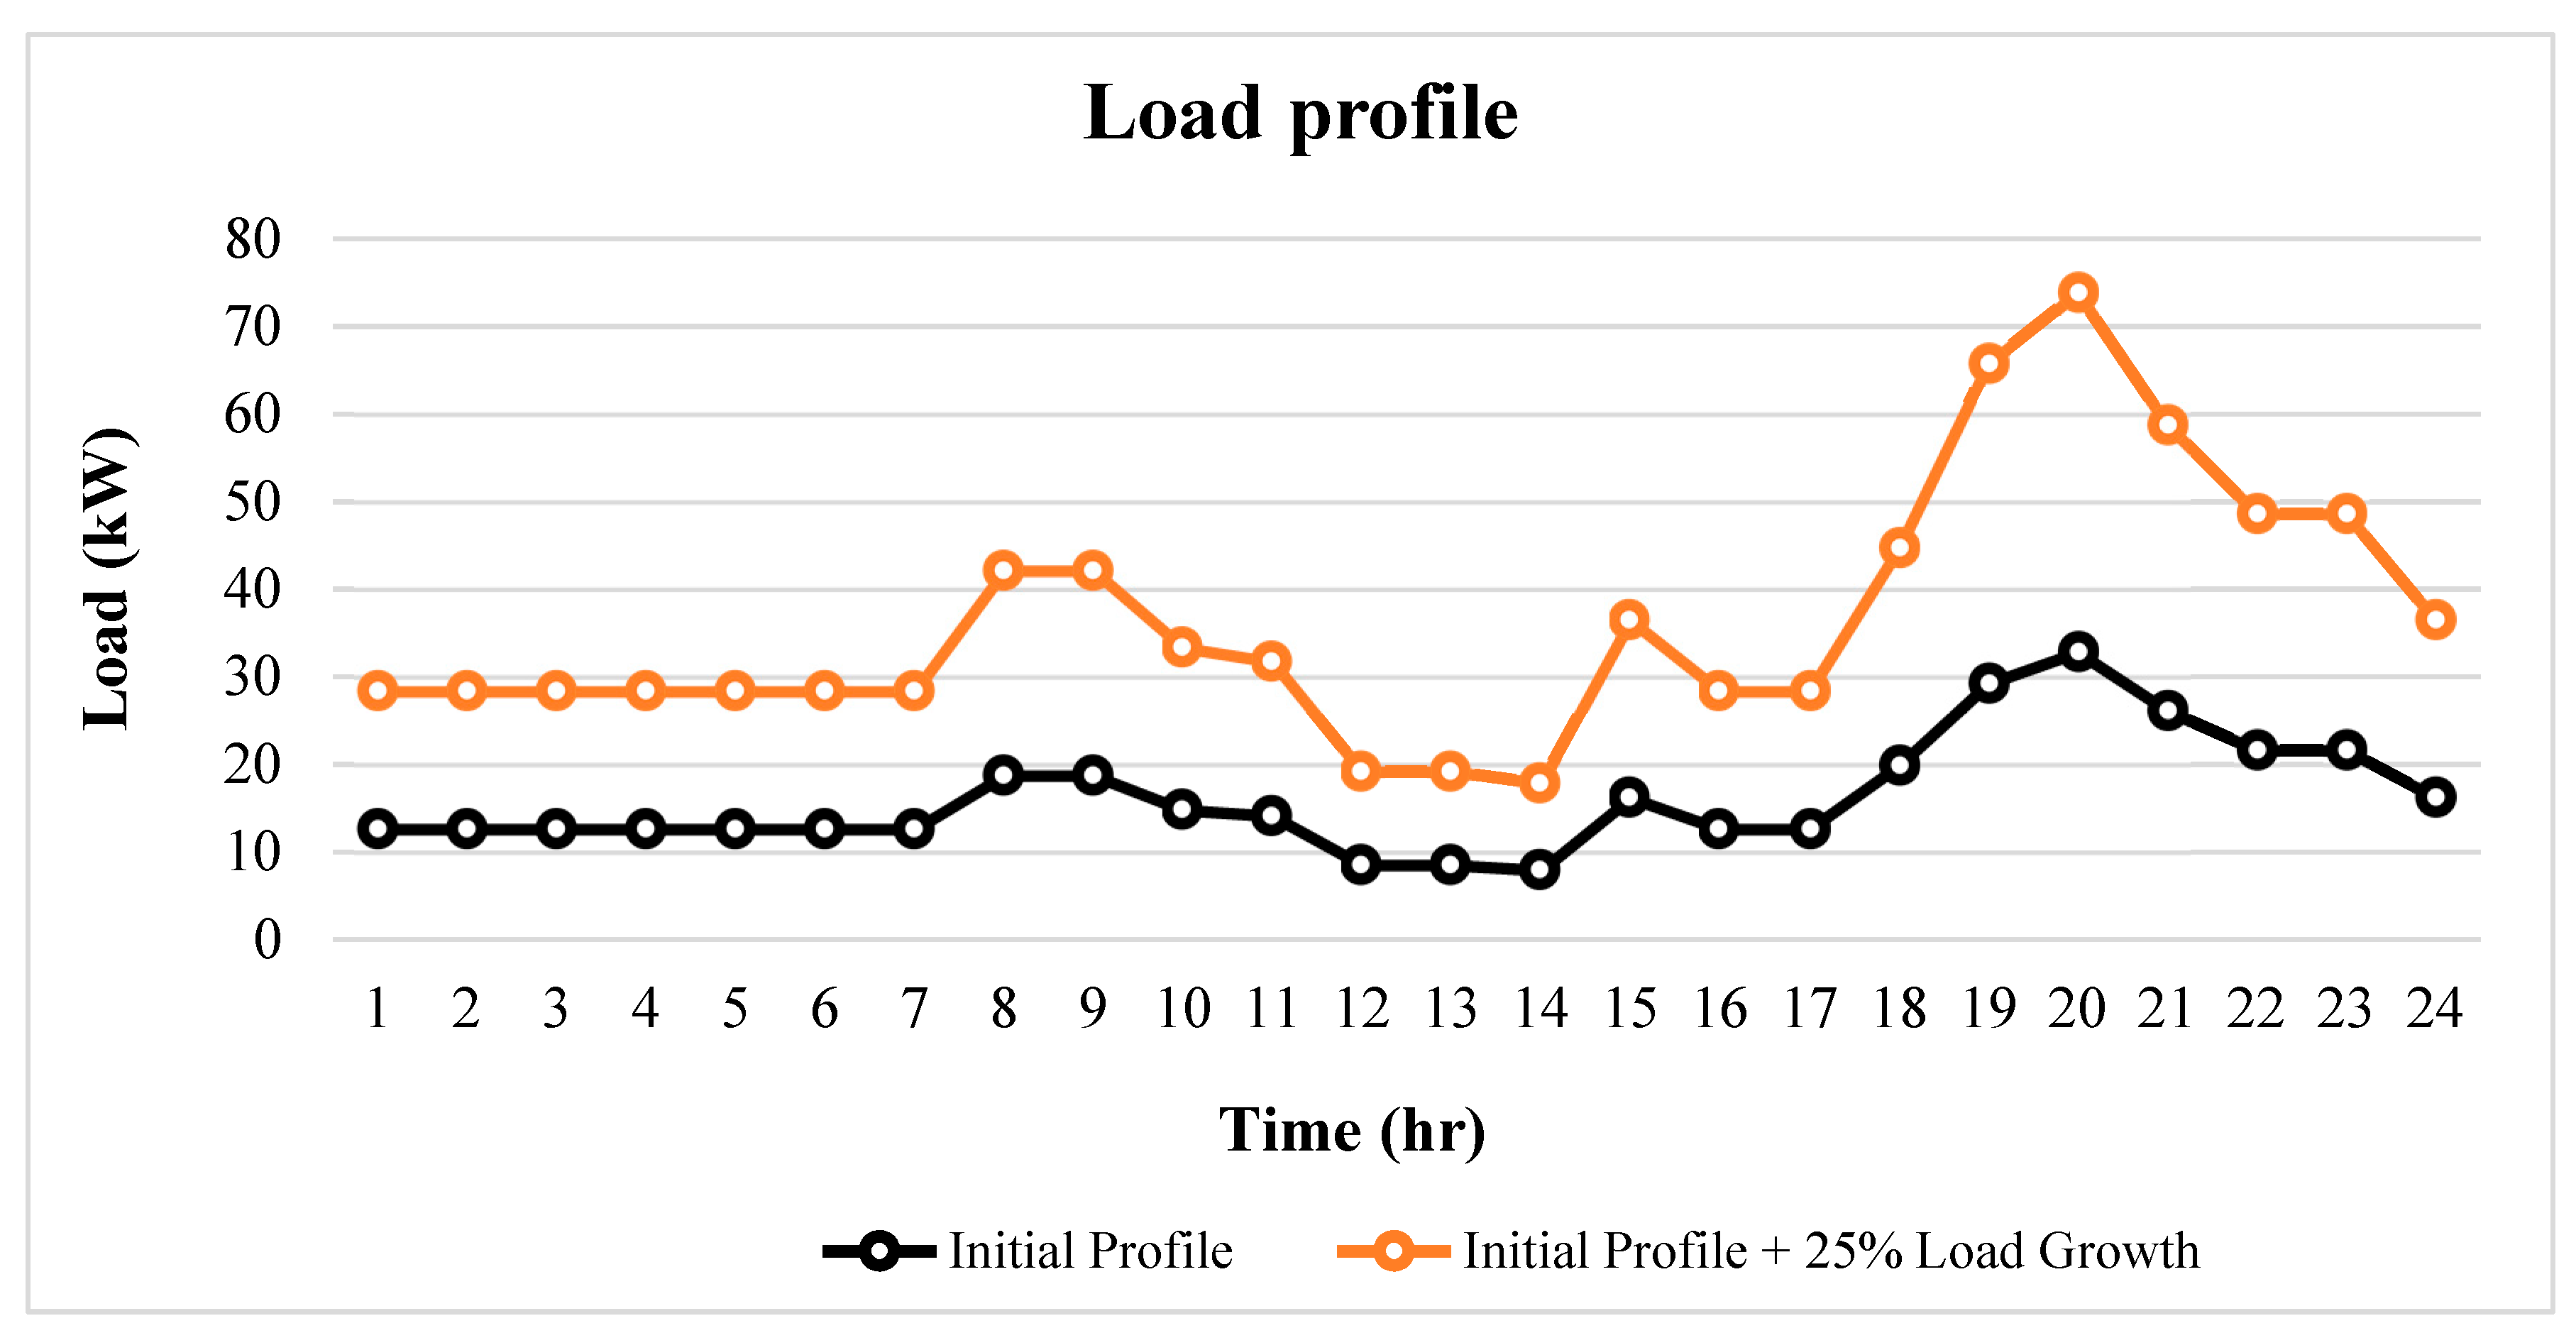
a2: Appliances are as shown in Figure 3 0.635 kW load per house; 38.1 kW load for 60 houses. a 2 , : Users’ demand requirement is 141,737 kWh/yr for the 60 houses, with peak load of 32.82 kW.
a3: Clean and quiet energy solution such as solar PV electricity a 3 , : Users’ preference is met with a technical suggestion of solar and diesel hybrid system
a4: Users with different availability such as 12, 16, 18 and 24 h/d. a 4 , : the design guarantees a 24-h energy supply
a5: Users appreciate and willing to pay for reliable energy supply. a 5 , : cost of energy supply is expected to justify the affordability given the users’ financial status
Technical b1: 6.472 kWh/d per house; 388.32 kWh/d for 60 houses b 1 , : Users’ demand of 141,737 kWh/yr is met by the solar/diesel energy design.
b2: 25% load growth is assumed b 2 , : 25% load growth is 35,434.25 kWh/yr. Energy system will cater for a total users’ demand of 177,171.25 kWh/yr.
b3: Off-grid configuration b 3 , : Energy system is configured as off-grid to serve alternative electricity system to address the users’ energy-poverty situation.
b4: Minimum SoC = 30%;
b5: Maximum DoD = 70%
b 4 , : LOLP is 0.
b 5 , : Availability is 1.
b6: PV module efficiency = 18%;
b7: Battery cell efficiency = 86%;
b8: Inverter efficiency = 90%
b 6 , : SoC > 30% level over the year
b 7 , : DoD < 70% level over the year
b 8 , : Battery size is 6719 Ah at 96 V
b 9 , : Inverter size is about 70 kVA.
b 10 , : Solar PV is 120 kW and diesel gen is 37 kW. The capacity that caters for the load growth is 120 kW PV and 46 kW.
b 11 , : The energy system generates 239,702 kWh/yr.
b 12 , : Solar contribution is 62.13%
b 13 , : Diesel contribution is 37.87%
Economic c 1 : Initial cost of component as shown in Table 7. c 1 , : the total initial capital cost of the system is USD 113,512.36
c 2 : 6%
c 3 : 5%
c 2 , : the total replacement cost of the system is USD 61,446.
c 4 : 25 years c 3 , : the total operating and maintenance cost of the system is USD 393,863.
c 4 , : the life cycle cost of the system is USD 962,685.
c 5 , : the cost of energy is USD 0.314/kWh.
Environmental d 1 : solar and diesel resources d 1 , : 78,253 kg/yr
d 2 : 0.3265000 kg/kWh d 2 , : 493 kg/yr
d 3 : 0.0021000 kg/kWh d 3 , : 21.5 kg/yr
d 4 : 0.0000897 kg/kWh d 4 , : 2.99 kg/yr
d 5 : 0.0000012 kg/kWh d 5 , : 192 kg/yr
d 6 : 0.0008010 kg/kWh d 6 , : 463 kg/yr
d 7 : 0.0019316 kg/kWh d 7 , : Noise level of about 50 kVA diesel generator is much lower than the smaller generator because of a sound-proof design.
d 8 : Less than 90 dB for low-rated petrol gen such as 2.5 kW Elepaq Gen. d 8 , : Average solar irradiation is 4.74 kWh/m2/d
d 9 to d 20 : shown in Table 4 d 9 , : Average ambient temperature is 27.26 ° C .
d 21 to d 32 : shown in Table 4.
Policy e1: Subsidy/incentive
e2: Transition to smart and energy-efficient appliances
e3: Energy tariff and revenue generation
e4: Usage credit and collaboration
Publisher’s Note: MDPI stays neutral with regard to jurisdictional claims in published maps and institutional affiliations.

