Article

Hydrogeochemical Characteristics of Uranium and Radon in Groundwater from the Goesan Area of the Ogcheon Metamorphic Belt (OMB), Korea

1
Groundwater Research Center, Korea Institute of Geoscience and Mineral Resources, Daejeon 34132, Korea
2
Soil and Groundwater Research Division, National Institute of Environmental Research, Incheon 22689, Korea
3
Geoscience Data Center, Korea Institute of Geoscience and Mineral Resources, Daejeon 34132, Korea
4
Department of Earth and Environmental Sciences, Andong National University, Andong 36729, Korea
*
Author to whom correspondence should be addressed.
Sustainability 2021, 13(20), 11261; https://doi.org/10.3390/su132011261
Submission received: 8 September 2021 / Revised: 4 October 2021 / Accepted: 5 October 2021 / Published: 13 October 2021
(This article belongs to the Section Hazards and Sustainability)

Abstract

:
Uranium and radon concentrations in groundwater from the Goesan area of the Ogcheon Metamorphic Belt (OMB), central Korea, whose bedrock is known to contain the highest uranium levels in Korea, were analyzed from 200 wells. We also measured the uranium concentrations in the bedrock near the investigated wells to infer a relationship between the bedrock geology and the groundwater. The five geologic bedrock units in the Goesan area consist of Cretaceous granite (Kgr), Jurassic granite (Jgr) and three types of metasedimentary rocks (og1, og2, and og3). The percentages of the groundwater samples over 30 μg/L (maximum contaminant level, MCL of US EPA) were 2.0% of the 200 groundwater samples; 12% of Kgr and 1.8% of Jgr exceeded the MCL, respectively. Overall, 16.5% of the 200 groundwater samples exceeded 148 Bq/L (alternative maximum contaminant level, AMCL of US EPA); 60.0% of Kgr and 25.0% of Jgr exceeded the AMCL, but only 0% of og1, 7.9% of og2, and 2.6% of og3 exceeded the value, respectively. No direct correlation was found between uranium concentration and radon concentration in water samples. Radon has a slightly linear correlation with Na (0.31), Mg (−0.30), and F (0.36). However, uranium behavior in groundwater was independent of other components. Based on thermodynamic calculation, uranium chemical speciation was dominated by carbonate complexes, namely the Ca2UO2(CO3)3(aq) and CaUO2(CO3)32− species. Although uraniferous mineral phases designated as saturation indices were greatly undersaturated, uranium hydroxides such as schoepite, UO2(OH)2 and U(OH)3 became possible phases. Uranium-containing bedrock in OMB did not significantly affect radioactive levels in the groundwater, possibly due to adsorption effects related to organic matter and geochemical reduction. Nevertheless, oxidation prevention of uranium-containing bedrock needs to be systematically managed for monitoring the possible migration of uranium into groundwater.

1. Introduction

Among the naturally occurring radioactive materials in groundwater, uranium and radon are of most concern to human health. As uranium has a long half-life, its chemical toxicity as a heavy element is of greater concern than its radioactivity. The long-term intake of groundwater containing higher levels of uranium may result in kidney toxicity [1]. Radon is a colorless, odorless inert gas resulting from the radioactive decay of radium. The long-term consumption of radon-rich water has been linked to a possible increase in the risk of stomach and lung cancer [2]. Because of the health risks related to uranium and radon in groundwater, in many countries, studies have been conducted on their concentrations, and limits on their concentrations have been introduced or proposed based on the results of these studies.
A systematic investigation of uranium and radon groundwater concentrations in Korea began in 1999, when it was reported that uranium concentrations in some groundwater samples in Daejeon, located in central Korea, exceeded 30 μg/L, the maximum contaminant level (MCL) set out by the United States Environmental Protection Agency (US EPA). Since then, a nationwide survey of groundwater uranium and radon concentrations has been ongoing over 5500 wells in Korea [3,4,5,6,7], with detailed surveys focusing on cities and counties with high proportions of granite distribution [8,9,10]. Many studies have shown that groundwater uranium and radon levels are closely related to bedrock geology, and that their concentrations are highest in granite and granitic gneiss [11,12,13,14,15,16,17,18].
The Ogcheon Metamorphic Belt (OMB), located in the middle part of Korea, is composed of metasedimentary rocks such as black slate and low-grade metamorphic rocks. It has long been known that it contains the highest uranium concentrations in the country [19]. Therefore, black slate in the OMB has attracted attention as the most promising uranium ore in Korea. In greater detail, the average U contents in the 507 rock samples collected from the OMB area were relatively high: 35.8 mg/kg in coaly slate, 5.1 mg/kg in slate, 3.1 mg/kg in phyllite, 2.1 mg/kg in limestone, 3.9 mg/kg in metasedimentary rocks, and 3.7 mg/kg in granite [20]. Meanwhile, black slate contains an average of 245–288 U ppm [19,21]. Carbonaceous black slates in the OMB developed as thin beds that are rich in rare elements such as Ba, V, and Mo, together with U [19,22,23]. Black slates and interbedded U-bearing coaly slates in Deokpyeongri of the Goesan area, considered the most representative uranium mineralized district of the OMB, seem to have occurred in the sedimentary basin enriched in organic materials under oxygen-poor environments as well [24].
Although uranium-bearing minerals occur in various rocks, including the OMB and granitic rocks in Korea, there has still been considerable controversy as to how their presence plays an important role in increasing the uranium and radon concentrations in groundwater [25,26,27,28,29]. Interestingly, groundwater in the OMB areas showed quite low U concentrations, mostly <10 μg/L [30].
Hence, there is a growing need to establish the concentration relationship of radionuclides between rocks and groundwater. The purpose of the present study is to elucidate the uranium and radon concentrations in groundwater in the Goesan area of central Korea, whose bedrocks consist of granite and metasedimentary rocks with potentially uraniferous components. In this study, we investigated uranium and radon concentrations in groundwater samples and interpreted their relationships based on geological units.

2. Materials and Methods

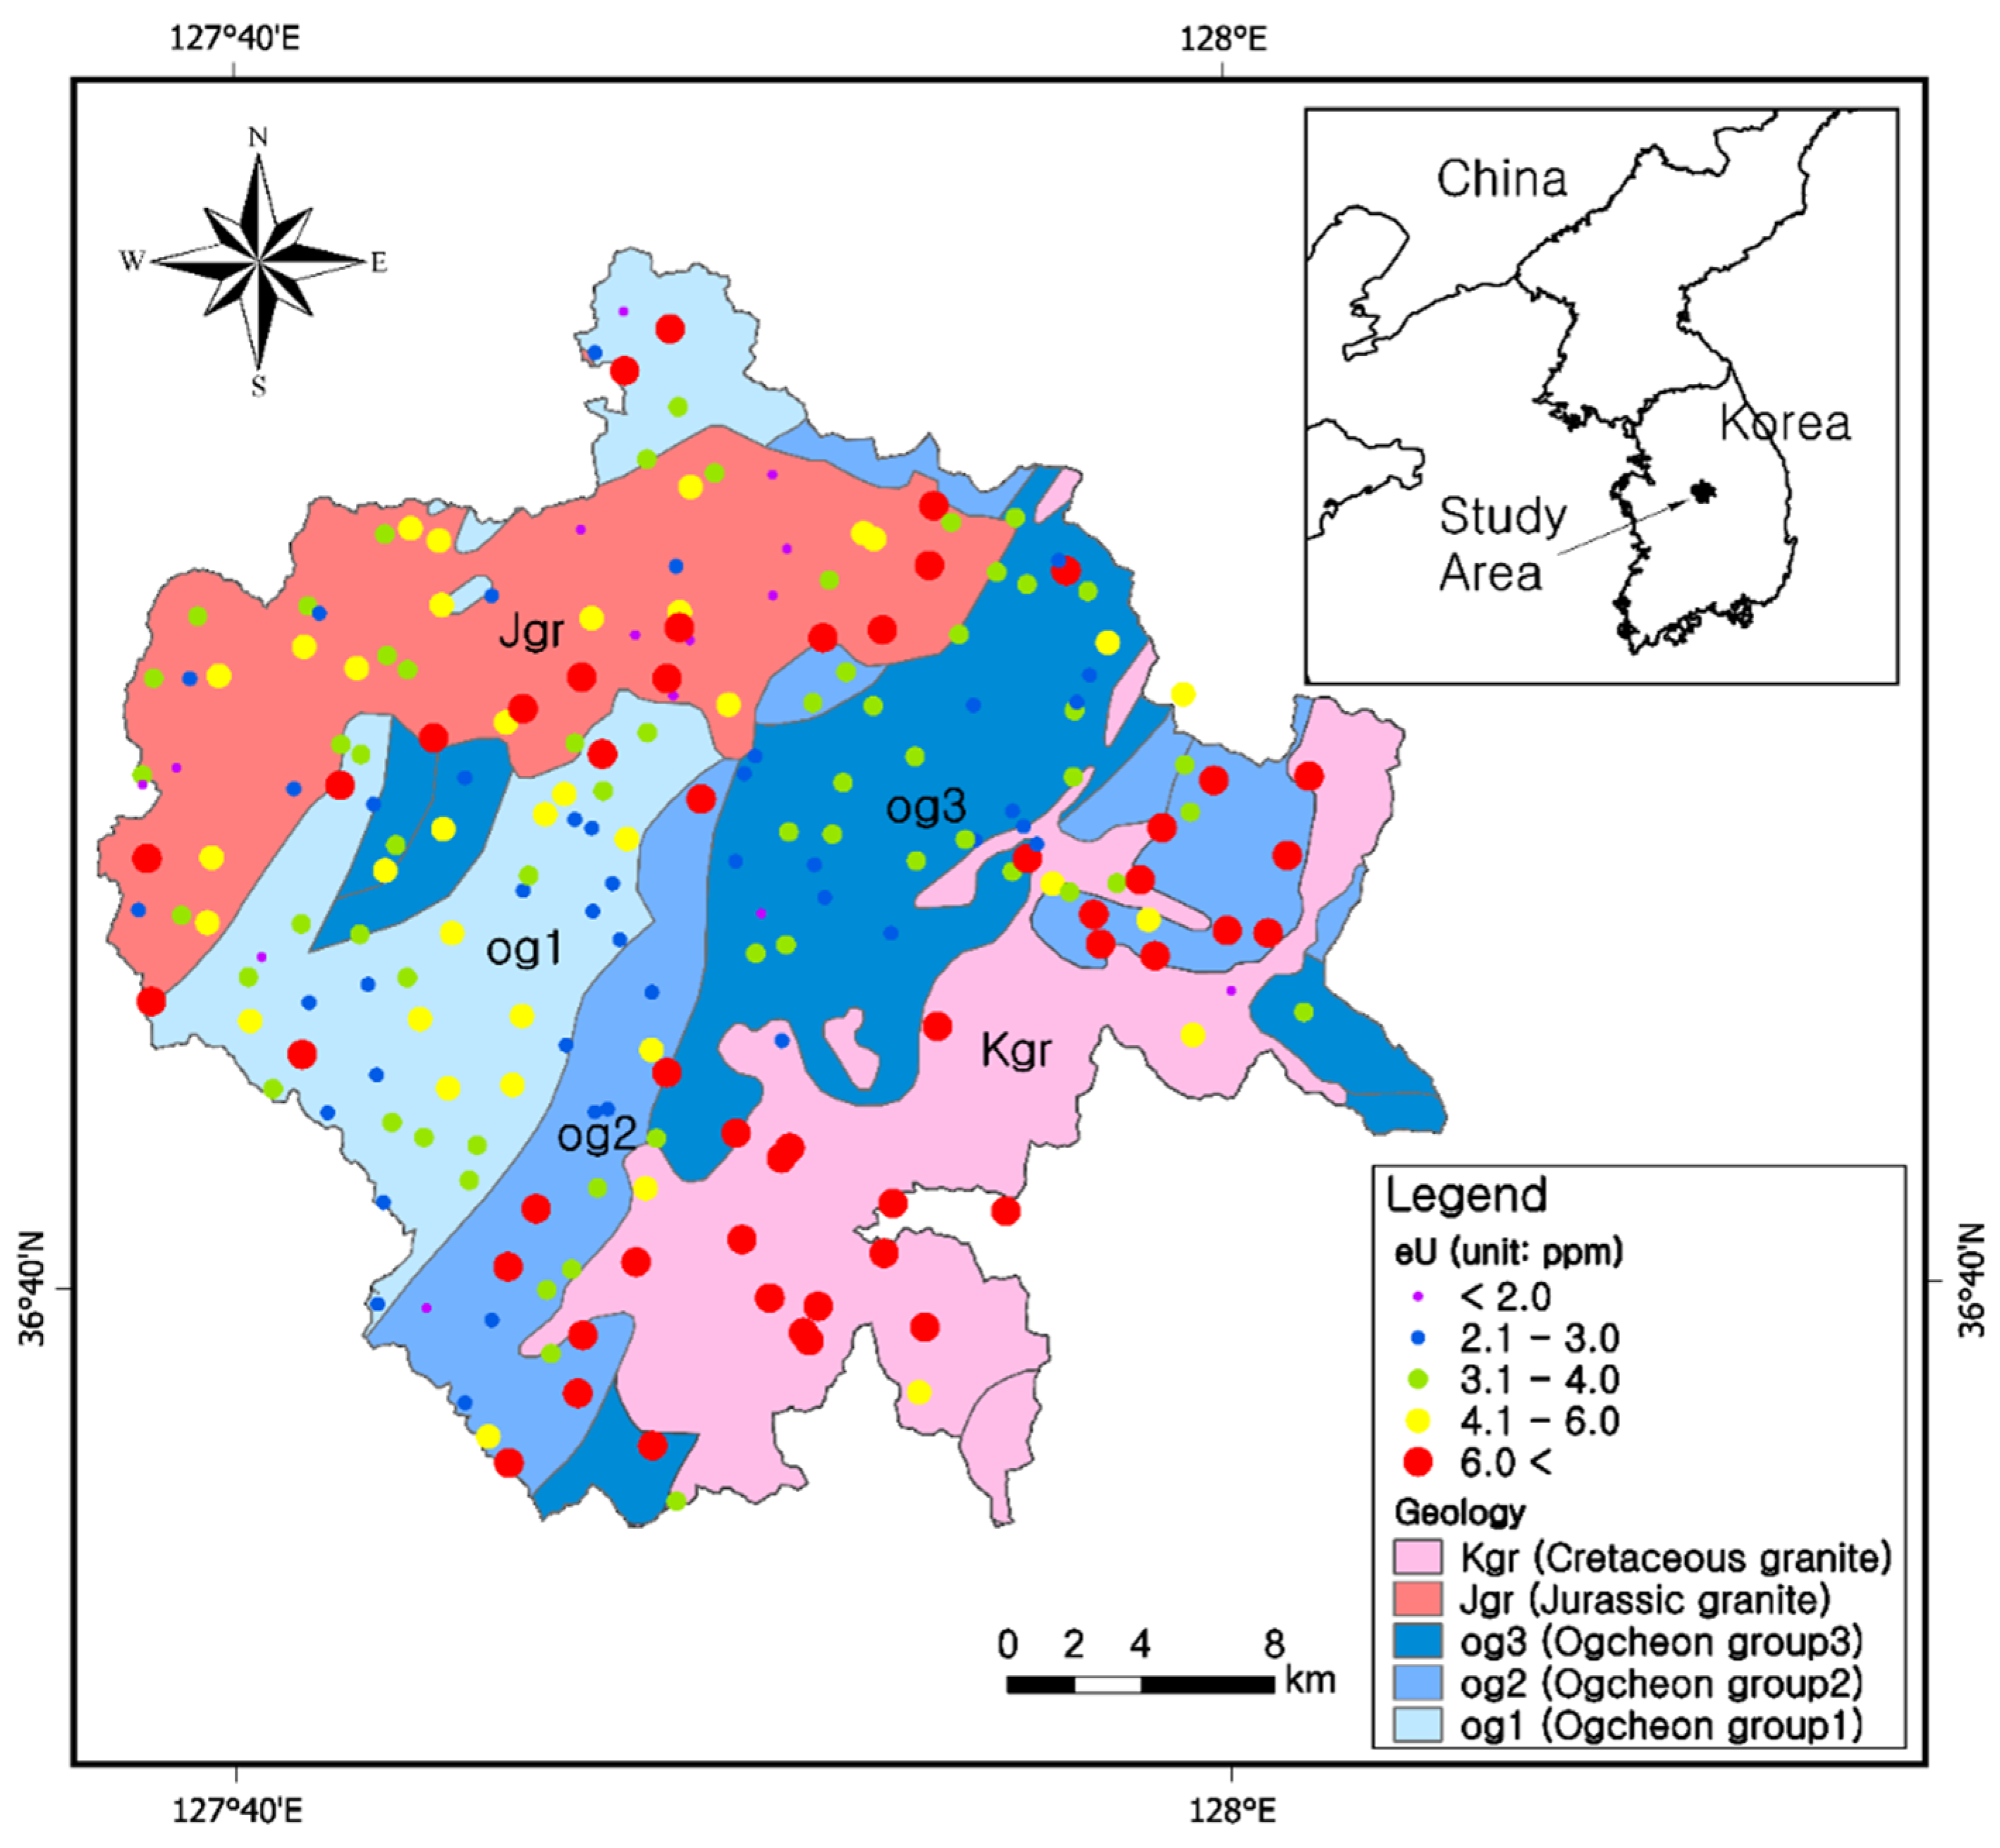
2.1. Geology of the Study Area

The geology of the Goesan area can be roughly divided into OMB metasedimentary rocks and Mesozoic granites (Figure 1). The N-E trending OMB comprises Late Proterozoic to Paleozoic metasedimentary and metavolcanic sequences which are intruded by Mesozoic granitic rocks. Uraniferous black slates, extending for over 100 km in the OMB, have been explored for their uranium mineralization. In the OMB, uranium mineralization is more concentrated in the narrow horizons of the coaly slates than in the surrounding black slates [24,31]. The OMB metasedimentary rocks are classified as og1, og2, and og3, according to lithological differences in the constituent rocks [32]. og1, located in the northwestern portion of the area, consists of mica schist or sandstone, the latter varying from dark brown to dark gray. og2 is distributed across the central part of the study area. It is composed mainly of phyllite and slate, and a uranium-bearing coal bed passes through parts of the bedrock. The uranium-bearing coal bed is distributed locally in og2, with 20–40 m thickness [24]. og3 is distributed across the central-eastern part of the area and contains quartzite, limestone, granite, and gneiss. The granites in the Goesan area are divided into Jurassic granite (Jgr) and Cretaceous granite (Kgr). Jgr, consisting mainly of granodiorite and coarse granular granite, is distributed across the northwestern part of the study area. Kgr is mostly composed of biotite granite and granite porphyry. The metasedimentary rocks around the Kgr display contact metasomatism or alteration [33]. Alluvium is distributed in low land at the northwestern part of the area, with about 10 m thickness, and the weathered zone that developed on the bedrock also has a similar thickness to alluvium. The elevation of the study area ranges from 100 m in the northwest to 900 m in the southeast. Groundwater occurs mostly from fractured rock aquifers controlled by topographical and geological properties.

2.2. Sampling and Analytical Methods

We collected 200 groundwater samples at distance spacings that ensured representative sampling: 25 samples from Kgr, 56 samples from Jgr, 43 samples from og1, 38 samples from og2, and 38 samples from og3, respectively (Figure 1). Mostly, submersible pumps were installed in the selected wells and groundwaters were pumped. Groundwater samples were collected once temperature (SATO, SK-1260), pH, electrical conductivity (WTW, pH/Cond 340i), Eh and DO (HACH, HQ40d) remained constant. Alkalinity, being expressed as HCO3 concentration, was quantified on-site by titration with 0.05 M HCl. Samples for uranium analysis were filtered on site with a 0.45-μm membrane filter, and maintained at a pH of 2 with nitric acid, before being transported to the Korea Institute of Geoscience and Mineral Resources (KIGAM), where they were analyzed using inductively coupled mass spectrometry (ICP-MS; DRC-II, Perkin Elmer, Inc., Waltham, MA, USA). The concentrations of the major cation (K, Na, Ca, Mg, Si, Sr) in groundwater were analyzed by graphite furnace atomic absorption spectrometry (AAS, PE3100, Perkin-Elmer, Waltham, MA, USA), inductively coupled plasma–atomic emission spectrometry (ICP-AES, Optima 4300 DV, PerkinElmer, Waltham, MA, USA), and ion chromatography (IC; Dx 300, Dionex Co., Sunnyvale, CA, USA). Anion analyses (F, Cl, NO3N, SO4) were conducted using ion chromatography (IC, DX-1500, Dionex, Sunnyvale, CA, USA). All chemical analyses were conducted at KIGAM.
For radon analysis, 8 mL of each groundwater sample was injected into a 22 mL vial containing 12 mL scintillation solution and then shaken to ensure even mixing. During sampling, care was taken to prevent the formation of air bubbles, which can cause radon leakage from the water. The samples were transported to KIGAM within 48 h and the radon activity was analyzed using a liquid scintillation counter (Quantulus 1220™; Perkin-Elmer Inc., Waltham, MA, USA) equipped with a pulse-shape analyzer, which can electronically separate alpha and beta nuclides into different spectra. During the measurements, the pulse shape analysis level was set at 100 for 300 min of the count time and the detection limit was approximately 0.12 Bq/L [6,29]. The 241Am and 90Sr/90Y standard radioactive solutions were used to minimize alpha/beta discrimination capabilities. The detection efficiency for 222Rn was evaluated in triplicate based on the total peak area of the alpha line at 100 PSA level. Sampling time was recorded to correct for the time interval between sampling and analysis, and the measured concentrations were converted using the correction of radioactivity decay.
Because all common rock types and the soils derived from them contain a significant amount of the naturally occurring radioactive elements (radioelements), the presence of these radioelements is apparent in any gamma-ray survey [34]. Thus, the concentrations of K, equivalent of uranium (eU), and equivalent of thorium (eTh) in bedrocks can be measured by detecting the gamma radiation emitted by the natural radioactive decay of these elements from bedrock surface [35]. A portable gamma ray spectrometer (GR-320A enviSPEC device; SAIC, Fugro Instruments, Australia) with a measurement error of ±0.1% was used to measure the eU (ppm) in the rocks for 300 s. The eU was measured on the same 200 outcrops where the groundwater sample was collected. Special care was paid to avoid outcrops affected by weathering, because it may differ from the actual concentrations in the bedrocks. Nevertheless, this method has been commonly used for the measurement of natural radioactivity because it can provide fast assessment of the uranium concentration of outcropping rocks [36,37,38,39].
Spatial concentration distribution maps of uranium and radon were constructed using inverse distance weighting (IDW), which is an interpolation method that applies the principle that the closer the distance to a known point is, the more similar the value is when predicting the value of an unknown point [40].
The chemical speciation of uranium and the saturation index (SI) of possible minerals in groundwater samples were calculated using a chemical equilibrium software program, Visual MINTEQ [41], with its built-in thermodynamic databases, which allows us to understand the behaviors and mobility of radionuclide elements in groundwater. For this study, 17 groundwater samples with uranium concentrations above 10 μg/L were selected for the calculation to assess the uranium mobility, because samples with very low concentrations were not useful in calculating saturation indices.

3. Results and Discussion

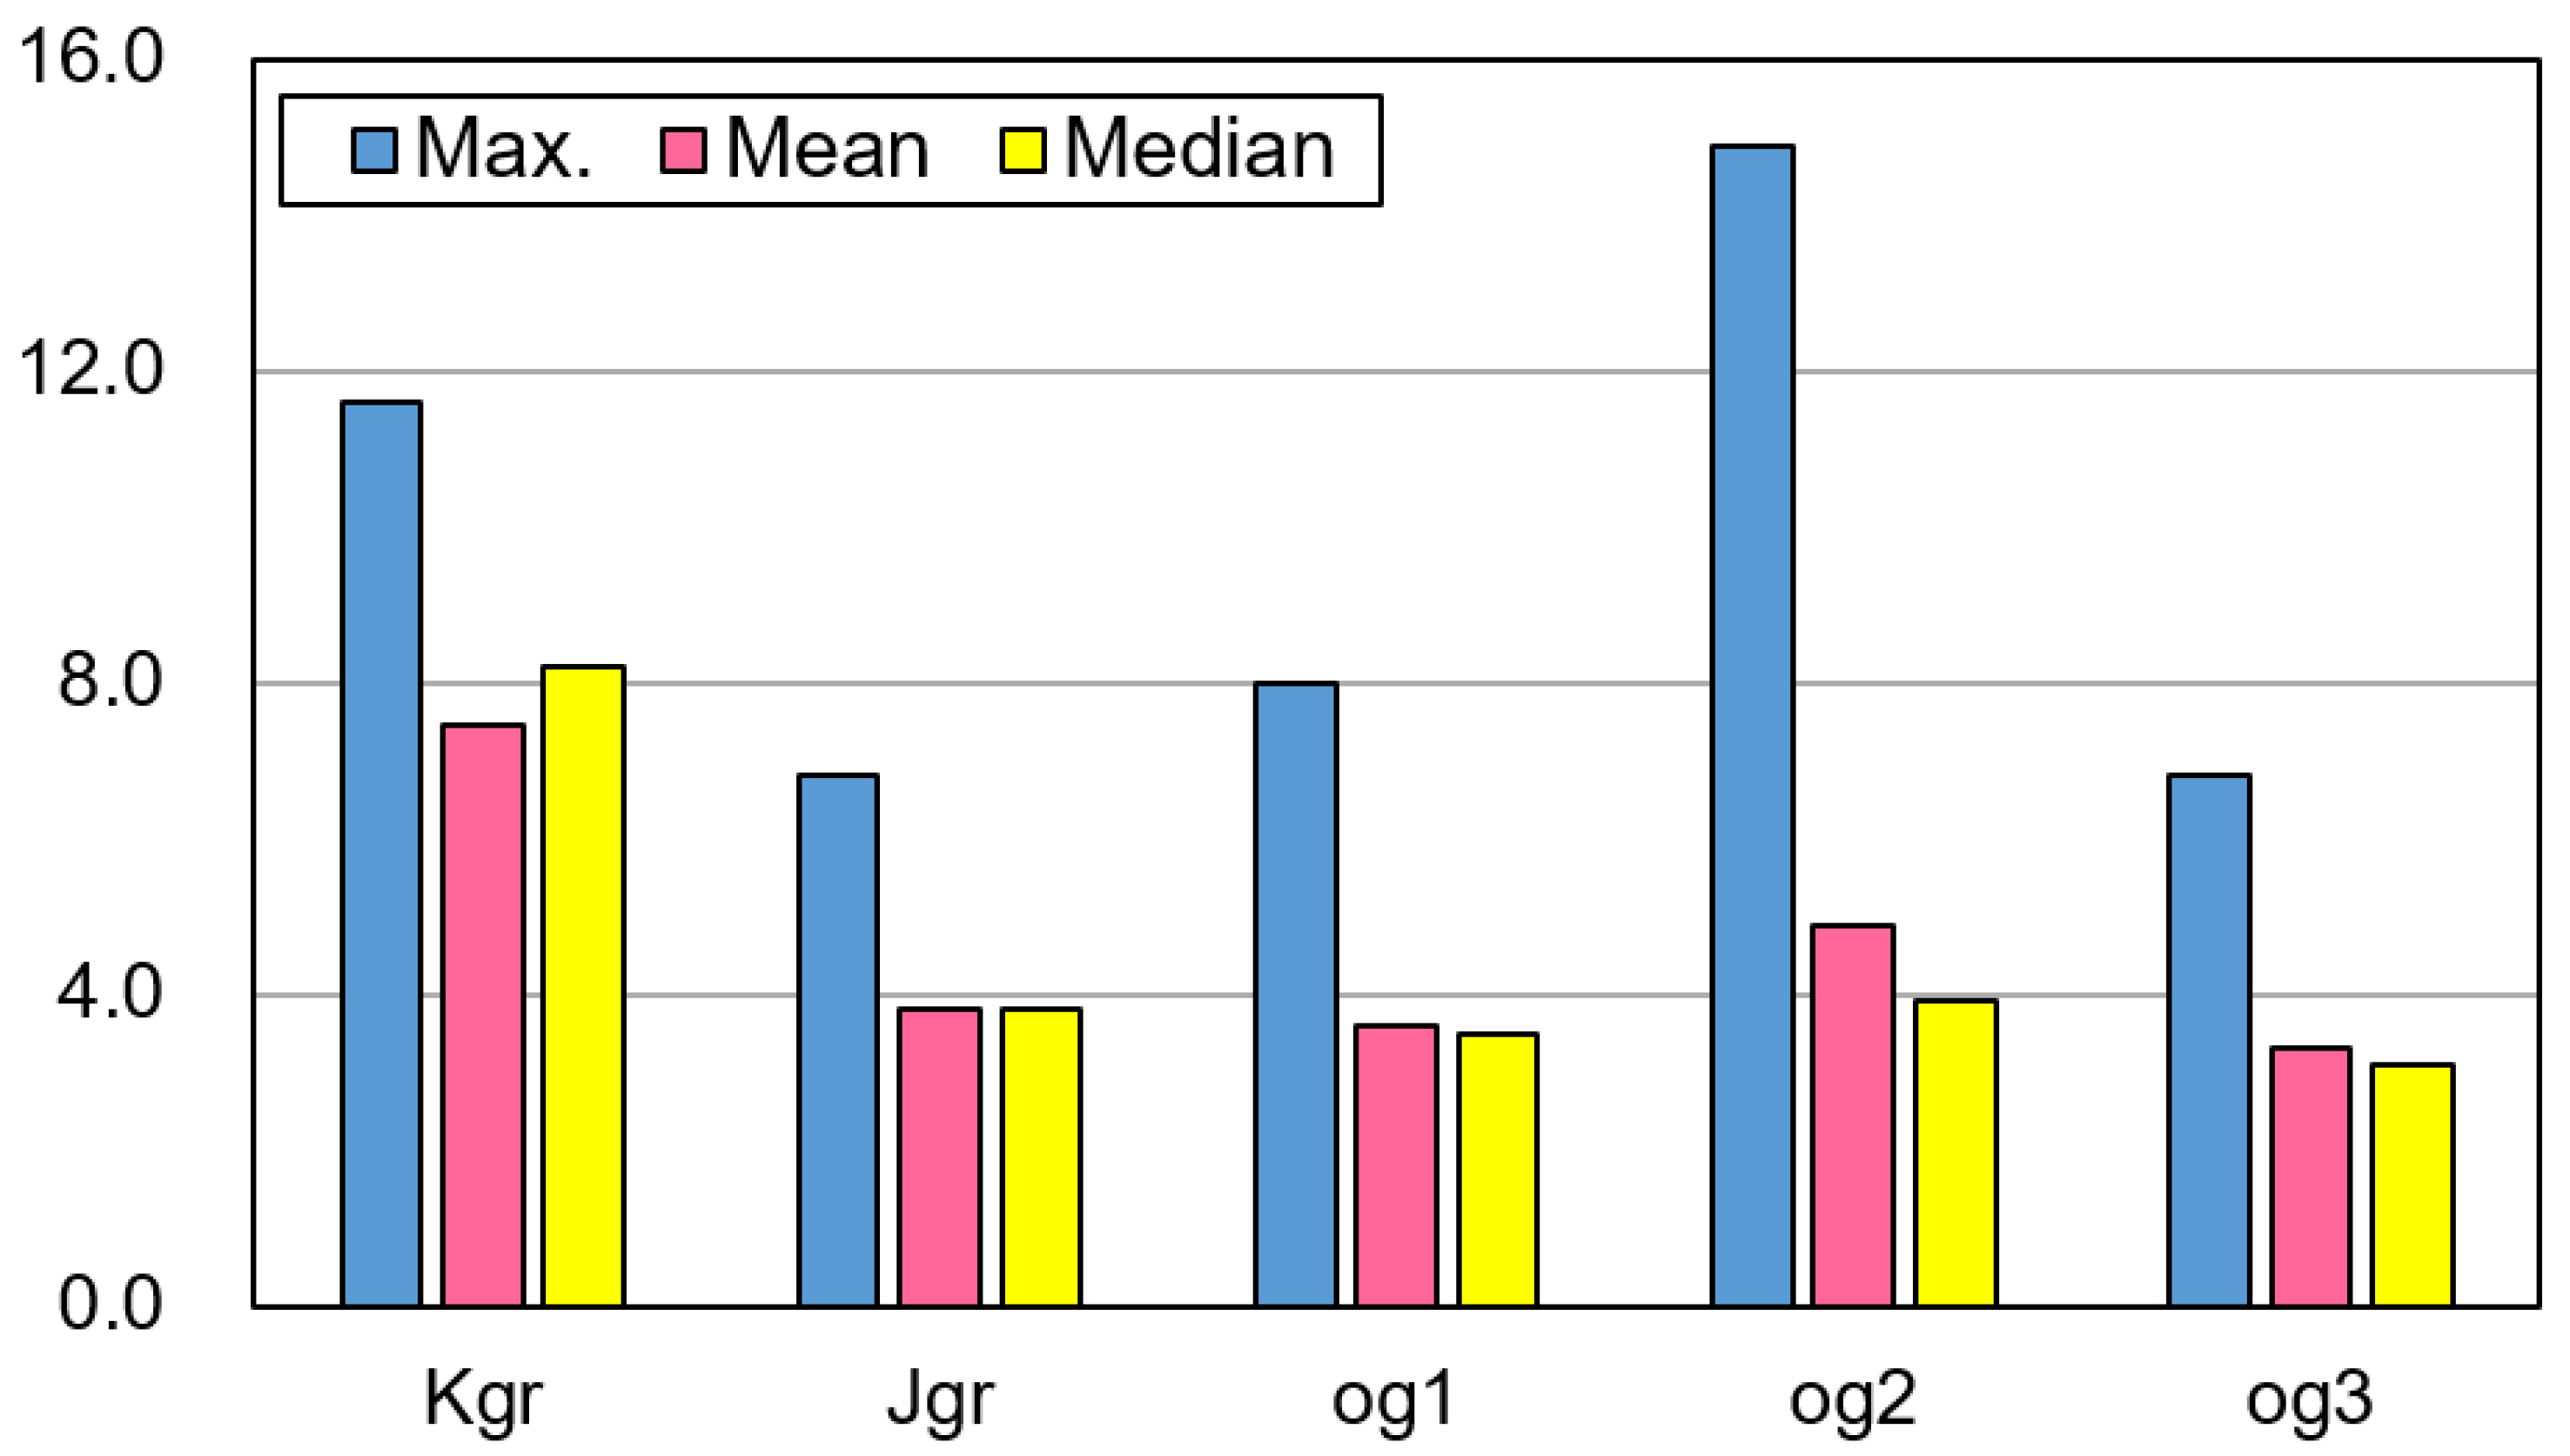
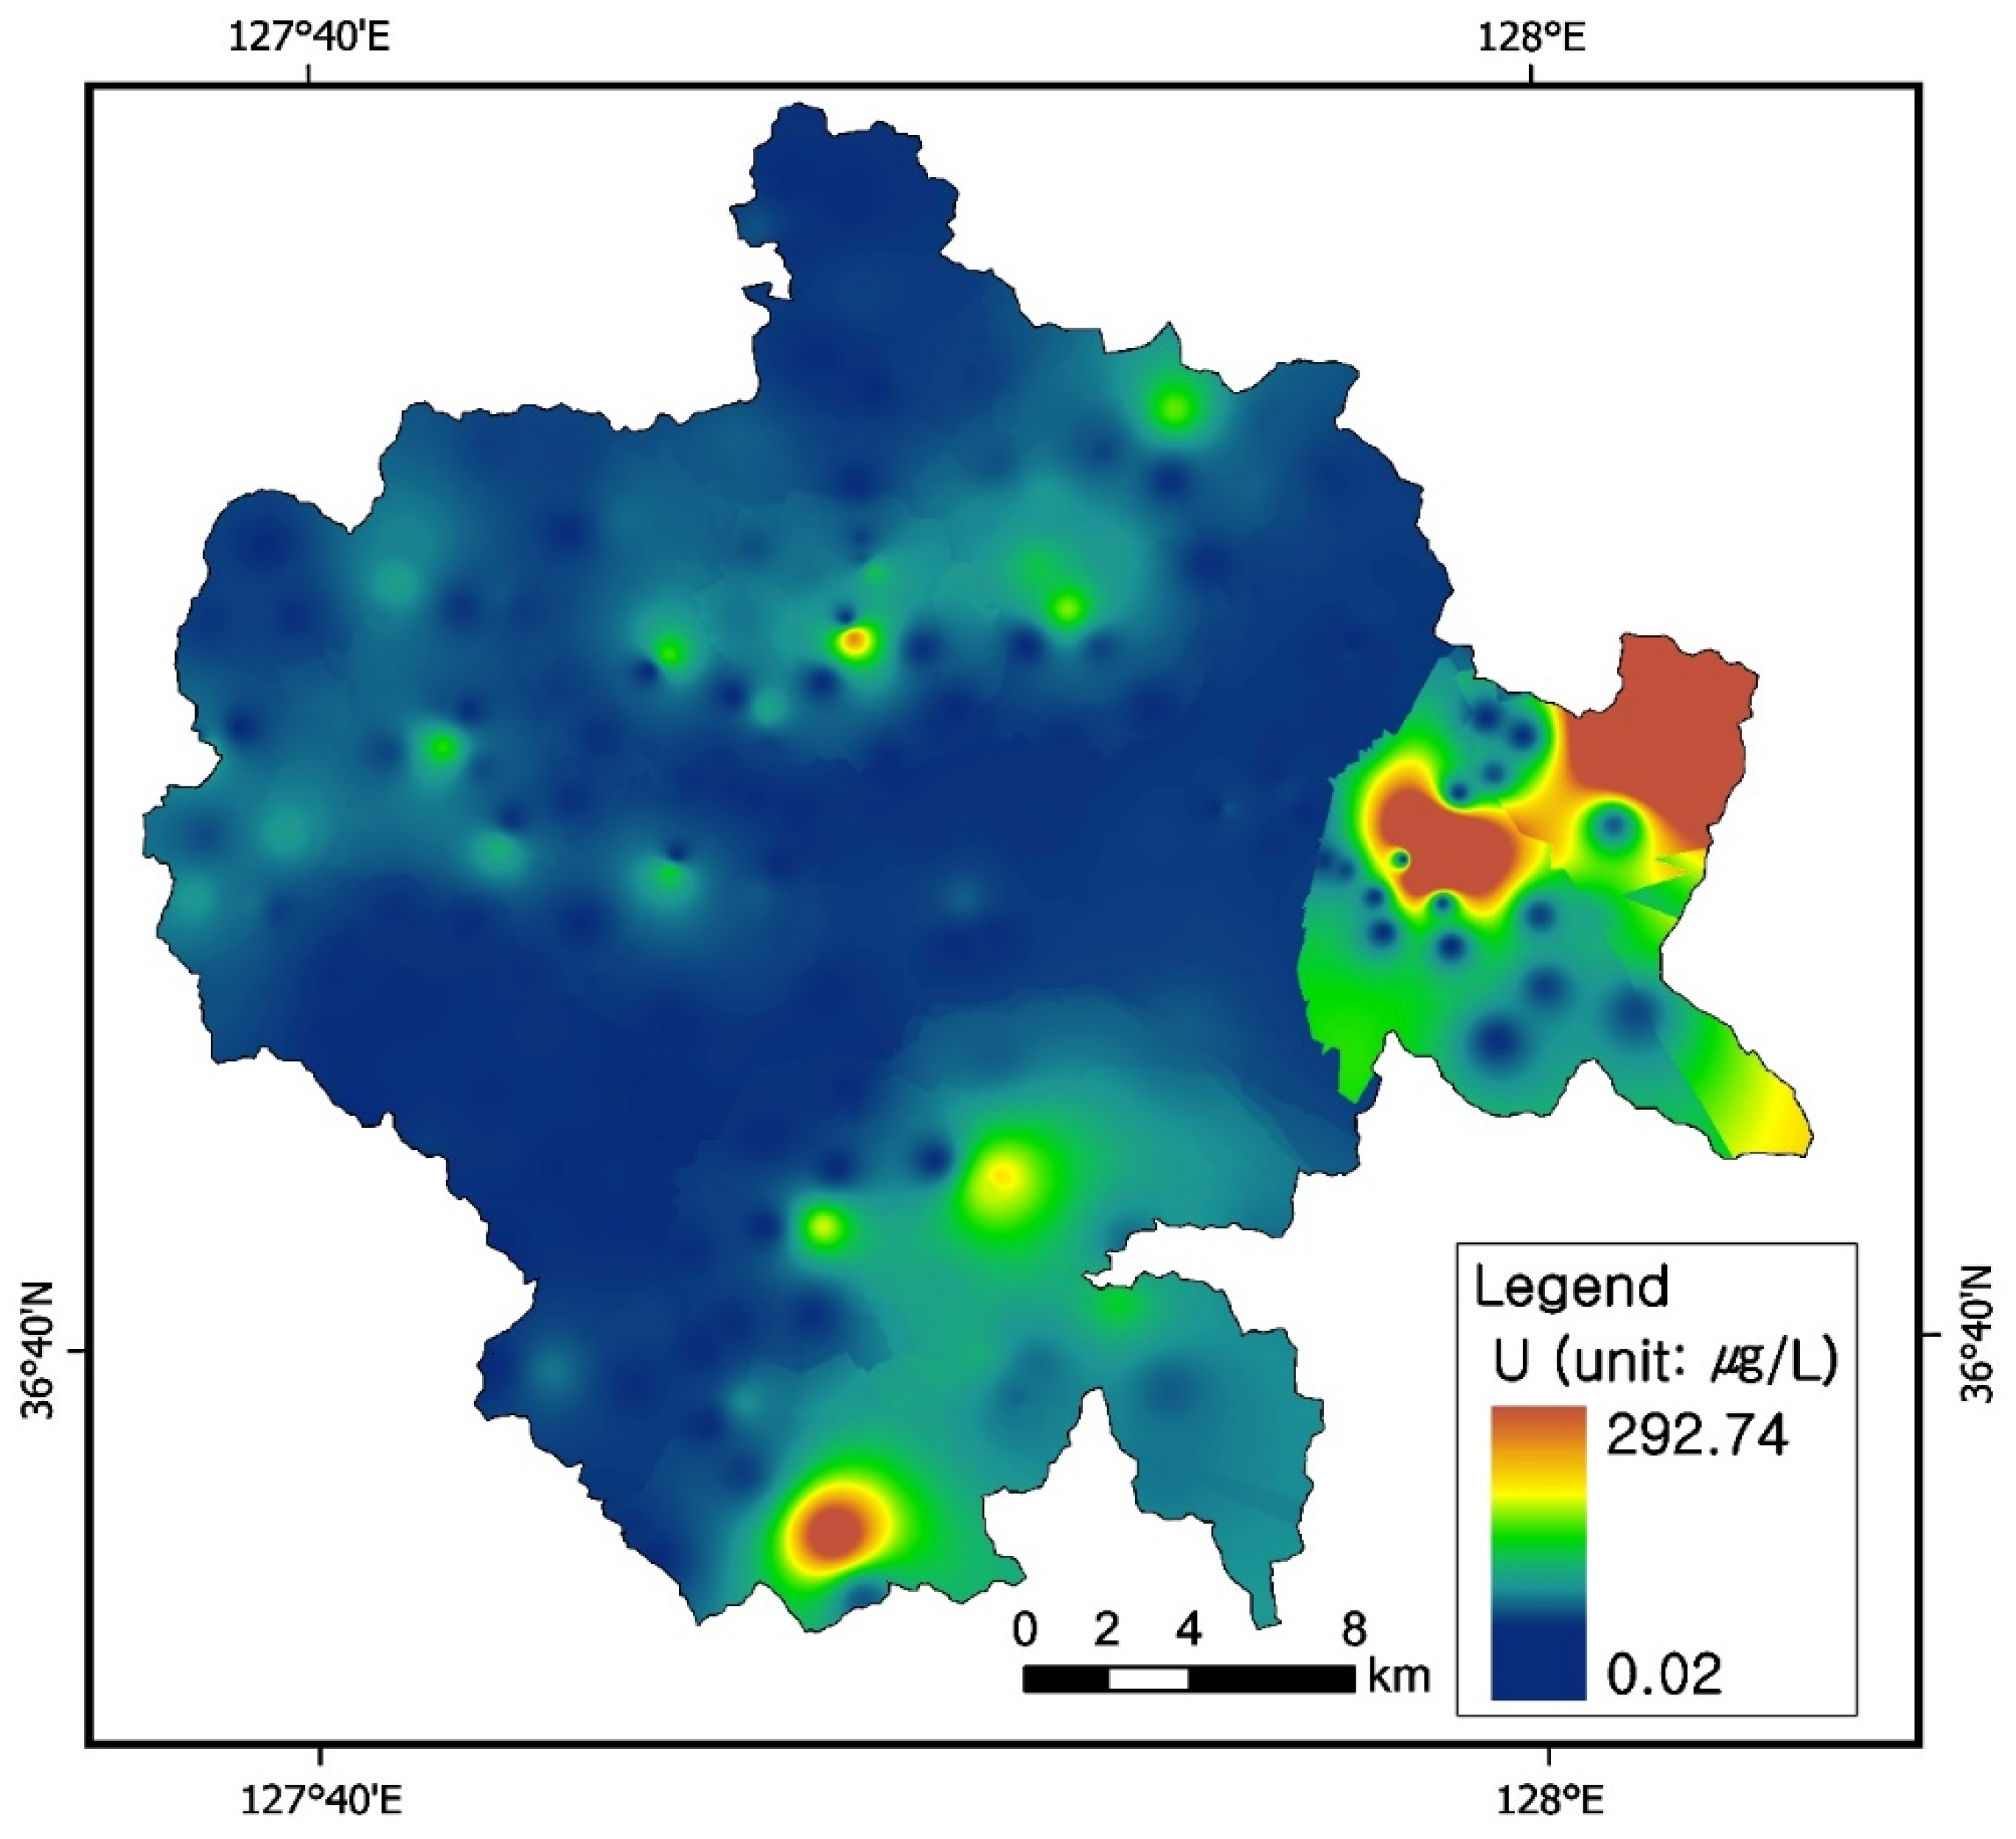
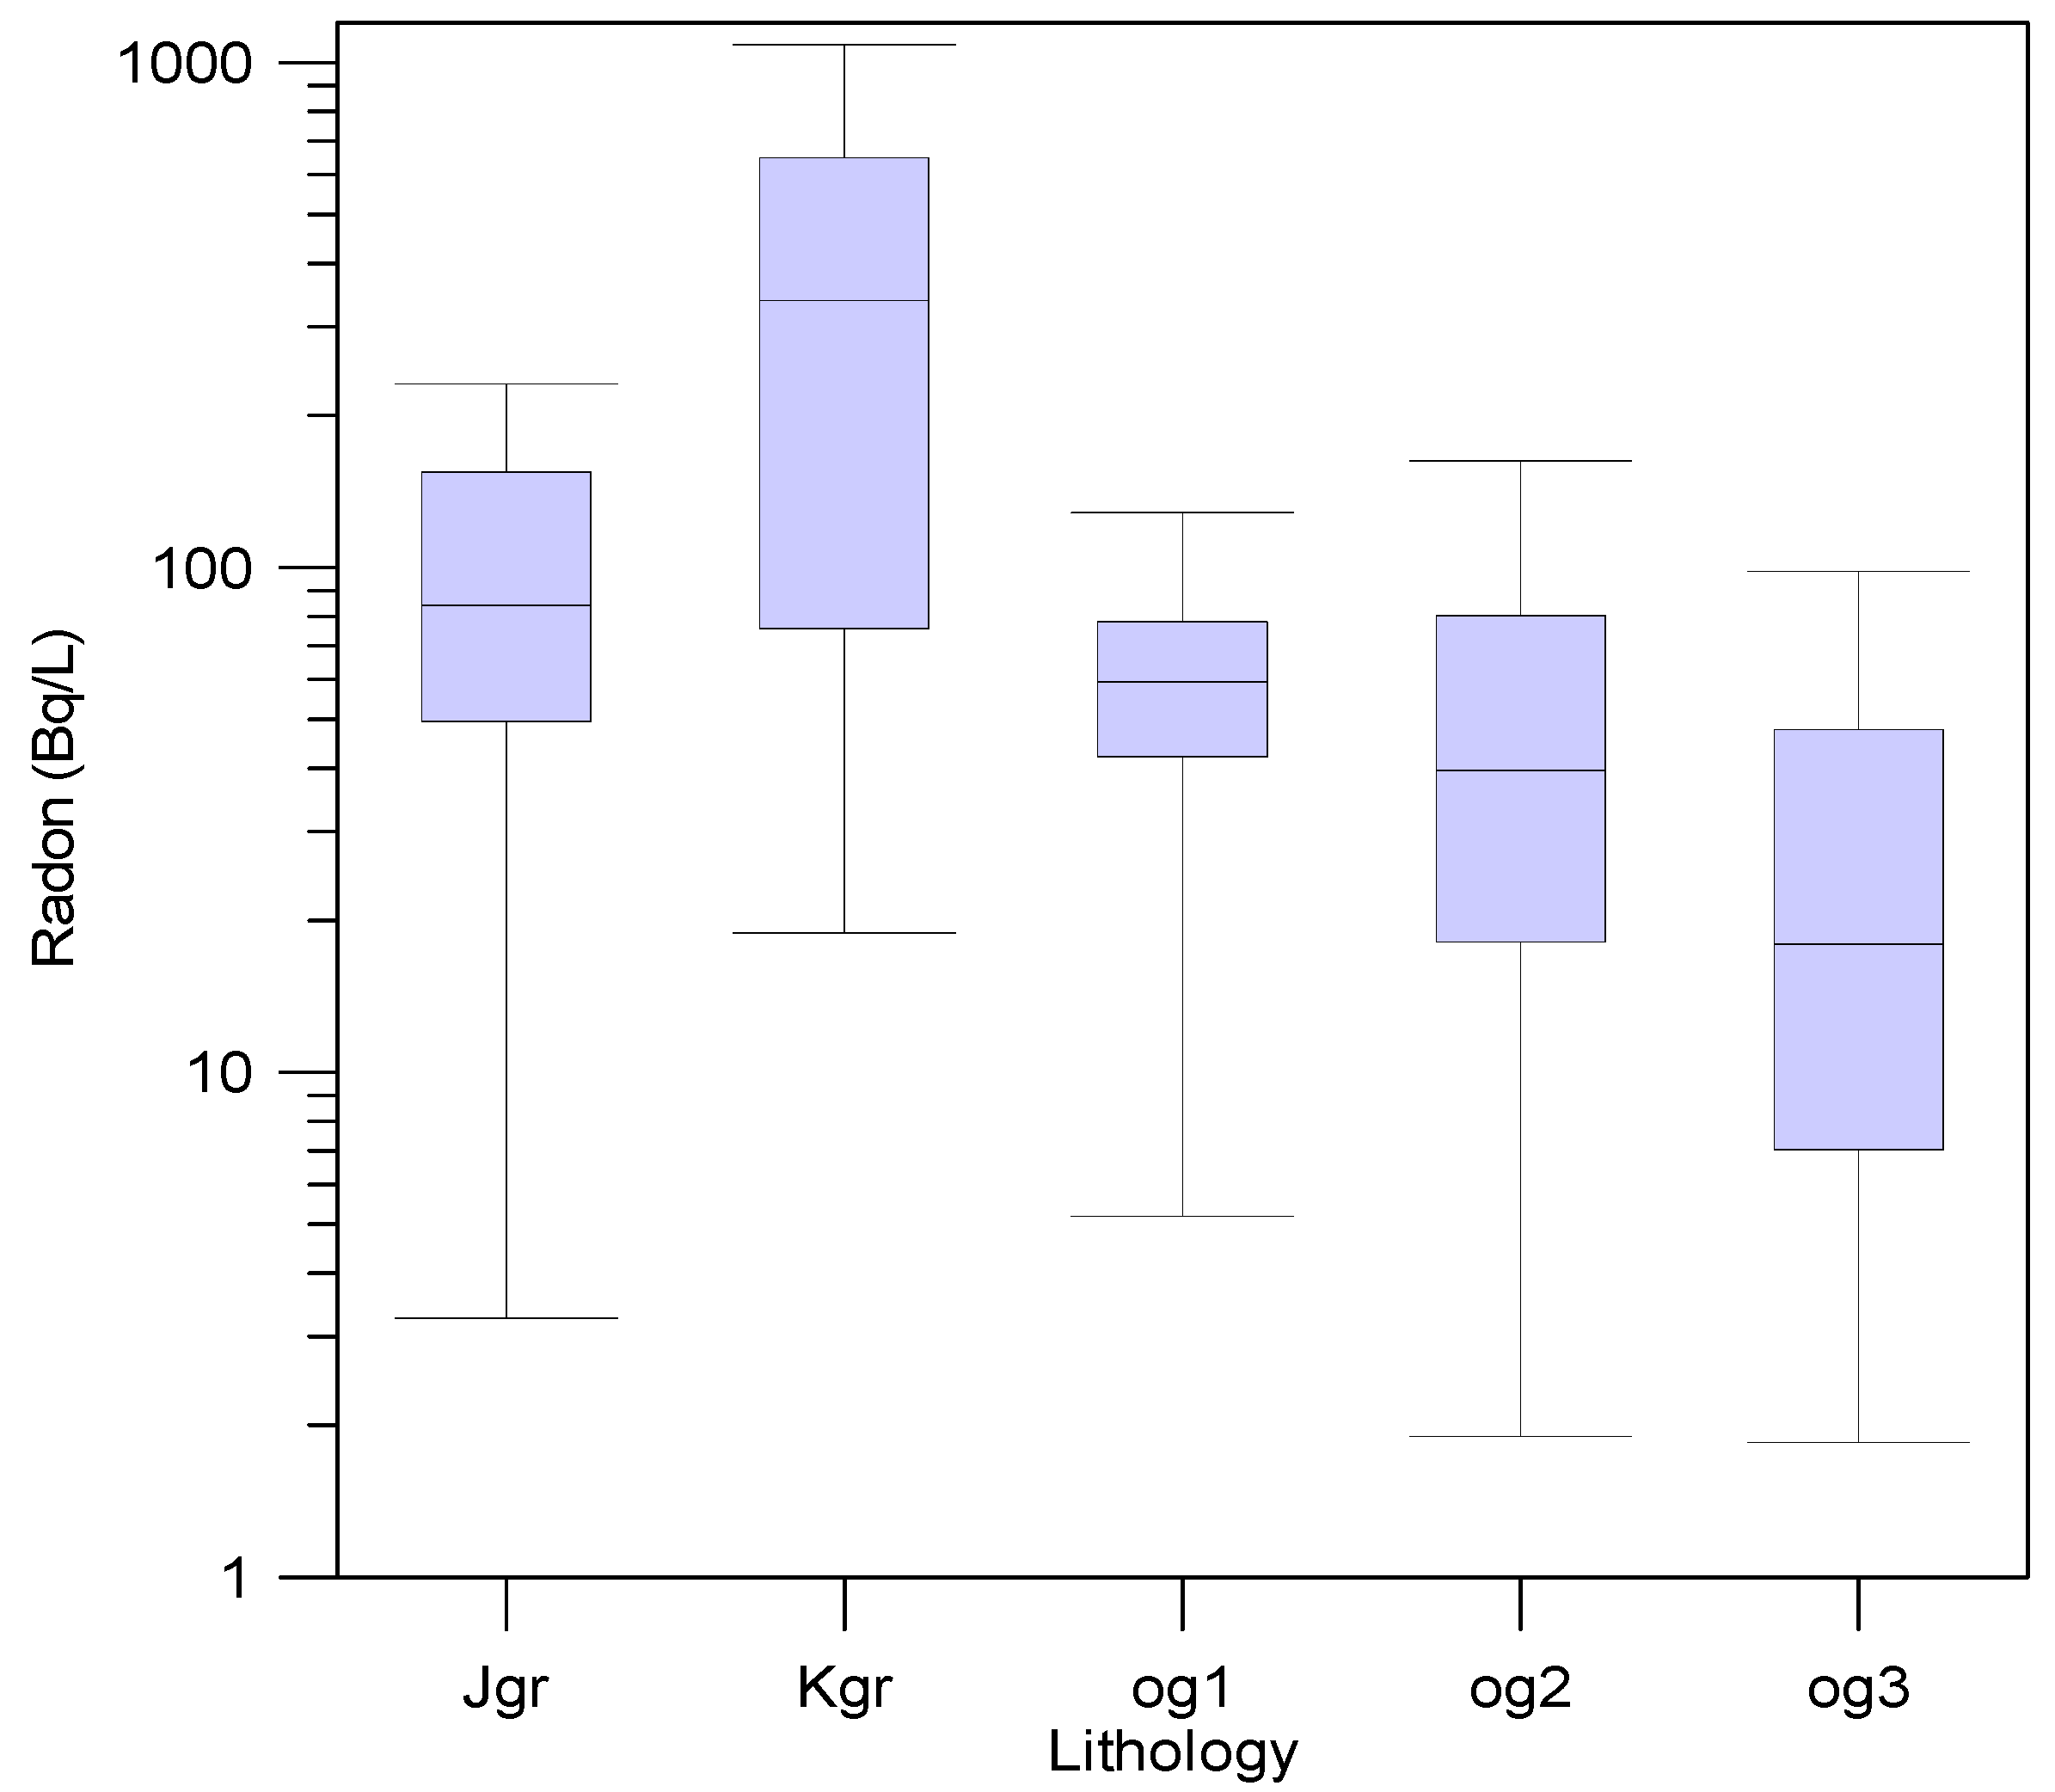
3.1. Uranium Concentrations (eU) in the Five Bedrock Types

Because geology is the most important factor controlling the sources and distributions of uranium and radon [42], the eU values of the five geologic bedrock types in the study area were measured using a portable gamma ray spectrometry. The distribution map of the eU values on a geological map shows that the sites with high concentrations are largely located on granitic rocks or the lithological boundaries between granitic rocks and other rocks, with a few exceptions (Figure 1).
The eU values in the bedrock from the 200 measurement points fell within the range of 1.1–14.9 ppm (median, 3.7 ppm), which is higher than the global average of 2.7 ppm [39]. As shown in Figure 2, mean and median values of eU in the five bedrock types are high in the order of Kgr > og2 > Jgr > og1 > og3. The maximum eU values are observed in order of og2 > Kgr > og1 > Jgr > og3. In more detail, the uranium concentrations (eU) in five bedrock samples are as follows: the uranium concentration was highest in Kgr rocks (3.0–11.6 ppm; mean 7.5 ppm, median 8.2 ppm) and ranged from 1.1 to 6.8 ppm in Jgr (mean 3.8 ppm, median 3.8 ppm), and the uranium contents in og1 and og3 were 1.1–8.0 ppm (mean 3.6 ppm, median 3.5 ppm) and 1.7–6.8 ppm (mean 3.3 ppm, median 3.1 ppm), respectively. The uranium concentration in og2 ranged from 1.4 to 14.9 ppm (mean 4.9 ppm, median 3.9 ppm).
The mean uranium concentration (3.8 ppm) in Jgr of the study area was similar to that measured previously in other Jgr areas in Korea, such as in Daejeon, located in the west-central part of Korea (3.72 ppm; [28]). However, the mean uranium concentration of Kgr (7.5 ppm) in the study area is higher than those in Jgr areas. The high uranium levels in Kgr compared to Jgr are due to the characteristic compositions of Kgr, which contains significantly more acidic rocks than Jgr does [32]. As shown in Figure 1, high uranium concentrations are remarkably distributed in the Kgr granite area, or less commonly near geological boundaries between granitic rocks and metamorphic rocks.

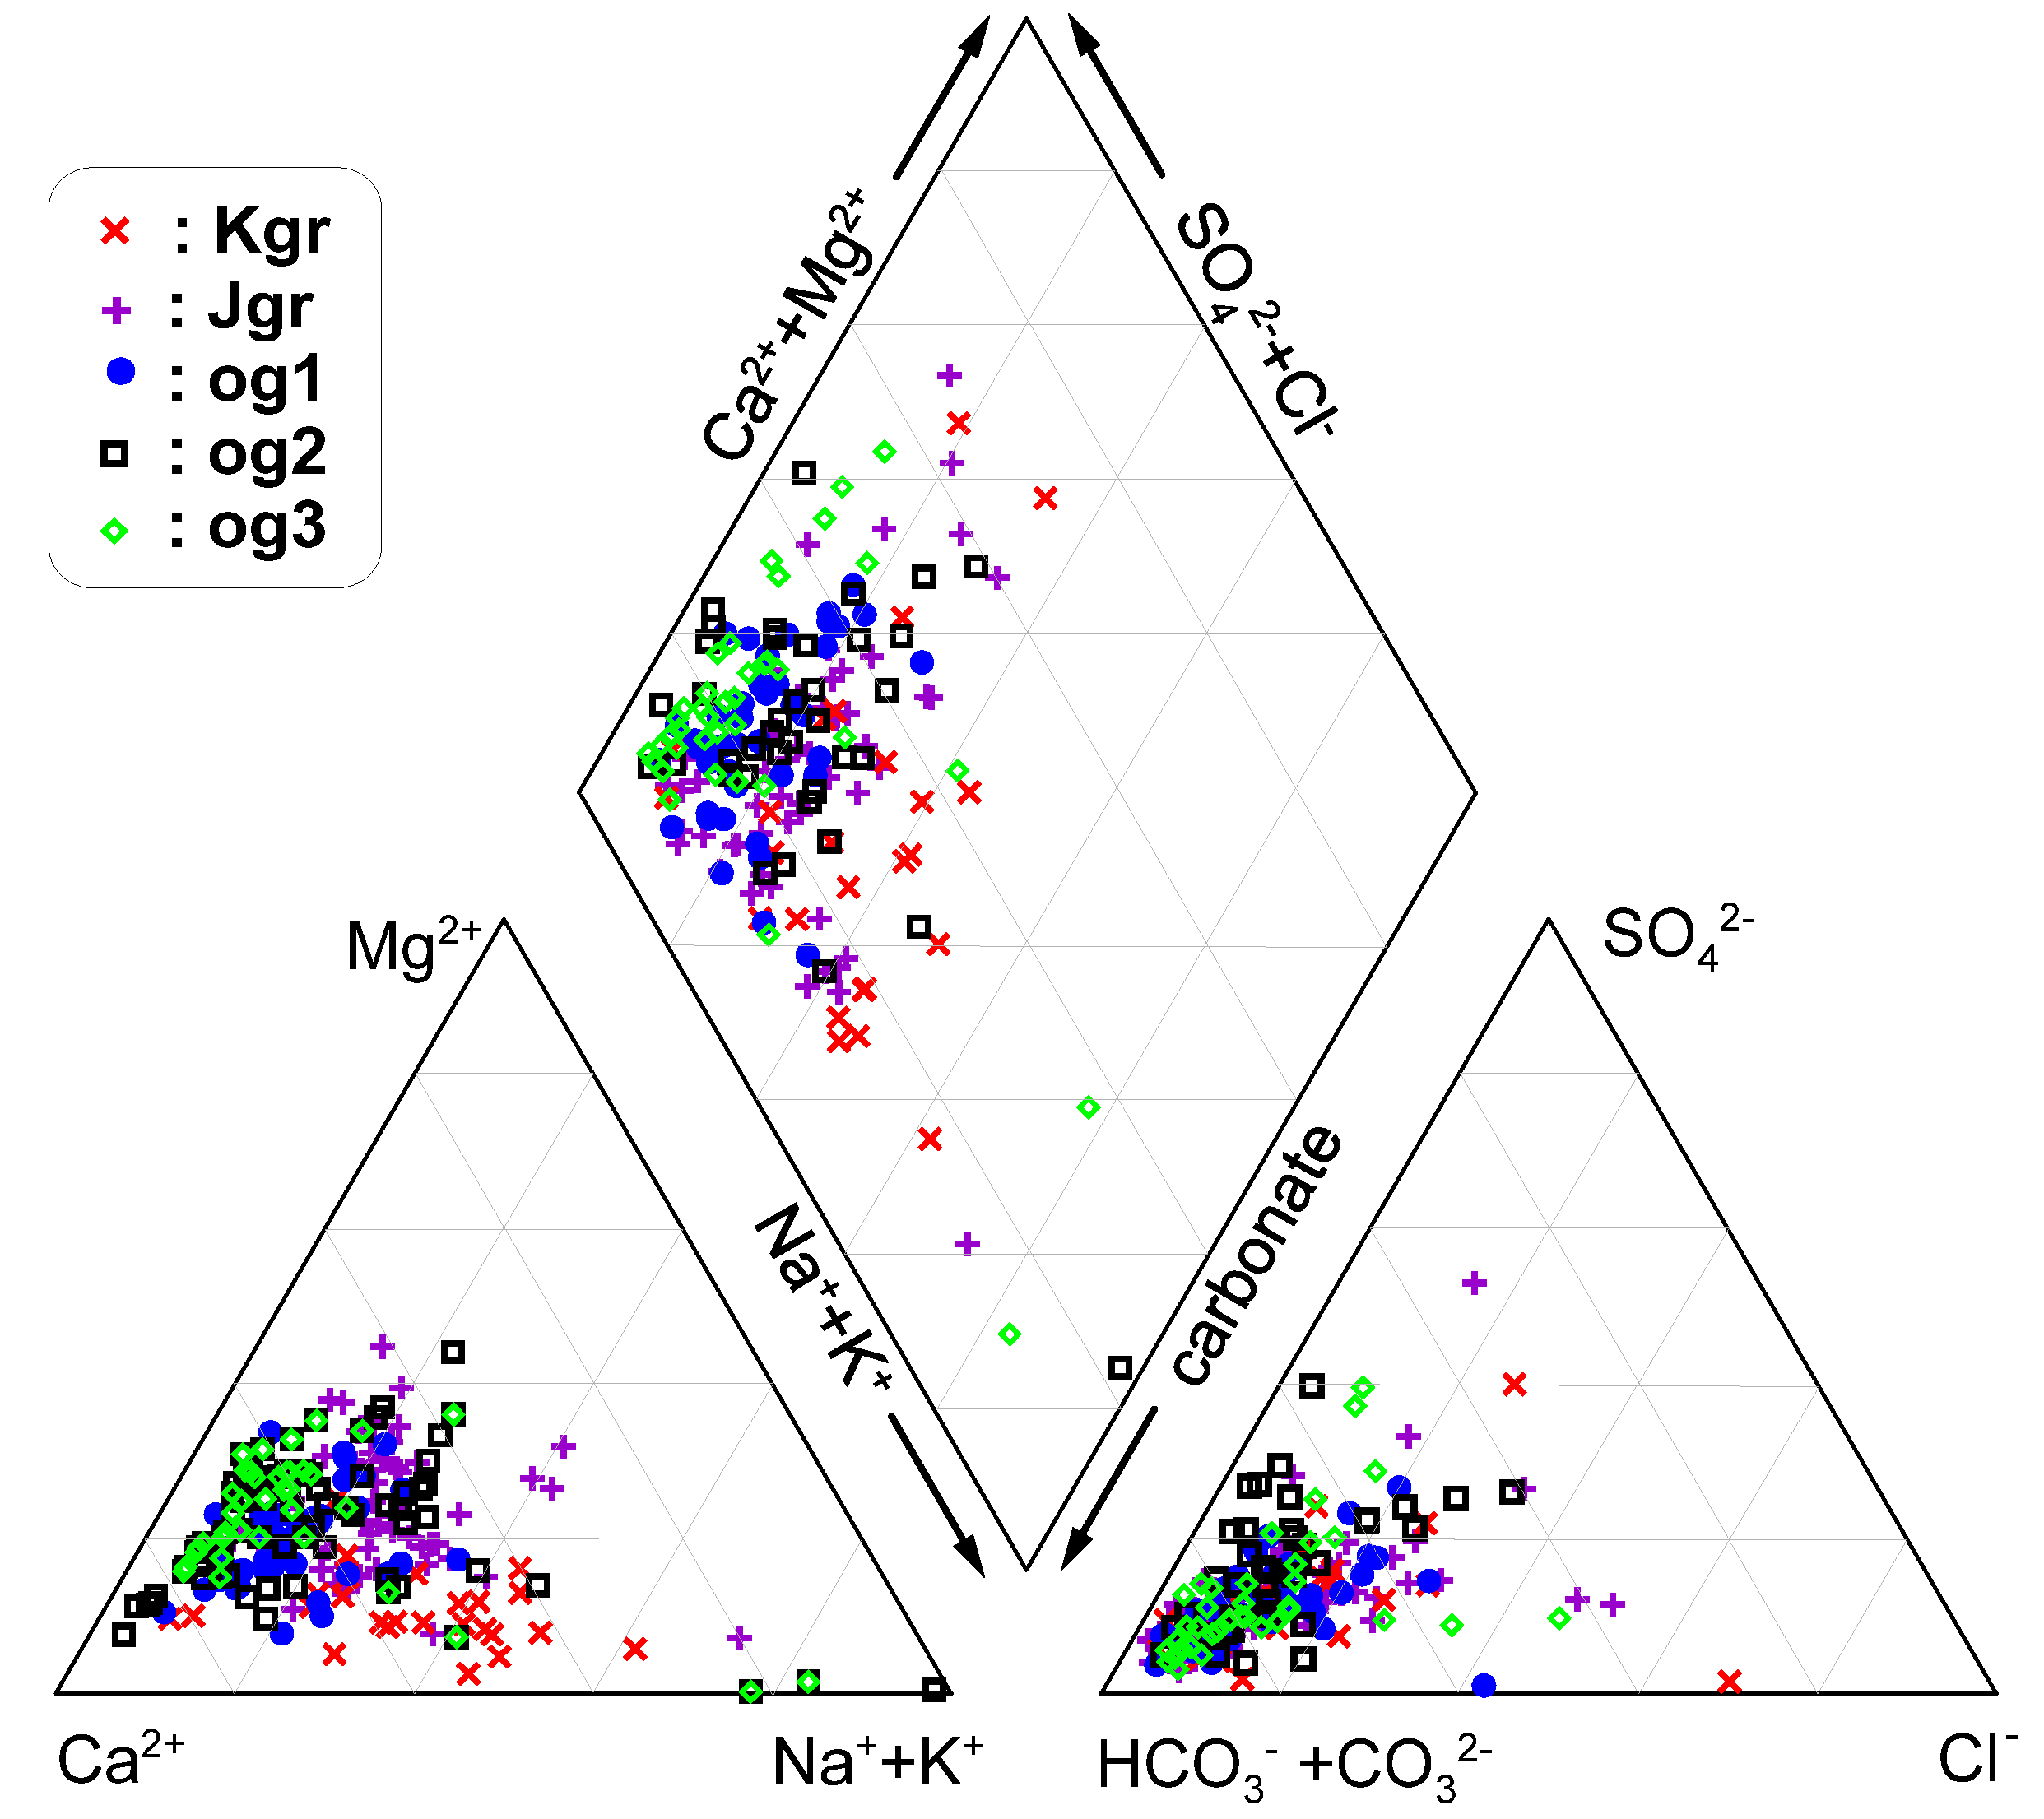
3.2. Physicochemical Properties of Groundwater and Water Types

Table 1 illustrates a statistical summary of hydrogeological components in the 200 groundwater samples in the study area. The depths of the 200 wells sampled in this study ranged from 10 to 220 m (average, 81.9 m). The well depths indicate that most groundwater is produced from bedrock, but the possibility of shallow groundwater inflow into the wells cannot be ruled out, dependent on the integrity of the well casing and grouting.
The mean depths are highest in order of og3 > Jgr > og2 > Kgr > og1. The pH values of the groundwater samples ranged from 6.05 to 9.65 (average, 7.33), being highest in the order of og3 > og2 > Kgr > og1 > Jgr. The electrical conductivity (EC) was 61 to 770 μS/cm (average, 259 μS/cm), being highest in the order of og3 > og2 > Jgr > og1 > Kgr. Reduction–oxidation potential (Eh), which plays an important role in affecting uranium solubility, ranged from −335 to 366 mV, with a mean of 203.2 mV, being highest in the order of og2 > Kgr > og1 > Jgr > og3.
Table 1. Statistical summary of hydrogeological components in 200 groundwater samples. Kgr: Cretaceous granite; Jgr: Jurassic granite; og1: Ogcheon metasedimentary rocks 1; og2: Ogcheon metasedimentary rocks 2; og3: Ogcheon metasedimentary rocks 3. Sample numbers in each geologic unit are given in parenthesis. Max: maximum; Min: minimum; Med: median; Std: standard deviation. Otherwise noted, concentration unit is given in mg/L.
Depth (m)T (°C)pHEC (μS/cm)Eh (mV)DOKNaCaMgSiO2SrFClNO3SO4HCO3Rn (Bq/L)U (μg/L)
Max.122.016.98.2275635210.808.1236.5041.906.9135.500.193.5929.70137.019.80170.81540.9293.0
KgrMin.10.012.66.0561.0−3350.800.091.392.620.036.240.010.031.700.060.2818.318.90.21
(25)Mean76.314.27.252202216.921.2611.1619.112.1521.940.081.276.3817.217.0560.4404.826.0
Med.70.014.37.451722187.100.828.9015.102.0422.000.061.235.824.926.1051.9345.94.13
Std.29.81.00.55179591.891.638.2312.111.527.280.050.895.5330.725.1942.3381.067.0
Max.200.017.78.3174031010.106.8132.5099.6022.9035.501.613.7761.3075.20176.0219.6523.932.1
JgrMin.10.013.06.2193.0−1101.200.493.437.681.5710.700.070.051.700.062.5429.03.30.02
(56)Mean.85.615.27.172591985.532.0012.3126.397.8422.960.470.4111.2619.5115.3898.0107.94.37
Med.100.015.47.182472075.651.4910.3022.456.4922.350.310.237.2016.9011.0085.484.42.32
Std.40.61.00.51113842.091.486.4215.264.976.240.400.6211.6817.5122.9642.990.75.83
Max.160.018.08.366253669.204.3624.0067.4015.0029.301.522.1044.6054.3042.00213.5128.416.4
og1Min.15.011.16.5075.0701.640.361.397.971.238.150.020.041.790.420.2819.85.20.02
(43)Mean74.214.47.232222196.131.636.6025.154.8415.190.190.247.7914.6810.5882.562.51.19
Med.90.014.37.212012146.231.485.1522.804.0113.900.100.106.1410.907.5067.459.60.26
Std.46.81.40.48116591.940.794.6312.503.185.000.290.427.1012.059.0040.727.73.23
Max.150.016.99.0477033610.209.92170.0130.013.3043.600.4810.3040.30186.047.50344.7927.621.5
og2Min.20.013.36.2276.0−101.150.392.132.620.397.830.030.031.840.661.4821.41.90.02
(38)Mean76.414.77.412772305.942.2312.1632.145.6922.080.130.609.8023.6418.02100.683.22.03
Med.80.514.67.472252516.081.707.1725.804.8221.100.100.207.1516.5013.5082.438.10.45
Std.36.30.90.62167712.171.9426.8027.493.107.130.101.688.8332.3012.4765.5163.64.59
Max.220.020.09.656732969.5011.6038.50102.020.3051.600.944.63100.089.3073.80311.1167.23.54
og3Min.21.013.46.60101−3350.800.091.934.790.0310.100.040.061.990.932.0232.01.80.03
(38)Mean93.415.77.653071555.262.988.2343.599.7825.420.160.6113.9320.6318.90140.533.21.12
Med.100.015.57.602751725.241.886.1040.609.7521.500.120.199.5314.7015.30135.717.90.80
Std.43.01.30.521331242.413.056.4522.594.9412.310.180.9316.6418.9714.5558.137.71.01
Water types plotted on the Piper diagram show chemical variations depending on geology: granitic rocks have (Na, K)-HCO3, and metamorphic rocks mostly belong to the Ca, Mg-HCO3 type, as shown in Figure 3. As a more detailed description of water types, the Ca(Mg)-HCO3(Cl) type is found in the og1, og2, and og3 units, while the Ca(Mg, Na)-HCO3(Cl) type is found in Jgr, and the Ca(Na)-HCO3(Cl) type is mostly found in Kgr, respectively.

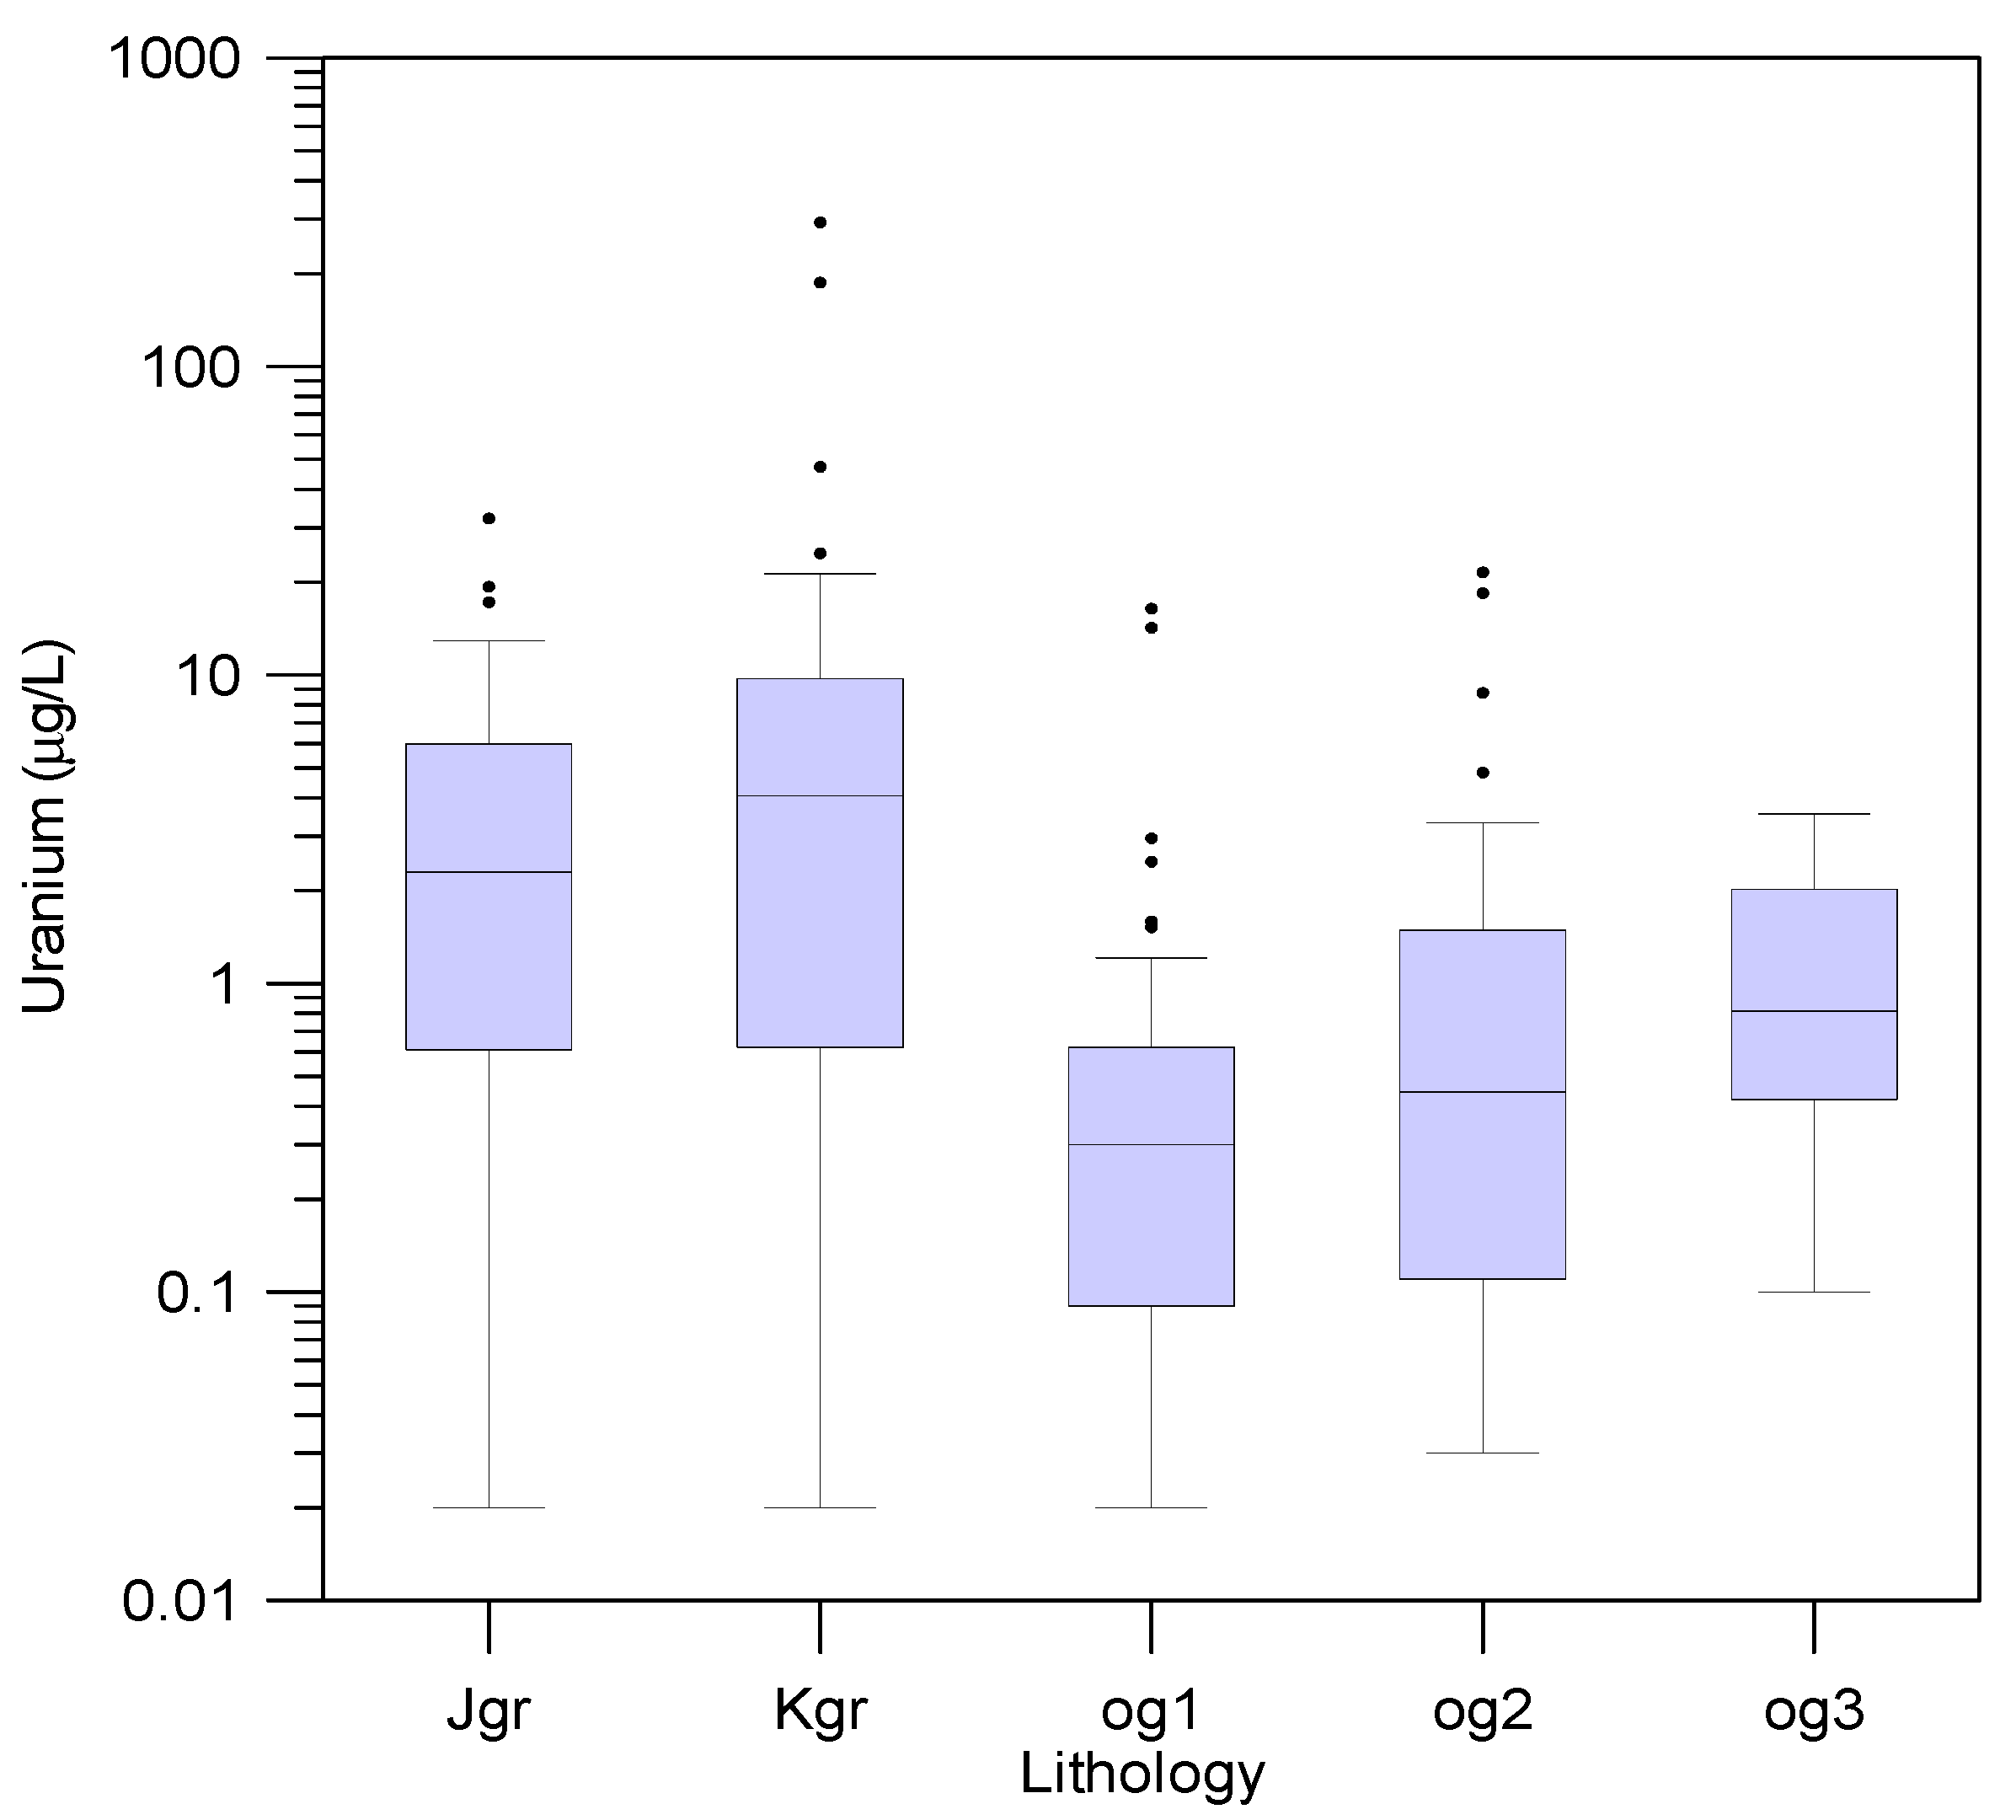
3.3. Uranium Concentrations in Groundwater

As illustrated in Table 1, the uranium concentrations in the 200 groundwater samples from the study area ranged from 0.02 to 293.0 μg/L (median, 0.87 μg/L), which was similar to the median of 0.70 μg/L for 4136 groundwater samples recorded in previous studies throughout Korea [40]. Contrary to current consensus that groundwater uranium concentrations in Korea was highest in Jgr [40], the median uranium concentration in this study is highest in Kgr (4.13 μg/L), whereas that in Jgr was only 2.32 μg/L. The ratio of the uranium concentrations of Kgr to Jgr groundwater was generally similar to that of Kgr to Jgr rocks. The median uranium concentrations in og1, og2, and og3 rocks were similar to that in Jgr rocks, whereas the median uranium concentrations in og1, og2, and og3 groundwater were very low, at only 0.26, 0.45, and 0.80 μg/L, respectively (Table 1; Figure 4). Such low median levels indicate that uranium concentrations are mostly very low in groundwater in the metasedimentary rocks area; only a few sites have very high uranium concentrations in groundwater.
The uranium concentrations in the groundwater were consistently low in the uranium-mineralized zone, as well as in nearby metasedimentary rock areas throughout the OMB, indicating that no clear relationship exists between uranium enrichment in the groundwater and the existence of the uranium-mineralized zone [27].
Overall, 2.0% of the 200 groundwater samples had uranium concentrations over 30 μg/L, the maximum contaminant level (MCL) set out by the US EPA; 12% of Kgr and 1.8% of Jgr exceeded the MCL, respectively (Table 2).
Figure 5 shows the spatial distribution of uranium concentrations in the 200 groundwater samples. Three out of four samples with uranium concentrations >30 μg/L were located in the Kgr area. Most of the groundwater samples with concentrations of 3–30 μg/L were located in the Kgr and Jgr areas, whereas the concentrations in og1, og2, and og3 areas were <3 μg/L. The differences in the groundwater uranium concentrations are consistent with previous reports of generally high uranium concentrations in groundwater in granite areas, and low concentrations in groundwater in sedimentary and metamorphic rock areas [14]. Although a high uranium-bearing coal bed passes through a part of the og2 area, the median uranium level in og2 groundwater was only 0.45 μg/L.
The uranium concentration in Jgr groundwater was slightly higher than the Korean average for Jgr groundwater (median, 1.37 μg/L; [43]), whereas the uranium concentration in Kgr groundwater in the study area was significantly higher than the Korean average for Kgr groundwater (median, 0.79 μg/L; [43]).
Although the difference in eU between Jgr and og1, og2, and og3 rocks was insignificant, it is noteworthy that the uranium concentration in the groundwater of the metasedimentary rocks was significantly lower than that in Jgr groundwater. This difference can be explained as being due to uranium adsorption and to carbon organic compounds reducing the uranium concentration in the groundwater of the metasedimentary rocks.
As another explanation, it is plausible that uranium in bedrocks tends to dissolve easily at conditions which change from the Ca-HCO3(SO4) type to the Na-HCO3(SO4) type, which is a more alkaline form [44].

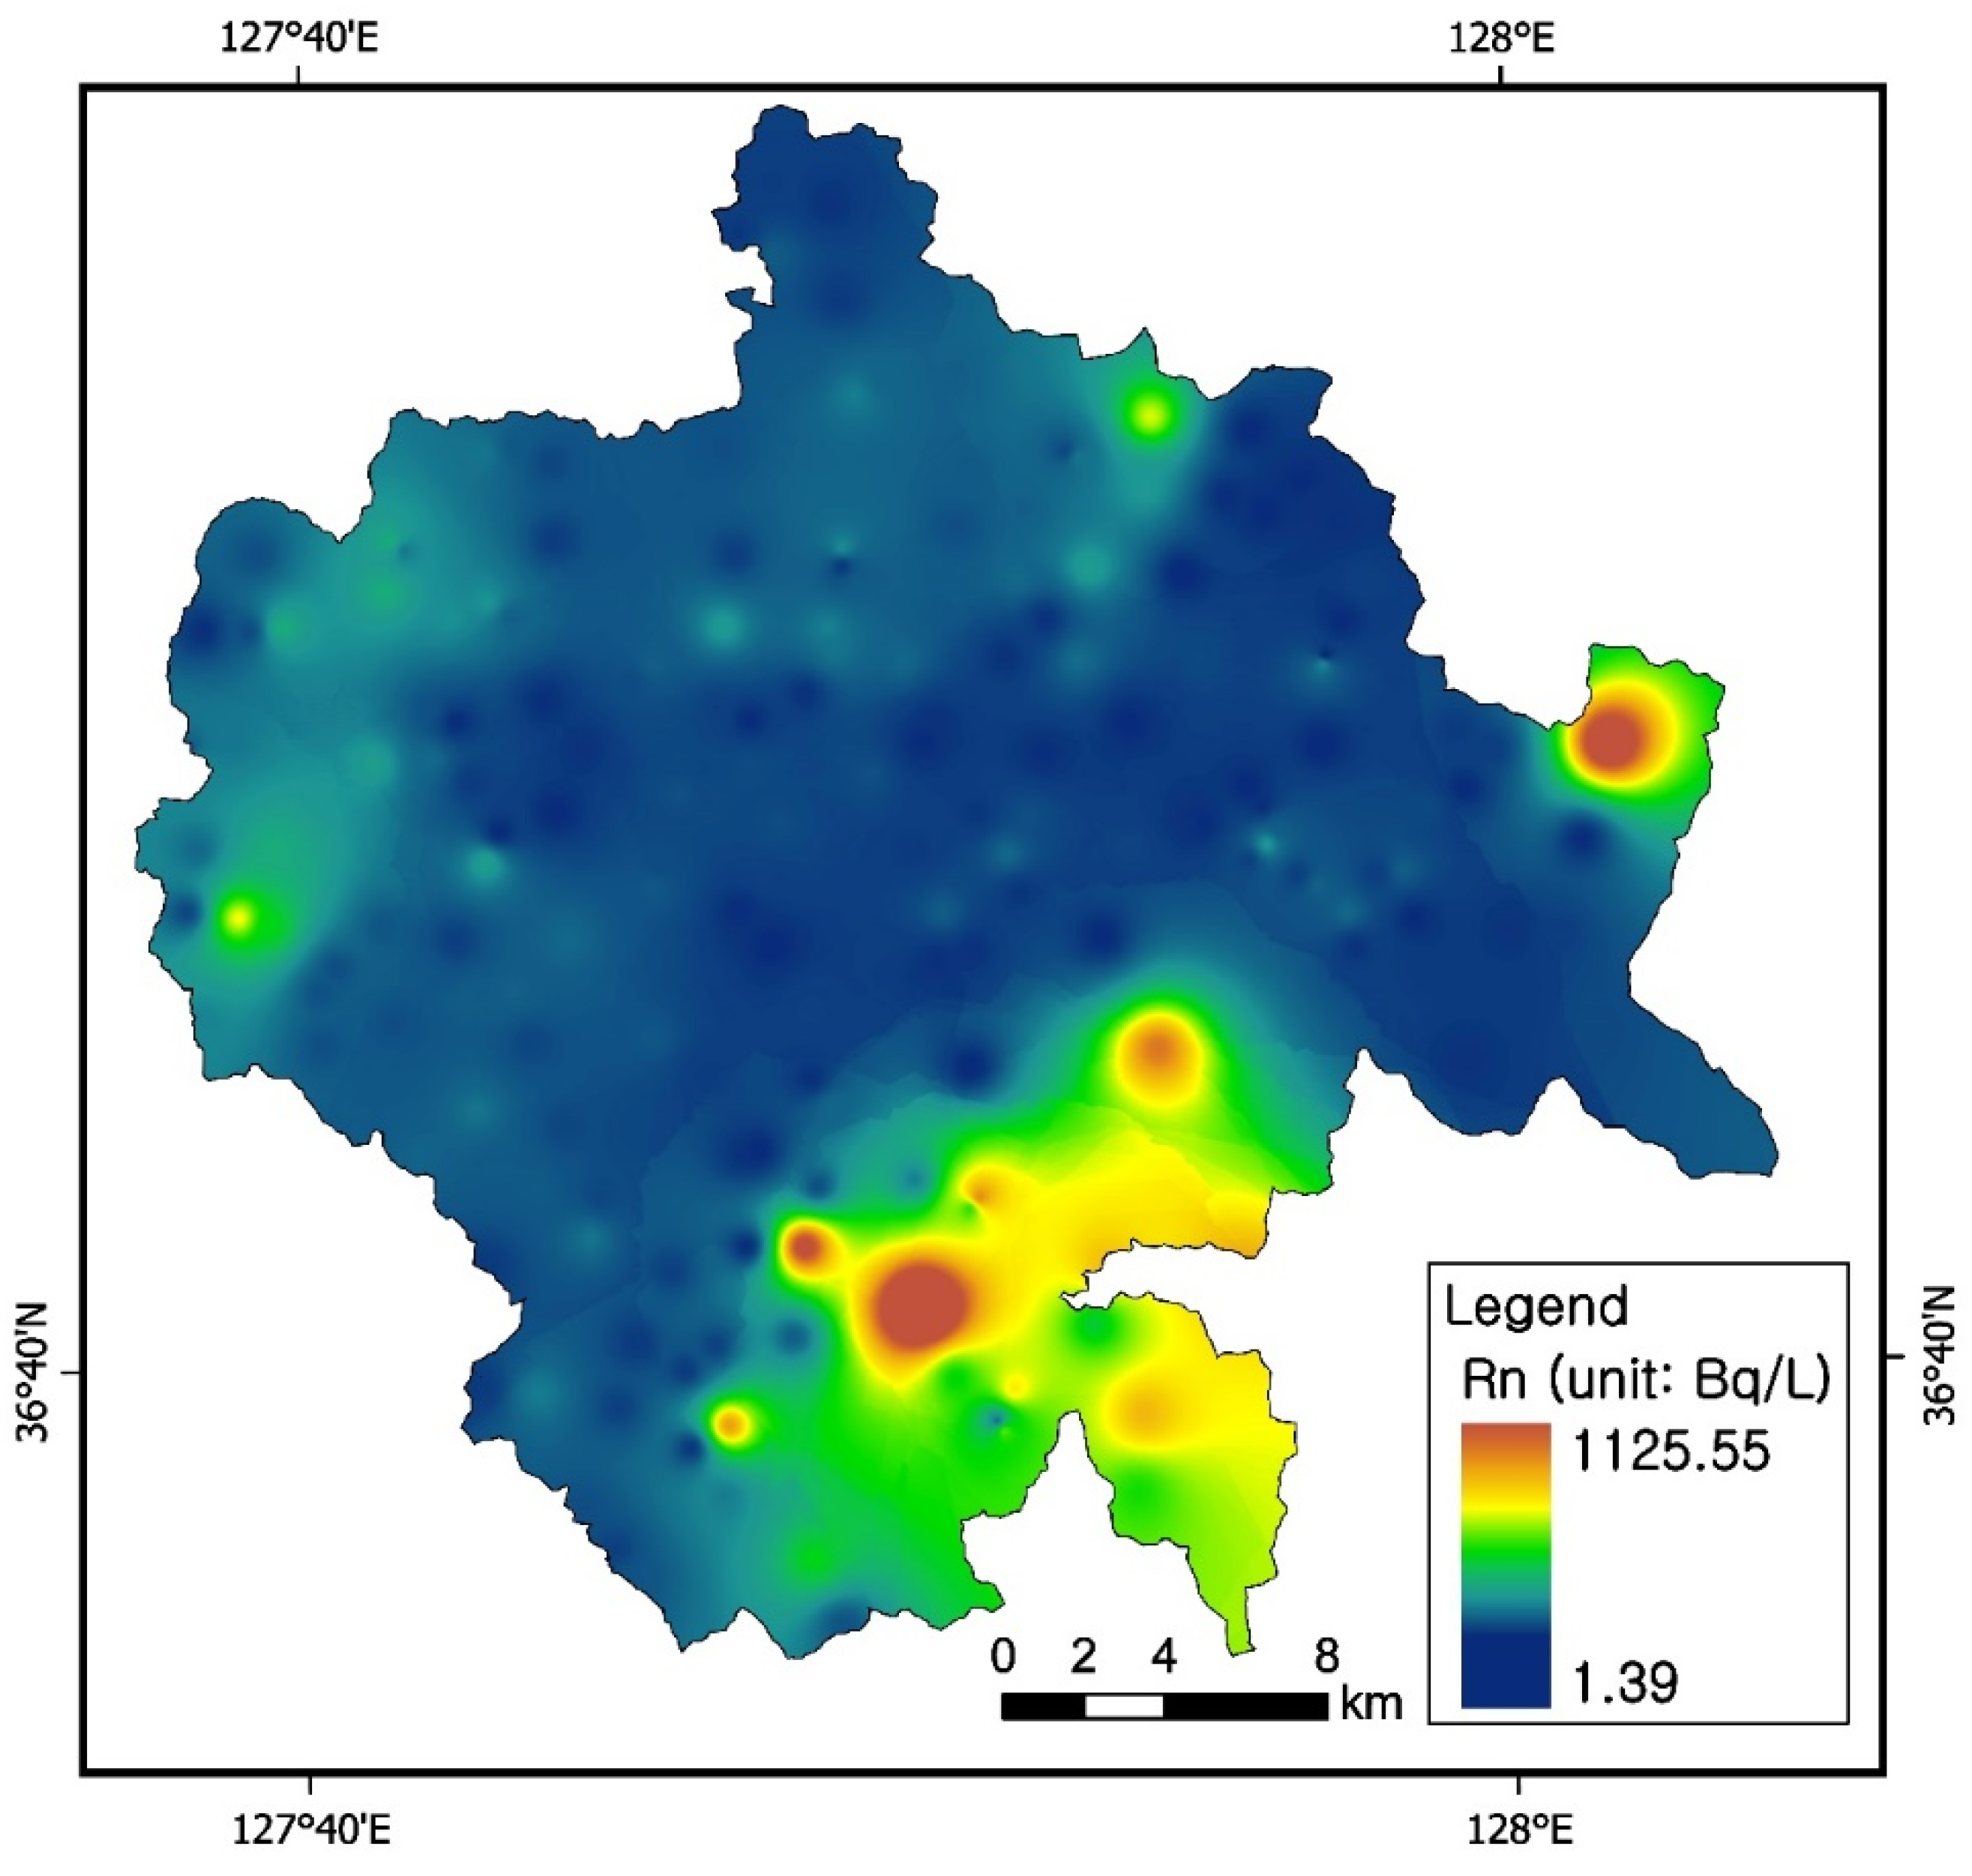
3.4. Radon Concentrations in Groundwater

The radon concentration in the 200 groundwater samples ranged from 1.8 to 1540.9 Bq/L (median, 58.8 Bq/L), which is similar to that measured in 4136 groundwater samples around Korea (52.1 Bq/L) [43]. Overall, 16.5% of the 200 groundwater samples exceeded the level set out by US EPA (148 Bq/L). The percentages of groundwater with radon concentrations >148 Bq/L were 60.0% in Kgr and 25.0% in Jgr, but only 0%, 7.9%, and 2.6% in og1, og2, and og3, respectively (Table 3).
Although the mean value of groundwater radon concentration was highest in Jgr groundwater throughout the Korean peninsula [43], it was highest in Kgr (median, 345.9 Bq/L) in this study; the median concentration in Jgr was only 84.4 Bq/L. Furthermore, the median values in og1 and og3 were low, at 59.6 and 17.9 Bq/L, respectively (Table 1; Figure 6). The median concentration in og2 groundwater was only 38.1 Bq/L, despite the presence of a high uranium-bearing coal bed in part of og2 [24]. The groundwater radon concentrations in og1, og2, and og3 were low relative to those in granite (Jgr and Kgr) because the uranium concentrations in the groundwater in the metasedimentary rock areas were lower than those in the granite groundwater. Because the metasedimentary rocks are less permeable than granite, radon emanation from the former is less [45].
The uranium content in Kgr rock was approximately two times that in Jgr rock, whereas the radon concentration in Kgr groundwater was four times that in Jgr groundwater. The significant difference in groundwater radon concentrations can be explained by the topography; Jgr is located in a lowland area and contains alluvial layers and a relatively thick weathering zone compared with the Kgr area, which is on high land. Hence, it seems that the radon in groundwater in Jgr rock is easily released into the atmosphere, as suggested by Pryzlibski and Gorecka [46].
Radon concentrations in groundwater from the metasedimentary rocks were generally <148 Bq/L (Figure 7). Several groundwater samples from og1, og2, and og3 contained high levels of radon, but these samples were taken from wells along the boundary between Kgr and Jgr, and may have been affected by granite intrusion [14]. For example, the surface geology of wells (sample G181) with high levels of radon in the groundwater was classified as og2, but the geology 50 m below the wells was identified as Kgr [47]. The groundwater radon concentration in og2 rock, part of which contained a high-uranium coal bed, was low, with values similar to the average radon concentrations in groundwater in the study area.
The high uranium level in groundwater is only confined to limited areas. Such a distributional pattern in granitic aquifers is common in Korea [29,48]. Overall, the uranium level cannot explain the distribution of radon in groundwater, as shown in previous studies [29,49].

3.5. Correlation Coefficients of Physicochemical Components in Groundwater

Table 4 shows the correlation matrix for hydrogeological components in 200 groundwater samples. Bold values in the table indicate moderate to strong correlation coefficients (−0.50< or >0.50). Pearson’s correlation coefficients among hydrogeological components indicated water–rock interaction. Some correlations suggest water–rock interaction in metasedimentary rocks typical of calcareous rocks: Ca is positively correlated with HCO3 (0.73), Mg (0.62), SO4 (0.58), Cl (0.54), and NO3 (0.48), respectively, while Mg is also related to HCO3 (0.64), Cl (0.56), SO4 (0.50), and Sr (0.47), respectively. K is also related with Mg (0.54), Cl (0.42), and Ca (0.40). Overall, some components are correlated to each other: pH is negatively related to Eh (−0.43), while it is positively related to F (0.43). Na is highly related to F (0.81), while Eh is related only to F (−0.41). Electrical conductivity (EC) is closely related to dissolved ion concentrations, typical of calcareous aquifer with host rocks of metamorphic rocks: Ca (0.64), HCO3 (0.60), SO4 (0.52) and Mg (0.50). Theses relations reflect water–rock interactions in granitic aquifers.
Though uranium is positively associated with radon with 0.26, uranium cannot clearly explain the distribution of radon in groundwater. This result indicates that both behave independently in groundwater. It is common that the elevated uranium levels are not always related to high radon levels [48,50,51]. Radon has a slightly linear correlation with Na (0.31), Mg (−0.30), and F (0.36) at p < 0.05. However, uranium behavior in groundwater is assumed as being independent of other components. Fluoride is considered to be a powerful geochemical marker indicative of hydrological conditions favorable for high levels of radon generation in granitic rocks [52].
Table 4. Correlation matrix for hydrogeological components in 200 groundwater samples. Bold values indicate moderate to strong correlation coefficients (−0.50< or >0.50). Comp: components. Correlation is significant at the 0.05 level (2-tailed).
Comp.pHECEhDOKNaCaMgSiO2SrFClNO3SO4HCO3RnU
pH1.00
EC−0.021.00
Eh−0.43−0.181.00
DO−0.18−0.170.291.00
K−0.120.270.060.041.00
Na0.210.33−0.31−0.23−0.041.00
Ca0.020.640.01−0.080.40−0.091.00
Mg−0.030.50−0.10−0.130.54−0.020.621.00
SiO2−0.040.11−0.02−0.01−0.13−0.010.170.191.00
Sr0.070.28−0.19−0.110.160.190.190.47−0.061.00
F0.430.15−0.41−0.21−0.220.81−0.19−0.270.050.021.00
Cl−0.110.48−0.04−0.030.420.250.540.560.180.200.051.00
NO3−0.360.450.110.120.310.000.480.300.210.04−0.200.351.00
SO4−0.010.52−0.10−0.160.320.190.580.500.040.36−0.010.440.271.00
HCO30.290.60−0.22−0.280.320.340.730.640.070.320.200.350.070.391.00
Rn−0.09−0.130.040.04−0.22 *0.31 *−0.26 *−0.30 *0.11−0.120.36 *−0.03−0.03−0.12−0.181.00
U0.080.04−0.040.03−0.060.20 *0.03−0.06−0.010.050.30 *0.01−0.070.040.120.261.00
* p ≤ 0.05.
However, uranium has very low coefficients with other components; that is, its behavior in groundwater is assumed to be independent of other components. In general, water–rock interaction leads to an increase in dissolved carbonate concentrations in groundwater, so that uranyl ions tend to form uranyl–carbonate complexes [53]. U(VI) adsorption was enhanced by decreasing the concentration of carbonate in water, which means that the desorption increased with the increase in the carbonate concentration in groundwater [54,55]. Our results show that there is no significant correlation between uranium and Ca or bicarbonate species.

3.6. Uranium Speciation and Saturation Indices in Groundwater

In this study, we calculated the geochemical speciation of uranium ions and saturation indices (S.I) in groundwater (Table 5). Of 200 groundwater samples, 17 samples with high uranium concentrations above 10 ug/L were chosen for the calculation.
According to chemical speciation calculated from Visual MINTEQ, uranium speciation is largely dominated by carbonate complexes Ca2UO2(CO3)3(aq) and CaUO2(CO3)32, with minor UO2(CO3)22, UO2CO3(aq), and UO2(CO3)34 species. The former two components constitute >95% of the total dissolved uranium in groundwater, with the exception of the G44 sample from Og2 unit, having 71%. Uranium’s mobility is even higher upon formation of uranyl carbonate complexes, including UO2(CO3)22 and UO2(CO3)34, under neutral to alkaline conditions [56]. Therefore, it is evident that uranium ions in the Goesan groundwater behave as uranyl–carbonate complexes. A high uranium level in groundwater is associated with oxidizing, carbonate-rich conditions [53,57]. The mobility of uranium is enhanced under oxidizing conditions due to its tendency to form stable uranyl carbonate complexes governing uranium speciation in bicarbonate-dominated waters [55]. Under oxidizing conditions, U6+ is present in groundwater in the form of the uranyl ion UO22+, together with uranium carbonate complexes. U is highly mobile in the hexavalent form, forming soluble complexes primarily with carbonate and phosphate under near-neutral pH conditions [58].
The saturation index of possible minerals is useful to understand the behavior of uraniferous minerals in groundwater. It provides information on what types of mineral phases can precipitate in groundwater, or on whether they are in equilibrium state or not. Table 6 illustrates saturation indices of representative minerals in the selected 17 groundwater samples with high uranium concentrations above 10 ug/L.
According to saturation indices calculated from Visual MINTEQ, the groundwater samples are oversaturated with silica-rich minerals such as quartz and amorphous silica, or nearly oversaturated with chalcedony. In addition, carbonate minerals such as calcite, aragonite, magnesite and dolomite, together with sulphates such as anhydrite and gypsum, are slightly undersaturated. In addition, some rare minerals such as fluorite, celestite, strontianite are relatively undersaturated. These saturation indices indicate that silica and carbonate minerals are gradually precipitated to further reduce their concentrations in groundwater during the water–rock interactions while other minerals still tend to dissolve from the aquifers. These saturation patterns are closely linked to the geological properties of the host rocks composed of granites and metasedimentary rocks.
No uranium oxide minerals precipitate, which can affect the uranium mobility in groundwater. However, we could identify the presence of some uraniferous mineral phases in groundwater samples, according to the calculation of the saturation index. The most promising mineral phases in groundwater are uranium hydroxides and uranium nitrogen hydroxides. For instance, the groundwater chemistry of the G181 sample from Kgr aquifer, whose uranium level is highest, at 293 μg/L, among all samples investigated here, is oversaturated with schoepite (SI = 1.64) and UO2(OH)2 (SI = 1.42). Because schoepite [(UO2)4O(OH)6(H2O)6] forms easily at oxidizing conditions primarily via the oxidation of U(IV) to U(VI) during the early stage of uraninite weathering, its precipitation occurs most widely at oxidation conditions such as surface or shallow groundwater [59,60,61]. The total concentration of uranium is limited by the solubility of schoepite, and therefore, schoepite is quite stable in most groundwater containing calcium ions [55,62].
Based on the saturation index, uranium-nitrogen-hydroxides include UO2(NO3)2(s), UO2(NO3)2:2H2O(s), UO2(NO3)2:3H2O(s) and UO2(NO3)2:6H2O(s), related to the hydrogeological properties of the groundwater enriched with NO3-N nitrogen. However, because these SI values are extremely low, it is evident that none of the uranium-nitrogen-hydroxides would precipitate in the aquifers. Therefore, uranium mobility is not limited by the nitrogen complexes.
According to the thermodynamic calculation using the Visual MINTEQ and the correlation coefficients, the water–rock interaction in the groundwater system supported the suggestion that silicate weathering is a fundamental process. It can be inferred that uranium hydroxides are possibly still undersaturated, indicating that water–rock interaction can further proceed in the aquifers. Considering saturation indices, uraninite is not present in the groundwater because uranium concentration and hydrogeochemical conditions enriched in bicarbonates are not satisfactory to precipitate uraninite. Instead, uranium hydroxides are the most stable mineral phases.
Table 6. Saturation indices calculated by Visual MINTEQ using geochemical compositions in the groundwater. 1 Og1; 2 Kgr; 3 Og2; 4 Jgr. Kgr: Cretaceous granite; Jgr: Jurassic granite; og1: Ogcheon metasedimentary rocks 1; og2: Ogcheon metasedimentary rocks 2.
Minerals1 G72 G292 G362 G373 G442 G464 G522 G864 G1094 G1244 G1514 G1554 G1573 G1632 G1814 G1821 G195
Anhydrite−2.21−2.93−3.24−3.19−3.73−3.72−3.51−2.92−2.23−3.30−3.16−3.08−1.52−3.23−3.08 −2.40
Aragonite0.63−0.56−0.72−0.880.21−1.11−0.59−0.140.14−0.31−1.62−0.42−0.62−0.78−3.40−1.40−0.07
Brucite−4.32−6.86−6.00−6.28−4.07−6.56−5.90−5.35−5.29−4.89−7.31−5.86−6.57−5.93−6.30−7.37−5.32
Calcite0.78−0.41−0.58−0.730.35−0.96−0.450.010.28−0.16−1.48−0.27−0.47−0.64−3.25−1.260.08
Dolomite1.21−2.01−1.71−2.150.26−2.63−1.61−0.620.19−0.15−3.02−1.21−1.33−1.74−7.17−2.93−0.01
Gypsum−1.96−2.68−2.99−2.94−3.48−3.47−3.26−2.67−1.98−3.05−2.91−2.83−1.27−2.98−2.83 −2.15
Chrysotile−0.89−7.71−5.12−5.660.14−6.66−4.83−3.25−3.15−2.02−8.99−4.82−6.57−4.95−6.15−8.97−3.48
Magnesite−0.72−2.75−2.29−2.56−1.24−2.82−2.31−1.78−1.25−1.14−2.70−2.09−2.00−2.25−5.07−2.83−1.23
Fluorite−2.85−0.44−0.84−0.89−0.60−1.04−0.77−0.91−2.30−3.34−2.65−1.38−2.45−1.99−0.52−2.64−2.18
Celestite−2.29−3.41−3.88−3.90−3.48−4.36−3.46−3.25−2.26−2.88−3.05−2.52−1.47−2.96−3.41 −1.98
Cristobalite−0.160.230.240.40−0.030.310.240.200.160.120.280.180.370.220.170.360.04
Strontianite−0.78−2.37−2.68−2.92−0.86−3.08−1.87−1.80−1.21−1.21−2.83−1.18−1.89−1.84−5.05−2.81−0.98
Chalcedony0.040.430.440.600.170.510.440.400.360.320.480.380.570.420.370.560.24
Quartz0.490.880.891.050.620.960.890.850.810.770.930.831.020.870.821.010.69
SiO2(am)−0.77−0.38−0.37−0.21−0.64−0.30−0.37−0.41−0.45−0.49−0.33−0.43−0.24−0.39−0.44−0.25−0.57
Schoepite−7.09−4.78−4.47−4.10−6.45−4.00−4.85−4.48−6.40−5.45−3.89−4.91−5.61−4.411.64−4.23−6.16
UO2(NO3)2(s)−37.43−34.68−34.46−32.96−41.32−34.18−34.96−33.03−34.83−36.42−31.02−36.16−32.81−33.70−27.30−29.46−35.49
UO2(NO3)2:2H2O(s)−30.13−27.38−27.17−25.66−34.03−26.88−27.66−25.73−27.53−29.12−23.73−28.87−25.51−26.41−20.01−22.16−28.19
UO2(NO3)2:3H2O(s)−28.67−25.92−25.71−24.20−32.56−25.42−26.20−24.27−26.07−27.66−22.27−27.41−24.05−24.95−18.55−20.70−36.73
UO2(NO3)2:6H2O(s)−27.32−24.58−24.36−22.86−31.22−24.08−24.86−22.92−24.73−26.32−20.92−26.06−22.71−23.60−17.21−19.36−25.39
UO2(OH)2−7.32−5.00−4.69−4.32−4.32−4.22−5.07−4.70−6.62−5.67−4.11−5.14−5.83−4.631.42−4.45−6.38
UO3(s)−9.40−7.09−6.78−6.31−6.41−6.31−7.16−6.79−8.71−7.76−6.20−7.22−7.92−6.72−0.67−6.54−8.47

3.7. Uranium and Radon Behavior in Groundwater in Relation to Bedrocks

Besides uraninite, the presence of U and Th as substituted elements of monazite, ilmenite, and apatite within K-feldspar and biotite was also important in the radioactivity of groundwater [25,26,48]. Migration of uranium in water–rock systems is largely controlled by uranium solution–mineral equilibria and sorption reactions [63,64]. The uranyl ion typically complexes with calcium or magnesium and carbonate in oxic groundwater under near-neutral pH, forming U(VI)-calcium-carbonate ternary complexes which are highly mobile [65]. Such results support our findings that there was no relationship between uranium concentration in groundwater and the OMB bedrocks.
Uranium concentrations in groundwater were always low in the U-mineralized zone throughout the OMB [27]. Uranium-bearing minerals like uraninite and brannerite were observed and the average concentrations of metals such as Ba, U, and Mo and organic carbon was highest in the OMB black slate in the Goesan area [21].
Hence, high uranium level-containing bedrocks did not significantly affect radioactivity levels in groundwater, possibly due to the adsorption effects of organic matter, the low solubility of various uranium-bearing minerals, and reduction environments.
In Korea, uranium and radon concentrations in groundwater are highly dependent on geologic units. For example, radon concentrations are higher in granitic areas and lower in other geologic units such as metamorphic rocks or sedimentary rocks, as discussed by Cho et al. [10] for 3818 community groundwater system (CGS) wells. Uranium mineralization or uranium minerals including uraninite are commonly found in granitic rocks worldwide [11,13,17,18]. Because the occurrence of secondary uranium minerals is associated with granitic rocks and dykes along with fractures, localization of uranium minerals was emphasized [66,67]. More recently, it has been suggested that the considerable variation in dissolved uranium concentrations might be due to local differences in uranium concentrations in the granite body itself [27,29].
Elevated levels of radon in groundwater are widespread, often underlain by felsic crystalline rocks or granitic rocks [9,68]. The migration of radon is associated with a complex hydrochemical process because the rate of radon migration is controlled by pore size distribution, the degree of pore saturation with water and interconnectivity, the uranium content, shearing or fracture properties, the water–rock ratio and the efficiency with which radon is emanated from the bedrocks [53,69,70,71]. That is because radioactive concentrations in bedrocks are not the only predominant factors in groundwater.
In summary, uranium and radon concentrations in Kgr groundwater are mostly higher than those in groundwater of other bedrocks, which implies that uraniferous minerals in black shale of the OMB are not a potential candidate for the main source materials in groundwater.

4. Conclusions

The high uranium concentrations in groundwater from Kgr were primarily due to the high uranium content in the Kgr rock. No direct correlation was found between uranium concentration and radon concentration in groundwater samples. Radon has a slightly linear correlation with Na (0.31), Mg (−0.30), and F (0.36). However, uranium behavior in groundwater is assumed as being independent of other components. Uranium speciation was largely dominated by carbonate complexes Ca2UO2(CO3)3(aq) and CaUO2(CO3)32−, with minor UO2(CO3)22−, UO2CO3(aq), and UO2(CO3)34− species. Uranium-containing bedrocks in OMB did not significantly affect radioactive levels in groundwater, possibly due to the adsorption effects of organic matter, the presence of various uranium-bearing minerals, and reduction environments. Uranium hydroxides are the most stable mineral phases if they can be saturated with groundwater. Hence, uranium hydroxides play an important role in controlling uranium mobility in groundwater. Nevertheless, oxidation prevention of uranium-containing bedrocks needs to be systematically managed.

Author Contributions

For the research B.-W.C. and C.-O.C. prepared and wrote the article. They were responsible for field works and data analyses. D.-S.K. and M.-S.K. treated sample preparation. J.-H.H. prepared graphic data. All authors have read and agreed to the published version of the manuscript.

Funding

This research was supported by the Basic Research Project (GP2017-008-2019) of the Korea Institute of Geoscience and Mineral Resources (KIGAM) and by the National Institute of Environmental Research (NIER-SP2015-386).

Institutional Review Board Statement

Not applicable.

Informed Consent Statement

Not applicable.

Data Availability Statement

Not applicable.

Conflicts of Interest

The authors declare no conflict of interest. The funders had no role in the design of the study; in the collection, analyses, or interpretation of data; in the writing of the manuscript, or in the decision to publish the results.

References

  1. Kurttio, P.; Auvinen, A.; Salonen, L.; Saha, H.; Pekkanen, J.; Mäkeläinen, I.; Väisänen, S.B.; Penttilä, I.M.; Komulainen, H. Renal effects of uranium in drinking water. Environ. Health Perspect. 2002, 110, 337–342. [Google Scholar] [CrossRef]
  2. NRC (National Research Council). Risk Assessment of Radon in Drinking Water; National Academy Press: Washington, DC, USA, 1999; p. 279. [Google Scholar]
  3. National Institute of Environmental Research (NIER). Study on the Radionuclide Concentrations in Groundwater (I); KIGAM Report; Ministry of Environment of Korea: Seoul, Korea, 1998; p. 338.
  4. National Institute of Environmental Research (NIER). A Detailed Study on the Radionuclide Concentrations in the Groundwater (II); NIER Report; Ministry of Environment of Korea: Seoul, Korea, 2009; p. 273.
  5. National Institute of Environmental Research (NIER). Study on the Naturally Occurring Radionuclides in Groundwater of the Two High Potential Areas; KIGAM Report; Ministry of Environment of Korea: Seoul, Korea, 2011; p. 253.
  6. National Institute of Environmental Research (NIER). Study on the Naturally Occurring Radionuclides in Groundwater of the High Potential Area; KIGAM Report; Ministry of Environment of Korea: Seoul, Korea, 2012; p. 245.
  7. National Institute of Environmental Research (NIER). Studies on the Naturally Occurring Radionuclides in Groundwater; KIGAM Report; Ministry of Environment of Korea: Sejong, Korea, 2016; p. 213.
  8. Yun, U.; Kim, T.S.; Kim, H.K.; Kim, M.S.; Cho, S.Y.; Choo, C.O.; Cho, B.W. Natural radon reduction rate of the community groundwater system in South Korea. Appl. Radiat. Isot. 2017, 126, 23–25. [Google Scholar] [CrossRef] [PubMed]
  9. Cho, B.-W.; Choo, C.O.; Kim, M.S.; Hwang, J.; Yun, U.; Lee, S. Spatial relationships between radon and topographical, geological, and geochemical factors and their relevance in all of South Korea. Environ. Earth Sci. 2015, 74, 5155–5168. [Google Scholar] [CrossRef]
  10. Cho, B.W.; Kim, H.K.; Kim, M.S.; Hwang, J.H.; Yoon, U.; Cho, S.Y.; Choo, C.O. Radon concentrations in the community groundwater system of South Korea. Environ. Monit. Assess. 2019, 191, 189. [Google Scholar] [CrossRef]
  11. Cuney, M.; Friederich, M. Physicochemical and crystal-chemical controls on accessory mineral paragenesis in granitoids: Implications for uranium metallogenesis. Bull. Miner. 1987, 110, 235–247. [Google Scholar] [CrossRef]
  12. Loomis, D.P. Radon-222 Concentration and Aquifer Lithology in North Carolina. Ground Water Monit. Remediat. 1987, 7, 33–39. [Google Scholar] [CrossRef]
  13. Förster, H.-J. The chemical composition of uraninite in Variscan granites of the Erzgebirge, Germany. Miner. Mag. 1999, 63, 239–252. [Google Scholar] [CrossRef]
  14. Skeppström, K.; Olofsson, B. Uranium and radon in groundwater. Eur. Water 2007, 17–18, 51–62. [Google Scholar]
  15. Brindha, K.; Elango, L. Occurrence of uranium in groundwater of a shallow granitic aquifer and its suitability for domestic use in southern India. J. Radioanal. Nucl. Chem. 2012, 295, 357–367. [Google Scholar] [CrossRef]
  16. Boekhout, F.; Gérard, M.; Kanzari, A.; Michel, A.; Déjeant, A.; Galoisy, L.; Calas, G.; Descostes, M. Uranium migration and retention during weathering of a granitic waste rock pile. Appl. Geochem. 2015, 58, 123–135. [Google Scholar] [CrossRef]
  17. Kanzari, A.; Gérard, M.; Boekhout, F.; Galoisy, L.; Calas, G.; Descostes, M. Impact of incipient weathering on uranium migration in granitic waste rock piles from former U mines (Limousin, France). J. Geochem. Explor. 2017, 183, 114–126. [Google Scholar] [CrossRef] [Green Version]
  18. Rajaraman, H.S.; Bisht, B.S.; Jeyagopal, A.V.; Verma, M.B. Uranium Mineralization in Leucogranite of Mastipuram Area, Wanaparti District, Telangana—A New Find. J. Geol. Soc. India 2019, 93, 487–491. [Google Scholar] [CrossRef]
  19. Kim, J.W. Geochemistry and genesis of the Guryongsan (Ogcheon) uraniferous black slate. J. Korean Inst. Min. Geol. 1989, 22, 35–63. [Google Scholar]
  20. Chi, S.J.; Yun, U.; Hong, Y.K.; Kim, T.G.; Kim, K.H. Surface intensity of radioactivity and uranium contents according to geology in Ogcheon Belt. In Proceedings of the 38th Meeting of the Korea Society of Economic and Environmental Geology, Seoul, Korea, 21–22 April 2005; pp. 55–59. [Google Scholar]
  21. Kim, Y.; Seo, J.; Kang, S.-A.; Choi, S.-G.; Lee, Y.J. Geochemistry and uranium mineralogy of the black slate in the Okcheon Metamorphic Belt, South Korea. Geochem. J. 2015, 49, 443–452. [Google Scholar] [CrossRef]
  22. Lee, D.J. Mineralogy of low-grade uranium ores in the black slate of the Ogcheon Group, Korea. J. Korean Inst. Min. Geol. 1986, 19, 133–146. [Google Scholar]
  23. Jeong, G.Y. Mineralogy and geochemistry of metalliferous black slates in the okcheon metamorphic belt, Korea: A metamorphic analogue of black shales in the South China block. Miner. Depos. 2006, 41, 469–481. [Google Scholar] [CrossRef]
  24. Shin, D.-B.; Kim, S.-J. Geochemical Characteristics of Black Slate and Coaly Slate from the Uranium Deposit in Deokpyeong Area. Econ. Environ. Geol. 2011, 44, 373–386. [Google Scholar] [CrossRef] [Green Version]
  25. Choo, C.O. Characteristics of uraniferous minerals in Daebo granite and significance of mineral species. J. Miner. Soc. Korea 2002, 15, 11–21. [Google Scholar]
  26. Hwang, J. Occurrence of U-minerals and Source of U in Groundwater in Daebo Granite, Daejeon Area. J. Eng. Geol. 2013, 23, 399–407. [Google Scholar] [CrossRef] [Green Version]
  27. Moon, S.H.; Hwang, J.; Lee, J.Y.; Hyun, S.P.; Bae, B.K.; Park, Y. Establishing the Origin of Elevated Uranium Concentrations in Groundwater near the Central Ogcheon Metamorphic Belt, Korea. J. Environ. Qual. 2013, 42, 118–128. [Google Scholar] [CrossRef] [Green Version]
  28. Yun, U.; Kim, M.S.; Jeong, D.H.; Hwang, J.H.; Cho, B.W. Uranium and radon concentrations in groundwater of the Daejeon granite area: Comparison with other granite areas. J. Eng. Geol. 2018, 28, 631–643. [Google Scholar]
  29. Cho, B.W.; Choo, C.O. Geochemical Behavior of Uranium and Radon in Groundwater of Jurassic Granite Area, Icheon, Middle Korea. Water 2019, 11, 1278. [Google Scholar] [CrossRef] [Green Version]
  30. Hwang, J. Hydrochemistry of Groundwater in the Uraniferous Sedimentary Rocks of the Ogcheon Belt, Republic of Korea. J. Korean Earth Sci. Soc. 2010, 31, 205–213. [Google Scholar] [CrossRef] [Green Version]
  31. Shin, I.; Kim, S.; Shin, D. Mineralogy and sulfur isotope compositions of the uraniferous black slates in the Ogcheon Metamorphic Belt, South Korea. J. Geochem. Explor. 2016, 169, 1–12. [Google Scholar] [CrossRef]
  32. Lee, B.J.; Kim, D.H.; Choi, H.I.; Kee, W.S.; Park, K.H. 1: 250,000 Explanatory Note of the Daejeon Sheet; Korea Institute of Geology, Mining and Materials: Daejeon, Korea, 1996; p. 59.
  33. Lee, C.H.; Kim, J.H. Geological Report of the Goesan Sheet (1:50,000), Korea; Geological and Mining Institute Korea: Seoul, Korea, 1972; pp. 1–22. [Google Scholar]
  34. International Atomic Energy Agency (IAEA). Gamma Ray Surveys in Uranium Exploration; Technical Reports Series No. 186; IAEA: Vienna, Austria, 1979; p. 91. [Google Scholar]
  35. International Atomic Energy Agency (IAEA). Guidelines for Radioelement Mapping using Gamma Ray Spectrometry Data; Technical Reports Series, No. 1363; IAEA: Vienna, Austria, 2003; p. 173. [Google Scholar]
  36. Adabanija, M.A.; Anie, O.; Oladunjoye, M.A. Radioactivity and gamma ray spectrometry of basement rocks in Okene area, southwestern Nigeria. NRIAG J. Astron. Geophys. 2020, 9, 71–84. [Google Scholar] [CrossRef] [Green Version]
  37. Chiozzi, P.; De Felice, P.; Pasquale, V.; Russo, D.; Verdoya, M. Field γ-ray spectrometry on the Vulcano island (Aeolian Arc, Italy). Appl. Radiat. Isot. 1999, 51, 247–253. [Google Scholar] [CrossRef]
  38. Correia, G.G.; Duarte, L.V.; Pereira, A.; Silva, R.L. Outcrop gamma-ray spectrometry: Applications to the Sinemurian–Pliensbachian organic-rich facies of the Lusitanian Basin (Portugal). J. Iber. Geol. 2013, 38. [Google Scholar] [CrossRef] [Green Version]
  39. Korun, M.; Modec, P.M.; Vodenik, B.; Zorko, B. Uranium-induced background of germanium gamma-ray spectrometers. Appl. Radiat. Isot. 2012, 70, 1480–1484. [Google Scholar] [CrossRef]
  40. Bartier, P.M.; Keller, C. Multivariate interpolation to incorporate thematic surface data using inverse distance weighting (IDW). Comput. Geosci. 1996, 22, 795–799. [Google Scholar] [CrossRef]
  41. Gustafsson, J.P. Visual MINTEQ; Version 3.1; Department of Land and Water Resources Engineering, KTH Institute of Technology: Stockholm, Sweden, 2013; Available online: https://vminteq.lwr.kth.se (accessed on 1 March 2020).
  42. Appleton, J.; Miles, J. A statistical evaluation of the geogenic controls on indoor radon concentrations and radon risk. J. Environ. Radioact. 2010, 101, 799–803. [Google Scholar] [CrossRef]
  43. National Institute of Environmental Research (NIER). Studies on the Naturally Occurring Radionuclides in Groundwater in Multi-Geologic Areas; KIGAM Report; Ministry of Environment of Korea: Seoul, Korea, 2015; p. 203.
  44. Salonen, L. 238U series radionuclides as a source of increased radioactivity in groundwater originating from Finnish bedrock. In Future Groundwater Resources at Risk, Proceedings of the Helsinki Conference, Helsinki, Finland, 13–16 June 1994; IAHS (International Association of Hydrological Sciences): Wallingford, UK, 1994; Volume 222, pp. 71–84. [Google Scholar]
  45. Scheib, C.; Appleton, J.; Miles, J.; Hodgkinson, E. Geological controls on radon potential in England. Proc. Geol. Assoc. 2013, 124, 910–928. [Google Scholar] [CrossRef] [Green Version]
  46. Pryzlibski, T.; Gorecka, J. 222Rn activity concentration differences in groundwater of three Variscan granitoid massifs in the Sudetes (NE Borhemian Massif, SW Poland). J. Environ. Radioact. 2014, 134, 43–53. [Google Scholar] [CrossRef] [PubMed]
  47. Kim, M.S.; Yang, J.H.; Jeong, C.H.; Kim, H.K.; Kim, D.W.; Jo, B.U. Geochemical Origins and Occurrences of Natural Radioactive Materials in Borehole Groundwater in the Goesan Area. J. Eng. Geol. 2014, 24, 535–550. [Google Scholar] [CrossRef]
  48. Jeong, C.-H.; Kim, N.-W.; Kim, M.-S.; Lee, Y.-J.; Kim, T.-S.; Han, J.-S.; Jo, B.-U. Occurrence of Natural Radioactive Materials in Borehole Groundwater and Rock Core in the Icheon Area. J. Eng. Geol. 2012, 22, 95–111. [Google Scholar] [CrossRef]
  49. Atkins, M.L.; Santos, I.R.; Perkins, A.; Maher, D.T. Dissolved radon and uranium in groundwater in a potential coal seam gas development region (Richmond River Catchment, Australia). J. Environ. Radioact. 2016, 154, 83–92. [Google Scholar] [CrossRef] [PubMed]
  50. Murphy, W.M.; Shock, E.L. Environmental aqueous geochemistry of actinides. In Uranium: Mineralogy, Geochemistry and the Environment; Mineralogical Society of America: Chantilly, VA, USA, 1995; Volume 38, pp. 221–253. [Google Scholar]
  51. Vinson, D.; Vengosh, A.; Hirschfeld, D.; Dwyer, G.S. Relationships between radium and radon occurrence and hydrochemistry in fresh groundwater from fractured crystalline rocks, North Carolina (USA). Chem. Geol. 2008, 260, 159–171. [Google Scholar] [CrossRef] [Green Version]
  52. Veeger, A.; Ruderman, N. Hydrogeologic Controls on Radon-222 in a Buried Valley-Fractured Bedrock Aquifer System. Groundwater 1998, 36, 596–604. [Google Scholar] [CrossRef]
  53. Langmuir, D. Actinides and their daughter and fission products. In Aqueous Environmental Geochemistry; Prentice Hall Inc.: Upper Saddle River, NJ, USA, 1997; pp. 486–557. [Google Scholar]
  54. Katsoyiannis, I.A. Carbonate effects and pH-dependence of uranium sorption onto bacteriogenic iron oxides: Kinetic and equilibrium studies. J. Hazard. Mater. 2007, 139, 31–37. [Google Scholar] [CrossRef]
  55. Maher, K.; Bargar, J.R.; Brown, J.G.E. Environmental Speciation of Actinides. Inorg. Chem. 2012, 52, 3510–3532. [Google Scholar] [CrossRef]
  56. Abdelouas, A. Uranium Mill Tailings: Geochemistry, Mineralogy, and Environmental Impact. Elements 2006, 2, 335–341. [Google Scholar] [CrossRef]
  57. Kelly, S.D.; Rasbury, T.; Chattopadhyay, S.; Kropf, A.J.; Kemner, K.M. Evidence of a Stable Uranyl Site in Ancient Organic-Rich Calcite. Environ. Sci. Technol. 2006, 40, 2262–2268. [Google Scholar] [CrossRef] [PubMed]
  58. Porcelli, D.; Swarzenski, P.W. The behavior of U- and Th-series nuclides in groundwater. In Uranium-Series Geochemistry; Mineralogical Society of America: Chantilly, VA, USA, 2003; Volume 52, pp. 317–361. [Google Scholar]
  59. Finch, R.; Murakami, T. Systematics, Paragenesis of U minerals. In Uranium: Mineralogy, Geochemistry and the Environment; Mineralogical Society of America: Chantilly, VA, USA, 1999; Volume 38, pp. 91–180. [Google Scholar]
  60. Finch, R.; Ewing, R.C. The corrosion of uraninite under oxidizing conditions. J. Nucl. Mater. 1992, 190, 133–156. [Google Scholar] [CrossRef]
  61. Plášil, J. Oxidation-hydration weathering of uraninite: The current state-of-knowledge. J. Geosci. 2014, 59, 99–114. [Google Scholar] [CrossRef] [Green Version]
  62. Nolan, J.O. Mobilization of Naturally Occurring Uranium in Sediment into Groundwater. Ph.D. Thesis, University of Nebraska, Lincoln, NE, USA, July 2016. [Google Scholar]
  63. Woo, N.; Choi, M.; Lee, K. Assessment of Groundwater Quality and Contamination from Uranium-Bearing Black Shale in Goesan–Boeun Areas, Korea. Environ. Geochem. Health 2002, 24, 264–273. [Google Scholar] [CrossRef]
  64. Hsi, C.-K.D.; Langmuir, D. Adsorption of uranyl onto ferric oxyhydroxides: Application of the surface complexation site-binding model. Geochim. Cosmochim. Acta 1985, 49, 1931–1941. [Google Scholar] [CrossRef]
  65. Campbell, K.; Gallegos, T.; Landa, E. Biogeochemical aspects of uranium mineralization, mining, milling, and remediation. Appl. Geochem. 2015, 57, 206–235. [Google Scholar] [CrossRef] [Green Version]
  66. Asikainen, M.; Kahlos, H. Anomalously high concentrations of uranium, radium and radon in water from drilled wells in the Helsinki region. Geochim. Cosmochim. Acta 1979, 43, 1681–1686. [Google Scholar] [CrossRef]
  67. Bhoopathi, V.; Kumar, S.N.; Sastry, R.S.N.; Srinivas, B. Surface radioactive anomalies at Srisailam sub basin, Cuddapah basin, India. Chin. J. Geochem. 2015, 34, 265–271. [Google Scholar] [CrossRef]
  68. Focazio, M.J.; Tipton, D.; Shapiro, S.D.; Geiger, L.H. The Chemical Quality of Self-Supplied Domestic Well Water in the United States. Ground Water Monit. Remediat. 2006, 26, 92–104. [Google Scholar] [CrossRef]
  69. Bottrell, S.H. Redistribution of uranium by physical processes during weathering and implications for radon production. Environ. Geochem. Health 1993, 15, 21–25. [Google Scholar] [CrossRef] [PubMed]
  70. Przylibski, T.A. Estimating the radon emanation coefficient from crystalline rocks into groundwater. Appl. Radiat. Isot. 2000, 53, 473–479. [Google Scholar] [CrossRef]
  71. Wanty, R.B.; Lawrence, E.P.; Gundersen, L.C.S. A theoretical model for the flux of radon from rock to ground water. In Geologic Controls on Radon; Geological Society of America: Boulder, CO, USA, 1992; pp. 73–78. [Google Scholar] [CrossRef]
Figure 1. Spatial distribution of equivalent uranium (eU) levels at 200 measurement points on the geological map. The study area is marked by an arrow on the map of Korea inserted.
Sustainability 13 11261 g001
Figure 2. Histogram of eU concentrations in bedrock. Kgr: Cretaceous granite; Jgr: Jurassic granite; og1: Ogcheon metasedimentary rocks 1; og2: Ogcheon metasedimentary rocks 2; og3: Ogcheon metasedimentary rocks 3. Max: maximum. eU unit is ppm (mg/kg).
Sustainability 13 11261 g002
Figure 3. Water types plotted on the Piper diagram showing variations according to geology. Kgr: Cretaceous granite; Jgr: Jurassic granite; og1: Ogcheon metasedimentary rocks 1; og2: Ogcheon metasedimentary rocks 2; og3: Ogcheon metasedimentary rocks 3.
Sustainability 13 11261 g003
Figure 4. Box-whisker plots showing uranium concentration in the groundwater for each geology. Kgr: Cretaceous granite; Jgr: Jurassic granite; og1: Ogcheon metasedimentary rocks 1; og2: Ogcheon metasedimentary rocks 2; og3: Ogcheon metasedimentary rocks 3.
Sustainability 13 11261 g004
Figure 5. Spatial distribution of uranium levels in the groundwater on the area map.
Sustainability 13 11261 g005
Figure 6. Box-whisker plots showing radon concentration in the groundwater for each geology. Kgr: Cretaceous granite; Jgr: Jurassic granite; og1: Ogcheon metasedimentary rocks 1; og2: Ogcheon metasedimentary rocks 2; og3: Ogcheon metasedimentary rocks 3.
Sustainability 13 11261 g006
Figure 7. Spatial distribution of radon levels in the groundwater on the area map.
Sustainability 13 11261 g007
Table 2. Distribution of the uranium concentrations in the groundwater from each geology. Kgr: Cretaceous granite; Jgr: Jurassic granite; og1: Ogcheon metasedimentary rocks 1; og2: Ogcheon metasedimentary rocks 2; og3: Ogcheon metasedimentary rocks 3.
U (μg/L)JgrKgrog1og2og3Total
No.%No.%No.%No.%No.%No.%
<1.01832.1728.03479.12257.92360.510452.0
1.1–3.01730.414.0716.31128.91231.64824.0
3.1–10.01425.01144.000.037.937.93115.5
10.1–30.0610.7312.024.725.300.0136.5
30.1<11.8312.000.000.000.042.0
Total5610025100431003810038100200100
Table 3. Distribution of the radon concentrations in the groundwater from each geology. Kgr: Cretaceous granite; Jgr: Jurassic granite; og1: Ogcheon metasedimentary rocks 1; og2: Ogcheon metasedimentary rocks 2; og3: Ogcheon metasedimentary rocks 3.
Rn (Bq/L)JgrKgrog1og2og3Total
No.%No.%No.%No.%No.%No.%
<11.147.100.012.3410.51334.22211.0
11.2–37.058.9312.0818.61436.81334.24321.5
37.1–1483358.9728.03479.11744.71128.910251.0
148.1–300.01221.400.000.012.612.6147.0
300.1<23.61560.000.025.300.0199.5
Total5610025100431003810038100200100
Table 5. Geochemical speciation percent (%) of uranyl ions in groundwater samples with high concentrations above 10 μg/L. Remarks: 1 og1; 2 Kgr; 3 og2; 4 Jgr. Kgr: Cretaceous granite; Jgr: Jurassic granite; og1: Ogcheon metasedimentary rocks 1; og2: Ogcheon metasedimentary rocks 2.
Species1 G72 G292 G362 G373 G442 G464 G522 G864 G109
Ca2UO2(CO3)3 (aq)71.2059.4751.8051.194.9542.3348.2760.6774.48
CaUO2(CO3)32−28.4238.9245.7345.5866.1251.7849.3738.3825.13
UO2(CO3)22−0.040.821.402.000.243.861.130.310.11
UO2(CO3)34−0.350.660.940.9528.701.391.170.630.28
UO2CO3 (aq) 0.060.120.24 0.570.06
UO2H3SiO4+ 0.01 0.02
UO2OH+
UO2(OH)2 (aq) 0.01 0.03
(UO2)2CO3(OH)3 0.01
Species4 G1244 G1514 G1554 G1573 G1632 G1814 G1821 G195
Ca2UO2(CO3)3 (aq)47.9841.7257.6974.1448.0159.5354.3264.86
CaUO2(CO3)32−50.0941.1340.9524.8648.9539.0236.6534.36
UO2(CO3)22−0.599.970.620.601.720.055.370.24
UO2(CO3)34−1.330.990.710.301.170.730.690.54
UO2CO3 (aq)0.025.880.030.100.140.682.80
UO2H3SiO4+ 0.15 0.10
UO2OH+ 0.07 0.04
UO2(OH)2 (aq) 0.04 0.02
(UO2)2CO3(OH)3 0.03
Publisher’s Note: MDPI stays neutral with regard to jurisdictional claims in published maps and institutional affiliations.

