
Application of Macroscopic Fundamental Diagram under Flooding Situation to Traffic Management Measures


Abstract
1. Introduction
2. Data Collection and Extraction
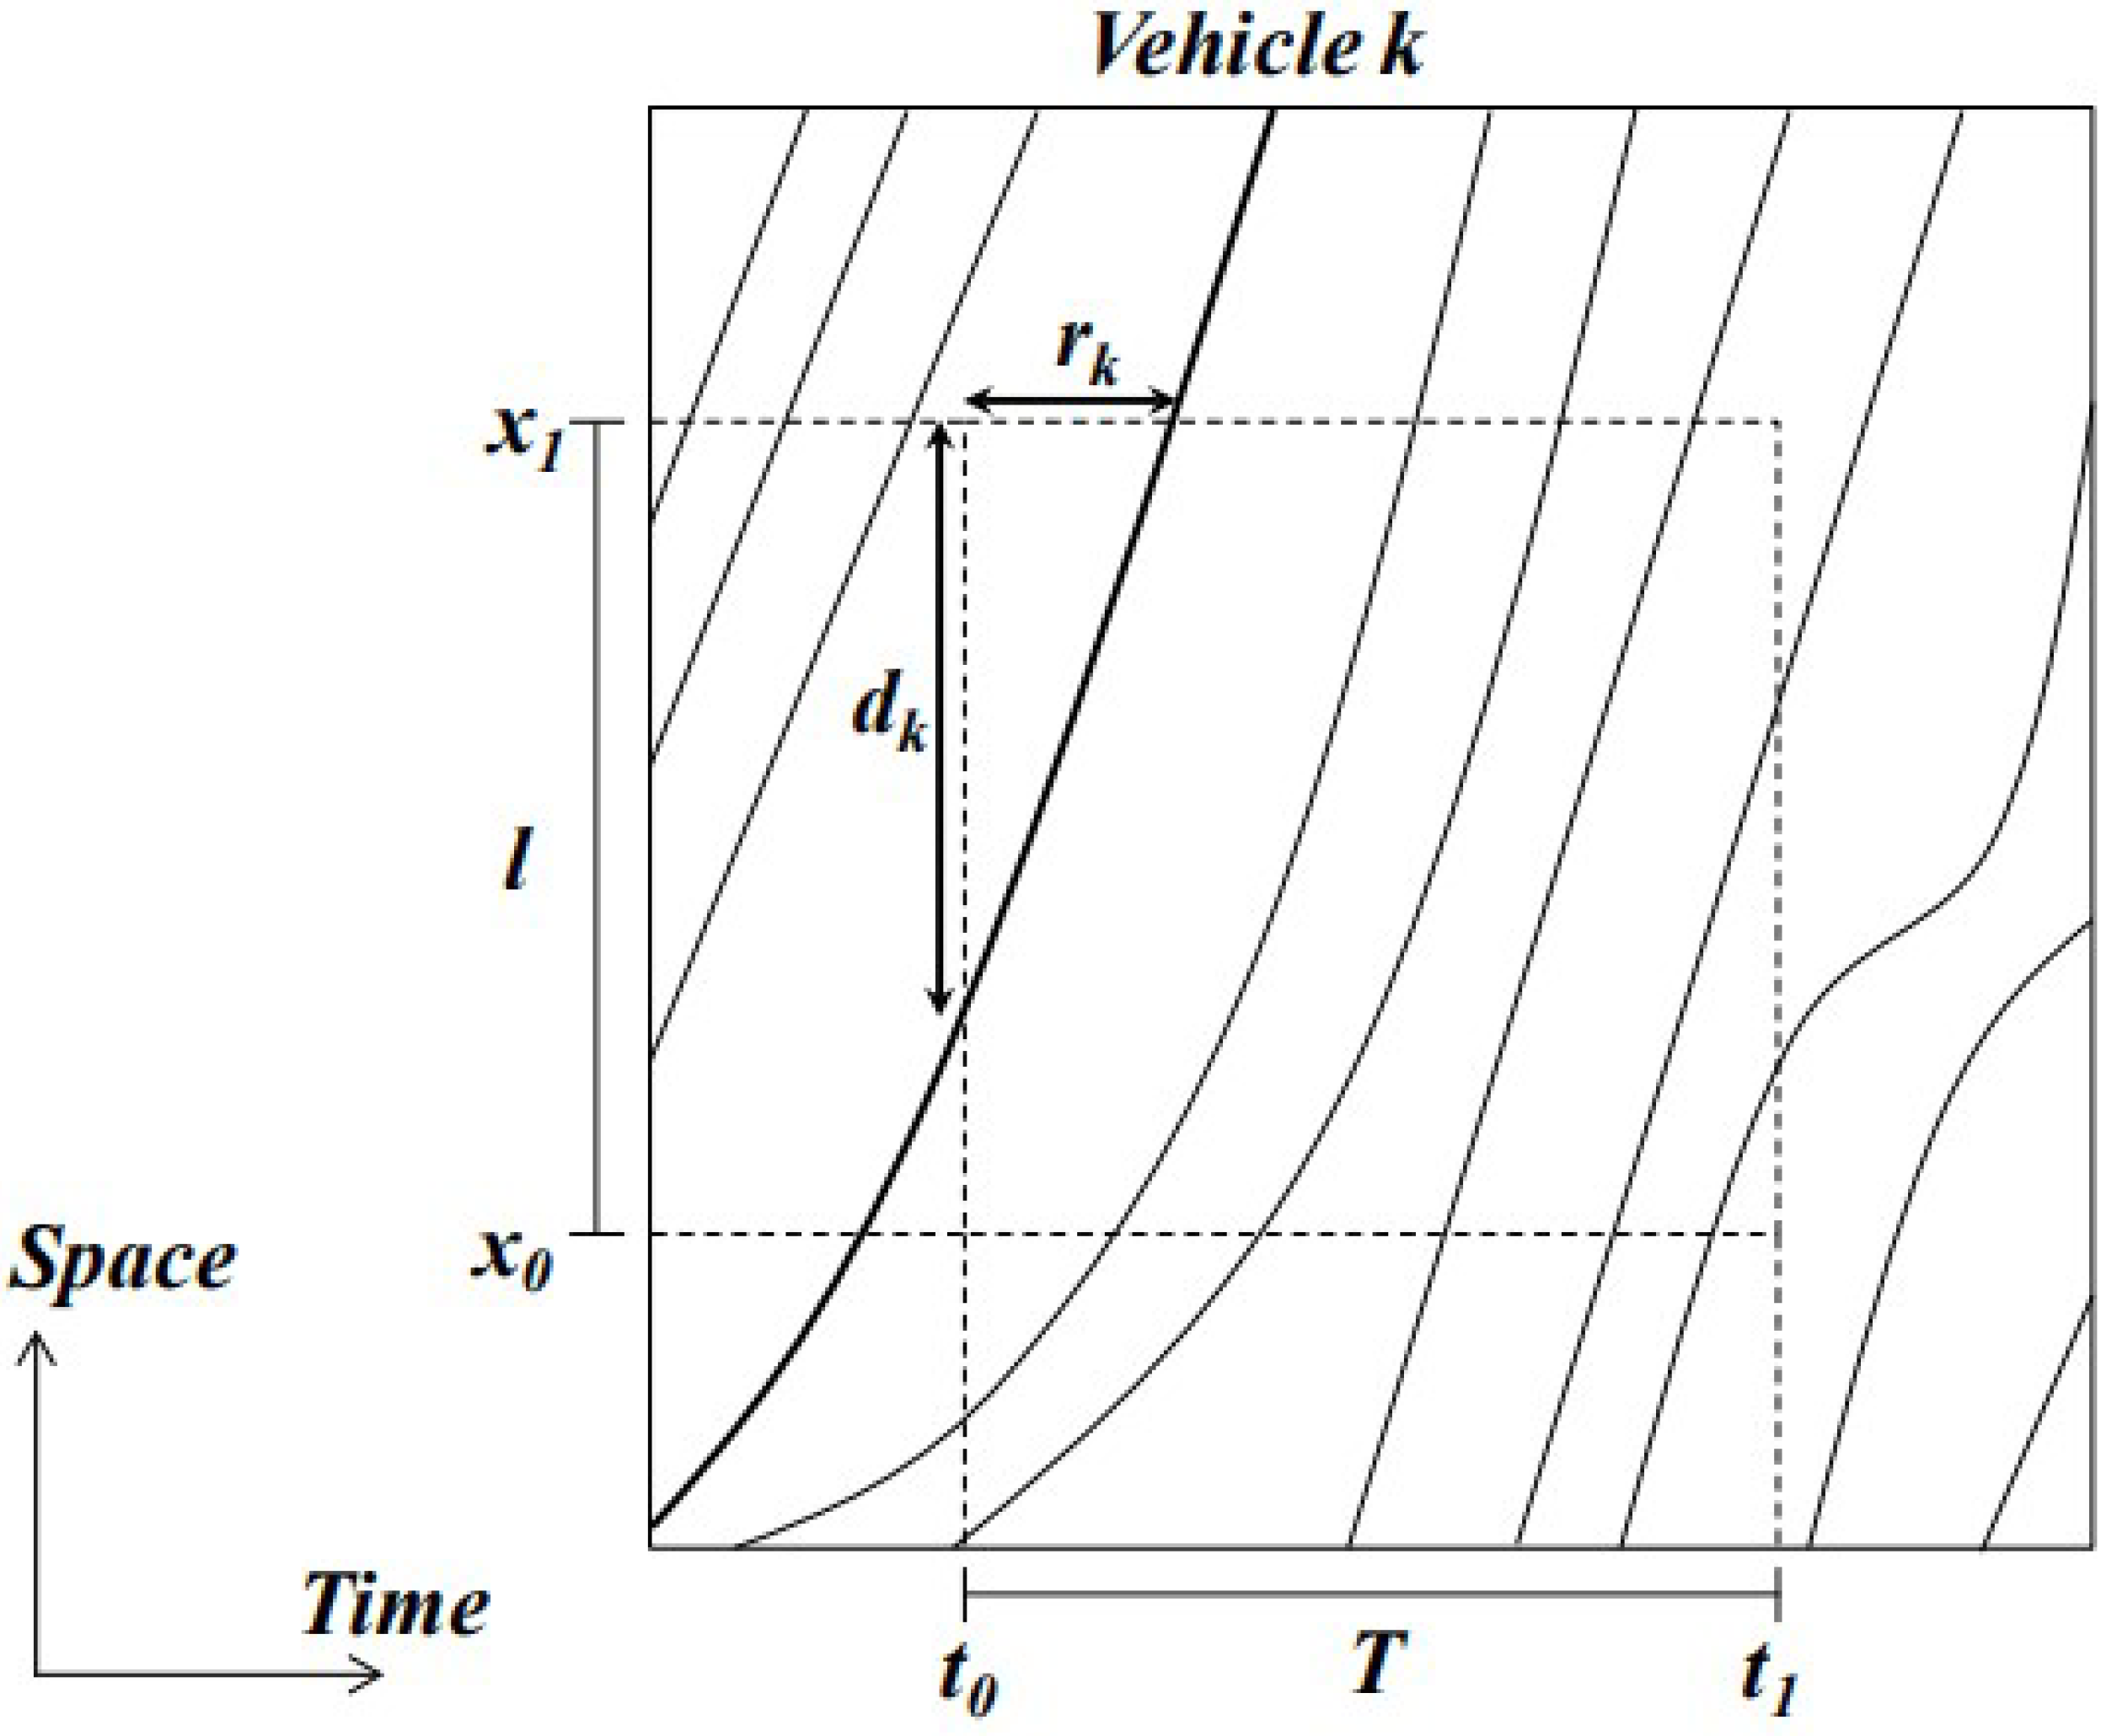
- : distance traveled by vehicle k in section I, and
- : time spent by vehicle k in section i.
- : flow by a vehicle in section i,
- : density by a vehicle in section i,
- : number of lanes in section i, and
- : length of section i.
- : proportion of the number of taxis to full traffic counts in section i.
3. MFD Model Results
4. Development of the Traffic Model
Application of MFD Parameters to the Traffic Model
- : position of the following vehicle at time t;
- : position of the leading vehicle at time t;
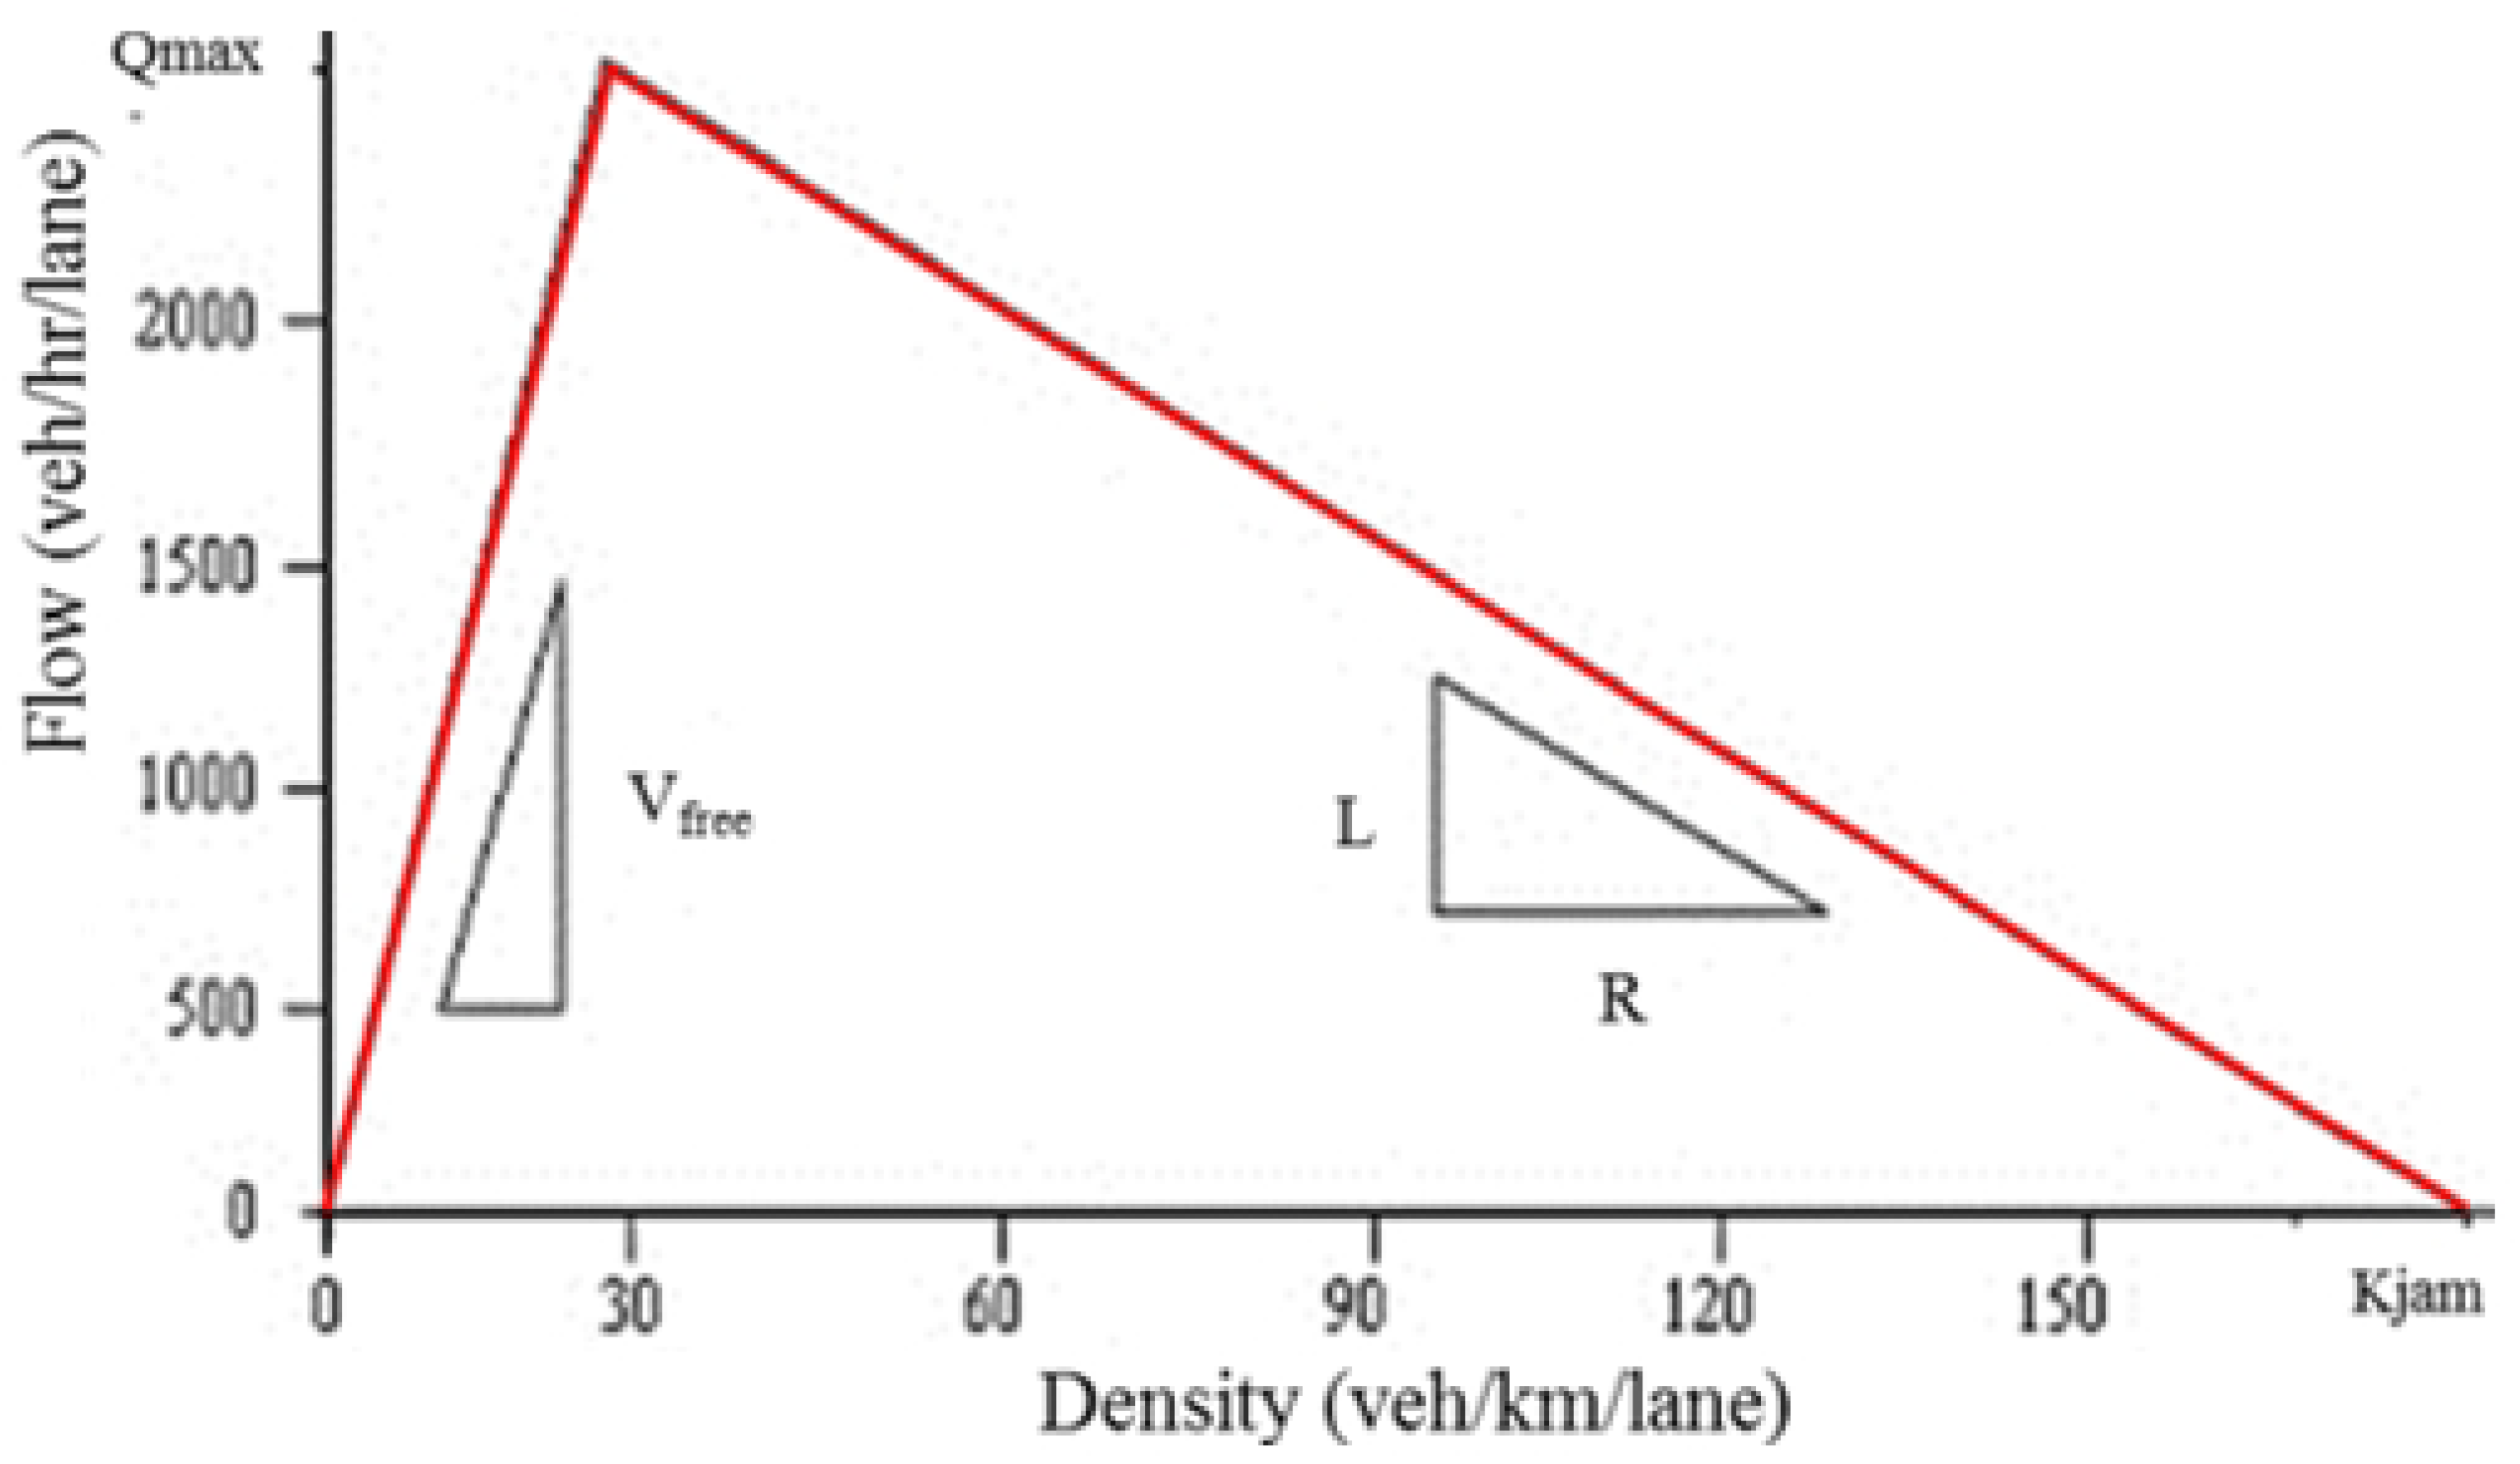
- : free speed of the roadway,
- L: effective length of the following vehicle; and
- R: response time of the following vehicle.
- : maximal possible flow rate (veh/h/lane);
- : jam density (veh/hm/lane); and
- : speed (km/h) at which shock waves move through a platoon of traffic against the direction of flow, for a specific vehicle type.
5. Traffic Management during Flooding
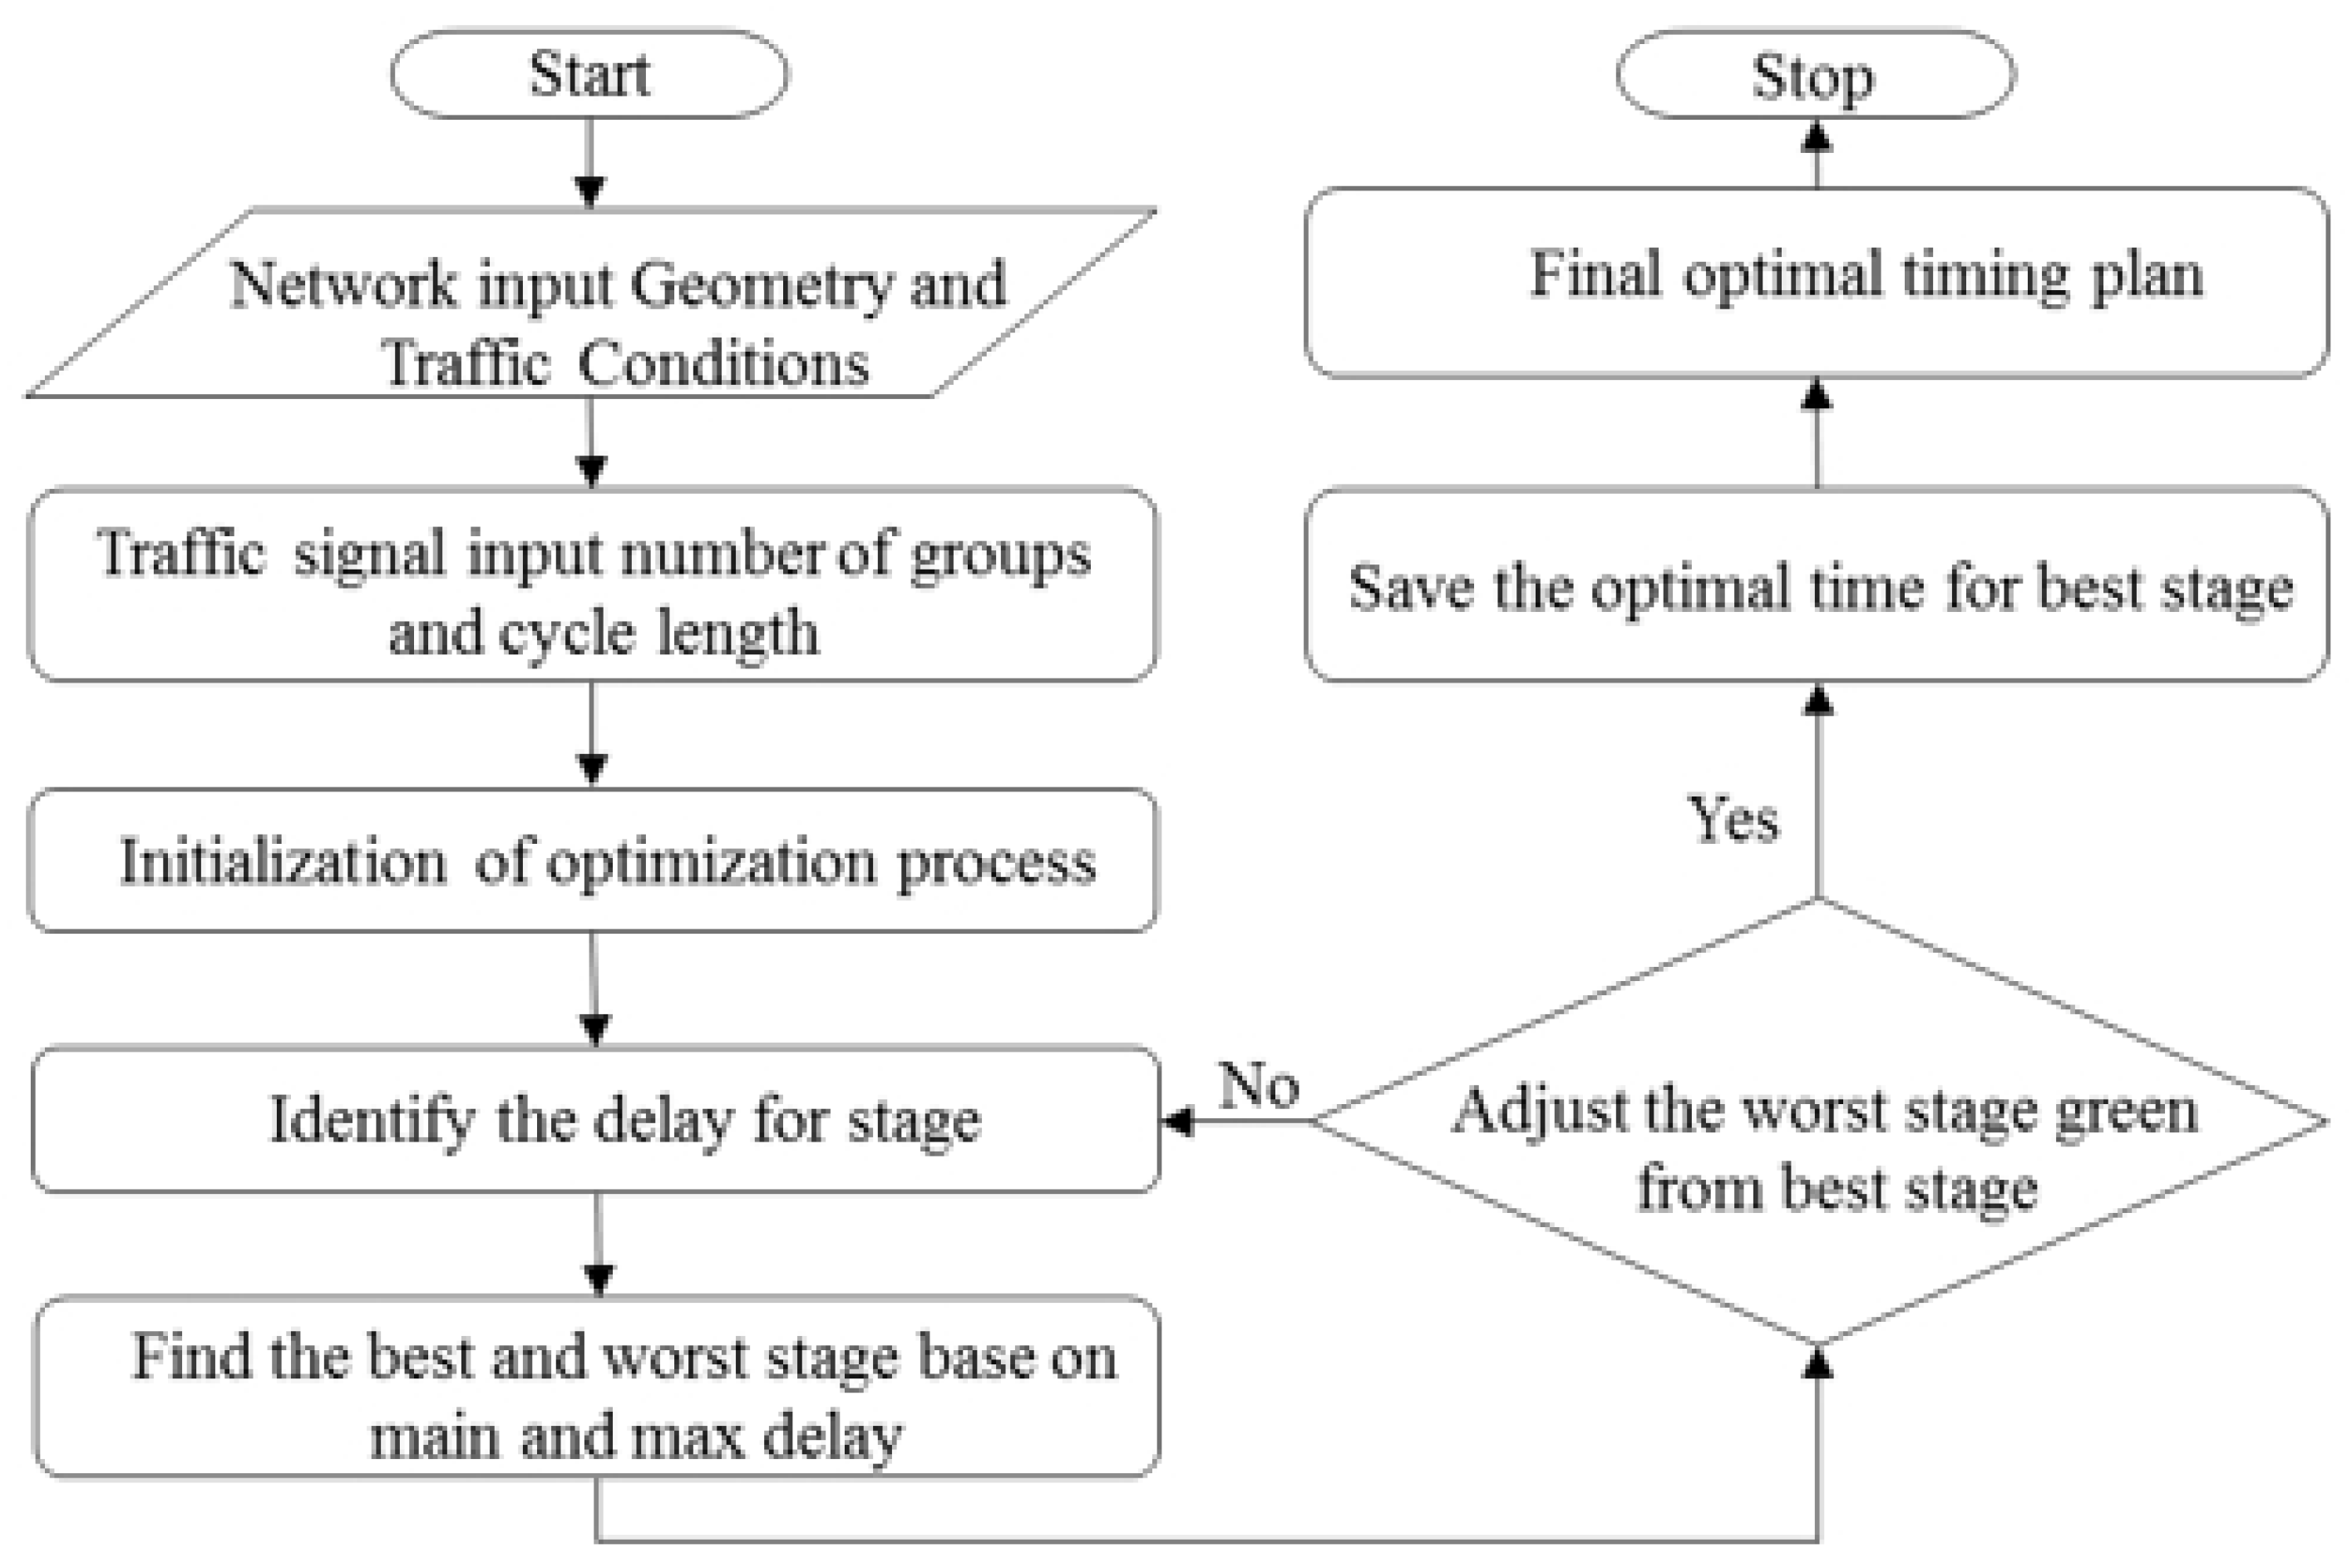
5.1. Optimization of Signal System Management
5.2. Use of Elevated Metropolitan Expressway with Free Tolls
- : generalized cost for movements;
- : left-turn penalty (10 s);
- : right-turn penalty (30 s);
- : facility penalty (fuel and distance cost);
- : toll penalty.
5.3. Results of Traffic Management
6. Conclusions and Discussion
- (1)
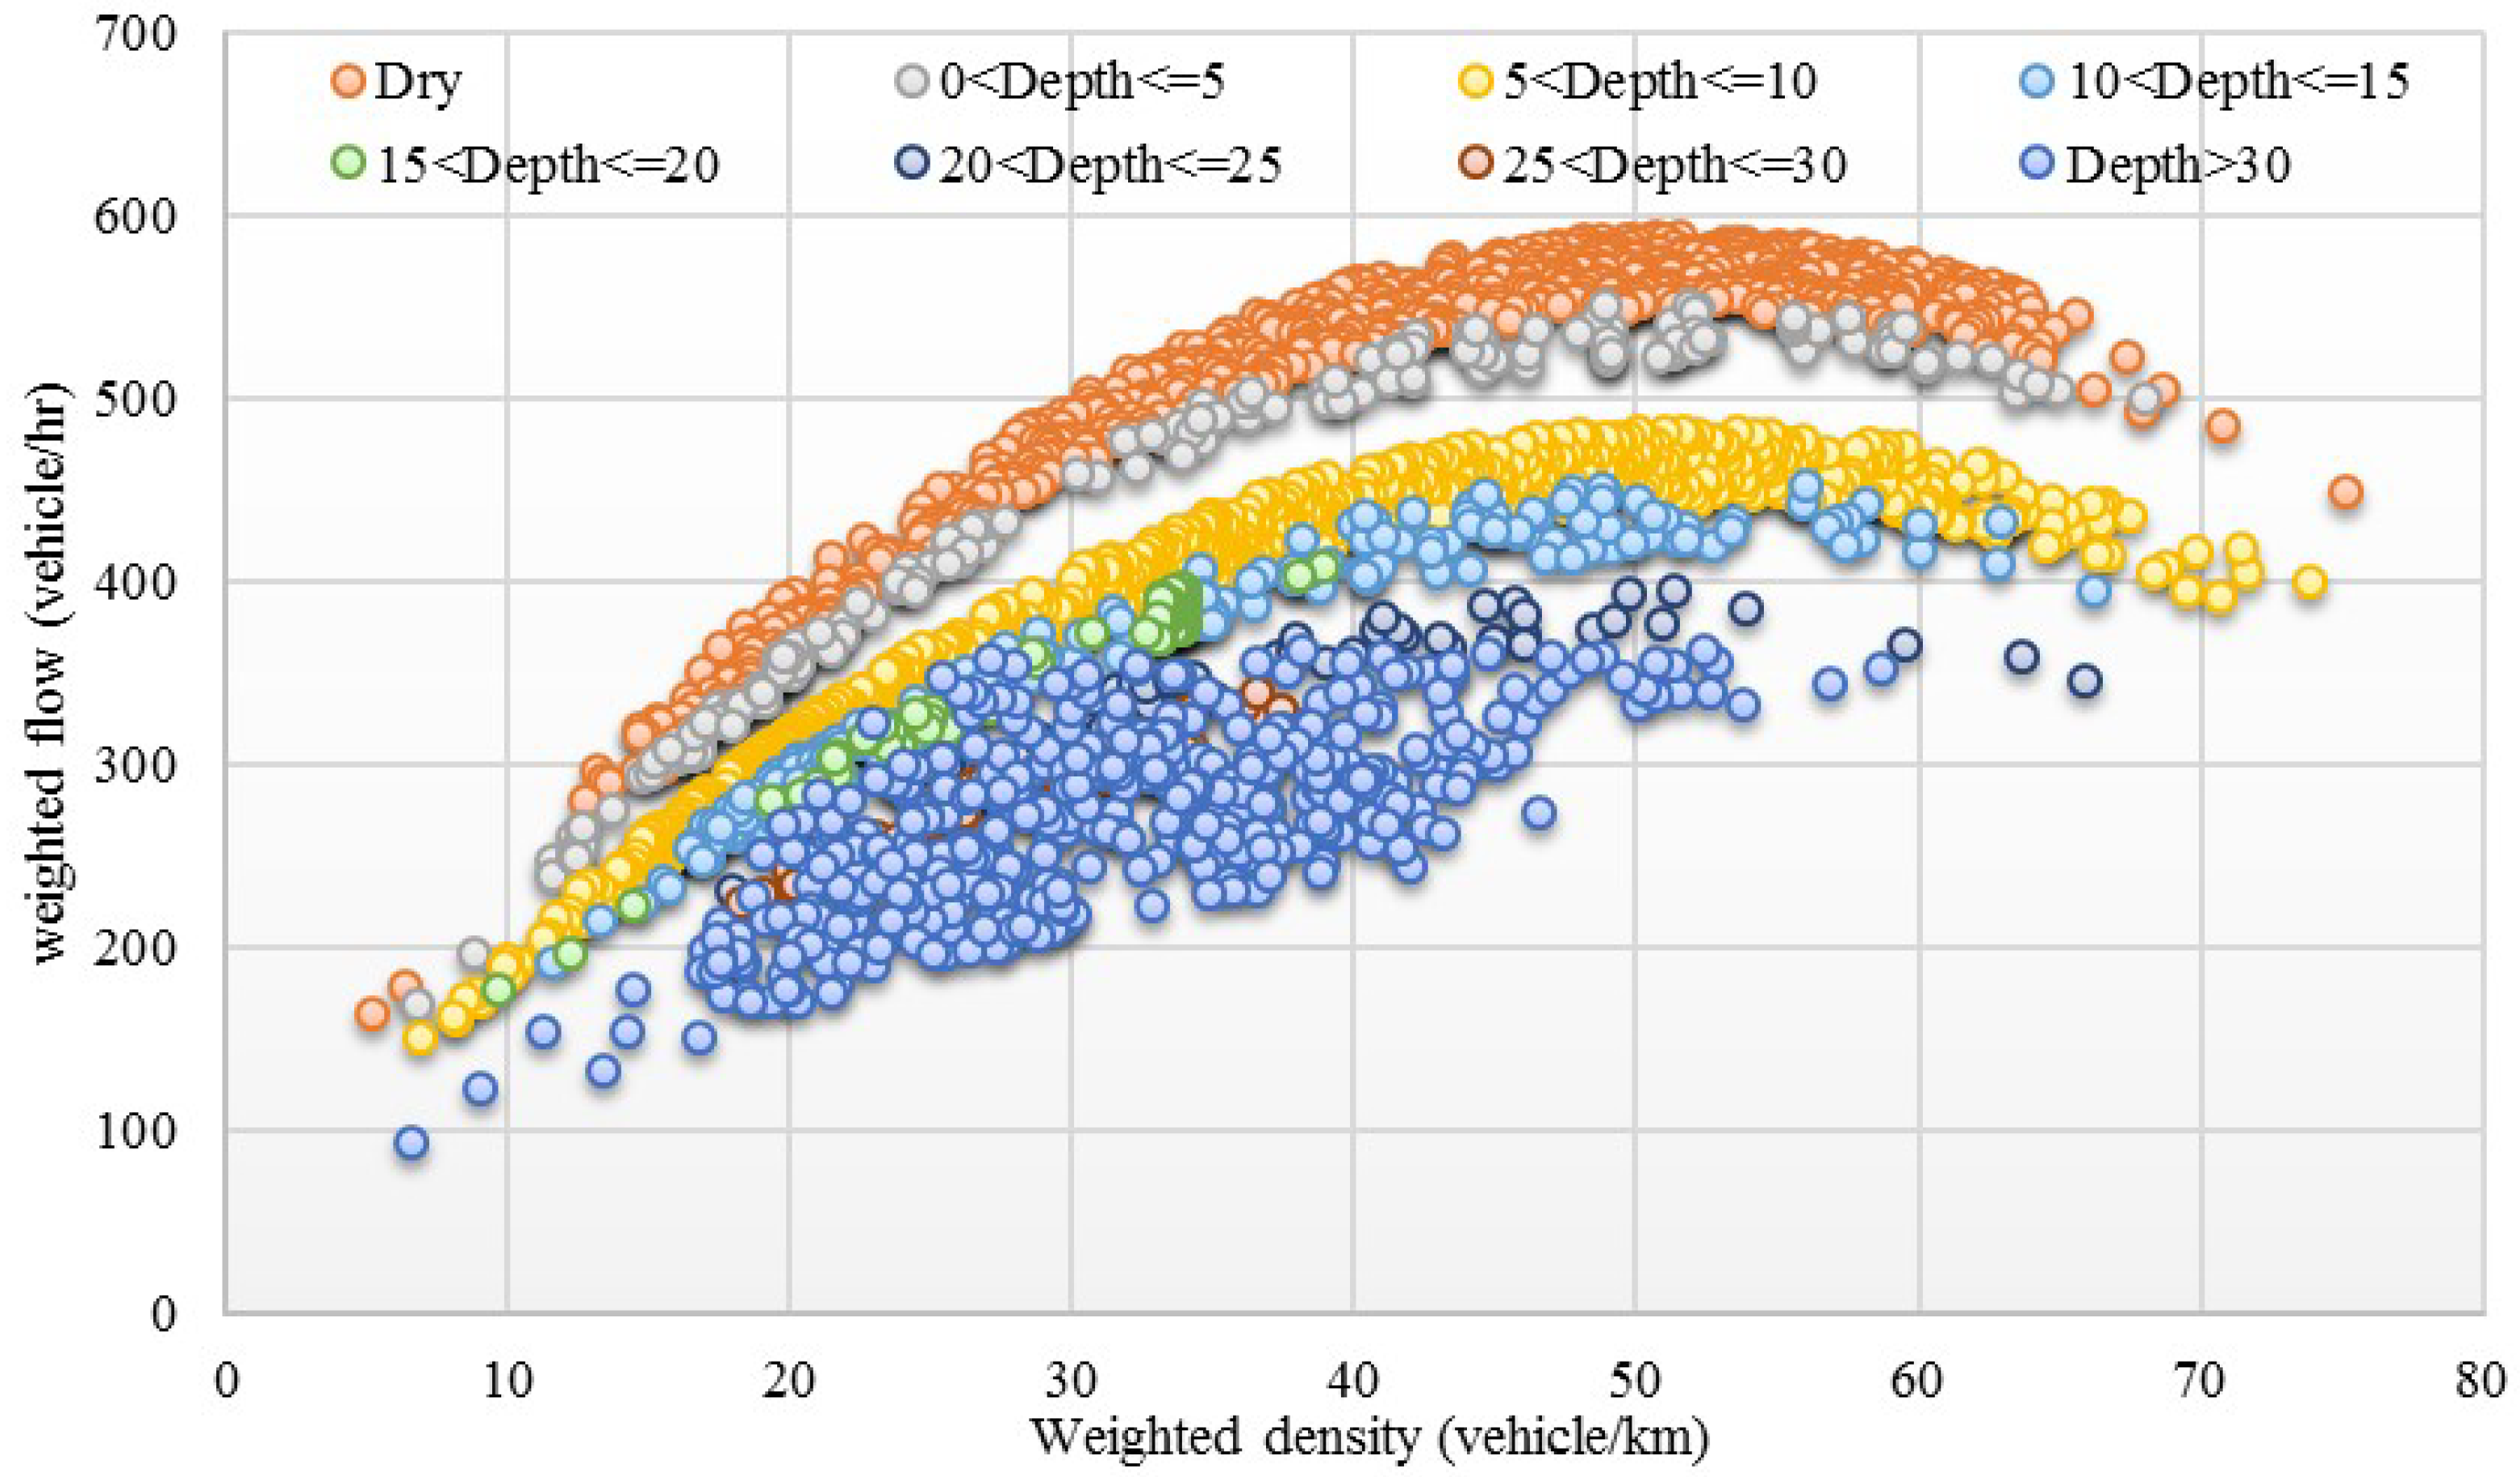
- MFD captures the relationships between average of flow and density characteristics, and plays an essential role in traffic-flow theory and transportation engineering. The MFD shape changed as a result of the network traffic operation under different flood levels. Varying degrees of impact induced the MFD shape change, and scatter occurred compared with in the dry conditions. Flood levels exceeding 30 cm had a greater effect on the discreteness of the MFD. The equation (in Table 1) presenting the relationships under different flooding depths indicated that the R-squared value reduced as flood depth increased, while continuity decreased. When assessing the MFD key parameters (in Table 2), an increase in flood conditions caused a reduction in free flow speed of −8.3%, −19.4%, −27.7%, and −30.5%, respectively, while the maximal flow of the network reduced by −28.3%, −38.1%, −42.1% and −49.6%, respectively, with density slightly reduced.
- (2)
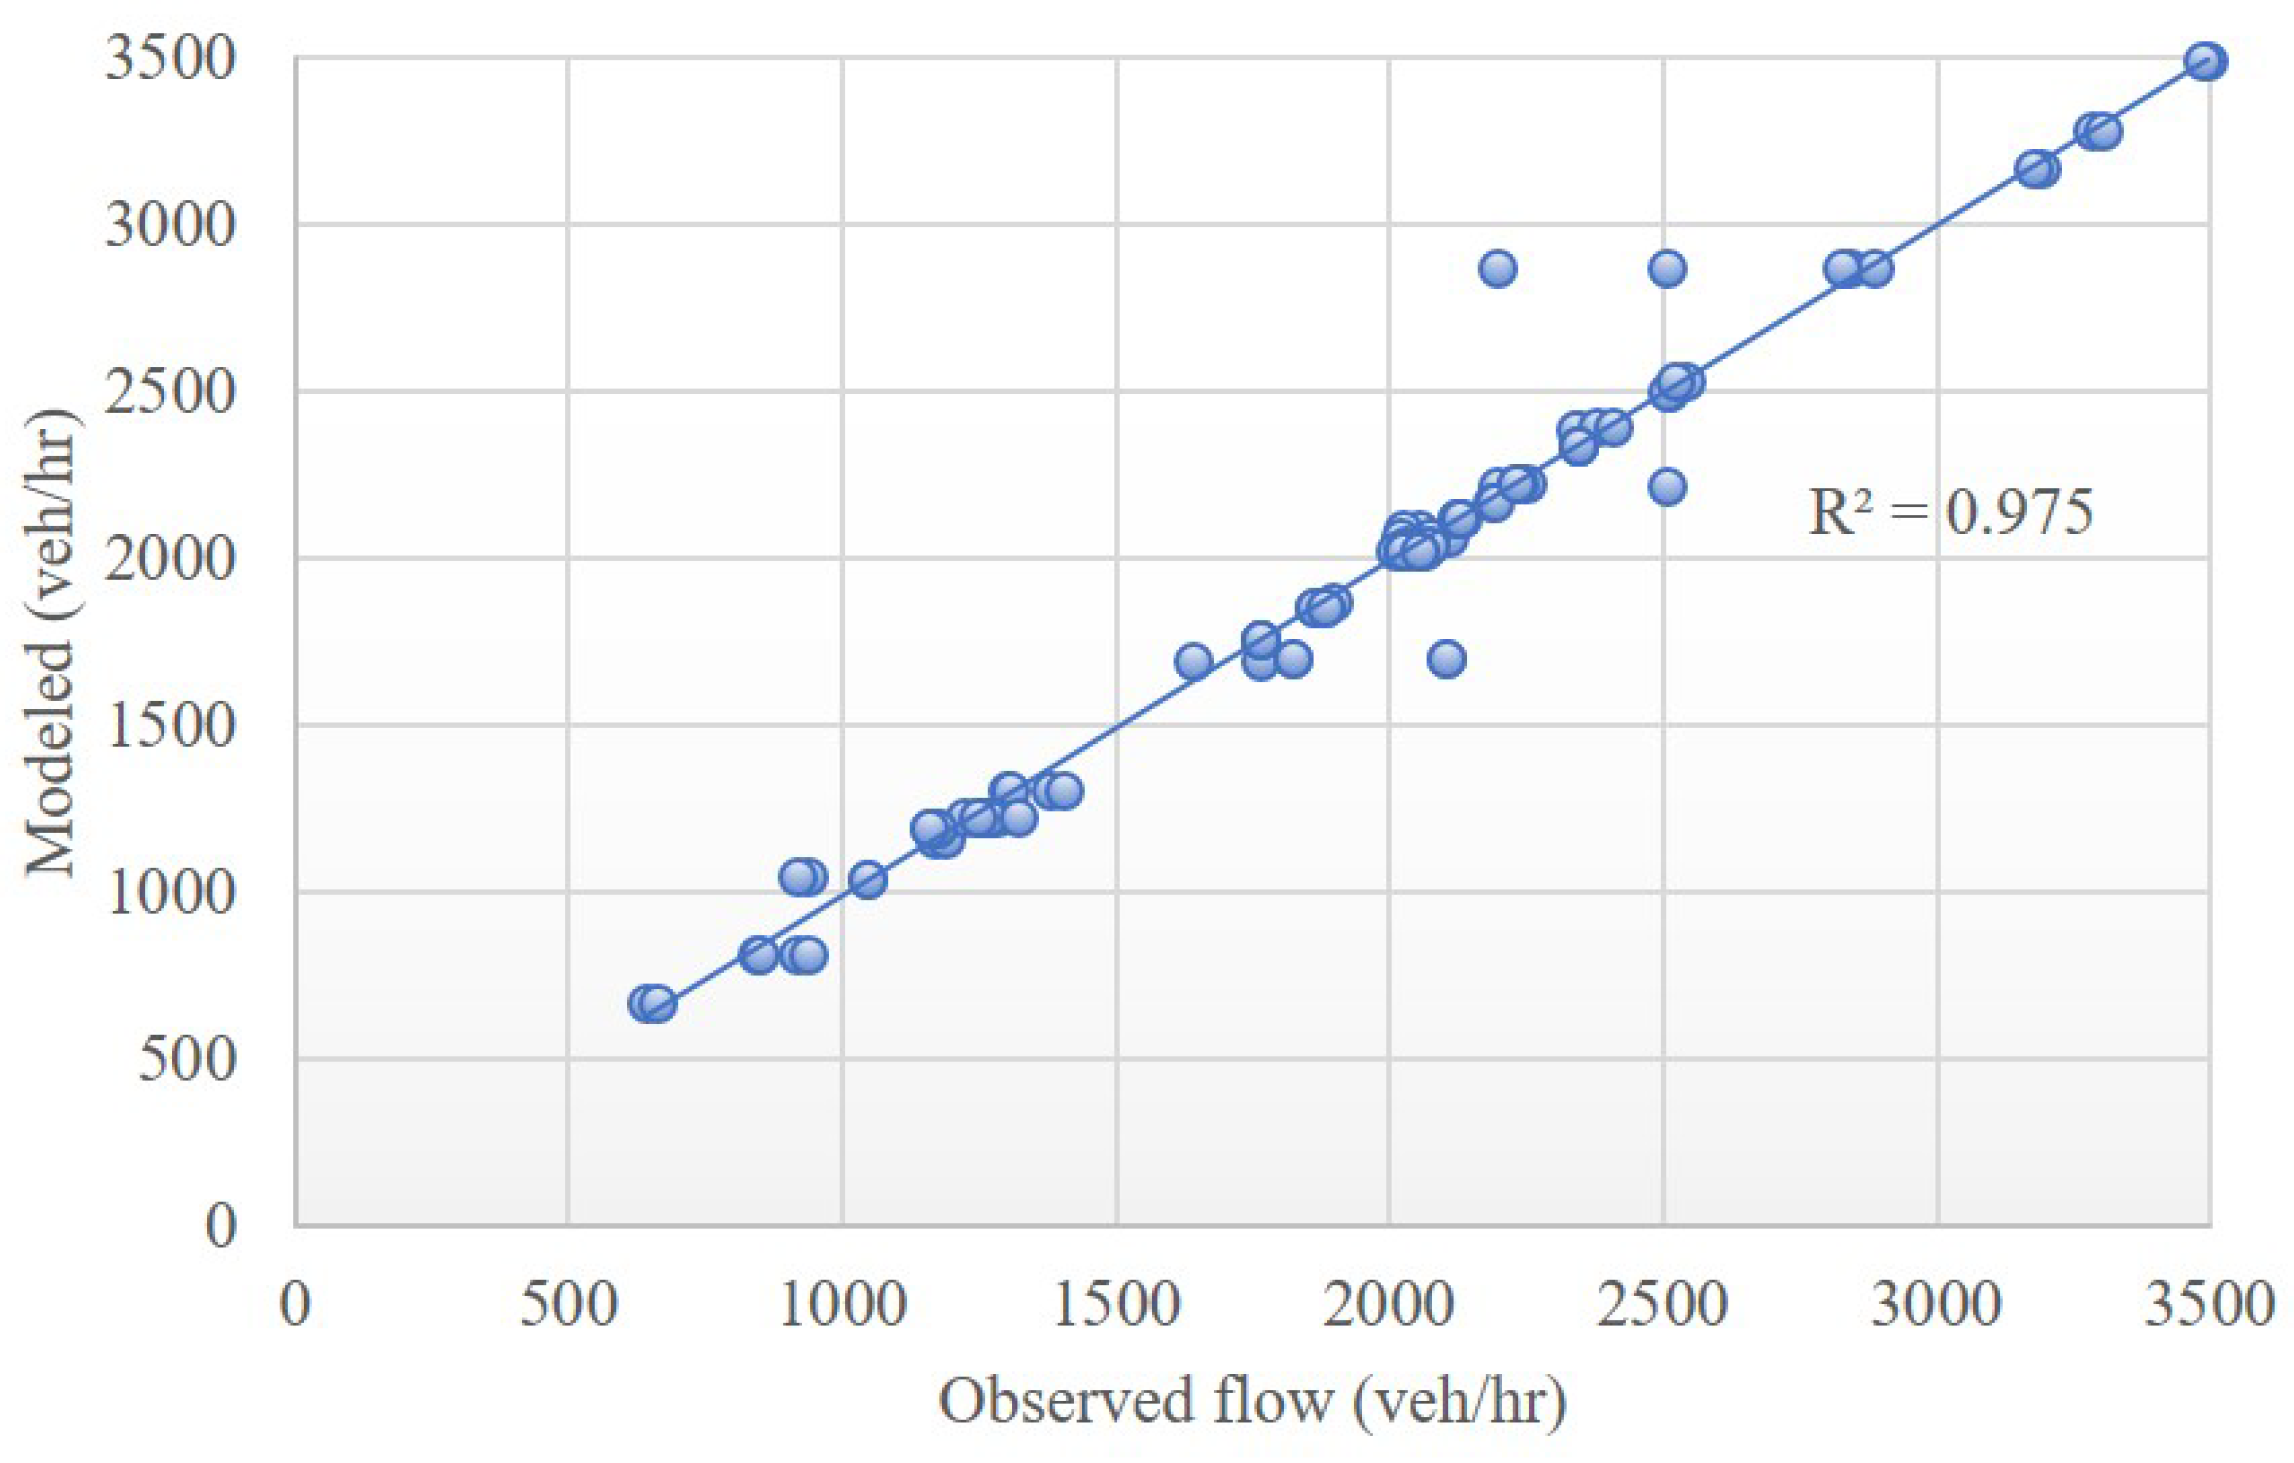
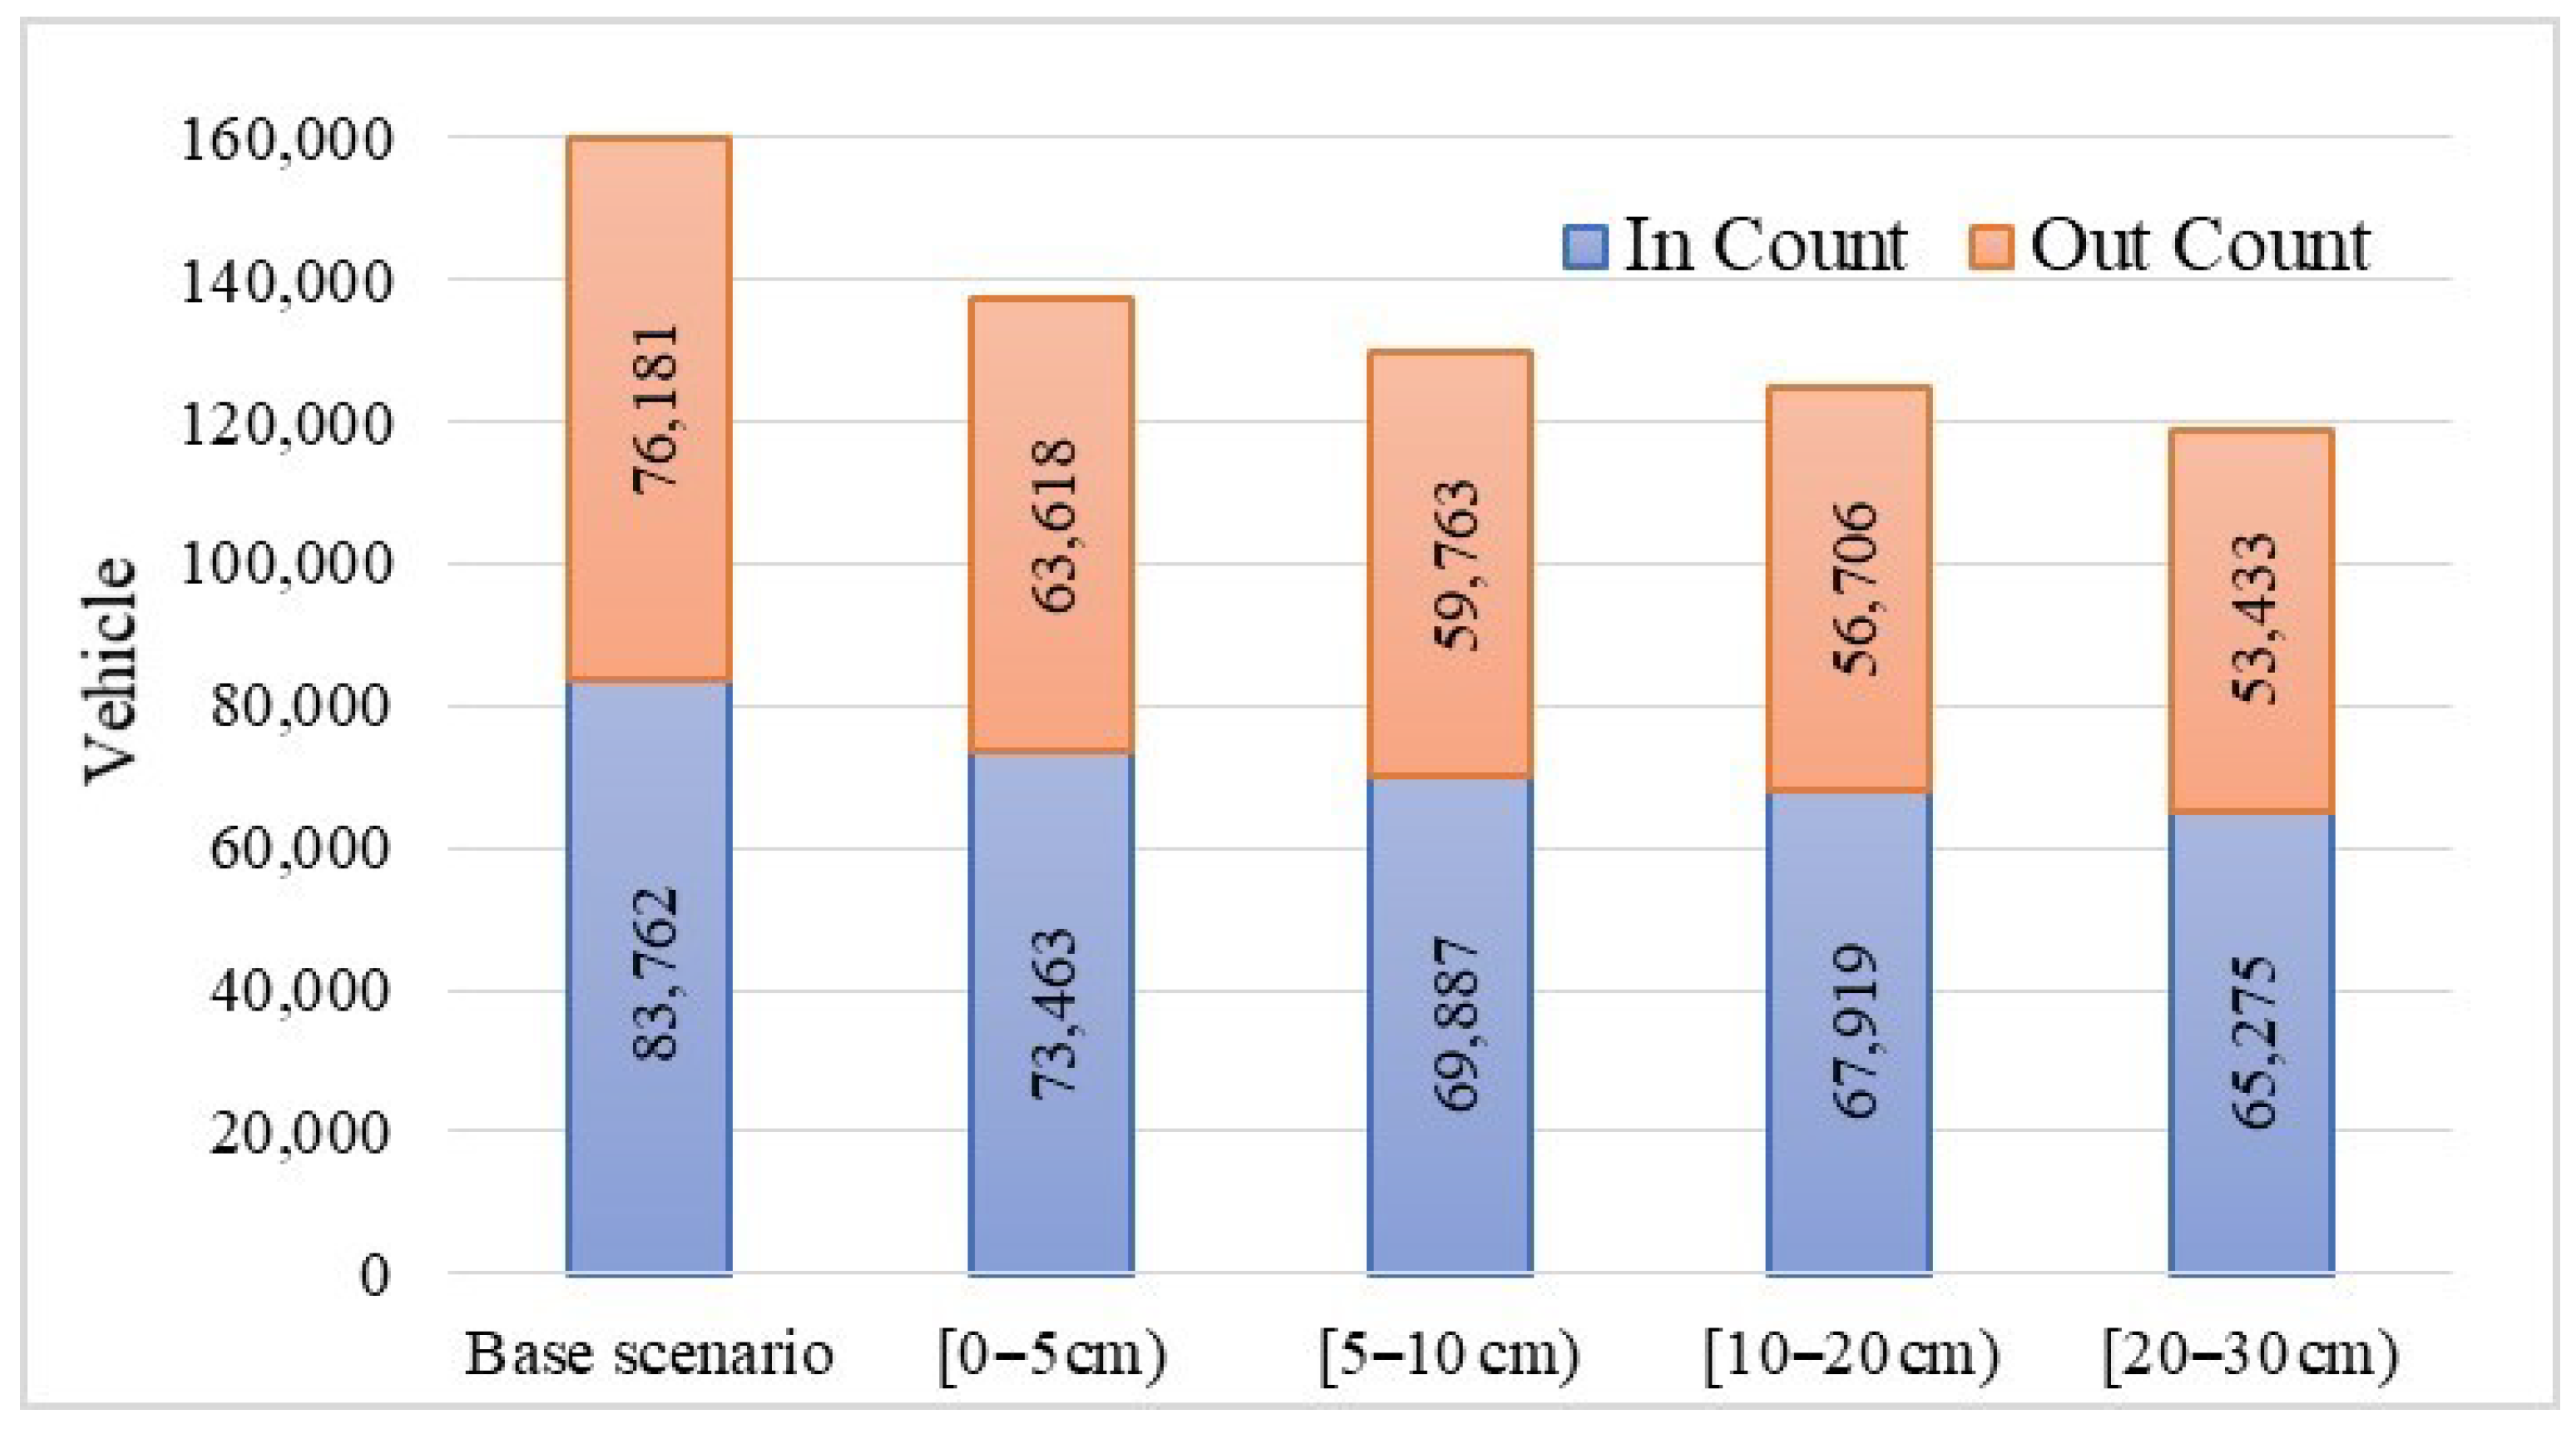
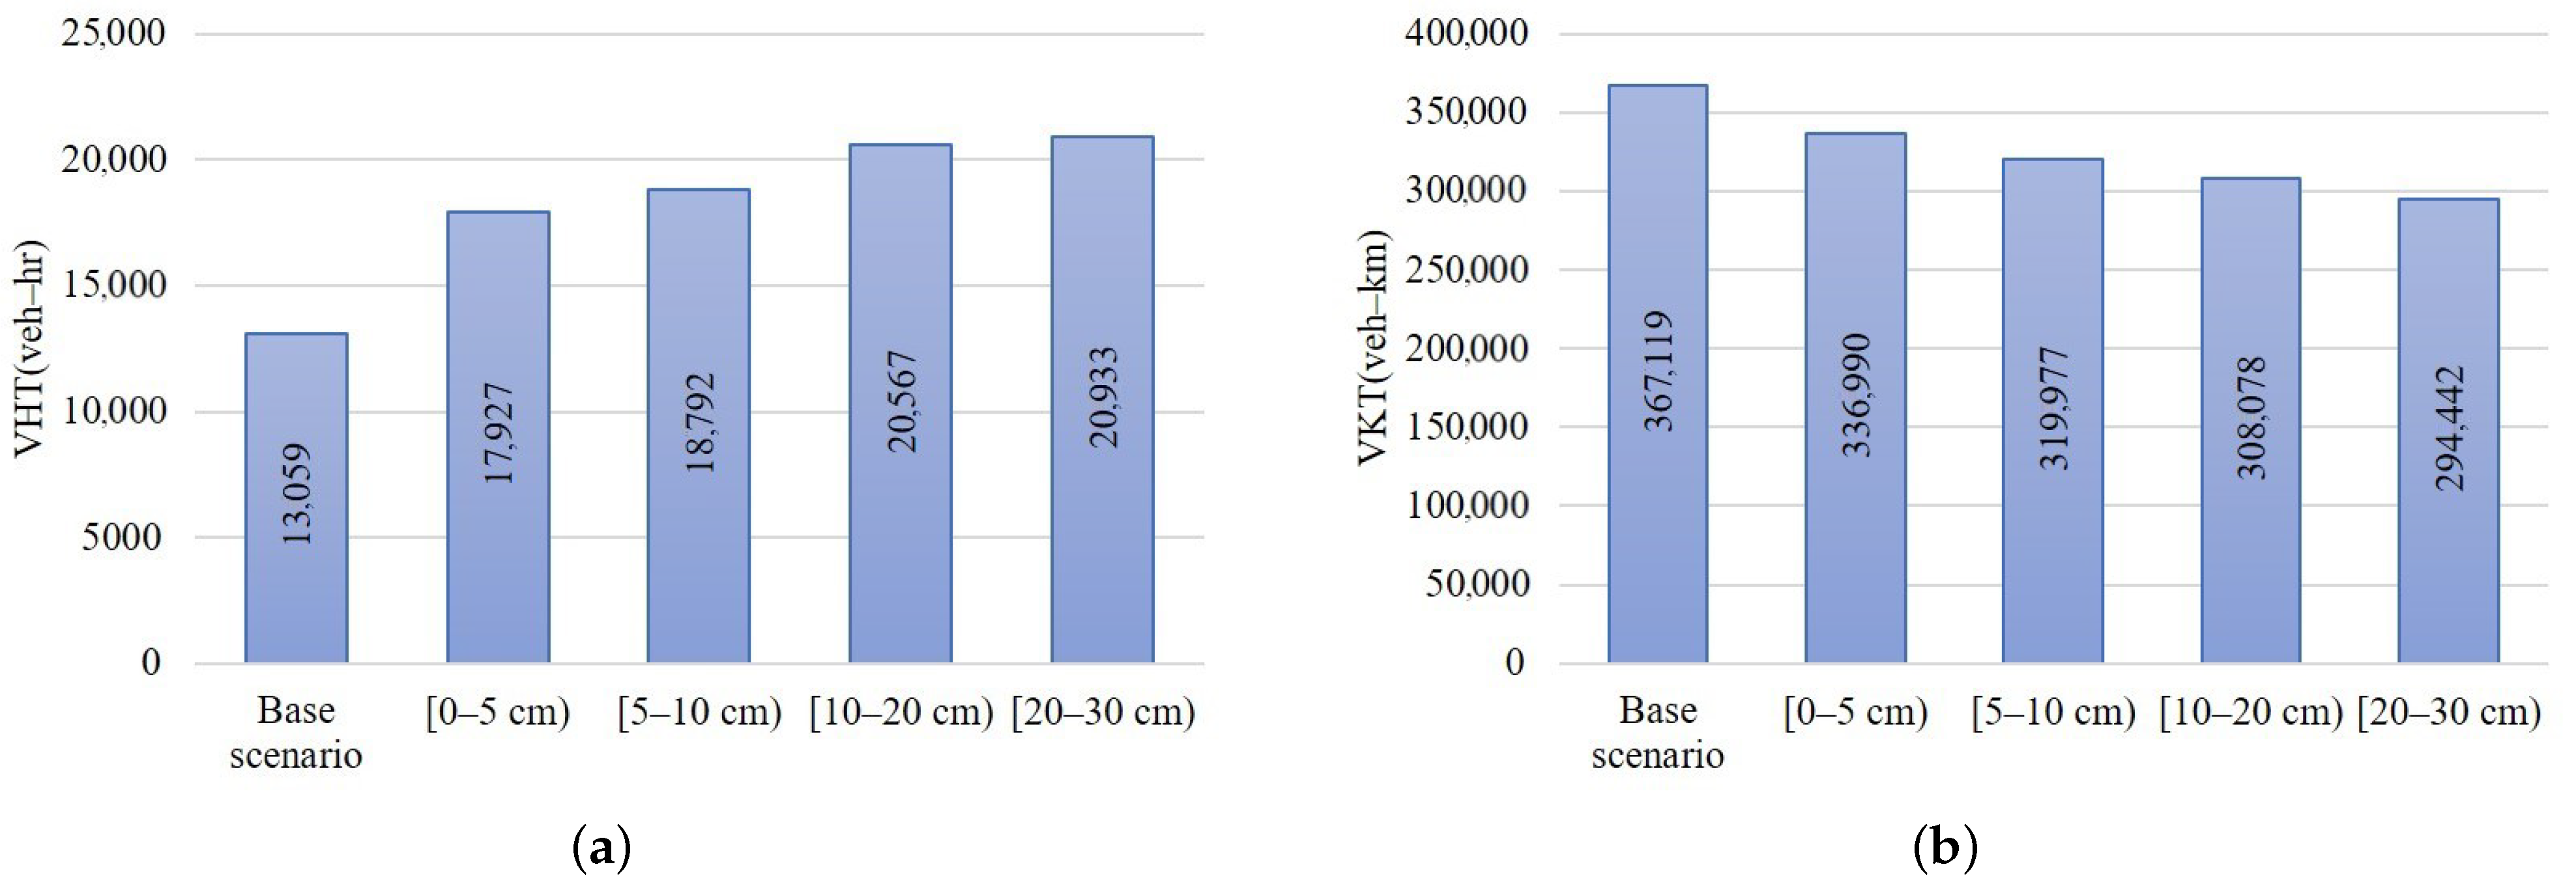
- This study used a mesoscopic model that could simulate the movements of individual vehicles along roadway links using macroscopic traffic flow relations (free-flow speed, maximal flow, and jam density). These values were defined according to the remaining efficiency of the road network at each flood condition. Results offer a novel view of dynamic traffic conditions and provide rational scenario comparisons that are only possible with an equilibrium-based solution. Analysis of the impact of floods on traffic conditions used a calibrated mesoscopic traffic model as a baseline and introduced a flood scenario (20–30 cm). Tests on network indicators VKT and VHT were conducted to investigate the impact of perturbations of input parameters over the simulation results. VKT in the network decreased as flood depth increased because the number of vehicles entering and exiting the network decreased; thus, floods greatly impacted traffic behavior.
- (3)
- Two traffic management measures were selected to analyze their effects on network performance. The elevated metropolitan expressway with free tolls was appropriate to operate in a dry scenario because the generalized cost function used for path building was modified to reduce the perceived travel time on locals and collectors. In the flood scenario (20–30 cm), as in the present critical scenario, results indicated that theroad network performance of the whole network improved. Optimizing the signal control system improved network performance more than the expressway with free tolls in VHT and more than 2% in VKT did. However, combining the two measures for traffic management improved network performance by more than 27% in VHT and 30% in VKT compared to the critical scenario.
Author Contributions
Funding
Institutional Review Board Statement
Informed Consent Statement
Conflicts of Interest
References
- Change, C. Synthesis Report. In Contribution of Working Groups I, II and III to the Fifth Assessment Report of the Intergovernmental Panel on Climate Change; Core Writing Team, RK Pachauri and LA Meyer: Aachen, Germany, 2014. [Google Scholar]
- Mignot, E.; Li, X.; Dewals, B. Experimental modelling of urban flooding: A review. J. Hydrol. 2019, 568, 334–342. [Google Scholar] [CrossRef]
- GebreEgziabher, M.; Demissie, Y. Modeling urban flood inundation and recession impacted by manholes. Water 2020, 12, 1160. [Google Scholar] [CrossRef]
- Department of Drainage and Sewerage (2019) Flood Event recorded in Bangkok. Available online: http://weather.bangkok.go.th/flood (accessed on 30 March 2019).
- Hu, S.; Lin, H.; Xie, K.; Dai, J.; Qui, J. Impacts of rain and waterlogging on traffic speed and volume on urban roads. In Proceedings of the 2018 21st IEEE International Conference on Intelligent Transportation Systems (ITSC), Maui, HI, USA, 4–7 November 2018; pp. 2943–2948. [Google Scholar]
- Greenshields, B.; Bibbins, J.; Channing, W.; Miller, H. A study of traffic capacity. In Highway Research Board Proceedings; National Research Council (USA), Highway Research Board: Washington, DC, USA, 1935; Volume 1935. [Google Scholar]
- Geroliminis, N.; Daganzo, C.F. Macroscopic Modeling of Traffic in Cities; Technical Report; The National Academies of Sciences, Engineering, and Medicine (USA): Washington, DC, USA, 2007. [Google Scholar]
- Geroliminis, N.; Daganzo, C.F. Existence of urban-scale macroscopic fundamental diagrams: Some experimental findings. Transp. Res. Part B Methodol. 2008, 42, 759–770. [Google Scholar] [CrossRef]
- Jiang, R.; Chung, E.; Zhang, X. The impact of incidents on macroscopic fundamental diagrams. Proc. Inst. Civ. Eng.-Transp. 2015, 168, 396–405. [Google Scholar] [CrossRef]
- Mitsakis, E.; Stamos, I.; Diakakis, M.; Grau, J.S. Impacts of high-intensity storms on urban transportation: Applying traffic flow control methodologies for quantifying the effects. Int. J. Environ. Sci. Technol. 2014, 11, 2145–2154. [Google Scholar] [CrossRef]
- Wada, K.; Akamatsu, T.; Hara, Y. An empirical analysis of macroscopic fundamental diagrams for Sendai road networks. Interdiscip. Inf. Sci. 2015, 21, 49–61. [Google Scholar]
- Xu, F.; He, Z.; Sha, Z.; Zhuang, L.; Sun, W. Assessing the impact of rainfall on traffic operation of urban road network. Procedia-Soc. Behav. Sci. 2013, 96, 82–89. [Google Scholar] [CrossRef][Green Version]
- Xu, F.; He, Z.; Sha, Z.; Zhuang, L.; Sun, W. Survey the impact of different rainfall intensities on urban road traffic operations using Macroscopic Fundamental Diagram. In Proceedings of the 16th International IEEE Conference on Intelligent Transportation Systems (ITSC 2013), The Hague, The Netherlands, 6–9 October 2013; pp. 664–669. [Google Scholar]
- Suwanno, P.; Jitpat, P.; Kasemsri, R.; Fukuda, A.; Aditya, B. Impact of Rainfall Intensity on Macroscopic Traffic Variables of Urban Roads Using Data from Bluetooth Detectors. J. Hum. Environ. Symbiosis 2021, 37, 13–23. [Google Scholar]
- Knoop, V.L.; Hoogendoorn, S.P. Empirics of a generalized macroscopic fundamental diagram for urban freeways. Transp. Res. Rec. 2013, 2391, 133–141. [Google Scholar] [CrossRef]
- Aobpaet, A.; Cuenca, M.C.; Hooper, A.; Trisirisatayawong, I. InSAR time-series analysis of land subsidence in Bangkok, Thailand. Int. J. Remote Sens. 2013, 34, 2969–2982. [Google Scholar] [CrossRef]
- Duangyiwa, C. Modelling Future Flood Risks in the Bangkok Metropolitan Region. Ph.D. Thesis, Loughborough University, Reading, UK, 2017. [Google Scholar]
- Historical Raw Vehicles and Mobile Probes Data in Thailand. Available online: https://itic.longdo.com/opendata/?fbclid=IwAR1udPqenZPYkxV56qpr_jfH7U39_viuHWAMpq6SCxYD03KYcMyUJHr-fcc (accessed on 1 October 2018).
- Department of Land Transport (2019) Number of Vehicle Registered in Thailand as of 30 March 2019. Available online: https://web.dlt.go.th/statistics (accessed on 30 March 2019).
- Suwanno, P.; Jitpat, P.; Kasemsri, R.; Aditya, B.; Fukuda, A. Macroscopic Fundamental Diagrams According to the Different Flood Depths on Probe Vehicle Data in Urban Bangkok. J. Traffic Transp. Eng. 2020, 8, 20–28. [Google Scholar]
- Edie, L.C. Discussion of Traffic Stream Measurements and Definitions; Port of New York Authority New York: New York, NY, USA, 1963. [Google Scholar]
- Burghout, W. Hybrid Microscopic-Mesoscopic Traffic Simulation Modelling. Ph.D. Thesis, Department of Infrastracture, Royal Institute of Technology, Stockholm, Sweden, 2004. [Google Scholar]
- Brustlin Inc. Current Use of Traffic Simulation and Dynamic Traffic Assignment (DTA) Models by MPOs. In A Metropolitan Washington Council of Governments National Capital Region Transportation Planning Board Report; Brustlin Inc.: Watertown, MA, USA, 2007. [Google Scholar]
- Brurghout, W. Mesoscopic simulation models for short-term prediction. In PREDIKT Project Report CTR2005; KTH Royal Institute of Technology: Stockholm, Sweden, 2005; p. 3. [Google Scholar]
- Mahut, M.; Florian, M. Traffic simulation with dynameq. In Fundamentals of Traffic Simulation; Springer: Berlin/Heidelberg, Germany, 2010; pp. 323–361. [Google Scholar]
- Snelder, M. A Comparison between Dynameq and Indy; Cirrelt: Montreal, QC, Canada, 2009. [Google Scholar]
- Results of Transport and Traffic Analysis. Available online: http://mistran.otp.go.th/mis/RoadAverage.aspx (accessed on 30 March 2019).
- Rakha, H.; Medina, A.; Sin, H.; Dion, F.; Van Aerde, M.; Jenq, J. Traffic signal coordination across jurisdictional boundaries: Field evaluation of efficiency, energy, environmental, and safety impacts. Transp. Res. Rec. 2000, 1727, 42–51. [Google Scholar] [CrossRef]
- Tindale, S.A.; Hsu, P.P. Crash data and signal coordination: A one-way pair case study. J. Saf. Res. 2005, 36, 481–482. [Google Scholar] [CrossRef] [PubMed]
- Duerr, P.A. Dynamic right-of-way for transit vehicles: Integrated modeling approach for optimizing signal control on mixed traffic arterials. Transp. Res. Rec. 2000, 1731, 31–39. [Google Scholar] [CrossRef]
- Stevanovic, J.; Stevanovic, A.; Martin, P.T.; Bauer, T. Stochastic optimization of traffic control and transit priority settings in VISSIM. Transp. Res. Part C Emerg. Technol. 2008, 16, 332–349. [Google Scholar] [CrossRef]
- Geroliminis, N.; Levinson, D.M. Cordon pricing consistent with the physics of overcrowding. In Transportation and Traffic Theory 2009: Golden Jubilee; Springer: Berlin/Heidelberg, Germany, 2009; pp. 219–240. [Google Scholar]


| Depth (cm) | Density-Flow | |
|---|---|---|
| Equation | ||
| Dry | 0.97 | |
| (0, 5] | 0.95 | |
| (5, 10] | 0.93 | |
| (10, 20] | 0.92 | |
| (20, 30] | 0.90 | |
| Depth (cm) | Free Flow Speed (km/h) | Maximal Flow (veh/h) | Jam Density (veh/km) | |||
|---|---|---|---|---|---|---|
| Value | % Change | Value | % Change | Value | % Change | |
| Dry | 36 | - | 750 | - | 122 | - |
| (0, 5] | 33 | −8.3 | 538 | 28.3 | 122 | 0 |
| (5, 10] | 29 | −19.4 | 464 | −38.1 | 126 | 3.2 |
| (10, 20] | 26 | −27.7 | 434 | −42.1 | 121 | −0.8 |
| (20, 30] | 25 | −30.5 | 378 | −49.6 | 129 | +5.7 |
| Base Scenario | 7:30–7:45 | 7:45–8:00 | 8:00–8:15 | 8:15–8:30 |
|---|---|---|---|---|
| In count (vehicle) | 21,414 | 21,106 | 20,469 | 20,773 |
| Out count (vehicle) | 19,585 | 19,087 | 18,735 | 18,774 |
| Vehicle hours traveled (VHT) | 2620 | 3076 | 3529 | 3833 |
| Vehicle kilometers traveled (VKT) | 92,735 | 91,913 | 91,662 | 90,809 |
| Flood Depth (cm) | Remain Performance (%) | ||
|---|---|---|---|
| Free Flow Speed | Maximal Flow | Jam Density | |
| 0–5 | 0.92 | 0.72 | 1.00 |
| 5–10 | 0.81 | 0.62 | 1.00 |
| 10–20 | 0.72 | 0.58 | 0.99 |
| 20–30 | 0.69 | 0.50 | 1.06 |
| Traffic Management Measures | |||||||
|---|---|---|---|---|---|---|---|
| Performance Criteria | Scenario | (1) | (2) | (1 + 2) | |||
| Value | Change % | Value | Change % | Value | Change % | ||
| In count (vehicle) | 83,767 | 88,238 | +5.34 | 83,638 | −0.15 | 88,054 | +5.10 |
| Out count (vehicle) | 76,181 | 81,466 | +6.94 | 77,230 | +1.38 | 80,542 | +5.72 |
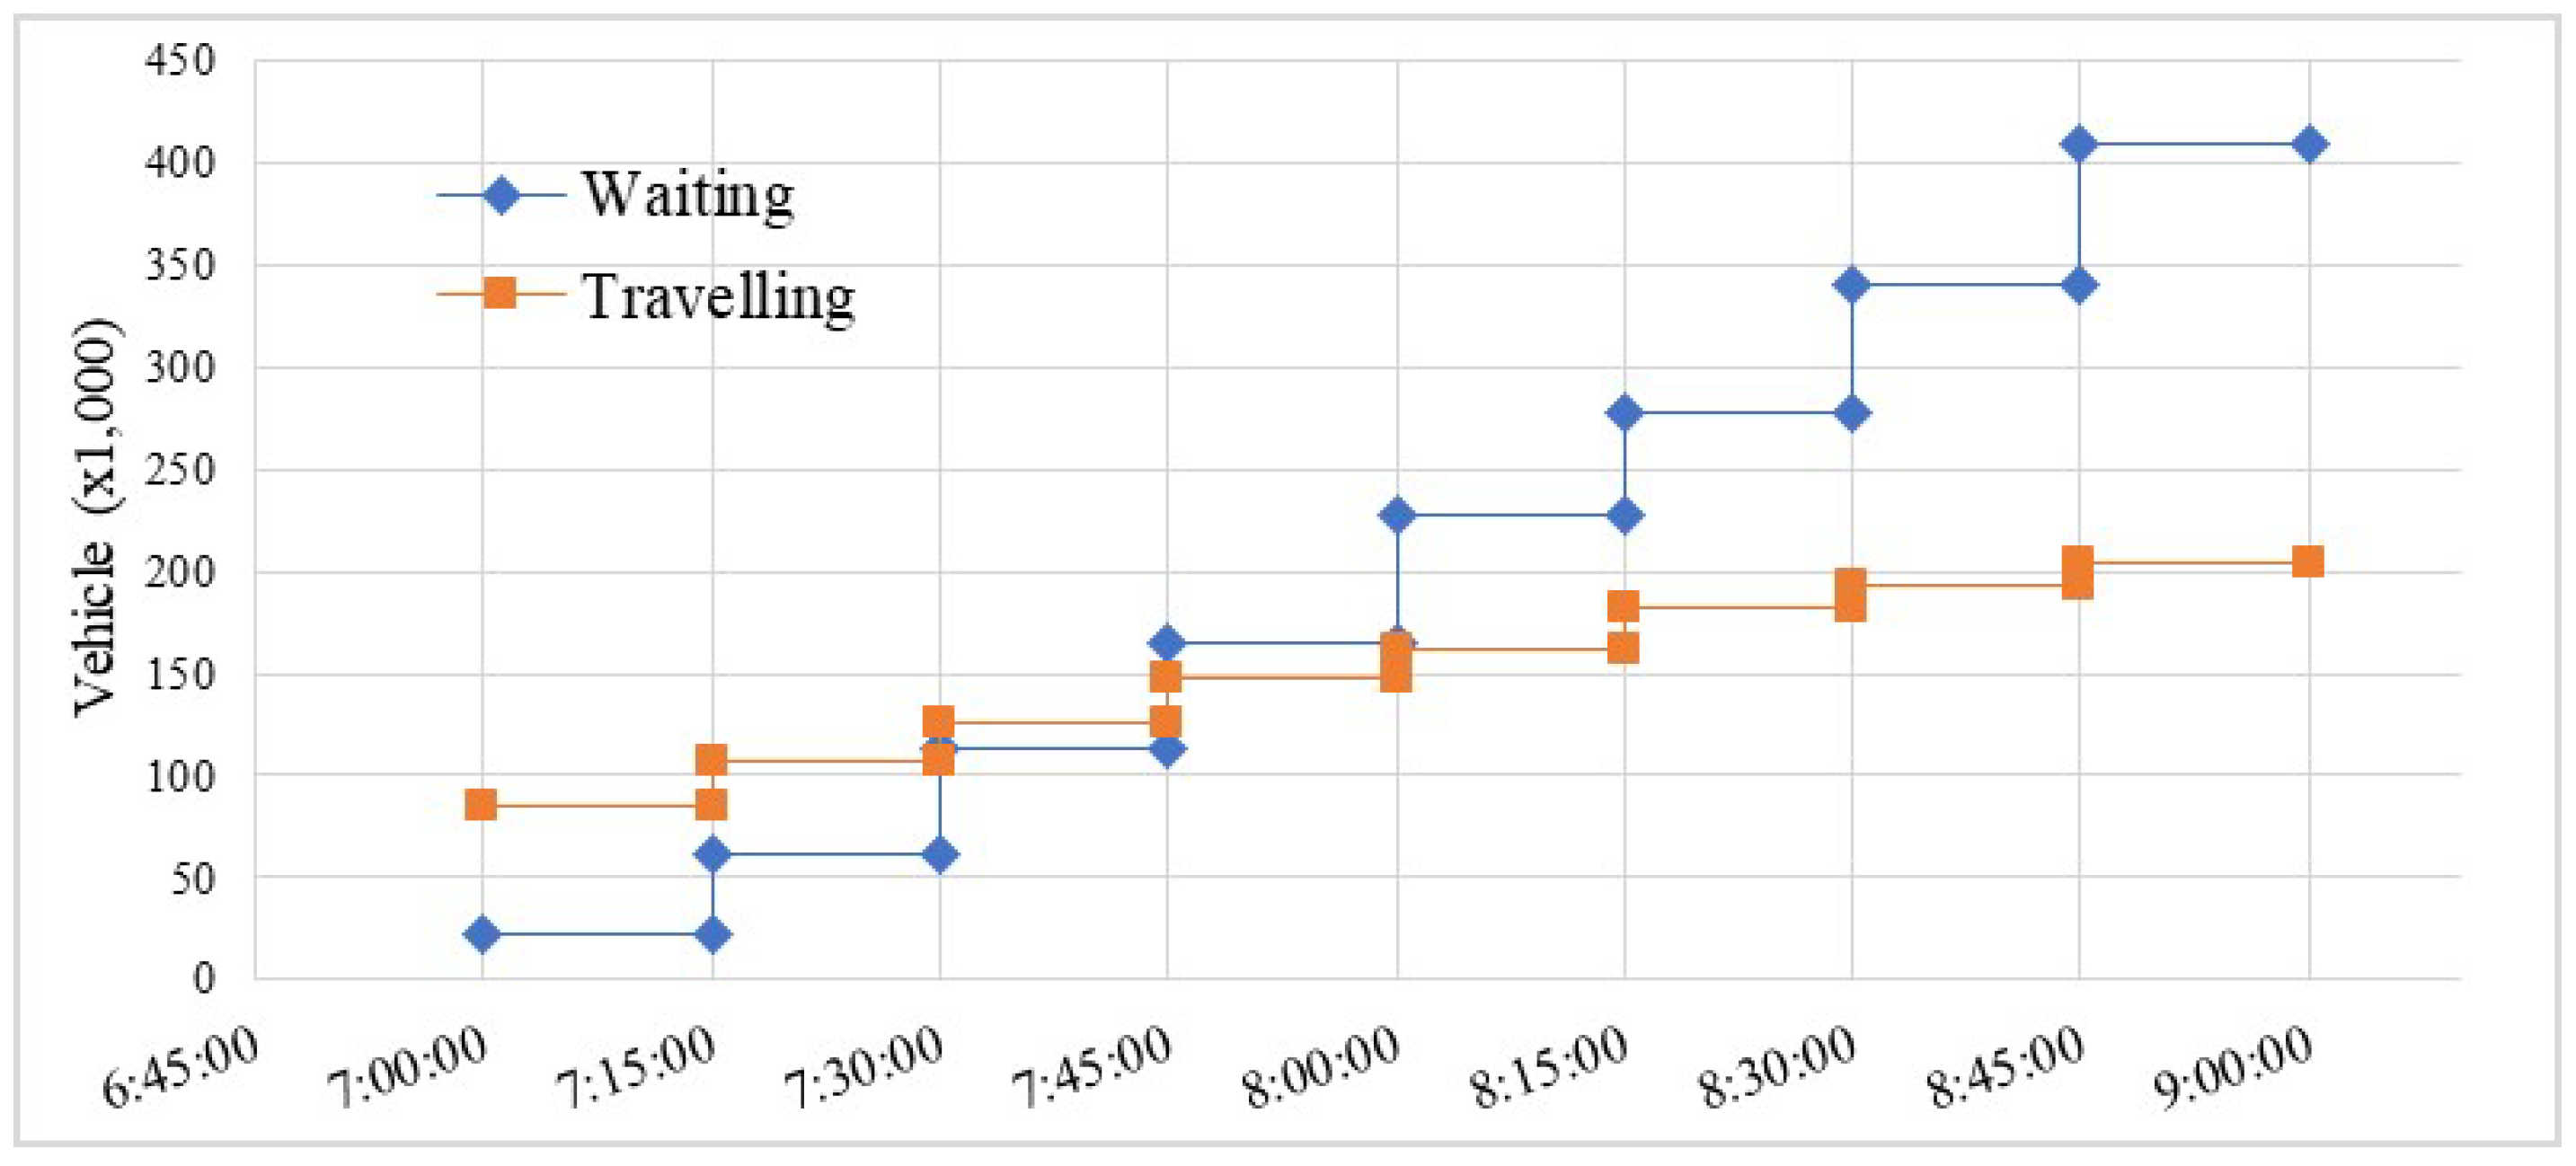
| Waiting (vehicle) | 77,529 | 158,333 | +104.22 | 188,658 | +143.34 | 166,236 | +144.42 |
| Travelling (vehicle) | 61,552 | 168,006 | +172.95 | 188,009 | +205.45 | 172,573 | +180.37 |
| VHT (hour) | 13,059 | 12,483 | −4.41 | 14,354 | +9.92 | 12,898 | −1.23 |
| VKT (kilometer) | 367,119 | 431,079 | +17.42 | 387,222 | +5.48 | 419,080 | +14.15 |
| Traffic Management Measures | |||||||
|---|---|---|---|---|---|---|---|
| Performance Criteria | Scenario | (1) | (2) | (1 + 2) | |||
| Value | Change % | Value | Change % | Value | Change % | ||
| In count (vehicle) | 65,275 | 68,862 | +5.50 | 76,380 | +17.01 | 81,333 | +24.60 |
| Out count (vehicle) | 53,433 | 56,755 | +6.22 | 65,612 | +22.79 | 73,768 | +38.06 |
| Waiting (vehicle) | 139,694 | 133,686 | −4.30 | 91,242 | −34.68 | 82,559 | −40.90 |
| Travelling (vehicle) | 100,768 | 95,303 | −5.42 | 85,720 | −14.93 | 70,756 | −29.78 |
| VHT (hour) | 20,934 | 19,538 | −6.67 | 17,719 | −15.36 | 15,209 | −27.35 |
| VKT (kilometer) | 294,442 | 335,757 | +14.03 | 343,741 | +16.74 | 383,872 | +30.37 |
Publisher’s Note: MDPI stays neutral with regard to jurisdictional claims in published maps and institutional affiliations. |
© 2021 by the authors. Licensee MDPI, Basel, Switzerland. This article is an open access article distributed under the terms and conditions of the Creative Commons Attribution (CC BY) license (https://creativecommons.org/licenses/by/4.0/).
Share and Cite
Suwanno, P.; Kasemsri, R.; Duan, K.; Fukuda, A. Application of Macroscopic Fundamental Diagram under Flooding Situation to Traffic Management Measures. Sustainability 2021, 13, 11227. https://doi.org/10.3390/su132011227
Suwanno P, Kasemsri R, Duan K, Fukuda A. Application of Macroscopic Fundamental Diagram under Flooding Situation to Traffic Management Measures. Sustainability. 2021; 13(20):11227. https://doi.org/10.3390/su132011227
Chicago/Turabian StyleSuwanno, Piyapong, Rattanaporn Kasemsri, Kaifeng Duan, and Atsushi Fukuda. 2021. "Application of Macroscopic Fundamental Diagram under Flooding Situation to Traffic Management Measures" Sustainability 13, no. 20: 11227. https://doi.org/10.3390/su132011227
APA StyleSuwanno, P., Kasemsri, R., Duan, K., & Fukuda, A. (2021). Application of Macroscopic Fundamental Diagram under Flooding Situation to Traffic Management Measures. Sustainability, 13(20), 11227. https://doi.org/10.3390/su132011227