Article

How Society 5.0 and Industry 4.0 Ideas Shape the Open Data Performance Expectancy

by
Anna Sołtysik-Piorunkiewicz
1,* and
Iwona Zdonek
2
1
Department of Informatics, College of Informatics and Communication, University of Economics in Katowice, 1 Maja Str. 50, 40-287 Katowice, Poland
2
Department of Organization and Management, Institute of Economy and Informatics, Silesian University of Technology, Akademicka Str. 2A, 44-100 Gliwice, Poland
*
Author to whom correspondence should be addressed.
Sustainability 2021, 13(2), 917; https://doi.org/10.3390/su13020917
Submission received: 22 December 2020 / Revised: 11 January 2021 / Accepted: 13 January 2021 / Published: 18 January 2021
(This article belongs to the Special Issue Society 5.0 and Industry 4.0 Relations and Implications)

Abstract

:
The open data (OD) performance expectancy is a critical factor for the user technology acceptance models for future implementation OD in Industry 4.0, and to have an impact in area of Society 5.0. The purpose of this article is identifying trends and key words (leading terms) in promoting ODs for their use in Industry 4.0 and Society 5.0. We are also looking for leaders in Europe in promoting the use of OD in the context of Industry 4.0 and Society 5.0. The research methodology includes methods such as: analyses based on text mining, visualization techniques, and multidimensional cluster analyses with correlation analyses. The dataset covered 288 digital products and services based on OD. The timeframe covers the period January 2018–January 2020, and the research focuses on European issues. The research is focused on texts promoting the digital OD products and services, with the most popular being applications, websites and platforms. The main direction in presenting the benefits of their use is related to promoting them as tools to provide real time information on public issues, primarily in areas such as transport, education, culture and sport, economics and finance and health. The main types of OD are geodata and those specified as national and local. Additionally, the geographical area in Europe-dominating countries, and the key terms promoting product and services in context of OD performance expectancy in Western Europe, Northern Europe, Southern Europe and Eastern Europe, were found.

1. Introduction

The usage of open data (OD) in Industry 4.0 with application of OD by smart sustainable Society 5.0 is able to develop the performance expectancy in the new innovative economy. It is necessary to discover what aspect of OD promotion for future implementation in Industry 4.0 has an impact on the acceptance models in the area of OD performance expectancy for Society 5.0. The openness of data, both public [1] and private [2], seems to be one of the crucial drivers [3] for the sustainable economy, and might have an impact on information and communication technology (ICT) [4,5] innovation and creativity bridge in developing a new ecosystem in Industry 4.0 [6] and Society 5.0. The idea of sustainability with the usage of open data is based on some similarity to public goods, but their use enriches the common value of open data. [7] Open data, as a source of information and knowledge in a knowledge-based economy, might well be a free resource for end-users; however, its production, maintenance and gathering need to be secured [8,9] and maintained, with significant cost by skilled staff [10,11,12], with appropriate AI and Big Data technologies [13], and through implemented systems with open standards. Open data give access to help in creating added value in Industry 4.0 and Society 5.0, and support the idea of greater openness and accountability in business and administration governance [14], e.g., open initiatives like open government data (OGD) [15,16]. There are some questions in term of the economic issue of sustainable open data usage acceptance and development, e.g., how are open data projects are funded sustainably in the absence of a direct revenue stream, and how the business can count the source of revenue from open data or their impact in terms of competitive advantage? The purpose of the paper is divided into three parts:
  • Identifying the relationship between open data, Society 5.0 and Industry 4.0 to provide the context for open data’s performance expectancy for open data usage acceptance models’ research development;
  • Identifying the trends and key words (leading terms) in promoting open data for the application of open data in Industry 4.0 and Society 5.0;
  • Identifying leaders in Europe in promoting the use of open data in the context of Industry 4.0 and Society 5.0.
To achieve parts one and two of our purpose, we looked for currently dominant terms in open data performance expectancy creation and compared them with terms related to Society 5.0 and Industry 4.0. Our research was inspired by the work of Zuiderwijk et al. [17], in which “open data performance expectancy” is associated with presenting the benefits of using open data. Thus, this construct positively influences behavioural intention to use and accept open data technologies. The benefits of using open data are the subject of research by many scientists. We can find works describing the economic [18,19,20,21,22,23,24,25], social [26,27,28,29,30] and environmental [31,32,33] value of open data. Therefore, it is interesting to investigate the direction in which open data performance expectancy is shaped. In this way, we present the first research question:
  • RQ1: How are the products and services created on the basis of open data presented? What terms are dominating in the descriptions of presented case studies?
To achieve part three of our purpose we look for the geographical areas of Europe that have made a dominant contribution in creating open data performance expectancy. We explore the links between the geographical areas of Europe in terms of open data performance expectancy creation. Our research was inspired by works related to open data maturity in Europe [34,35,36,37,38,39]. These works gave insights into the development achieved in the field of open data in Europe. However, they do not investigate the links between individual regions and countries. In this way, we present the second research question:
  • RQ2: How are products and services created on the basis of open data promoted in particular parts of Europe? Are there similarities between those geographical areas?
Due to the fact that data are at the center of open data investigations [34,35,36,37,38,39,40,41], we could not only be interested in the descriptions of products and services based on open data, but also in the types of open data. Thus, we explord the most common types of open data used in the creation of products or services and explored the links between the geographical areas of Europe in this respect. In this way, we present the third research question:
  • RQ3: What kinds of open data are most frequently used? Are there similarities between the different geographical areas of Europe in this respect?
It is also worth adding the paper shows the continuation and supplementation of the proposed research into the “performance expectancy” construct for open data, presented in [42]. This kind of research, in the long term, may give an interesting insight into the development of the values promoted in society, and will bring a new perspective to the literature on the study of “performance expectancy” in the context of open-data-based sustainable development, Society 5.0 and Industry 4.0.
Aiming to achieve the above purposes and answer the three questions, we proceed with the literature review presented in Section 1, dedicated to describing the relationship between open data, Society 5.0 and Industry 4.0. In Section 2, we present a research methodology based on the analysis of materials promoting the implementation of open data using text mining, visualization techniques, correlation and cluster analyses. Section 3 described the research results, and in Section 4 we discuss the obtained results. The final section contains the conclusion.

2. Literature Review

The literature review showed that open data have been described in terms of different aspects of research. The theoretical and practical point of view showed the definition and evaluation of understanding the basics of open data in the context of openness and innovation. The context of data sharing in digital formats, e.g., PDF, XLS, CSV, RDF, LOD [43] became popular and—because of the pandemic—there are some necessary and important factors of digital data sharing in the electronic global ecosystem. The history of open data development created new terms and the associated initiatives of linked open data promotion in the web environment, e.g., Global Open Data Index (GODI) [44] or The Linked Open Data Cloud (LODC) [45]. The previous research had shown the impact of linked open data in the process of management in an e-society environment. Due to the linked open data principles, the open procurement data developed the ontologies’ standards, e.g., the Open Contracting Data Standard (OCDS) [46], and that is why the public sector has the opportunity to reuse terms from external vocabularies and ontologies when appropriate [47]. The linked open data have a big impact on public administration governance, but business informatics has not had enough mass satisfaction in reusing the gathering linked open data [1,3]. Smart and innovative businesses have the opportunity to reuse the big open dataset with smart technologies, web application and web data analysis techniques.
Research studies regarding ideas and methods of open data promotion for sustainable development for Industry 4.0 and the implication of open data promotion for Society 5.0 are lacking.

2.1. Open Data, Society 5.0 and Industry 4.0 Relationship

Theories on the information society [48] changing into a sustainable information society are described by Fuchs [49] and Wątróbski et al. [50]. Nowadays, due to the Sustainable Development Goals (SDGs) and dimensions of sustainability [51,52,53], the current information society theory is developing into sustainable super-smart society paradigm [53,54]. In 2016, the Japan Business Federation “Keidanren” proposed the definition of a new smart society of the 21st Century, responding to new economy needs with Industry 4.0. The new society was named Society 5.0 and described as a super-smart and human-centered society which resolves various social and economic challenges by incorporating innovations such as robots, big data and artificial intelligence [51]. Society 5.0 is described by Fukuyama [55], p. 48, as a “society of imagination”. Society 5.0 is expanding transparency and active participation in social issues, with equal opportunities for all people, and an integration of innovative technologies and society. The integration between cyberspace and physical space in the ecosystem of business and public government is possible to complete due to humans, Artificially Intelligent machines and robotics [51,55,56], advanced analytics and predictive decision support systems, and it creates an environment with the usage of high-IT technologies in Industry 4.0, and provides the opportunity to develop the competence of knowledge workers as well.
Improving the Industry 4.0 idea provided evidence of data needs for real-time data analysis and processing. This is described as a closed loop of relationships between physical and digital space. This cycle creates the physical-to-digital-to-physical loop as a cyber-physical space. The Industry 4.0 cycle improves the sustainable development of production, manufacturing, logistics, marketing, sales, etc. In manufacturing, the McKinsey Report showed the main levers of digitization in Industry 4.0; there are some value drivers of labor, inventories, supply/demand matching, time to market, service/after sales, resources/processes, and asset utilization, that improve the companies’ performance. A cyber industry developed based on IT technologies, such as IoT, sensors, advanced analytics, cloud computing, cyber security, smart and mobile application, artificial intelligence and augmented reality, and Cyber Industry Network, was created [57]. The practical implementation of Industry 4.0 involves innovative production, adaptive manufacturing, adaptive robotics, logistics with radio-frequency identification (RFID) and real-time locating systems (RTLS) [58], with a 5G network and communication technologies, etc. [59,60]. The sustainable development of Industry 4.0 creates an environment for developing knowledge management strategies for big, small and medium companies as well, thanks to the finance, cost and quality management that takes place with IT technologies [61]. There are still some challenges in creating an appropriate bridge between Industry 4.0 and Society 5.0 in order to co-create value for the sustainable ecosystem. Kagermann et al. [62] described the Industry 4.0 concept, showing basic recommendations for the business strategy. Qin et al. [63] and Biegelbauer et al. [64] suggested using actuators and sensors in Industry 4.0 on production and manufacturing lines. The cloud-computing technology usage in smart factory was described by Wang et al. [65]. Their research focused on the integration of industrial robots, i.e., Automated Guided Vehicles (AGV) in hybrid production with the industrial internet—communication and networking, and visualization technologies, such as virtual reality and augmented reality. Wang and Wang [66] and Wittenberg [67] showed the robotics industry in the case of the usage of a computer interface for human–computer interaction. Additional adaptive manufacturing systems were discovered by Gaub [68]. Big data analytics showed the additional impact of Industry 4.0 [69]. The cloud computing technologies show the impact on the process of the implementation of the management information system in Industry 4.0 as well [70]. The cyber-physical infrastructure of Industry 4.0 is one of the crucial topics of research interest [71,72], especially intelligent transportation, smart manufacturing, regional care, smart food-chain [64,73,74,75] and care-giving and medical treatment [64]. Regarding the search for the security drivers in Industry 4.0, research has been conducted in cybersecurity [76,77]. The digital factory [78,79] was connected with industrial environment mobile technologies [80] and the Internet of Things [81]. Terms in the literature review connected on Society 5.0 and Industry 4.0 (Table 1) showed open data and open innovations as key factors in the sustainable environment [52].
By analyzing the key terms describing Society 5.0 and Industry 4.0, we can see that some of the issues overlap, i.e., modeling processes and simulation with open data usage. It also seems that the bridge between the two concepts is focused on technologies supporting the creation of physical-to-digital-to-physical loops. This loop is used to ensure the sustainable development of a human-centered society with open innovation as a driving force for new business and services [51]. Therefore, when looking for the previously mentioned relationships, we can distinguish three main issues, such as: (1) human-oriented action; (2) sustainable development; (3) physical- to-digital-to-physical loop. This conclusion prompted us to pose our first hypothesis related to RQ1:
Hypothesis 1 (H1).
The dominant terms in the descriptions of open data-based products and services indicate the relationship with Society 5.0 and Industry 4.0.

2.2. Open Data Performance Expectancy

Since the main idea of using open data is to generate economic value by using open data in different ways and by different users, it is worth noting that this idea is firmly anchored in the realization of the idea of creating a “society of imagination”, which leads us directly to the idea of Society 5.0 [55] and Industry 4.0 [62]. In such a society, the imagination and creativity of different people lead to problem solution and value creation due to the technological transformation of Industry 4.0 [51,56]. As open data stem from the Society 5.0 concept, numerous researchers explore both the influence of open data on society functioning and factors that improve the use of open data. Among the papers dealing with open data, one can find works focusing on a selected field, e.g., medicine [82,83,84] or environmental issues [31,32,33]. However, there are also papers dealing with open data from a more general perspective. Such papers include those that describe the issue of economic value of open data [18,19,20,21,22,23,24,25]. There are also papers on the influence of open data on democratic processes through expanding transparency, citizens’ active participation in decision-making processes, policy making and solving social issues [26,27,28,29,30]. In the literature on open data, one can also find papers focused on exploring the conditions that are favourable for open data utilization [85,86,87,88,89,90]. Many of them bring the issue of open data quality to the fore [40,41]. Among the papers concerning research on the conditions favourable for open data utilisation are those that consider the issue of the design of platforms dedicated to open data. Such papers focus on very sophisticated issues, such as a context-specific approach [91].
It is not difficult to notice that although the papers devoted to open data focus on various economic, social or technical issues, two main research trends can be indicated. The first explores the question of open data usability and value. The second focuses on analysing factors that foster or hinder the increasing use of open data by society. Both trends lead to the subject of the acceptance of new technology. Though there are several models describing the acceptance of technology (theory of reasoned action (TRA) [92], theory of planned behaviour (TPB) [93] and technology acceptance model (TAM) [94], in this paper, one of the most important models describing the acceptance and use of new technology—the unified theory of acceptance and use of technology (UTAUT) model—was chosen as a background. This model is very often used to test the acceptance and use of Information Technology [95]. Open data acceptance has already been analysed with this model [17], as well as with the model resulting from social cognitive theory [96,97]. However, the observations made by the author of this paper refer more to the constructs proposed in the UTAUT model. The key idea of the UTAUT is that a number of factors lead to the behavioural intention to accept and use technology, while this behavioural intention, in combination with facilitating conditions, leads to the actual use of this technology [98]. Thus, Behavioural Intention to use Information Technology is an important construct in the UTAUT model. It is determined as an individual’s intention, prediction or plan to use a technology in the future. Four constructs have a direct influence on Behavioural Intention to use Information Technology. These are Performance Expectancy, Effort Expectancy, Social Influence and Facilitating Conditions. In addition, there are four more important moderators for this construct, i.e., Gender, Age, Experience and Voluntariness of Use.
The relationship between the trends surrounding open data research and the UTAUT model stems from the fact that, in order to use open data, it is necessary to use the related dedicated technology [17]. The first mentioned trend, which analyzes the usability and value of open data, is related to the UTAUT model construct described as “performance expectancy”. The second trend, which explores stimulants and destimulants of the growing use of open data, is connected with the UTAUT model constructs called “Effort expectancy” and “Social influence”. The research on the acceptance and use of open data technology with the use of the UTAUT model was conducted by Zuiderwijk and his co-workers [17]. They proved that “performance expectancy” and “social influence” are positively correlated with behavioural intention to use and accept open data technologies. On the other hand, “Effort expectancy” and “Voluntariness of use” are negatively correlated with the use intention and acceptance of open data technology [17]. Zuiderwijk and his co-workers have indicated a number of recommendations on how to develop individual constructs in order to increase behavioural intention to use and accept open data technologies. Each of these constructs is a broad research area with several subareas, which can be seen in the available literature on open data.
This article is part of the research area dedicated to the “performance expectancy” predictor. Performance expectancy in the UTAUT model is defined as “the degree to which an individual believes that using the system will help him or her to attain gains in job performance” [95], p. 447. Performance expectancy is a construct which, in terms of inducing motivation to act, has strong links to the self-determination theory (STD) [99], especially in terms of internal motivation. Moreover, Venkatesh [95] admits that obtaining valuable results, such as an increase in earnings or work efficiency, are significant motivators to use a particular technology. In the context of open data technology, this means that the “availability of open data technologies, such as data platforms, software, tools and interfaces increases individual’s or organization’s expectancy to perform better” [95], p. 431, and that the availability of these technologies will lead to tangible financial benefits. Zuiderwijk and his co-workers postulate that measures should be taken to raise awareness of the benefits of open data in order to increase social performance expectancy [17]. When analysing materials promoting open data in the Internet, one can see that this postulate is strongly realised. Different countries are building open data portals and promoting the benefits of open data technologies. In this context, it seems interesting to examine the direction activities promoting the expected benefits of using open data (performance expectancy). For this reason, we have formulated the following hypotheses related to RQ2 and RQ3:
Hypothesis 2 (H2).
There is a similarity in promoting open-data-based products and services in particular parts of Europe.
Hypothesis 3 (H3).
Northern, Southern, Western and Eastern Europe use similar types of open data.

3. Materials and Methods

3.1. Conceptual Scheme of Research Elaboration

In order to meet the main objective of the paper, the conceptual scheme of research elaboration was used (Figure 1).

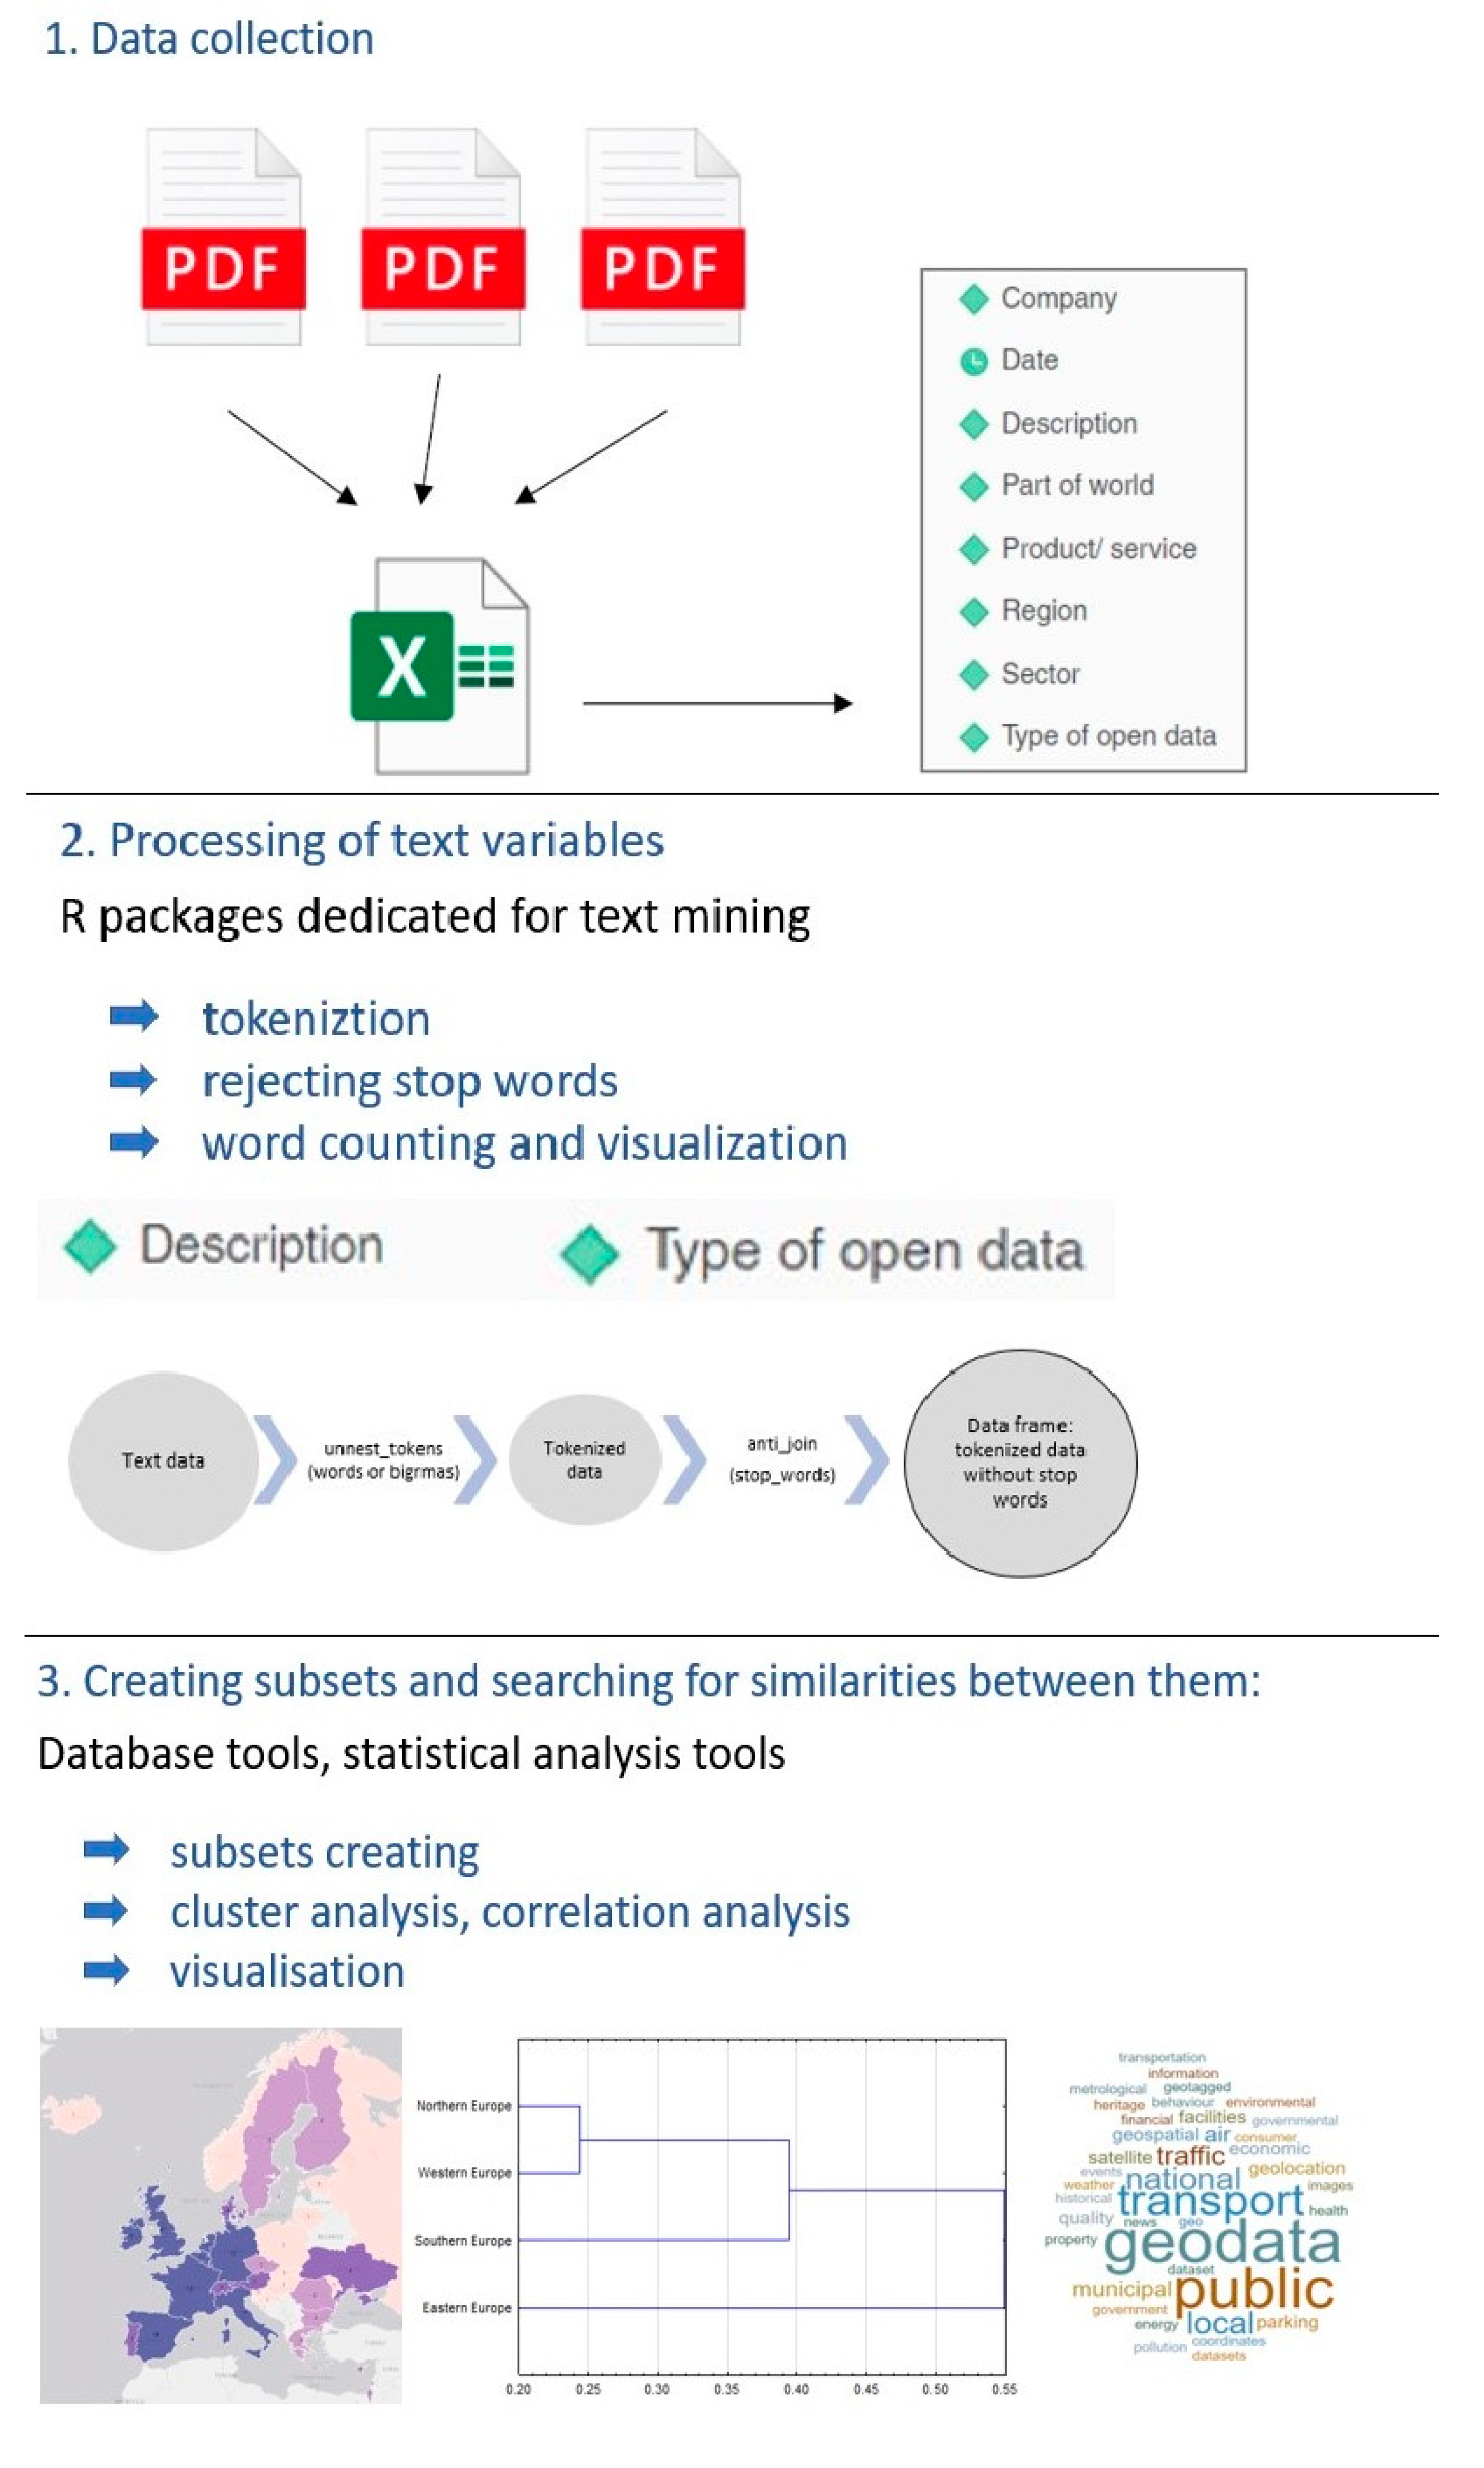
3.1.1. Stage 1: Collecting Data

The research data were retrieved from the European Data Portal (https://www.europeandataportal.eu/). This portal implements the policy of promoting benefits resulting from using open data and collects descriptions of applications, websites, portals and services using open data (the so-called use cases). The collected use cases come from different countries. Thus, files with descriptions of created products/services from the last two years, i.e., 2018 and 2019, and January 2020 were retrieved. This period covered descriptions of 288 applications, websites, portals and services using open data. The last two years were selected as file recovery dates, because only these data enabled us to use the text mining method properly. Data from earlier periods were incomplete and would distort the analysis.
The files were processed into a text format, organised into a data frame and further analysed using text mining, database and visualization techniques, cluster analysis and correlation analysis. Variables which are subject to analysis are presented in Table 2.

3.1.2. Stage 2: Processing of Text Variables

Although most of the variables presented are text data, some of them could only be analysed by means of text mining. These variables include “Description” and “Type of open data”. The analysis of these variables was made with the use of R packages dedicated for text mining. Thus, text data were tokenised into words and bigrams, and cleared from the so-called stop words, i.e., words that do not carry an important meaning (see Figure 2). The resulting set of tokens (words or bigrams) were subjected to counting and visualization, usually on tables and bar chart diagrams.
In this stage, the hypotesis H1 was verified.

3.1.3. Stage 3: Creating Subsets and Searching for Similarities between Them

Text variables were analysed in the context of the remaining variables, i.e., country and region of Europe (north, south, east, west). Thus, the above-mentioned operations of text mining were also performed on the data subsets. Thanks to this, an analysis was performed for the countries and regions of Europe. As a result of text mining, sets of tokens that were characteristic of a given subset (e.g., region of Europe) were achieved. In order to answer the question concerning the similarity of subsets, database techniques were used, which enabled us to link the created sets. The link was a field containing tokens selected at an earlier stage. Thanks to this, it was possible to use multidimensional cluster analysis, visualization, and calculate the correlation coefficient for the subsets. In the cluster analysis, we used the 1-Pearson distance as the distance function. As the principle for connecting cluster, the Ward method was used. The grouping of objects was performed with the hierarchical agglomeration method. This allowed us to generate hierarchically ordered clusters, which can be presented in the form of a dendrogram (hierarchical tree), presenting the distances between the objects.
Apart from calculating the correlation coefficient, the visualization of dependency between the subsets was performed on a scatter plot diagram. This visualization allowed for the identification of outliers that interfered with the correlation coefficient (see Figure 3). Thus, the outliers were rejected and the correlation coefficient was recalculated. The obtained results were visualized with the use of the following visualizations: bar chart, scatter plot, word clouds and map. For this purpose, R packages and data visualization tools, i.e., Mstr Desktop, were used.
In this stage, the hypoteses H2 and H3 were verified.

4. Results

4.1. Description of Research Sample

In order to present the research sample, meaning the collation of countries promoting products/services based on open data in 2018–2019, a bar chart and map visualization were developed, as presented in Figure 4.
As shown in the figure, the United Kingdom played a dominant role in the period under analysis. Among the top three countries were Spain and the Netherlands. The visualization on the map shows that Germany, Italy, France, Belgium and Ireland should be included in the group of countries that dominate in terms of promoting products and services based on open data. The identification of these countries is quite important because, in the following part of the study, the considerations were divided into Northern (70 cases), Southern (64 cases), Eastern (15 cases) and Western Europe (97 cases). There were 42 cases from outside Europe. Thus, it is worth noting that Northern Europe, which, in the analysed period, showed the highest activity in performance expectancy creation, was dominated by the United Kingdom and Ireland, with a small share of other countries from this part of Europe. The results were similar in Southern Europe, where Spain and Italy dominated, with a small share of other countries. This means that these parts of Europe feature large variation in the degree of activity of individual countries. The situation was different in Western Europe, where one can see the significant activities of several countries, i.e., Netherlands, Germany, France and Belgium, which means that, with respect to activity in promoting products and services based on open data, this part of Europe was less diverse in the analysed period. Eastern Europe is characterised by similar low diversity. However, countries from this part of Europe showed low activity in the analysed period.

4.2. Terms that Dominate in Descriptions of Products and Services Using Open Data

When answering the first research question about the dominant terms in products/services descriptions, based on the variable “Description”, a set of words (Table 3) and bigrams (Table 4) was created. The analysis of words showed a large number of the term “data”, which dominated all other terms. This domination shows the leading role of data in the analysed products and services, which, of course, is not surprising. Therefore, in further analysis, this term was treated as an outlier, which could have a significant impact on the subsequent stages of the analysis of the obtained data. Then, the terms “information”, “users” and “public” scored big numbers. This is evidence of the promotion of the benefits of providing user-oriented information linked to public objectives, which is, of course, closely linked to the nature and idea of open data. The focus on users is also highlighted by the presence of the following nouns in the further part of the ranking: “people”, “citizens” and “user”, as well as verbs: “provide”, “collects”, “access”, “enables”, “helps”, “offers”, “create”. The role of these terms will be more broadly discussed in the bigram analysis. The large number of terms such as “application”, “website” and “platforms” is also worth noting. This ranking presents the available products/services created based on open data. The most popular are applications and websites, while platforms take the third position. As it was possible to compare the results of analysis using the text mining technique (on the “Description” variable) with the visualization techniques on the “Products/services” variable (see Table 2), such a comparison was made. In this way, it was found that the most popular products/services in the analysed period were applications and websites with a smaller share of platforms, companies and services.
Apart from the terms related to user benefits and those describing the options of created products/services, the ranking also presents a group of terms connected to a particular business sector. The dominant role, in this respect, is played by terms related to transport, i.e., “transport”, “location”, “traffic”, “parking”. The domination of these terms is not surprising if we analyse the range of business sectors in the analysed period, in which transport is at the forefront (see Figure 5).
Analysis of bigrams (Table 4), similarly to the analysis of words, selected the term that has the role of an outlier. In the case of bigrams, it was the term “real time”, which illustrates the main benefit of using open data. In the bigrams, one can see the presence of an outlier determined at the stage of word analysis, meaning the term “data”, which now appears with other terms, i.e., “collect (-s, -ed)/gathers data”, “public data”, “data sources”, “data portal”, “data visualization”, “data driven”, “weather data”, “transport data”, “traffic data”, “data quality” and “geospatial data”. The analysis of the bigrams also selected further phrases connected with presenting the benefits of products/services based on open data. These are phrases containing verbs like: “collects data”, “enable people”, “provide users”, “helps users/people”, “provide real”, promotes transparency”, as well as phrases containing adjectives like “user friendly”, “easily accessible”, “additional information”. Using these phrases in communication encourages users to use the new product/service. This also suggests a high focus of the promotional message on the end user, which is characteristic of marketing communication. The second group of phrases consists of those related to the specificity of a sector for which the created product/service is dedicated. Thus, these include phrases such as: “parking facilities”, “public transport”, “traffic information” “bike citizens”, “arrival times”, alternative fuelling”, “air quality”, “public toilet”, “real estate”, “land insight”, “house price”. Thus, with reference to Figure 5, presenting the dominant sectors during the period under examination, it can be seen that, in the bigram, terms that are characteristic of the transport sector are the leading group. The third group of phrases present in the bigrams are those related to methods of open data processing and visualization: “machine learning”, “artificial intelligence”, “search engine”, “predictive models”, “data visualization”, “interactive maps”, “graphic information”. When comparing the most common words and biographies with the terminology found in the Society 5.0 literature, we can find great similarities. Thus, the H1 hypothesis was accepted.

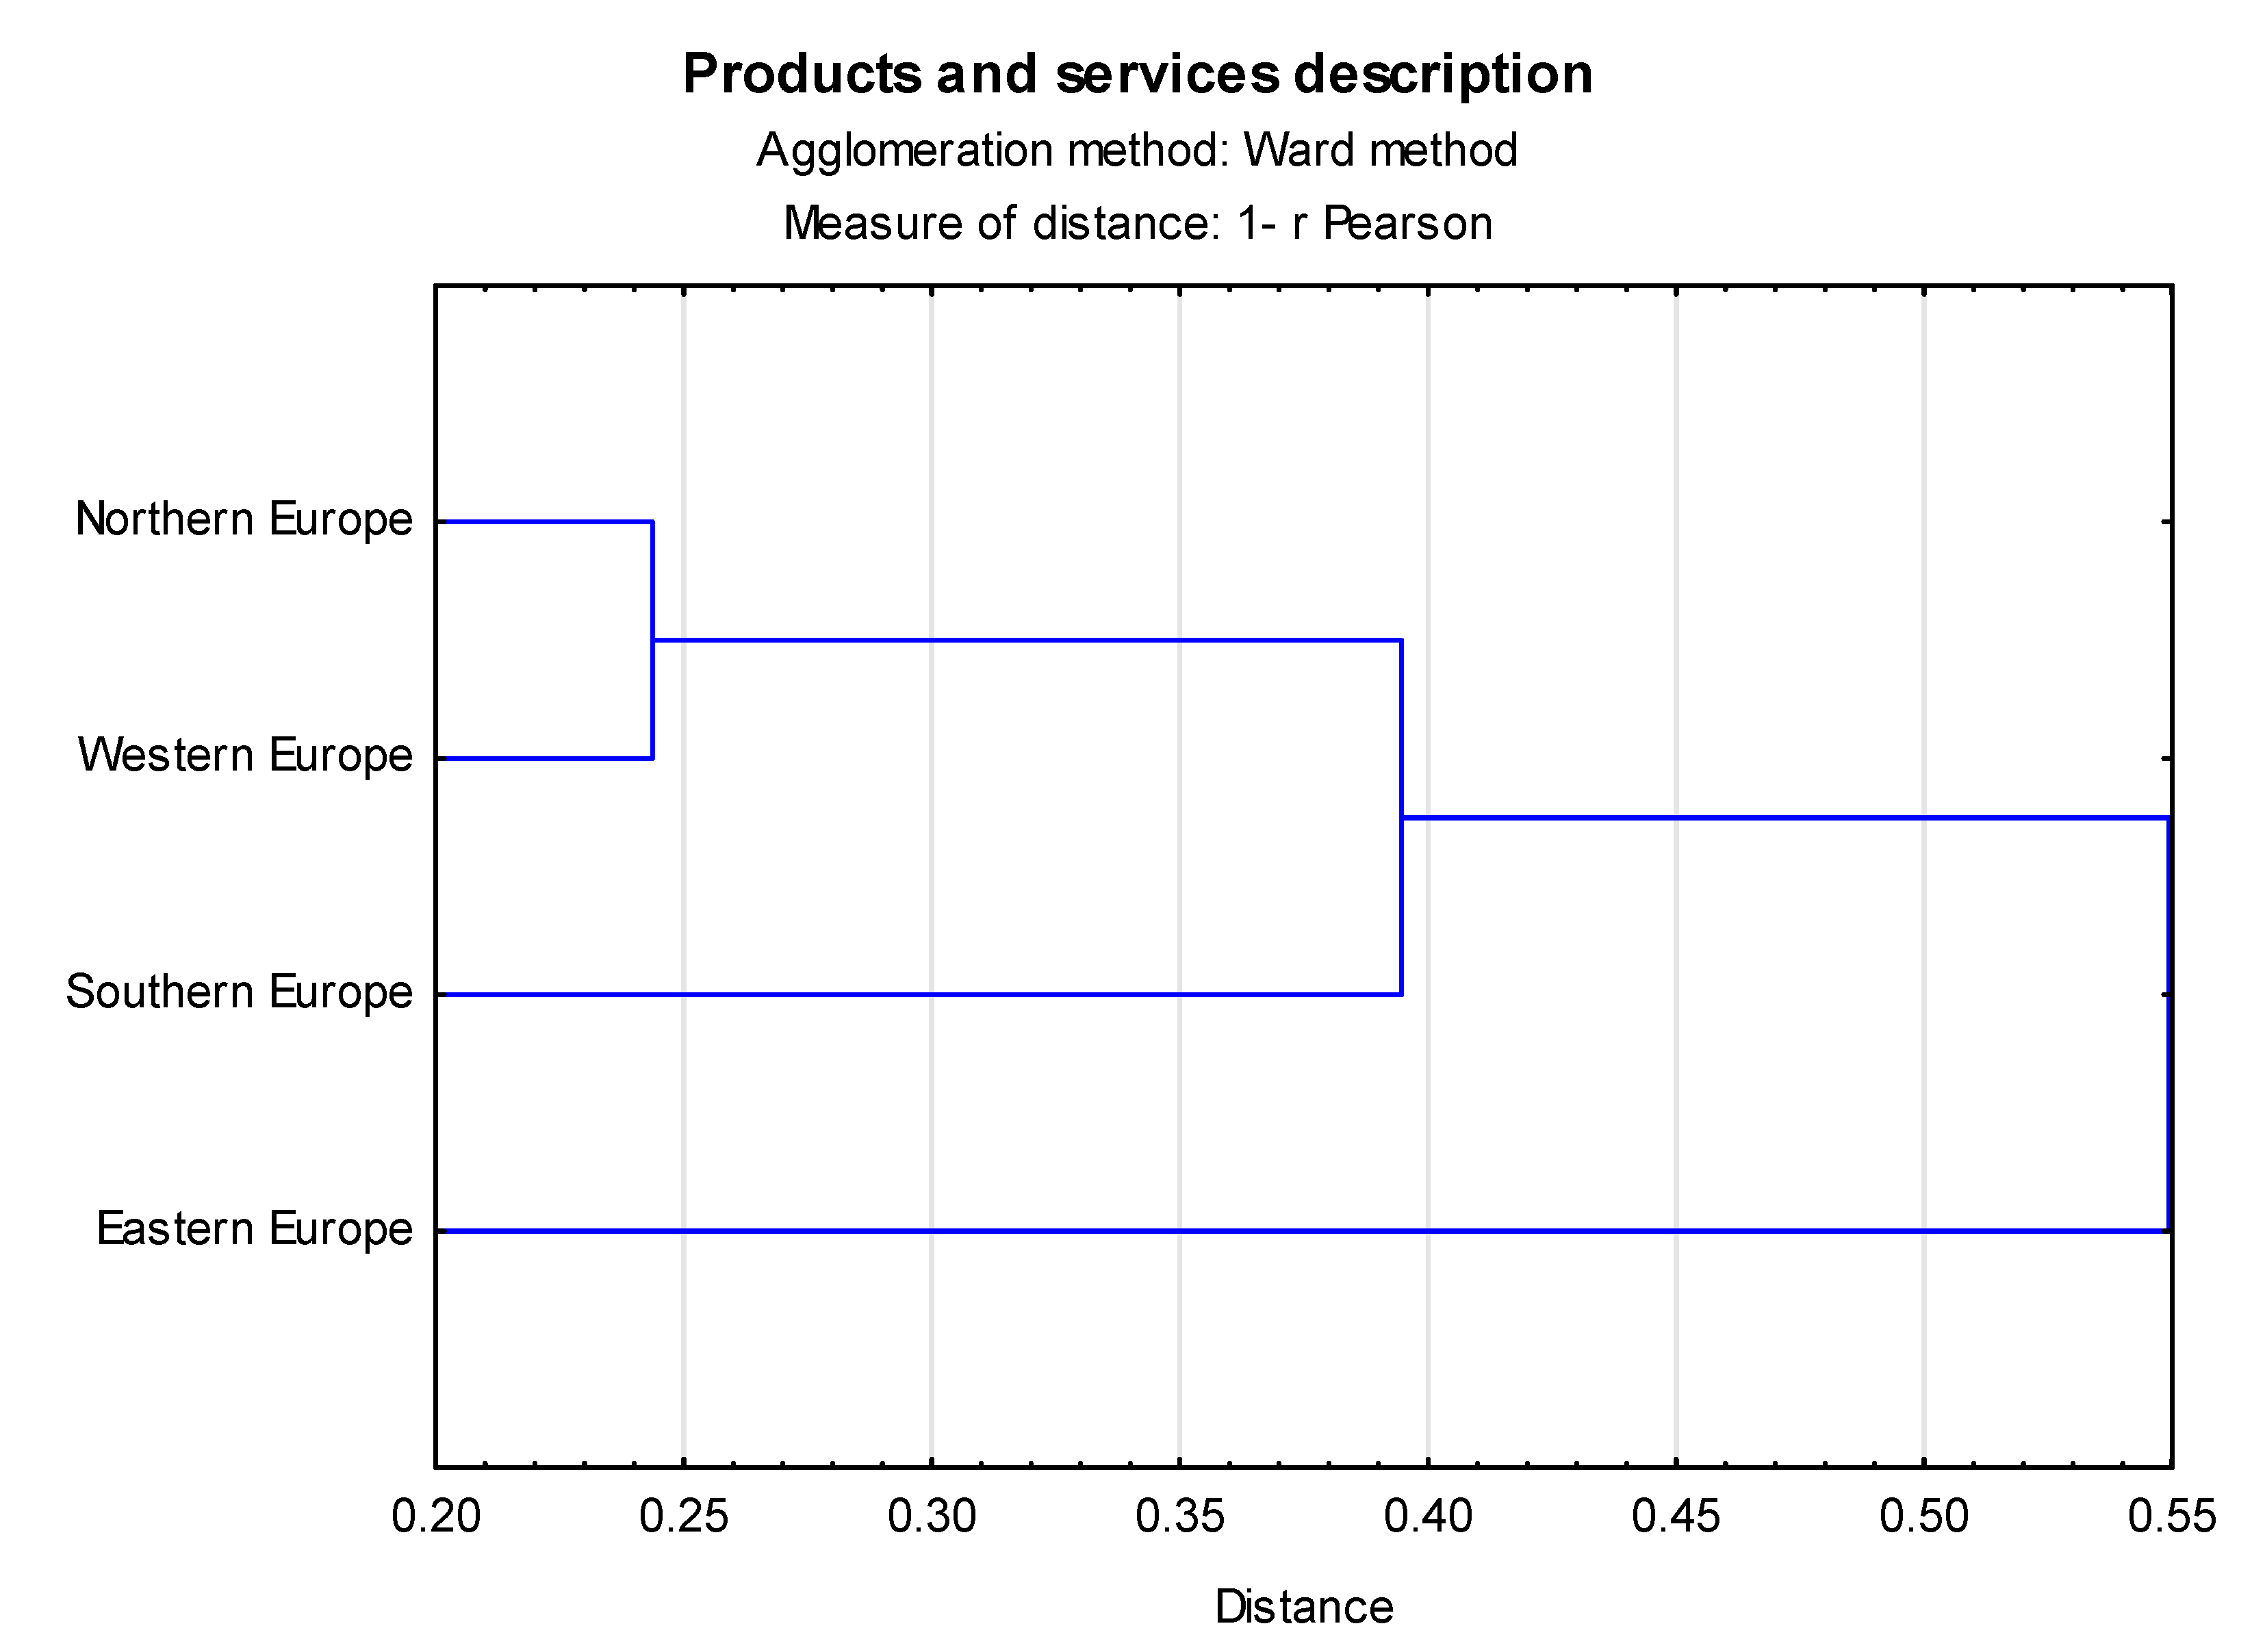
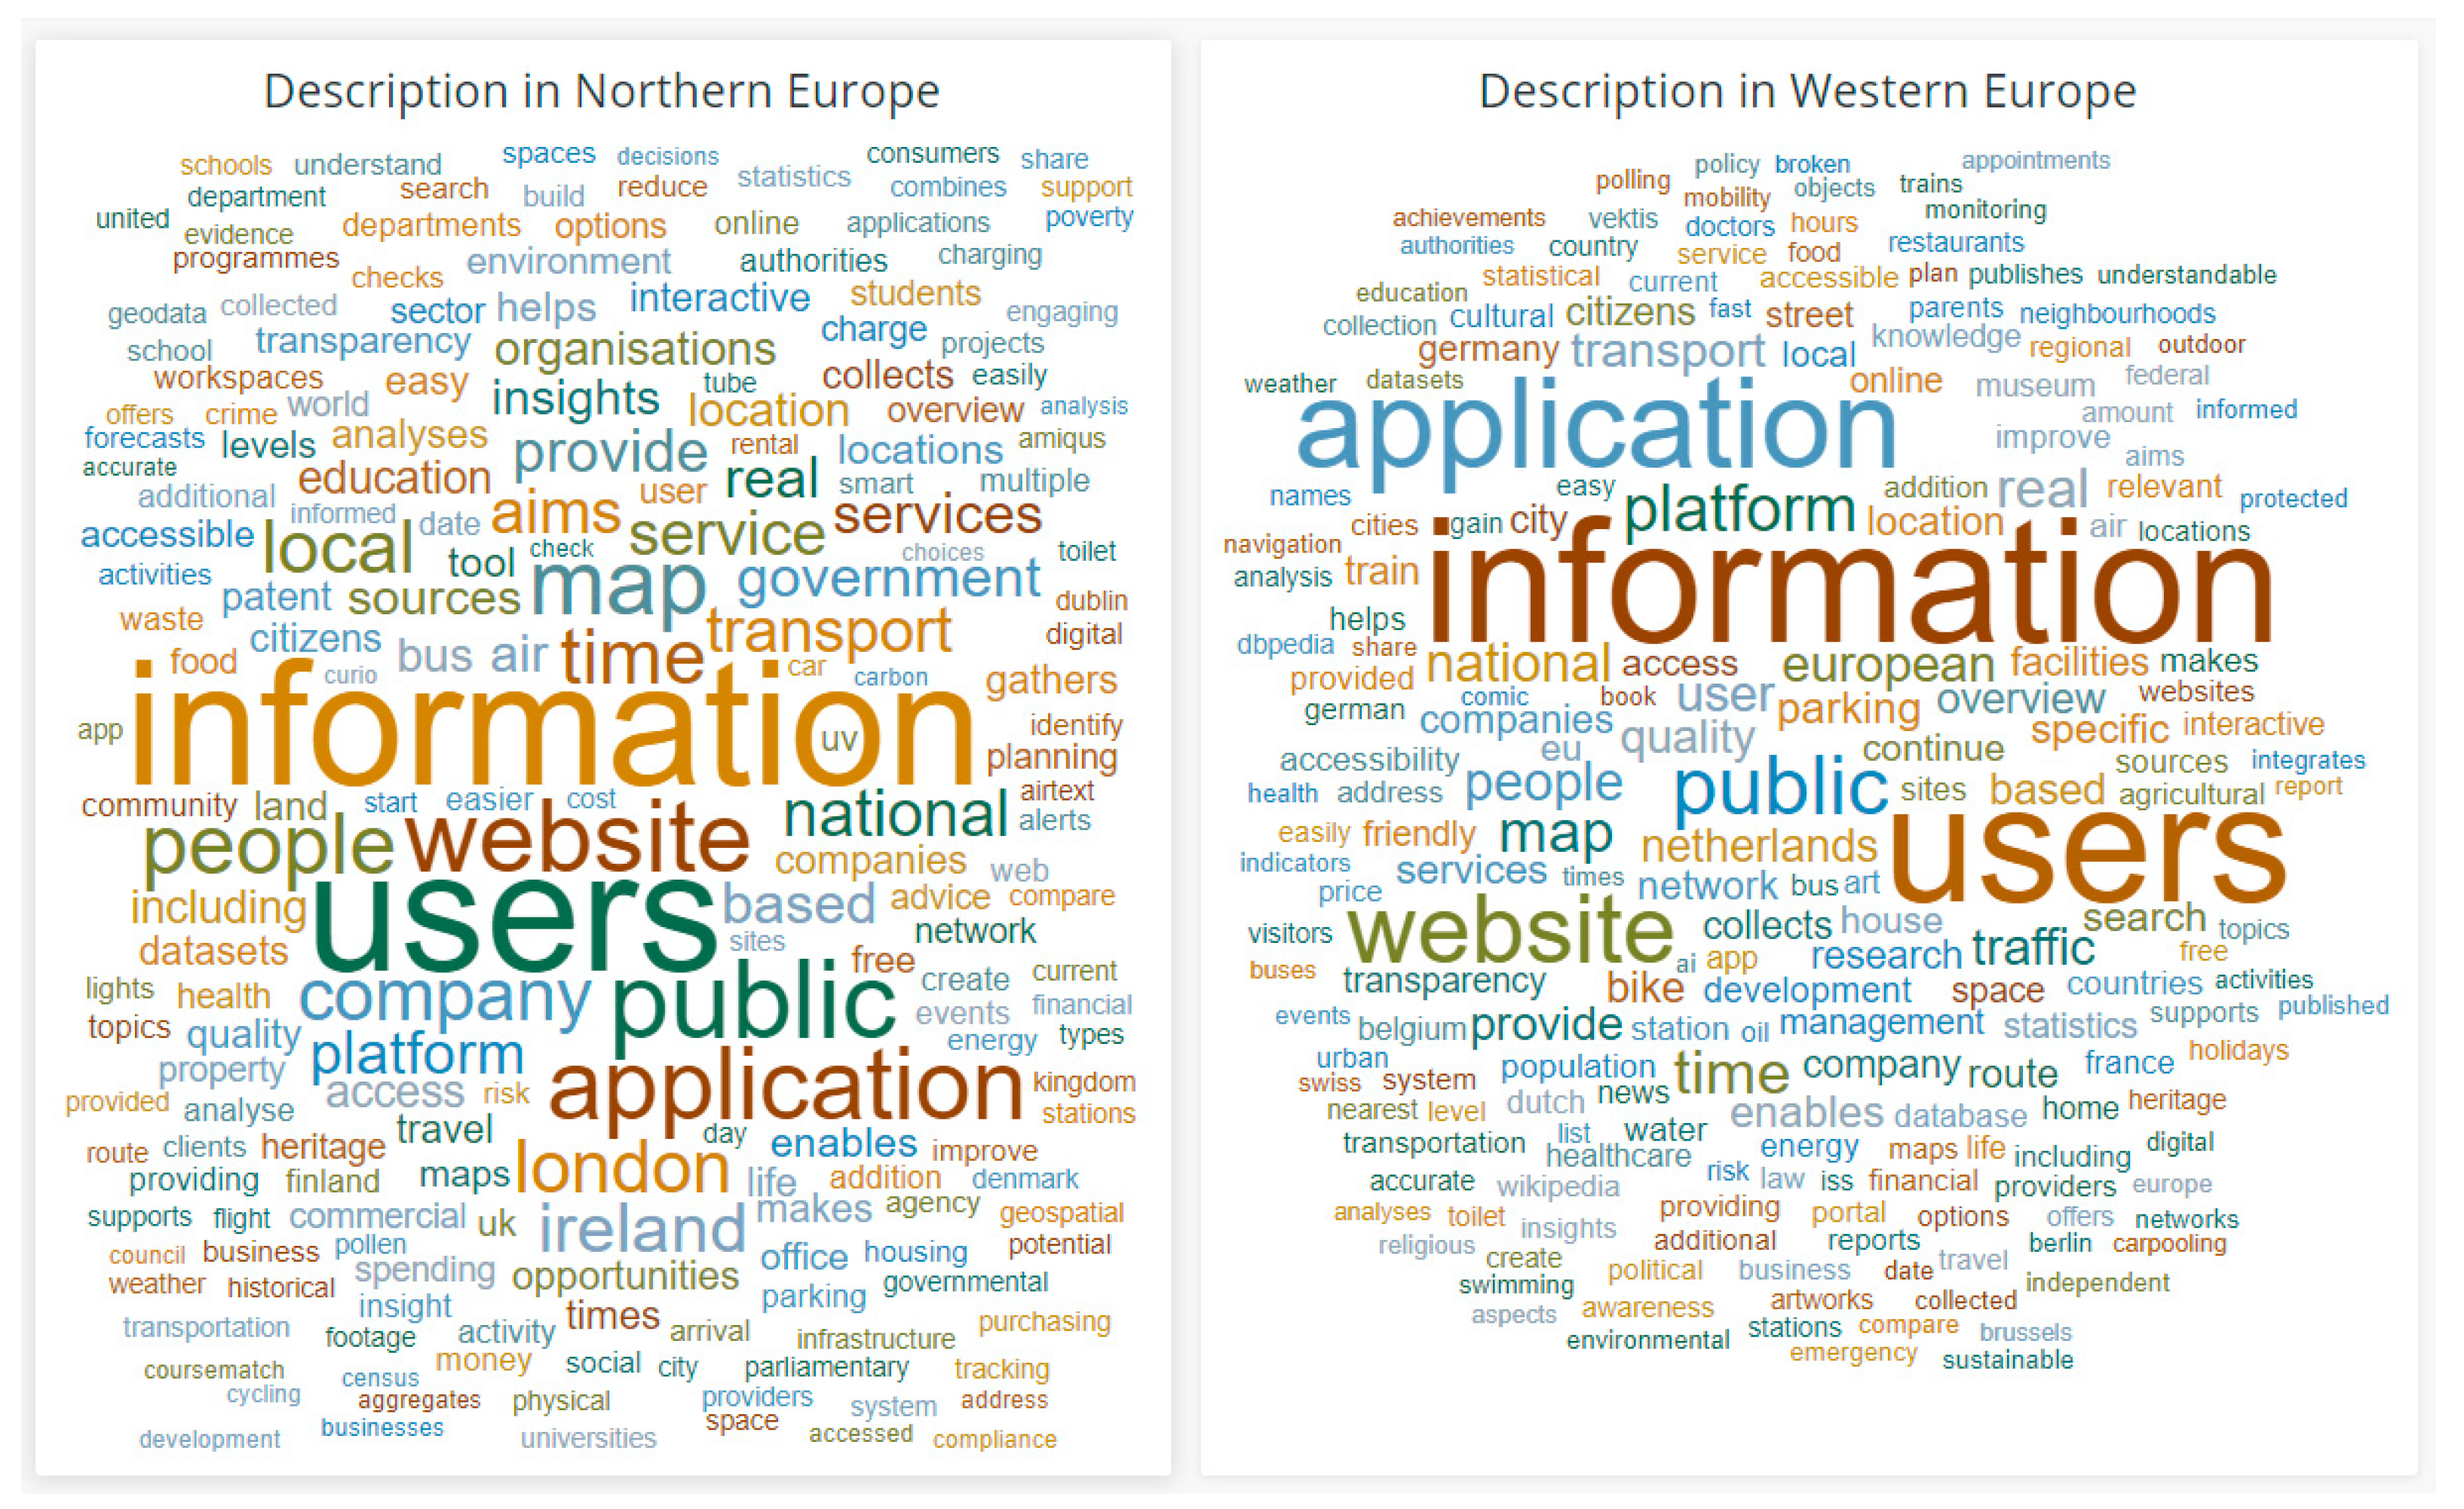
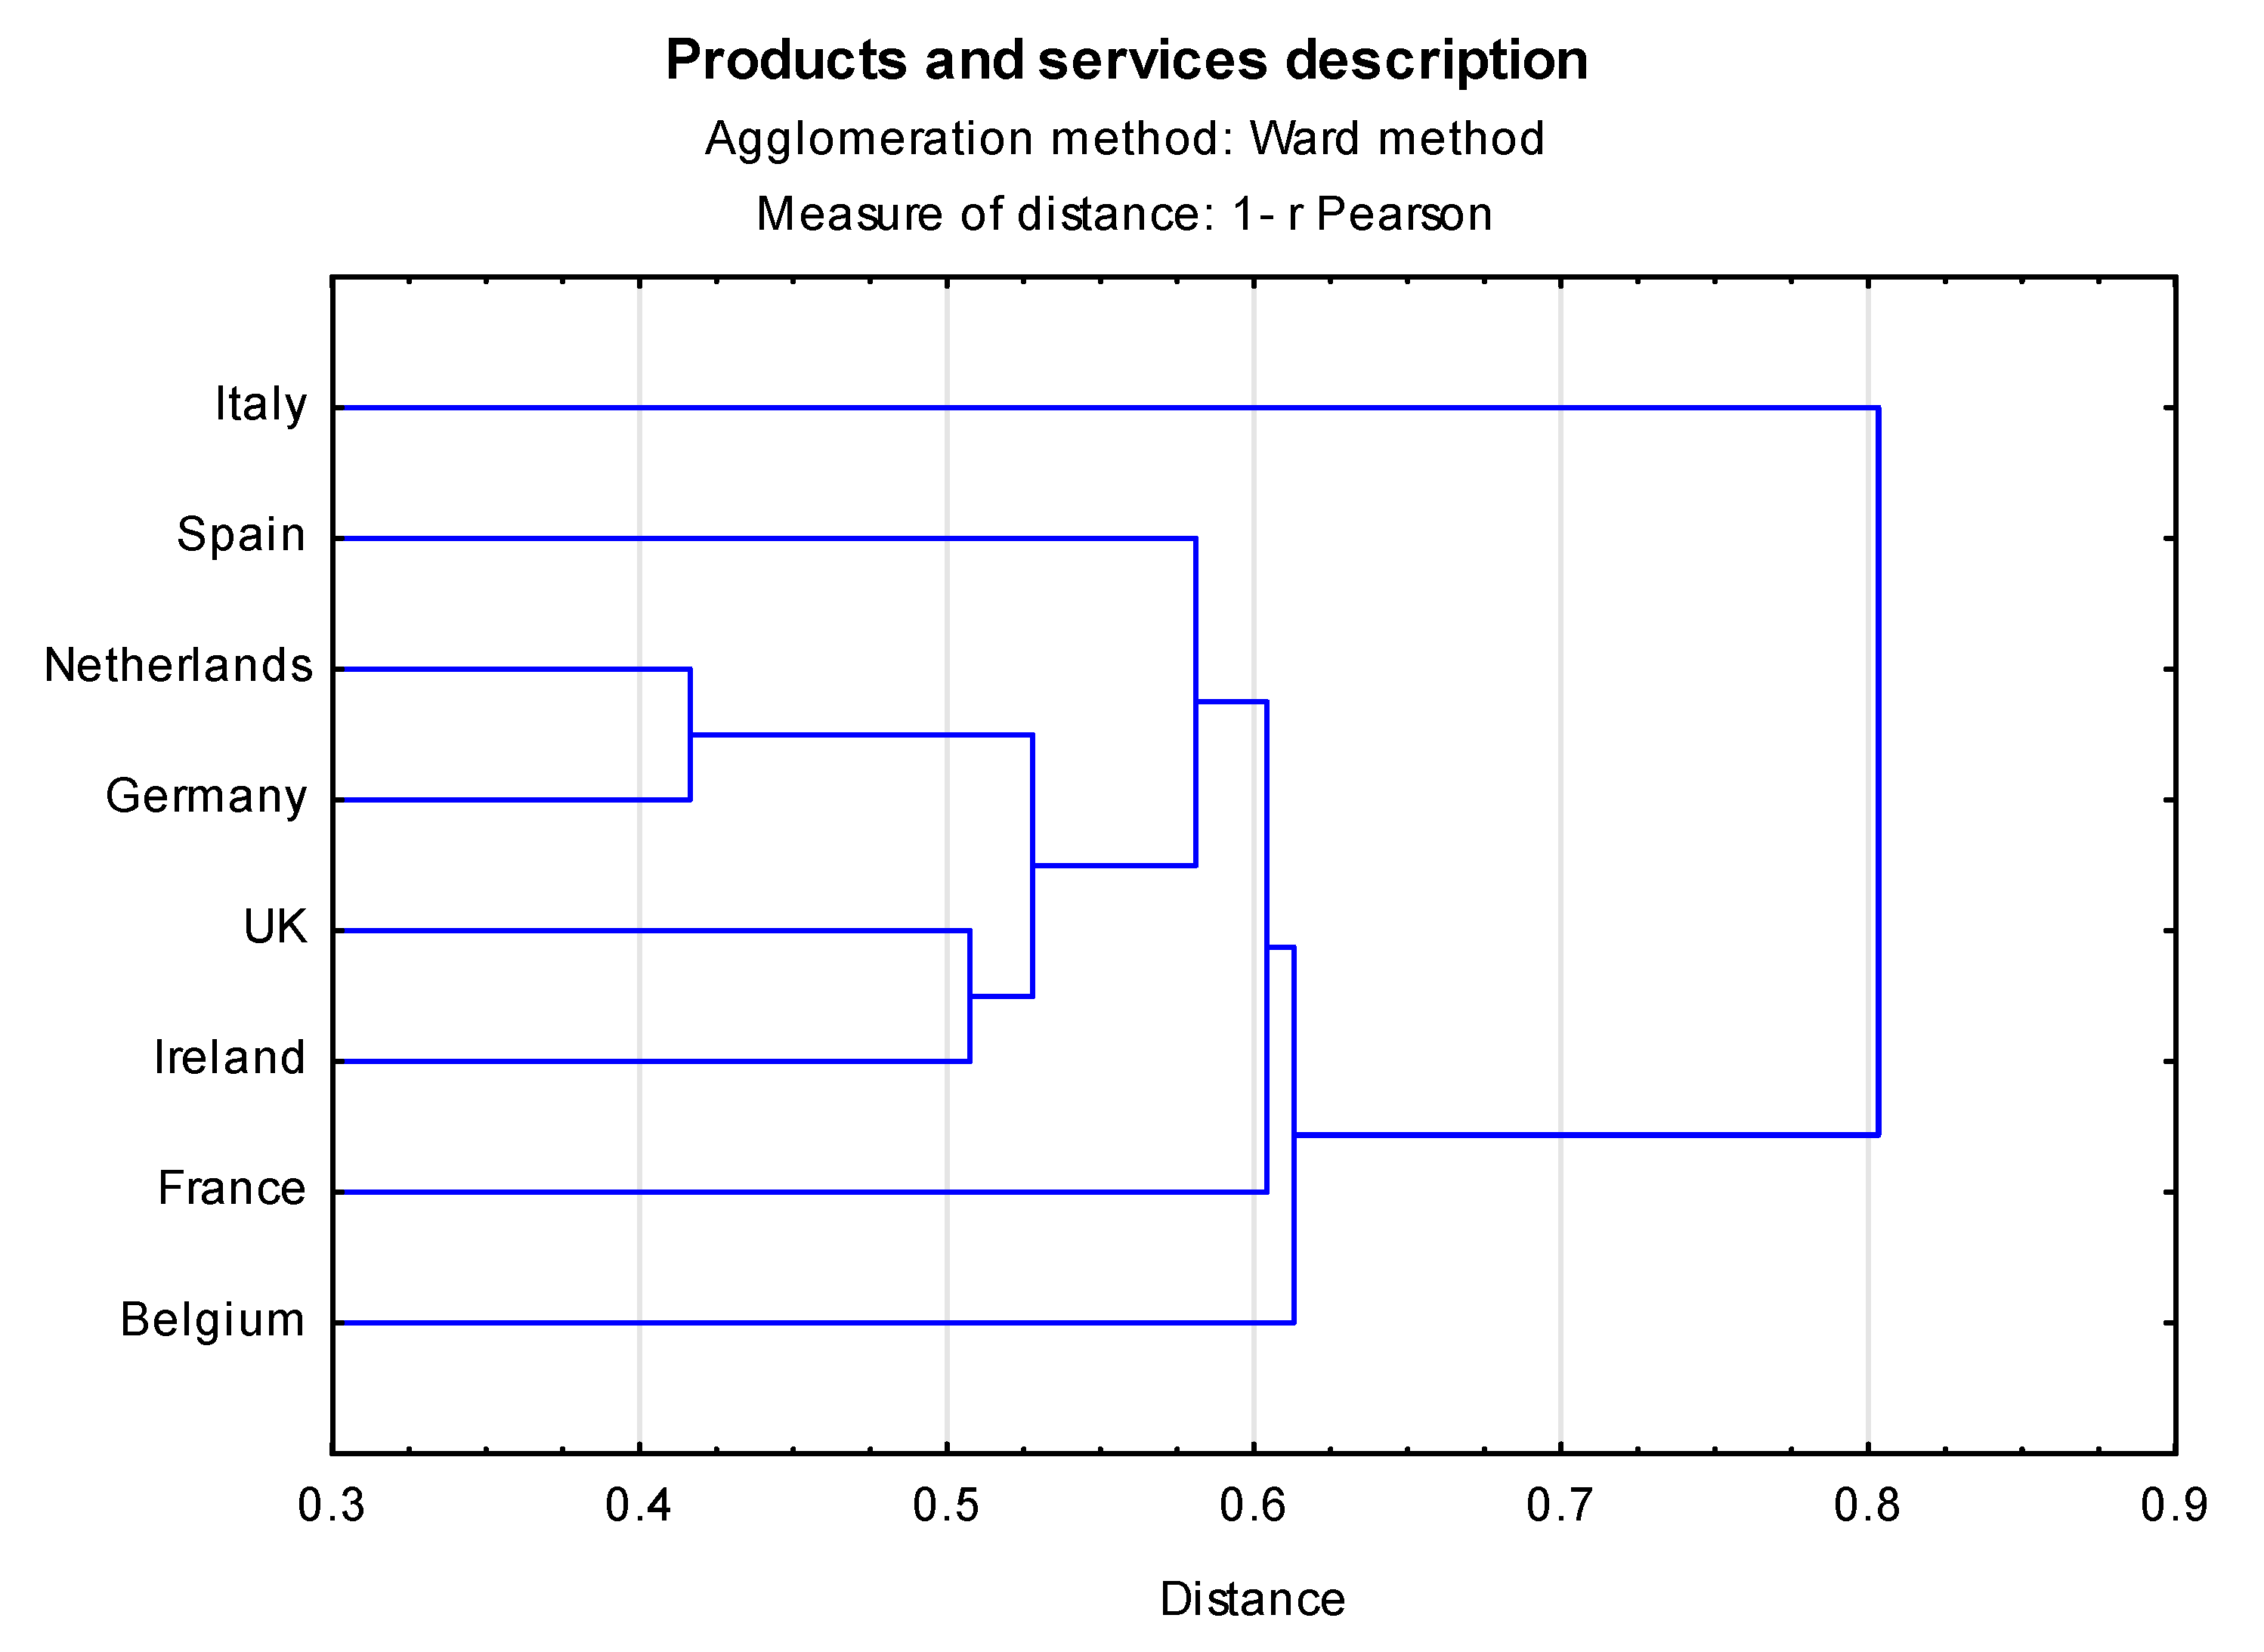
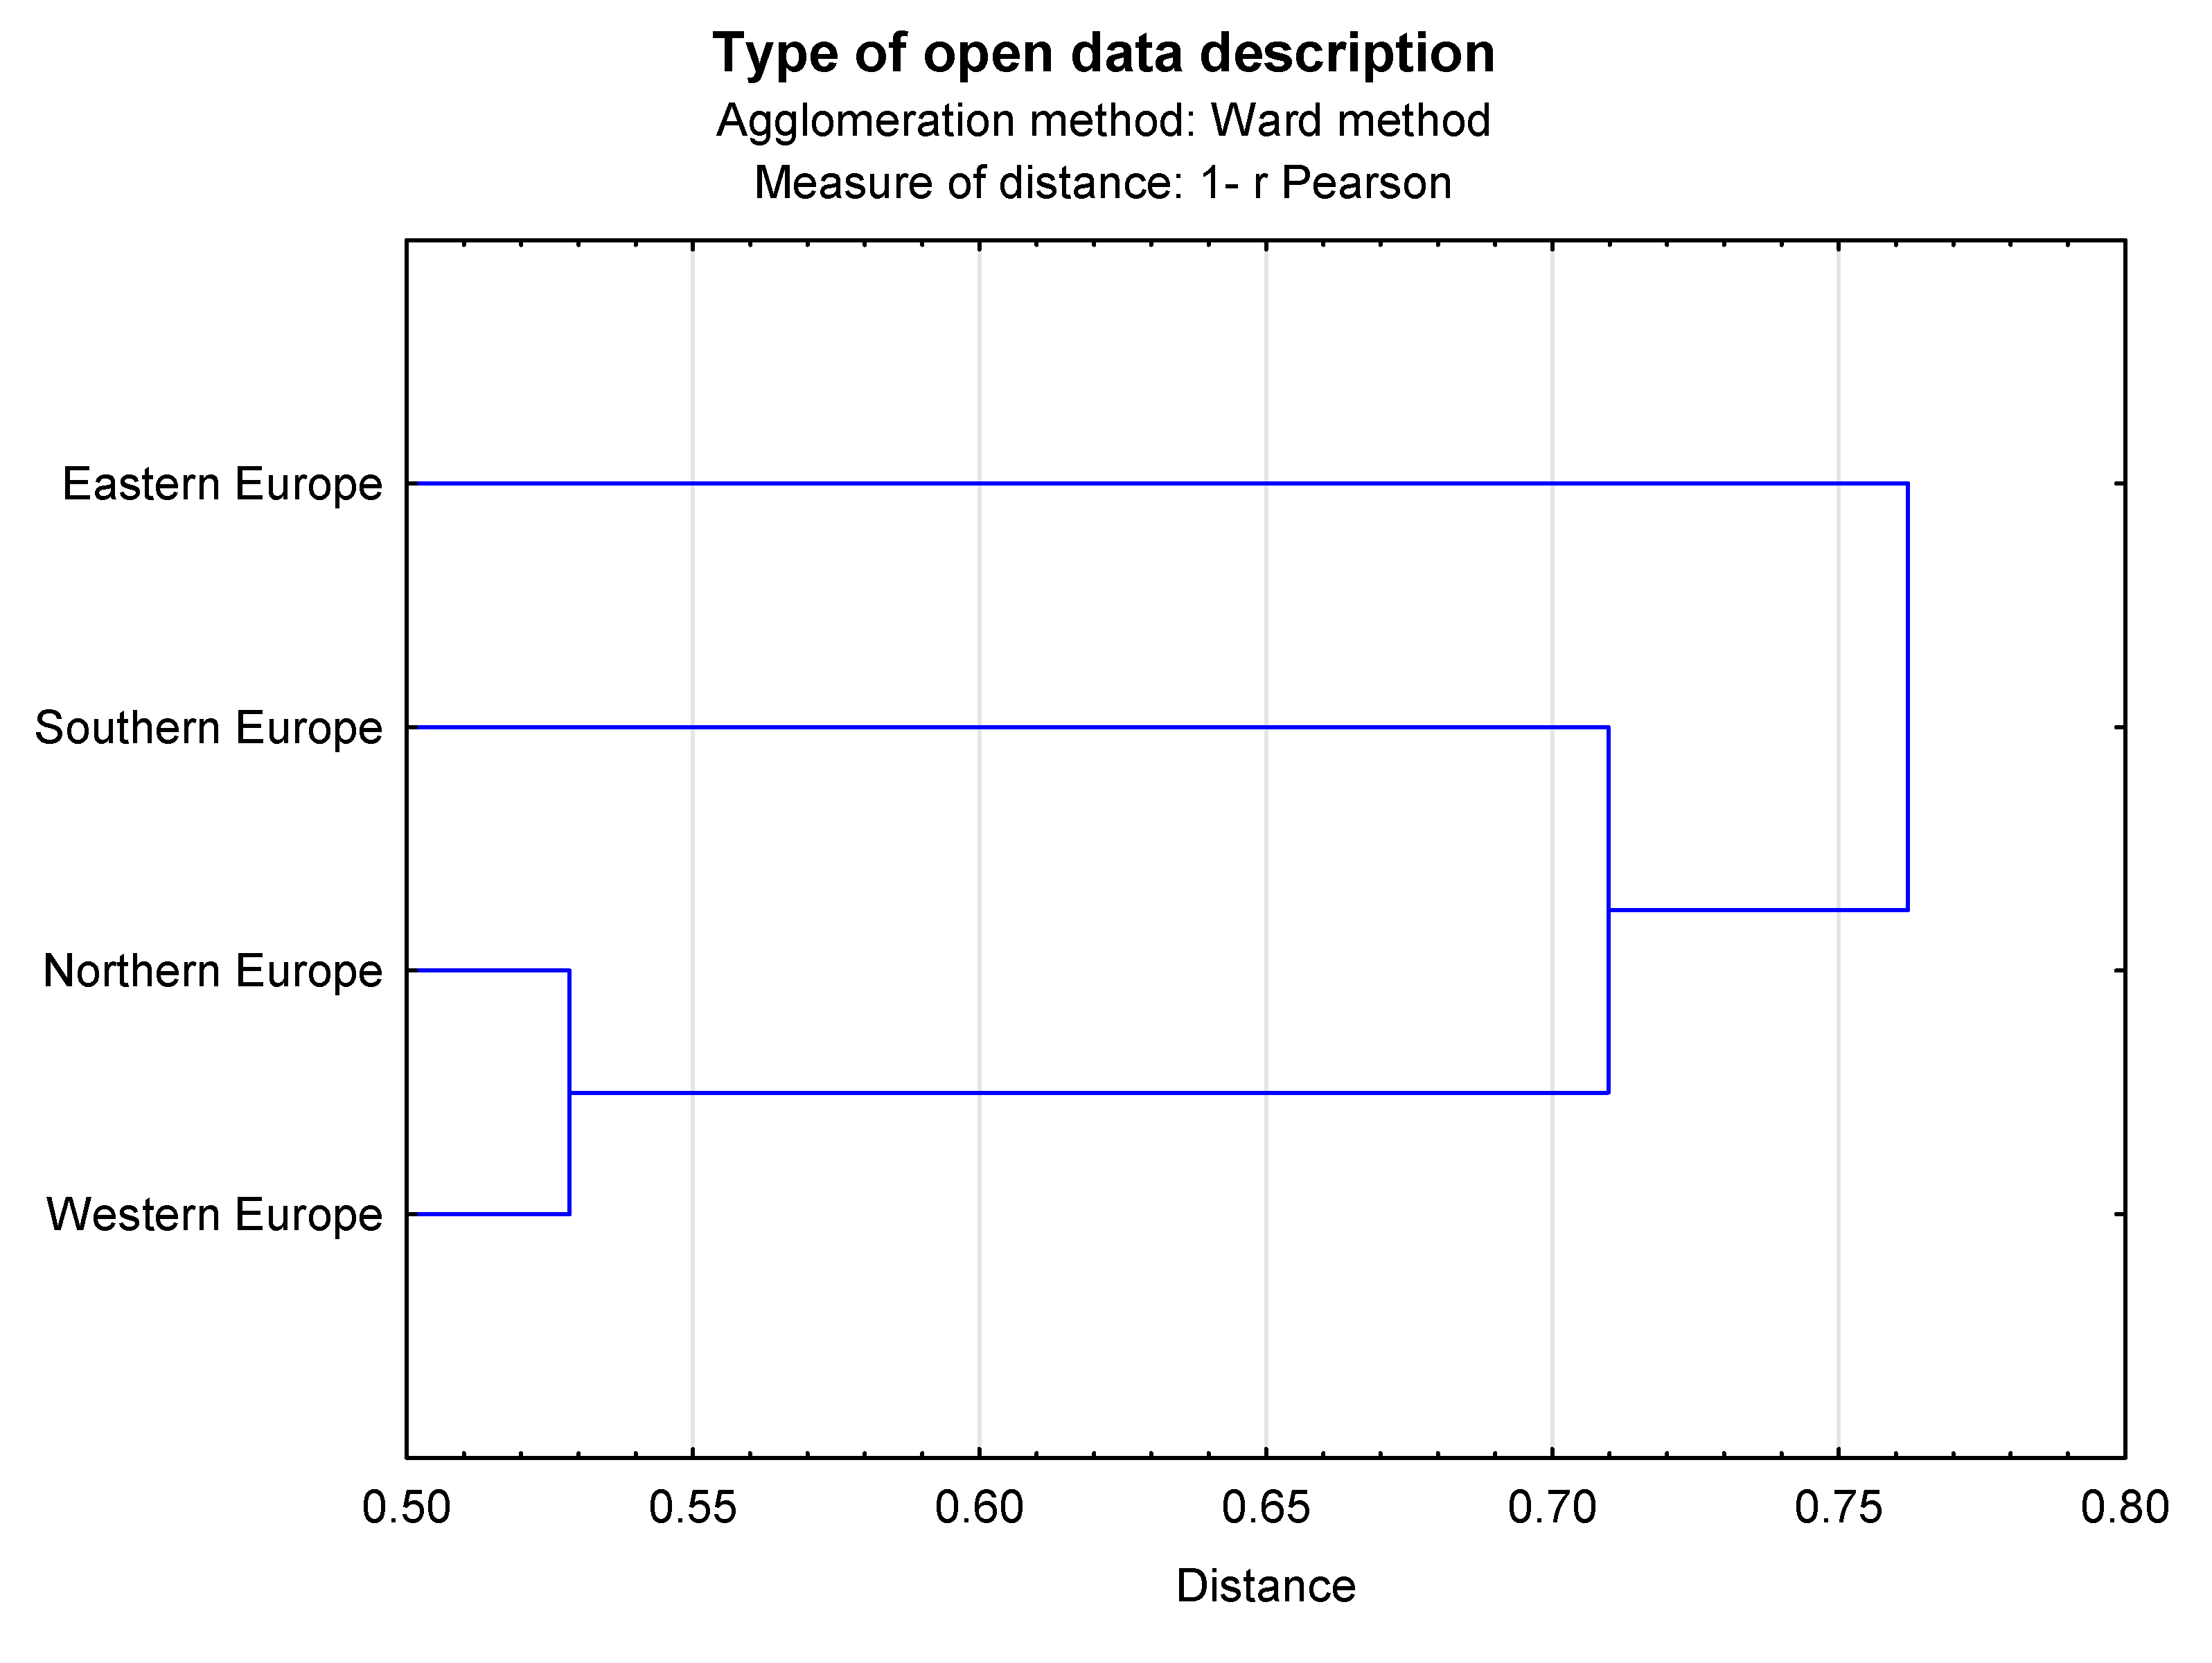
4.3. Analysis of Terms in a Geographical Context—Finding Similarities between Regions

The answer to the question about similarities between geographical areas was sought by means of multidimensional cluster analysis and correlation coefficients analysis. First of all, sets of words characteristic of four geographical areas of Europe were created, i.e., Northern Europe, Southern Europe, Western Europe and Eastern Europe. Then, visualization and relevant calculations were made. A correlation test was also performed, which showed that the correlation coefficients are significantly different than zero (Table 5).
The presented research results show that the most correlated sets of words are those for Northern Europe and Western Europe (0.867), Northern and Southern Europe (0.821) and Southern and Western Europe (0.811). Relatively lower correlation coefficients could be observed everywhere where Eastern Europe was present. When analyzing the dendrogram (Figure 6), we can see that Eastern Europe also acts as a separate cluster.
It is also worth noting that the calculated correlation coefficients were also influenced by some of the words. This can clearly be seen, particularly on the word-cloud visualizations (see Figure 7). Those words were mainly “information”, “users”, “application”, “website” and “public”. Thus, in further analysis, those words were removed from the sets and correlation coefficients were calculated again. Their values are also presented in in the Table 5. The recalculated correlation coefficients have much lower values, however, as before, the correlation between the sets of words from Western, Eastern and Southern Europe is greater than in the case of pairs of sets containing words from description of use cases from Eastern Europe. The previously observed general tendency related to a correlation of sets was also observed after removing outliers.
In addition to the analysis of the relationship between the above-mentioned regions of Europe, a cluster analysis for selected countries was also performed. For this analysis, countries with the largest number of products and services based on open data were selected. In Figure 8, we can see that it is possible to distinguish a cluster consisting of the Netherlands, Germany, Great Britain, Ireland and Spain. France, Belgium and Italy exist as separate clusters.
Thus, taking into account the results of the performed analyses, we can conclude that hypothesis H2 was accepted.

4.4. Types of Open Data Used in Products and Services

When analysing the text variable related to the description of the types of open data used for creating products/services, one can note a large number of occurrences of the word “data”. This term dominated all other terms in the analysed word set. This mainly proves the leading role of the term “data” for modern technology, which is indeed characteristic of the idea of a super-intelligent society. However, it must be noted that this term was treated as an outlier in further analysis, which resulted in its removal from datasets at the stage of correlation coefficient calculation. Therefore, a similar algorithm was used as for the variable “Description”, discussed in the previous sections. However, further examination of the results of the text-mining analysis performed on the variable “Type of open data” shows that the data referred to as “national”, “local” and “public” were present in large numbers. They occur more frequently than data referred to as “government” or “municipal” (Table 6). At the top of the ranking of the most common types of open data, there are also those referred to as “geodata”, whose number would increase even further if they were combined with terms such as “geospatial”, “geographic(al)” that appear on further positions in the ranking. At the top of the range of types of open data, there are also those referred to as “transport” (data). Data related to the transport sector can be also found on further positions of the ranking, together with terms such as “transportation”, “traffic”, “parking”. Table 6 also shows why the most frequently promoted products/services based on open data in the analysed period included such sectors as cultural and educational and financial and economic. However, apart from the leading role of the transport sector, Table 6 does not present a direct reflection of the range of the top sectors, shown in Figure 5.
The words used to describe the type of data used were also analysed in the regional perspective, divided into Northern, Southern, Eastern and Western Europe. Thus, sets of words characteristic of the above regions were obtained. Then, the analysed regions were compared in pairs in order to answer the question “Are types of data used in particular regions similar?” To this end, correlation coefficients were calculated. They showed that sets of Northern and Western Europe are the most similar (correlation coefficient = 0.472). The second highest correlation coefficient (0.425) was the one between sets for Northern and Southern Europe. All correlation coefficients were statistically significant. The same conclusions can be drawn from the analysis of the dendrogram in Figure 9. Thus, Hypothesis H3 was accepted.
As the correlation between Northern and Western Europe turned out to be the largest, the word cloud visualization in Figure 10 was also made. We can note that, in Northern Europe, the most popular data types are geodata, public and transport. In Western Europe, in addition to the above-mentioned types, they used the most frequent national, local, government, health, municipal data.

5. Discussion

In the article, we answered three research questions and verified three research hypotheses. The H1 hypothesis, which states that “The dominant terms in the descriptions of open data-based products and services indicate the relationship with Society 5.0 and Industry 4.0”, was defended. Analysis of the number of words present in the descriptions of products and services showed a large presence of terms related to the words “data” and “information” (see Table 3). These terms are characteristic of the terminology present in the texts describing Society 5.0 [46]. We also noticed the leading role of the “real time” concept (see Table 4) characteristic of the idea of Industry 4.0 [58]. Comparing other words and bigrams describing products and services based on open data with key terms from the literature related to Society 5.0 and Industry 4.0, we noticed terms related to: (1) human-oriented action, (2) sustainable development, and (3) physical-to-digital-to-physical loop (see Table 7). The trend observed in our research is also visible in other works related to open data. Thus, human-oriented actions are noticeable in papers concerned with the political impact of open data [27,28,29,30] and their economic value [18,19,20,21,22,23,24,25]. Subsequently, sustainable development is present in articles related to environmental issues [31,32,33]. Additionally, the political, economic and environmental impacts are components of one of the dimensions of open data maturity indicated in [34]. Regarding the physical-to-digital-to-physical loop, we can indicate papers related to data quality [40,41]. Thus, the trend observed in our research is concurrent with trends present in other researchers. In our opinion, the links responsible for this are ideas of Society 5.0 and Industry 4.0.
Using the text mining method, we extracted the most common terms from the description of products and services based on open data. Subsequently, using correlation analysis (see Table 5) and cluster analysis (Figure 6), we defended the H2 Hypothesis, which states that “there is a similarity in promoting open data-based products and services in particular parts of Europe.” However, we should add that the correlations between Northern, Western and Southern Europe are moderate, and the correlations between Eastern Europe and the rest of Europe are somewhat weak. The development of “performance expectancy” was not evenly implemented in Europe over the years under study. The most active countries in this respect are the United Kingdom, the Netherlands, Spain and Germany, Italy, France, Belgium, and Ireland. When comparing these results with an analysis of open data maturity in Europe [34,35,36,37,38,39] one can see that these are the countries referred to as “trend setters” or “fast trackers”. It is, therefore, not surprising that they are very active in promoting products and services based on open data, and therefore very active in performance expectancy. It is also worth mentioning that research by Zhong [58] indicated the scientific centers from the United Kingdom, Germany, France, and Italy as those publishing numerous papers devoted to the idea of “intelligent manufacturing”, which is another important idea related to Industry 4.0. This gives rise to the assumption that the high positions of these countries in both rankings related to open data use and rankings of scientific publications on intelligent manufacturing can be linked. The similarity of sets of words for Northern, Western and Southern Europe also shows the economic relations of these parts of Europe.
Eventually, by text mining, correlation and cluster analyses (see Table 8 and Figure 9), we defended the H3 Hypothesis, which states that “Northern, Southern, Western and Eastern Europe use similar types of open data.” However, we should add that only the correlation between Northern and Western Europe is moderate, and the correlations between the rest part of Europe are weak. Our results also confirm the predominant role of Northern and Western Europe in the field of types of open data, by using the open data described in works [34,35,36,37,38,39].
We used the concept of open data performance expectancy coming from the theory of the acceptance model. This is a particularly important construct whose role is to arouse the need to use a given technology (in this case, open data technologies) by promoting the benefits of this technology. Performance expectancy is a construct that, in terms of inducing motivation to act, has strong links to the STD motivation theory [99], especially in terms of internal motivation. The main purpose of the “performance expectancy” construct is to present and promote the benefits of using open data technology, which, in the context of STD, has connotations of influencing the intention to use open data technology by perceiving it as a technology that significantly determines the efficiency of its users. Analysis of the documents promoting the use of open data has also shown that the main direction in presenting the benefits of open data products and services is to promote them as tools to provide information on public issues in real time, primarily in areas such as transport, education, culture and sport, economics and finance and health. The issues of data collection and provision to the user, enabling them to access information, and ensuring transparency related to public issues, are highlighted.
It is worth noting that the transport sector is one of the sectors that used open data most frequently in the analysed period. This may be explained by a noticeable intensification of innovative activities in logistics and seeking a new and better performance of logistics tasks through digitation of its processes [81]. This brings us to a subject related to the idea of Industry 4.0, where the digitization of logistic processes allows for sustainable development in areas indicated by Kayikci and described by him as three dimensions of sustainability, i.e., economic, environmental and social dimensions [53]. Therefore, it can be assumed that a large number of products and services that use open data in the transport sector fit into these dimensions and allow for more reasonable fuel consumption (fuel savings), implying financial (and therefore economic) savings and reduction in environmental pollution and the use of non-renewable resources (environmental dimension) and social benefits (social dimension) in terms of improved health through cleaner air and noise reduction.
The main limitation of the conducted research is the short research period (January 2018–January 2020). A period of 10 years would be a better research period. However, to date, data from such a long period are not available. The research sample also included big disproportions between the number of promoted solutions based on open data. For example, Eastern European products/services were few in number, while the United Kingdom dominated all other countries in terms of geographical area. In subsequent studies, however, with more use cases available for analysis, these limitations will no longer be present.

6. Conclusions

In the article, we realized three parts of the article purpose and we answered three research questions. Realization of part one of our purpose led us to the research findings described in Society 5.0 and Industry 4.0 relations. They showed that the bridge between the two concepts is focused on technologies supporting the creation of a physical-to-digital-to-physical loop to ensure the sustainable development of a human-centered society. When building the bridge between Society 5.0 and Industry 4.0, our investigation showed three main issues, such as: (1) human-oriented action; (2) sustainable development; (3) physical-to-digital-to-physical loop. In this context, we considered the performance expectancy of open data.
The results obtained in the first part allowed us to fulfill part two of our purpose and answered the first research question. Thus, the research results indicated that the most popular digital products and services based on open data are applications, websites and platforms. Analysis of the number of words present in the descriptions of products and services based on open data showed a high presence of terms related to the words “data” and “information”. These terms are characteristic of the terminology present in the texts describing Society 4.0 and Society 5.0. Analysis of bigrams depicted terminology typical for physical-to-digital-to-physical loop (“real time”, “machine learning”, “artificial intelligence”, “search engine”, “predictive models”, “data visualization”, “interactive maps”, “graphic information”, “data driven”). Thus, while the terms “data” and “information” have grown out of the concept of Society 4.0, the promotion of data processing by artificial intelligence and its provision to physical space for human use shows that, in materials that promote the usefulness of open data, there are ideas stemming from the concept of Society 5.0. This postulate is reinforced by the fact that analysis of both words and bigrams show significant user focus, which is also directly connected with the postulates of human-oriented action (“enables people/users”, “help people/users”, “provide users”, “easily accessible”, “user friendly”). We also noticed the presence of terms related to sustainable development (“air quality”, “bike citizens”, “parking facilities/spaces”, “public transport/transportation”, “traffic data”, “transport data”).
Realization of part three of our purpose allowed us to answer the second research question. Thus, the most active countries in promoting open data performance expectancy are the United Kingdom, the Netherlands, Spain and Germany, Italy, France, Belgium and Ireland. The most uniform geographical area in terms of the creation of open data performance expectancy is Western Europe; in Northern and Southern Europe, the dominating countries can be found, while Eastern Europe shows the smallest activity. The correlation between Northern, Western and Southern Europe is moderate and the correlation between Eastern Europe and the rest of Europe is somewhat weak.
Correlation and clustering of word sets for particular parts of Europe was also made at the stage of analysis of the used open data types. In this way, we answered the third research question. Thus, Northern, Southern, Western and Eastern Europe use similar types of open data. However, only the correlation between Northern and Western Europe is moderate, and the correlations between the rest of Europe are weak. The main types of open data for the most active countries are those referred to as national, local and geodata.
The text-mining analysis of the variable describing the open data type also showed the presence of data related to sectors where products or services based on open data were most often promoted. The data obtained through text mining technique did not allow for the establishment of a ranking of data in relation to the sector, but it did allow one to notice the leading role of data related to the transport sector. However, due to that fact that text mining analysis was not the only type of analysis performed; it was also possible to distinguish typical sectors based on visualization of the “Sector” variable. This proved that the leading sectors in the analysed period were, apart from transport, the education and culture sector, economic and finance sector, and environment sector. Thus, these are the sectors where open data were most frequently used.

Author Contributions

Conceptualization, A.S.-P., I.Z.; methodology, I.Z.; formal analysis, I.Z.; investigation, A.S.-P., I.Z.; resources, A.S.-P., I.Z.; writing—original draft preparation, A.S.-P., I.Z.; writing—review and editing, A.S.-P., I.Z.; visualization, I.Z. All authors have read and agreed to the published version of the manuscript.

Funding

This paper was published as part of statutory research at the Silesian University of Technology, Faculty of Organization and Management.

Data Availability Statement

Not applicable.

Conflicts of Interest

The authors declare no conflict of interest.

References

  1. Abramowicz, W.; Węcel, K. Should Business Informatics Care about Linked Open Data? In Lecture Notes in Business Information Processing—BIR 2013: Perspectives in Business Informatics Research, Proceedings of the 12th International Conference, BIR 2013, Warsaw, Poland, 23–25 September 2013; Kobyliński, A., Sobczak, A., Eds.; Springer: Berlin/Heidelberg, Germany, 2013; Volume 158, Available online: https://doi.org/10.1007/978-3-642-40823-6 (accessed on 12 December 2020).
  2. Berners-Lee, T. Linked Data—Design Issues, W3C; ACM Press: New York, NY, USA, 2006; Volume 7. [Google Scholar]
  3. Węcel, K. Procurement in Linked Open Data Paradigm. In Technologie Wiedzy w Zarządzaniu Publicznym 2013; Gołuchowski, J., Frączkiewicz-Wronka, A., Eds.; University of Economics in Katowice: Katowice, Poland, 2014; Volume 199, pp. 338–348. [Google Scholar]
  4. Mishra, D.; Mishra, A. Sustainability Inclusion in Informatics Curriculum Development. Sustainability 2020, 12, 5769. [Google Scholar] [CrossRef]
  5. Szarek-Iwaniuk, P.; Senetra, A. Access to ICT in Poland and the Co-Creation of Urban Space in the Process of Modern Social Participation in a Smart City—A Case Study. Sustainability 2020, 12, 2136. [Google Scholar] [CrossRef] [Green Version]
  6. Tolstykh, T.; Shmeleva, N.; Gamidullaeva, L. Evaluation of Circular and Integration Potentials of Innovation Ecosystems for Industrial Sustainability. Sustainability 2020, 12, 4574. [Google Scholar] [CrossRef]
  7. Chignard, S. A Brief History of Open Data, Paris Tech Review. 29 March 2013. Available online: http://www.paristechreview.com/2013/03/29/brief-history-open-data/ (accessed on 12 December 2020).
  8. Kożuch, B.; Sienkiewicz-Małyjurek, K. Information Sharing in Complex Systems: A Case Study on Public Safety Management. Procedia Soc. Behav. Sci. 2015, 213, 722–727. [Google Scholar] [CrossRef] [Green Version]
  9. Salloum, S.A.; Al-Emran, M.; Shaalan, K. The Impact of Knowledge Sharing on Information Systems: A Review. In Communications in Computer and Infor-mation Science—KMO 2018: Knowledge Management in Organizations, Proceedings of the International Conference on Knowledge Management in Organizations, Žilina, Slovakia, 6–10 August 2018; Uden, L., Hadzima, B., Ting, I.H., Eds.; Springer: Cham, Switzerland, 2018; Volume 877. [Google Scholar] [CrossRef]
  10. Marcos, E.; De Castro, V.; Martín-Peña, M.; Vara, J.M. Training New Professionals in Service Engineering: Towards a Transdisciplinary Curriculum for Sustainable Businesses. Sustainability 2020, 12, 8289. [Google Scholar] [CrossRef]
  11. Kitchin, R. The Data Revolution: Big Data, Open Data, Data Infrastructures and Their Consequences; Sage: London, UK, 2014. [Google Scholar]
  12. Mourtzis, D. Development of Skills and Competences in Manufacturing towards Education 4.0: A Teaching Factory Approach. In Proceedings of the 3rd International Conference on the Industry 4.0 Model for Advanced Manufacturing, AMP 2018, Belgrade, Serbia, 5–7 June 2018; Lecture Notes in Mechanical Engineering. Ni, J., Majstorovic, V., Djurdjanovic, D., Eds.; Springer: Cham, Switzerland, 2018. [Google Scholar] [CrossRef]
  13. Al Mansoori, S.; Salloum, S.A.; Shaalan, K. The Impact of Artificial Intelligence and Information Technologies on the Efficiency of Knowledge Management at Modern Organizations: A Systematic Review. In Recent Advances in Intelligent Systems and Smart Applications; Studies in Systems, Decision and Control Book Serious; Al-Emran, M., Shaalan, K., Hassanien, A., Eds.; Springer: Cham, Switzerland, 2021; Volume 295. [Google Scholar] [CrossRef]
  14. Gagliardi, D.; Schina, L.; Sarcinella, M.L.; Mangialardi, G.; Niglia, F.; Corallo, A. Information and communication technologies and public participation: Interactive maps and value added for citizens. Gov. Inf. Q. 2017, 34, 153–166. [Google Scholar] [CrossRef]
  15. Afful-Dadzie, E.; Afful-Dadzie, A. Liberation of public data: Exploring central themes in open government data and freedom of information research. Int. J. Inf. Manag. 2017, 37, 664–672. [Google Scholar] [CrossRef]
  16. Janssen, M.; van den Hoven, J. Big and Open Linked Data (BOLD) in Government: A Challenge to Transparency and Privacy? Gov. Inf. Q. 2015, 32, 363–368. [Google Scholar] [CrossRef]
  17. Zuiderwijk, A.; Janssen, M.; Dwivedi, Y.K. Acceptance and use predictors of open data technologies: Drawing upon the unified theory of acceptance and use of technology. Gov. Inf. Q. 2015, 32, 429–440. [Google Scholar] [CrossRef] [Green Version]
  18. Huyer, E. The Economic Impact of Open Data Opportunities for Value Creation in Europe. Available online: https://www.europeandataportal.eu/en/highlights/the-economic-impact-of-open-data (accessed on 12 December 2020).
  19. Verhulst, S.; Young, A. Open Data Impact When Demand and Supply Meet. Key Finding of the Open Data Impact Cases Studies. Opgehaald van. Available online: http://odimpact.org/key-findings.html (accessed on 12 December 2020).
  20. Zeleti, F.A.; Ojo, A.; Curry, E. Exploring the economic value of open government data. Gov. Inf. Q. 2016, 33, 535–551. [Google Scholar] [CrossRef]
  21. Carrara, W.; Chan, W.S.; Fischer, S.; Steenbergen, E.V. Creating Value Through Open Data. European Commission. 2015. Available online: https://www.europeandataportal.eu/sites/default/files/edp_creating_value_through_open_data_0.pdf (accessed on 12 December 2020).
  22. Worthy, B. The impact of open data in the UK: Complex, unpredictable, and political. Public Adm. 2015, 93, 788–805. [Google Scholar] [CrossRef]
  23. Jetzek, T.; Avital, M.; Bjørn-Andersen, N. Generating value from open government data. In Proceedings of the Thirty Fourth International Conference on Information Systems, Milan, Italy, 15–18 December 2013. [Google Scholar]
  24. Jetzek, T.; Avital, M.; Bjorn-Andersen, N. Data-driven innovation through open government data. J. Theor. Appl. Electron. Commer. Res. 2014, 9, 15–16. [Google Scholar] [CrossRef] [Green Version]
  25. Janssen, M.; Charalabidis, Y.; Zuijderwijk, A. Benefifits, adoption barriers and myths of open data and open government. Inf. Syst. Manag. 2012, 29, 258–268. [Google Scholar] [CrossRef] [Green Version]
  26. Ruijer, E.; Grimmelikhuijsen, S.; van den Berg, J.; Meijer, A. Open data work: Understanding open data usage from a practice lens. Int. Rev. Adm. Sci. 2020, 86, 3–19. [Google Scholar] [CrossRef]
  27. Ruijer, E.; Grimmelikhuijsen, S.; Meijer, A. Open data for democracy: Developing a theoretical framework for open data use. Gov. Inf. Q. 2017, 34, 45–52. [Google Scholar] [CrossRef]
  28. Ruijer, E.; Martinius, E. Researching the democratic impact of open government data: A systematic literature review. Inf. Polity 2017, 22, 233–250. [Google Scholar] [CrossRef]
  29. Sivarajah, U.; Weerakkody, V.; Waller, P.; Lee, H.; Irani, Z.; Choi, Y.; Morgan, R.; Glikman, Y. The role of e-participation and open data in evidence-based policy decision making in local government. J. Organ. Comput. Electron. Commer. 2015, 26, 64–79. [Google Scholar] [CrossRef] [Green Version]
  30. Dawes, S.; Helbig, N. Information strategies for open government: Challenges and prospects for deriving public value from government transparency. Electron. Gov. 2010, 6228, 50–60. [Google Scholar]
  31. Salas, D.; Liang, X.; Navarro, M.; Liang, Y.; Luna, D. An open-data open-model framework for hydrological models integration, evaluation and application. Environ. Model. Softw. 2020, 126, 104622. [Google Scholar] [CrossRef]
  32. Rantala, S.; Swallow, B.; Paloniemi, R.; Raitanen, E. Governance of forests and governance of forest information: Interlinkages in the age of open and digital data. For. Policy Econ. 2020, 113, 102123. [Google Scholar] [CrossRef]
  33. Pafi, M.; Chalkias, C.; Stathakis, D. A cost-effective method for tranquility mapping using open environmental data. Environ. Plan. B-Urban Anal. City Sci. 2020, 47, 417–436. [Google Scholar] [CrossRef]
  34. Blank, M. Open Data Maturity Report 2019. Available online: https://www.europeandataportal.eu/sites/default/files/open_data_maturity_report_2019.pdf (accessed on 12 December 2020).
  35. Cecconi, G.; Radu, C. Open Data Maturity Report 2018. Available online: https://www.europeandataportal.eu/sites/default/files/edp_landscaping_insight_report_n4_2018.pdf (accessed on 12 December 2020).
  36. Open Data in Europe 2019. Available online: https://www.europeandataportal.eu/en/dashboard/2019 (accessed on 12 December 2020).
  37. Open Data in Europe 2018. Available online: https://www.europeandataportal.eu/en/dashboard/2018 (accessed on 12 December 2020).
  38. Open Data in Europe 2017. Available online: https://www.europeandataportal.eu/en/dashboard/2017 (accessed on 12 December 2020).
  39. Open Data in Europe 2016. Available online: https://www.europeandataportal.eu/en/dashboard/2016 (accessed on 12 December 2020).
  40. Vetro, A.; Canova, L.; Torchiano, M.; Minotas, C.O.; Iemma, R.; Morando, F. Open data quality measurement framework: Def-inition and application to Open Government Data. Gov. Inf. Q. 2016, 33, 325–337. [Google Scholar] [CrossRef] [Green Version]
  41. Zuiderwijk, A.; Janssen, M. Participation and data quality in open data use: Open data infrastructures evaluated. In Proceedings of the 15th European Conference on eGovernment 2015: ECEG 2015, Portsmouth, UK, 18–19 June 2015; Academic Conferences Limited: Reading, UK, 2015. [Google Scholar]
  42. Zdonek, I.; Soltysik-Piorunkiewicz, A. Directions of Shaping the Open Data Performance Expectancy in Europe In the Light of Text Mining Analysis. In Proceedings of the 36th International Business Information Management Association (IBIMA), Granada, Spain, 4–5 November 2020; ISBN 978-0-9998551-5-7. [Google Scholar]
  43. 5*Open Data. Available online: https://5stardata.info/en/ (accessed on 12 December 2020).
  44. Place Overview—Global Open Data Index (okfn.org). Available online: https://index.okfn.org/ (accessed on 12 December 2020).
  45. LOD Cloud (lod-cloud.net). Available online: https://lod-cloud.net/ (accessed on 12 December 2020).
  46. Soylu, A.; Elvesæter, B.; Turk, P.; Roman, D.; Corcho, O.; Simperl, E.; Konstantinidis, G.; Lech, T.C. Towards an Ontology for Public Procurement Based on the Open Contracting Data Standard. In I3E 2019: Digital Transformation for a Sustainable Society in the 21st Century, Proceedings of the Conference on e-Business, e-Services and e-Society, Trondheim, Norway, 18–20 September 2019; Lecture Notes in Computer Science book series; Pappas, I., Mikalef, P., Dwivedi, Y., Jaccheri, L., Krogstie, J., Mäntymäki, M., Eds.; Springer: Cham, Switzerland, 2019; Volume 11701, pp. 230–237. [Google Scholar] [CrossRef]
  47. Nečaský, M.; Klímek, J.; Mynarz, J.; Knap, T.; Svátek, V.; Stárka, J. Linked data support for filing public contracts. Comput. Ind. 2014, 65, 862–877. [Google Scholar] [CrossRef]
  48. Webster, F. Theories of the Information Society; Routledge: London, UK, 2014. [Google Scholar]
  49. Fuchs, C. Sustainability and the Information Society. In HCC 2006: Social Informatics: An Information Society for All? In Remembrance of Rob Kling, Proceedings of the IFIP International Conference on Human Choice and Computers, Maribor, Slovenia, 21–23 September 2006; Berleur, J., Nurminen, M.I., Impagliazzo, J., Eds.; Springer: Boston, MA, USA, 2006. [Google Scholar] [CrossRef] [Green Version]
  50. Wątróbski, J.; Ziemba, E.; Karczmarczyk, A.; Jankowski, J. An Index to Measure the Sustainable Information Society: The Polish Households Case. Sustainability 2018, 10, 3223. [Google Scholar] [CrossRef] [Green Version]
  51. Keidanren. Japan Business Federation, Toward Realization of the New Economy and Society. Available online: https://www.keidanren.or.jp/en/policy/2016/029_outline.pdf (accessed on 12 December 2020).
  52. Aquilani, B.; Piccarozzi, M.; Abbate, T.; Codini, A. The Role of Open Innovation and Value Co-creation in the Challenging Transition from Industry 4.0 to Society 5.0: Toward a Theoretical Framework. Sustainability 2020, 12, 8943. [Google Scholar] [CrossRef]
  53. Kayikci, Y. Sustainability impact of digitization in logistic. Procedia Manuf. 2018, 21, 782–789. [Google Scholar] [CrossRef]
  54. Du Vall, M. Super inteligentne społeczeństwo skoncentrowane na ludziach, czyli o idei społeczeństwa 5.0 słów kilka. Państwo Społeczeństwo 2019, 19, 11–31. [Google Scholar] [CrossRef]
  55. Fukuyama, M. Society 5.0: Aiming for a New Human-Centered Society. Available online: https://www.jef.or.jp/journal/pdf/220th_Special_Article_02.pdf (accessed on 12 December 2020).
  56. Keidanren. Japan Business Federation, Society 5.0—Co-Creating the Future. 2018. Available online: http://www.keidanren.or.jp/en/policy/2018/095.html (accessed on 12 December 2020).
  57. Saniuk, S.; Saniuk, A.; Cagáňová, D. Cyber Industry Networks as an environment of the Industry 4.0 implementation. Wirel. Netw. 2019, 1–7. [Google Scholar] [CrossRef] [Green Version]
  58. Zhong, R.Y.; Xu, X.; Klotz, E.; Newman, S.T. Intelligent Manufacturing in the Context of Industry 4.0: A Review. Engineering 2017, 3, 616–630. [Google Scholar] [CrossRef]
  59. Miśkiewicz, R.; Wolniak, R. Practical Application of the Industry 4.0 Concept in a Steel Company. Sustainability 2020, 12, 5776. [Google Scholar] [CrossRef]
  60. Rao, S.K.; Prasad, R. Impact of 5G Technologies on Industry 4.0. Wirel. Pers. Commun. 2018, 100, 145–159. [Google Scholar] [CrossRef]
  61. Michna, A.; Kmieciak, R. Open-Mindedness Culture, Knowledge-Sharing, Financial Performance, and Industry 4.0 in SMEs. Sustainability 2020, 12, 9041. [Google Scholar] [CrossRef]
  62. Kagermann, H.; Wahlster, W.; Helbig, J. Recommendations for Implementing the Strategic Initiative Industrie 4.0—Final Report of the Industrie 4.0 Working Group; Communication Promoters Group of the Industry-Science Research: Frankfurt/Main, Germany, 2013. [Google Scholar]
  63. Qin, J.; Liu, Y.; Grosvenor, R. A categorical framework of manufacturing for Industry 4.0 and beyond. Procedia Cirp 2016, 52, 173–178. [Google Scholar] [CrossRef] [Green Version]
  64. Biegelbauer, G.; Vincze, M.; Noehmayer, H.; Eberst, C. Sensor based robotics for fully automated inspection of bores at low volume high variant parts. IEEE Int. Conf. Robot. Autom. 2004, 5, 4852–4857. [Google Scholar]
  65. Wang, S.; Zhang, C.; Liu, C.; Li, D.; Tang, H. Cloud-assisted interaction and negotiation of industrial robots for the smart factory. Comput. Electr. Eng. 2017, 63, 66–78. [Google Scholar] [CrossRef]
  66. Wang, L.; Wang, G. Big data in cyber-physical systems, digital manufacturing and Industry 4.0. Int. J. Eng. Manuf. 2016, 4, 1–8. [Google Scholar]
  67. Wittenberg, C. Cause the trend Industry 4.0 in the automated industry to new requirements on user interface. In Human-Computer Interaction, Part III, HCII 2015, LNCS; Kurosu, M., Ed.; Springer: Cham, Switzerland, 2015; Volume 9171, pp. 238–245. [Google Scholar]
  68. Gaub, H. Customisation of mass-produced parts by combining injection molding and additive manufacturing with Industry 4.0 technologies. Reinf. Plast. 2015, 60, 401–404. [Google Scholar] [CrossRef]
  69. Obitko, M.; Jirkovský, V. Big data semantics in Industry 4.0. In HoloMAS 2015, LNAI; Mărík, V., Ed.; Springer: Bern, Switzerland, 2015; Volume 9266, pp. 217–229. [Google Scholar]
  70. Morawiec, P.; Sołtysik-Piorunkiewicz, A. The New Role of Cloud Technologies in Management Information Systems Implementation Methodology. In Advances in Intelligent Systems and Computing, Proceedings of the Future Technologies Conference (FTC) 2020, Vancouver, Canada, 5–6 November 2020; Arai, K., Kapoor, S., Bhatia, R., Eds.; Springer: Cham, Switzerland, 2021; Volume 1290, pp. 423–441. [Google Scholar]
  71. Bagheri, B.; Yang, S.; Kao, H.; Lee, J. Cyber-physical systems architecture for self-aware machines in Industry 4.0 environment. IFAC Pap. Online 2018, 48, 1622–1627. [Google Scholar] [CrossRef]
  72. Lee, J.; Bagheri, B.; Kao, H. A cyber-physical systems architecture for Industry 4.0-based manufacturing systems. Manuf. Lett. 2015, 3, 18–23. [Google Scholar] [CrossRef]
  73. Shiroishi, Y.; Uchiyama, K.; Suzuki, N. Better Actions for Society 5.0: Using AI for Evidence-Based Policy Making That Keeps Humans in the Loop. Computer 2019, 52, 73–78. [Google Scholar] [CrossRef]
  74. Shiroishi, Y.; Uchiyama, K.; Suzuki, N. Society 5.0: For human security and well-being. Computer 2018, 51, 91–95. [Google Scholar] [CrossRef]
  75. Higashihara, T. A Search for Unicorns and the Building of Society 5.0; World Economic Forum: Davos, Switzerland, 2018. [Google Scholar]
  76. Thames, J.L.; Schaefer, D. Cybersecurity for Industry 4.0 and advanced manufacturing environments with ensemble intelligence. In Cybersecurity for Industry 4.0.1; Thames, L., Schaefer, D., Eds.; Springer: Berlin/Heidelberg, Germany, 2017; pp. 243–265. [Google Scholar]
  77. Sołtysik-Piorunkiewicz, A.; Krysiak, M. The Cyber Threats Analysis for Web Applications Security in Industry 4.0. In Towards Industry 4.0—Current Challenges in Information Systems; Studies in Computational In-telligence; Hernes, M., Rot, A., Jelonek, D., Eds.; Springer: Cham, Switzerland, 2020; Volume 887, pp. 127–141. [Google Scholar] [CrossRef]
  78. Shpilevoy, V.; Shishov, A.; Skobelev, P.; Kolbova, E.; Kazanskaia, D.; Shepilov, Y.; Tsarev, A. Multi-agent system “Smart Factory” for real-time workshop management in aircraft jet engines production. IFAC Proc. Vol. 2013, 46, 204–209. [Google Scholar] [CrossRef]
  79. Zuehlke, D. SmartFactory—Towards a factory-of-things. Ann. Rev. Control 2010, 34, 129–138. [Google Scholar] [CrossRef]
  80. Schmitt, M.; Meixner, G.; Gorecky, D.; Seissler, M.; Loskyll, M. Mobile Interaction Technologies in the Factory of the Future. IFAC Proc. Vol. 2013, 46, 536–542. [Google Scholar] [CrossRef]
  81. Witkowski, K. Internet of Things, Big Data, Industry 4.0—Innovative Solutions in Logistics and Supply Chains Management. Procedia Eng. 2017, 182, 763–769. [Google Scholar] [CrossRef]
  82. Burton, J.; Bhattacharya, S.; Romero, K.; Conrado, D.J. Open Data for Clinical Pharmacology. Clin. Pharmacol. Thera-Peutics 2020, 107, 703–706. [Google Scholar] [CrossRef]
  83. Conrado, D.J.; Duvvuri, S.; Geerts, H.; Burton, J.; Biesdorf, C.; Ahamadi, M.; Macha, S.; Hather, G.; Morales, J.F.; Podichetty, J.; et al. Challenges in Alzheimer’s Disease Drug Discovery and Development: The Role of Modeling, Simulation, and Open Data. Clin. Pharmacol. Ther. 2020, 107, 796–805. [Google Scholar] [CrossRef]
  84. Conrado, D.J.; Burton, J.; Hill, D.; Willis, B.; Sinha, V.; Stone, J.; Coello, N.; Wang, W.; Chen, D.; Nicholas, T.; et al. Hippocampal Neuroimaging—Informed Clinical Trial Enrichment Tool for Amnestic Mild Cognitive Impairment Using Open Data. Clin. Pharmacol. Ther. 2020, 107, 903–914. [Google Scholar] [CrossRef]
  85. Zuiderwijk, A.; Janssen, M.; Davis, C. Innovation with open data: Essential elements of open data ecosystem. Inf. Polity 2014, 19, 17–33. [Google Scholar] [CrossRef] [Green Version]
  86. Susha, I.; Grönland, A.; Janssen, M. Organizational measures to stimulate user engagement with open data. Transform. Gov. People Process Policy 2015, 9, 181–206. [Google Scholar] [CrossRef]
  87. Susha, I.; Zuiderwijk, A.; Janssen, M.; Grönland, A. Benchmarks for evaluating the progress of open data adoption: Usage, limitations and lessons learned. Soc. Sci. Comput. Rev. 2015, 33, 613–630. [Google Scholar] [CrossRef] [Green Version]
  88. Susha, I.; Grönlund, Å.; Janssen, M. Driving factors of service innovation using open government data: An exploratory study of entrepreneurs in two countries. Inf. Polity 2015, 20, 19–34. [Google Scholar] [CrossRef]
  89. Dawes, S.; Vidiasova, L.; Parkhimovich, O. Planning and designing open government data programs: An ecosystem approach. Gov. Inf. Q. 2016, 33, 15–27. [Google Scholar] [CrossRef]
  90. Kampars, J.; Zdravkovic, J.; Stirna, J.; Grabis, J. Extending organizational capabilities with Open Data to support sustainable and dynamic business ecosystems. Softw. Syst. Modeling 2020, 19, 371–398. [Google Scholar] [CrossRef]
  91. Ruijer, E.; Grimmelikhuijsen, S.; Hogan, M.; Enzerink, S.; Ojo, A.; Meijer, A. Connecting societal issues, users and data. Scenar-io-based design of open data platforms. Gov. Inf. Q. 2017, 34, 470–480. [Google Scholar] [CrossRef] [Green Version]
  92. Fishbein, M.; Ajzen, I. Belief, Attitude, Intention and Behavior: An Introduction to Theory and Research; Addison-Wesley: Boston, MA, USA, 1975. [Google Scholar]
  93. Ajzen, I. The theory of planned behavior. Organ. Behav. Hum. Decis. Process. 1991, 50, 179–211. [Google Scholar] [CrossRef]
  94. Davis, F.D. Perceived usefulness, perceived ease of use, and user acceptance of information technology. MIS Q. 1989, 13, 319–340. [Google Scholar] [CrossRef] [Green Version]
  95. Venkatesh, V.; Morris, M.G.; Davis, G.B.; Davis, F.D. User acceptance of information technology: Toward a unified view. MIS Q. 2003, 27, 425–478. [Google Scholar] [CrossRef] [Green Version]
  96. Wang, H.J. Adoption of open government data: Perspectives of user innovators. Inf. Res. Int. Elec-Tronic J. 2020, 25, 849. [Google Scholar]
  97. Wang, H.-J.; Lo, J. Adoption of open government data among government agencies. Gov. Inf. Q. 2016, 33, 80–88. [Google Scholar] [CrossRef]
  98. Sykes, T.A.; Venkatesh, V.; Gosain, S. Model of acceptance with peer support: Asocial network perspective to understand employees’ system use. MIS Q. 2009, 33, 371–393. [Google Scholar] [CrossRef]
  99. Deci, E.L.; Ryan, R.M. Self-Determination Theory: A Macrotheory of Human Motivation, Development, and Health. Can. Psychol. 2008, 49, 182–185. [Google Scholar] [CrossRef] [Green Version]
  100. Silge, J.; Robinson, D. Text Mining with R. 2019. Available online: https://www.tidytextmining.com/index.html (accessed on 12 December 2020).
Figure 1. Conceptual scheme of research elaboration. Source: Own study.
Sustainability 13 00917 g001
Figure 2. Tokenisation and tidying of the data frame of irrelevant words for further analysis. Source: Own study based on: [100].
Sustainability 13 00917 g002
Figure 3. Visualization of dependencies between sets with outliers (on the left) and without outliers (on the right). Source: own study.
Sustainability 13 00917 g003
Figure 4. Number of new products and services using open data in 2018–2019 in particular countries (visualization on a European scale on the right). Source: own study.
Sustainability 13 00917 g004
Figure 5. Ranging of the biggest business sectors that use open data. Source; own study.
Sustainability 13 00917 g005
Figure 6. The dendrogram obtained for the analysed sets of words describing products/services for particular regions. Source: own study.
Sustainability 13 00917 g006
Figure 7. Sets of words for descriptions of products/services created based on open data in Northern (on the left) and Western Europe (on the right). Note: the term “date” was removed as a major outlier. Source: own study.
Sustainability 13 00917 g007
Figure 8. The dendrogram obtained for the analysed sets of words describing products/services for particular countries. Source; own study.
Sustainability 13 00917 g008
Figure 9. The dendrogram obtained for the analysed sets of words describing type of open data for particular regions. Source: Own study.
Sustainability 13 00917 g009
Figure 10. Words describing type of data for Northern (on the left) and Western Europe (on the right). Source: Own study.
Sustainability 13 00917 g010
Table 1. Key terms describing Society 5.0 and Industry 4.0.
Key Terms Describing Society 5.0Key Terms Describing Industry 4.0
Artificial intelligence [51,55,56]
Cyber-physical systems: intelligent transportation, smart manufacturing, regional care, smart food-chain [64,73,74]
Data: data formats and interfaces standardization, utilization of standard data [24]
Digitization [51,53]
Expanding transparency and active participation in social issues [26,27,28,29,30].
Robotics [51,55]
Equal opportunities for all people, integration of innovative technologies and society [51]
Human-centered society [51,64,75]
Imagination and creativity of people [51,56]
Information, information platforms [46]
Internet of things [55]
Innovation as a driving force for new business and services [51]
Open innovation [52]
Regulatory of laws towards implementation of new technologies [56]
“Society of imagination” [55]
Sustainable Development: Sustainable Development Goals (SDGs), Dimensions of Sustainability [51,52,53]
Super smart society [51,54]
Actuators [62,63]
Automated Guided Vehicles [65]
Adaptive robotics [66,67]
Additive manufacturing [68]
Big Data analytics [69]
Cloud technologies [65,70]
Cyber Industry Network [57]
Cyber-physical infrastructure embedded systems [71,72]
Cybersecurity [76,77]
Digital factory [80]
Hybrid production [65]
Industrial internet—communication and networking [65]
Internet of things [81]
Mobile technologies [80]
Radio-frequency identification (RFID) and Real-time locating system (RTLS) technologies [58]
Sensors [63,64]
Simulations [59]
Smart factory [65,78], SmartFactory [79]
Value creation due to technological transformation [51,56]
Visualization technologies, such as virtual reality and augmented reality [65,66]
Table 2. Variables subject to analysis.
VariableDescription
CompanyThe name of the company that created the product or service based on open data
DateDate of posting information about the product or service based on open data on Europortal
DescriptionDescription of product or service based on open data
Part of worldRegion of Europe (north, south, east, west) for which the product or service based on open data is intended
RegionRegion for which the product or service based on open data is intended
SectorSector for which the product or service based on open data is intended
Type of open dataDescription of type of open data
Source: Own study.
Table 3. The most common words occurring in the descriptions of products/services that use open data.
WordnWordnWordn
data736transport52research36
information341collects51create35
users262access50government35
application189aims49offers35
public163location49air34
website114business48food34
platform104user47free34
time93citizens46database33
company92service44clients31
map90enables41knowledge31
real82city40projects31
people80insights40statistics31
national75search40tool31
provide63traffic40makes30
sources62european38management30
based61helps37organisations30
services61parking37accessible29
local55transparency37analysis29
quality54development36datasets29
companies52interactive36maps29
Source; own study.
Table 4. The most common bigrams occurring in the descriptions of products/services that use open data.
BigramnBigramnBigramn
real time63provide information8united kingdom6
air quality26provide users8weather data6
collects data26public sector8web based6
public data22satellite images8website enables6
public transport21social networks8alternative fueling5
time information20business information7arrival times5
real estate16information system7bike citizens5
data sources15local authorities7business processes5
data portal13accurate house6de sintra5
additional information12artificial intelligence6geospatial data5
easily accessible12data quality6helps people5
enables users12enables people6helps users5
user friendly12house price6land viewer5
data visualisation10land insight6national governments5
gathers data10machine learning6nearest public5
interactive map9machine readable6parking spaces5
collected data8public toilet6polling station5
data driven8public transportation6predictive models5
geographic information8traffic data6private sources5
parking facilities8transport data6promotes transparency5
Source: own study.
Table 5. Coefficients of correlation between sets of words describing products/services for particular regions.
Northern EuropeWestern EuropeEastern EuropeSouthern Europe
With OutliersWithout OutliersWith Outliers Without OutliersWith OutliersWithout OutliersWith OutliersWithout Outliers
Northern Europe11
Western Europe0.8670.53211
Eastern Europe0.7750.3120.7270.33711
Southern Europe0.8210.4650.8110.4430.7750.30311
Source: own study.
Table 6. Ranking of the most frequent words describing type of open data.
WordnWordn
data268traffic7
national37air6
local27geospatial6
geodata23dutch5
public22geo5
transport19parking5
portals14real5
government10satellite5
environmental8statistics5
health8cadastre4
transportation8energy4
weather8financial4
agricultural7geographic4
cultural7geographical4
economic7quality4
municipal7
Source: own study.
Table 7. The connection of the most common bigrams occurring in the descriptions of products/services that use open data with Society 5.0 and Industry 4.0 issues.
IssueBigramIssueBigram
Human-oriented actionbusiness informationPhysical-to-digital-to-physical loopadditional information
business processesartificial intelligence
easily accessiblecollected data
enables peoplecollects data
enables usersdata driven
helps peopledata portal
helps usersdata quality
local authoritiesdata sources
national governmentsdata visualisation
polling stationgathers data
promotes transparencygeographic information
provide usersgeospatial data
social networksinformation system
user friendlyinteractive map
Sustainable developmentaccurate houseland insight
air qualityland viewer
alternative fuelingmachine learning
arrival timesmachine readable
bike citizenspredictive models
house priceprovide information
nearest publicpublic data
parking facilitiespublic sector
parking spacesreal time
public toiletsatellite images
public transporttime information
public transportationweather data
real estateweb based
traffic datawebsite enables
transport data
Source: own study.
Table 8. Coefficients of correlation for sets of words describing types of data for particular parts of Europe.
Northern EuropeWestern EuropeEastern EuropeSouthern Europe
With OutliersWithout OutliersWith OutliersWithout OutliersWith OutliersWithout OutliersWith OutliersWithout Outliers
Northern Europe11
Western Europe0.9660.47211
Eastern Europe0.9190.3460.9180.30711
Southern Europe0.9220.4250.9050.2460.8640.20411
Source: own study.
Publisher’s Note: MDPI stays neutral with regard to jurisdictional claims in published maps and institutional affiliations.

