Article

Canopy-scale Built-environment Characteristics and Urban Heat Island Effect in a Tropical Medium-sized City

1
Department of Landscape Architecture, National Chiayi University, Chiayi City 600355, Taiwan
2
Department of Civil and Environmental Engineering, National University of Kaohsiung, Kaohsiung City 81148, Taiwan
*
Author to whom correspondence should be addressed.
Sustainability 2021, 13(2), 868; https://doi.org/10.3390/su13020868
Submission received: 28 October 2020 / Revised: 12 January 2021 / Accepted: 13 January 2021 / Published: 16 January 2021
(This article belongs to the Special Issue Sustainable Urban Design and Land Use Planning)

Abstract

:
Previous studies have found that built-environment characteristics in large cities produce important effects of the urban heat island (UHI) and know the horizontal space affected by the urban canopy microclimate ranges from about 30–200 m, but there are few studies in medium-sized cities. Therefore, this study investigates canopy-scale built-environment characteristics and their correlation with urban heat island (UHI) effects in Chiayi city, a tropical, medium-sized city. Under a 100 m buffer size, 2D and 3D built-environment factors such as the green coverage ratio (GCR), building coverage ratio (BCR), floor area ratio (FAR), and sky view factor (SVF) were first analyzed and then correlated with the UHI effect. The analyses were repeated on 200 and 1000 m scales and compared to previous studies. It was found that the built-environment factors were more strongly correlated with UHI under the 200 m buffer. Moreover, 2D factors such as the GCR and BCR had a higher correlation with UHI, especially in developing medium-sized cities. Regarding the GCR, BCR, and FAR, as expected, the correlation coefficients with UHI increased to 0.4 at 13:00 during the day and changed from 0.2 to 0.4 at 00:30 at night, whereas the correlation between the SVF and UHI was greatly different from the study area or calculation methods. The scale effect and SVF calculation methods are recommended for further study.

1. Introduction

Since the Industrial Revolution, the rapid transition from agricultural land to urban land has resulted in artificial material increasingly covering the land surface, and the subsequent engineering construction, human activities, and energy consumption have led to changes in the urban climate [1,2,3]. According to United Nations 2018 statistics, 55% of the world’s population is concentrated in urban areas. This ratio is expected to increase to 68% by 2050 and approximate 90% in high-income countries such as those in North America [4]. Therefore, urban environmental problems will inevitably become more serious and important, especially the urban heat island (UHI) effect. The so-called UHI effect refers to the phenomenon of higher temperatures in urban areas than in rural areas, which is particularly easy to observe in metropolitan areas [5].
Based on the stratification of the city atmosphere [5,6], micro- and mesoscale UHI effects occur in the urban canopy layer (UCL) and urban boundary layer (UBL), respectively. The UCL is defined as the layer of space extending from the ground to building roofs, namely, the microscale climate phenomenon. Therefore, it is the most affected by human activities and is closely related to the construction density, building height, street width/direction, pavement materials, green areas, pollutant concentration in air, and artificial heat emissions [5,7]. Recent studies have found that it may also affect plant phenology [8]. The UBL is the atmosphere extending from building roofs to clouds (affected by urban areas). It is susceptible to uneven roof heat emission and airflow conditions and exchanges material and energy with the UCL, namely, the mesoscale climate phenomenon [5,7]. Therefore, the UHI effect can be described as the result of the various artificial materials and human activities in the UCL that impact the overall urban thermal environment, and it further extends to the UBL.
Based on the observed space and scale, the UHI effect can be divided into the following three types:
(1) Surface (urban) heat island (S(U)HI) effect: occurs when the surface temperature of a city is higher than that of its surrounding rural areas;
(2) Canopy-layer heat island (CLHI) effect: observed in the atmosphere close to the urban surface affected by the average building height of the city; and
(3) Boundary-layer heat island (BLHI) effect: observed in the atmosphere above the average building height of the city extending to the UBL [9].
Although instrument investigation (such as the mobile observation method) and computational fluid dynamics (CFD) simulation analysis have been often applied to study the CLHI effect, telemetry data analysis has often been adopted to study the SUHI effect [7]. CFD is a tool that simulates fluid flows and analyzes the flow characteristics. Telemetry data are the collection of measurements at remote points and their automatic transmission to receiving equipment for monitoring. The WRF/UCM model (The Weather Research and Forecasting/ urban canopy model mode1) is often analyzed to study the BLHI effect [10,11]
The UHI mechanism is mainly caused by the difference between urban and rural surface heat balances. Surface energy originates from shortwave solar radiation and longwave radiation of objects, and energy is consumed by the exchange of latent heat between the ground and atmosphere. The net energy of the above two processes is retained in the surface system [5,12]. The physical environment and composition structure cause more radiation absorption in urban areas than in rural areas, thereby reducing the release of latent heat, which also increases artificial heat emissions stemming from human activities, causing heat storage in the urban space in the UHI phenomenon [5,13]. From the viewpoint of the urban physical environment, there are two main factors influencing the UHI, i.e., (1) the urban land cover pattern (2D space) and (2) the urban geometry of building structures and the ground (3D space). The overall effect is reflected in the UHI intensity (UHII, ΔTu-r) [5].
From a 2D spatial perspective, the cover pattern of urban land has been considered to study the relationship between the UHI effect and physical space characteristics. Over the past 20 years, many studies have been performed on the relationship between the UHI effect and building coverage, artificial material coverage, and plant coverage [14,15,16,17]. It was demonstrated that the difference between urban land-use patterns may cause the temperature to change. Recently reported work further revealed the influence of urban expansion on UHI temporal–spatial characteristics [16,17]. Over the last decade, from a 3D spatial perspective, urban geometry was analyzed to study the relationship between the UHI effect and physical space characteristics such as the street aspect ratio (H/W) and sky view factor (SVF) [14,15,16,18,19,20,21]. In the field of architecture and urban planning, the underlying mechanism was also examined based on the floor area ratio (FAR) [21,22].
In the tropics, most UHI studies have focused on large cities, thereby investigating the UHI phenomenon or assessing the relationship with built-environment factors [14,16,20,23,24,25,26,27,28,29]. The main focus of the studies was on the investigation of the UHI phenomenon. For example, the relationship between the SUHI and land cover change (normalized difference vegetation index (NDVI)/normalized difference built-up index (NDBI)) was analyzed using satellite images in Hanoi, Vietnam [16]. The UHI phenomenon in Singapore was investigated with the mobile observation method, and a primary study was also conducted on the green space and its effects [20]. The UHI phenomenon in four metropolitan areas in Taiwan was examined with the mobile observation method, and the results were then compared to the results in large cities abroad [27]. More recently, UHI research extended to the impact of built-environment factors [14,23,25,26,28,29]. For example, in Bangkok, Thailand, the relationships between the UHI and FAR, building coverage ratio (BCR), and other factors were analyzed using data obtained from 59 fixed survey stations [14]. In Singapore, the relationships between UHI and SVF, FAR, green coverage ratio (GCR), percentage of pavement (PP), and other factors were studied using data acquired from 27 fixed survey stations [25]. In Taipei and Taichung, two large cities in Taiwan, the relationship between the street-scale air temperature and H/W, BCR, GCR, and other factors was determined using the mobile observation method [28,29]; there were also studies on the relationship between meteorological factors and UHI [26].
The diversity of commercial activities and manufacturing industries has caused changes in medium-sized cities; there appears to be an increasing interest in the development of medium-sized cities, especially in the mid-latitudes [30,31]. In the inland plains of Italy and France, for example, UHI surveys were conducted in the medium-sized cities of Padua (with a population of 209,800 people in 2017) [30] and Rennes (with a population of 216,815 people in 2017) [31], respectively, and a UHII of approximately 4–6 °C was reported. The reported UHIIs were almost equal to those of megacities with populations of more than one million people. In the low latitudes, a survey was also conducted in 2014 in Muar, a medium-sized city in the coastal plains of Malaysia (with a population of approximately 250,000 people), and the UHII reached approximately 3.2 °C [32]. A UHI survey was also performed in 2018 in Chiayi city, a medium-sized city in the western plains of Taiwan (with a population of approximately 270,000 people in 2019) using the automotive-mobile method, and the daytime UHII was approximately 4.1 °C, whereas at midnight it reached approximately 2.5 °C; compared to a survey in 1999, the daytime UHII had increased by approximately 1.3 °C, and at midnight it had decreased by approximately 1.2 °C [17]. These findings indicate that the UHI effect in medium-sized cities may be as notable as that in megacities.
This study analyzed the canopy-scale built-environment characteristics and their correlation with the UHI for Chiayi city, a tropical, medium-sized city. Under a buffer size of 100 m, 2D and 3D built-environment factors such as the GCR, BCR, FAR, and SVF were analyzed and correlated with the UHII survey in 2018 [17]. The survey scale or buffer size is a variable that has not been clearly defined, and it appears to affect the UHII correlation analyses. To address this issue, this study re-analyzed the built-environment factors and UHI on 200 and 1000 m scales and compared the analysis results to several cities on different survey scales. The findings of this study could be used as an important reference in the context of sustainable landscape and urban planning for medium-sized cities. The findings may also help gain a better understanding of the role of survey scales in studying canopy-scale UHI effects.

2. Materials and Methods

2.1. Measurement of the UHI Effects

This study measured UHI effects with the mobile transect observation method. Mobile measurement is usually conducted using temperature sensors installed on a car or mobile platform, according to a preplanned route and locations, to obtain instantaneous data of the urban temperature. The advantages of this method include the high mobility and high degree of freedom in terms of the investigation times and locations. The disadvantages include the lack of time synchronization and susceptibility to traffic congestion.

2.1.1. Study Area and Measurement Points

The present study selected Chiayi city, Taiwan, with a population of approximately 270,000 people, as the research object. The city is located approximately 31 km from the coastline. The air temperature has an annual average of 23.1 °C and reaches a maximum of 32.7 °C in the summer season (from June to August); in the hottest month, there are more than 27 days with temperatures over 30 °C, and the monthly average rainfall is 355 mm [33]. The city center and commercial activities are mainly concentrated in the area where the railway station meets Chuiyang Road. The development of the city expands from this area. On the west side, there are hills, mostly in the reservoir and water area (the green part on the west side of Figure 1a); on the east side, there is farmland and scattered bungalow villages. Most of the downtown buildings are 3–4 stories, and the commercial centers are 7–13 stories with an average height of approximately 10–12 m. Using the urban-pattern-based local climate zone (LCZ) classification system, which was proposed in 2012 by Stewart and Oke [34], the survey area is approximately classified as the LCZ 3 type.
Figure 1 shows the survey area, routes, and measurement points. The boundary of the city is marked with a red solid line, and the surrounding reservoir, forests, farmland, and water conservation areas are the dark green areas on the map (see Figure 1a). The survey routes and directions were mainly determined by mainly considering that if the observation time was shortened and the corresponding time synchronization and standardization issues were corrected, then more accurate results would be obtained with the mobile transect observation method. The survey area was divided into 3 parts based on the route, i.e., the western, northern, and southern routes (see Figure 1b–d). The intersections along main roads were selected as measurement points. Moreover, the points were more densely distributed in the urban areas and were sparser in the rural areas. Each route contained approximately 30 measurement points, for a total of 87 measurement points. The survey was completed in 1 h, and the above three routes were simultaneously covered.

2.1.2. Survey Time, Method, and Measuring Instruments

The survey was conducted on sunny summer days without rain on 28 and 30 July 2018. The survey period ranged from 11:30 to 14:30 and from 23:00 to 02:00. The measurements were conducted on an hourly basis. The method involved a group of 2 people and 1 motorcycle visiting the measuring points along each route in a sequential manner and remaining 15 s at each measuring point, thereby recording 1 data point every 2 s. Time synchronization of the measurements and recording devices was performed before the survey to ensure that all routes remained synchronized.
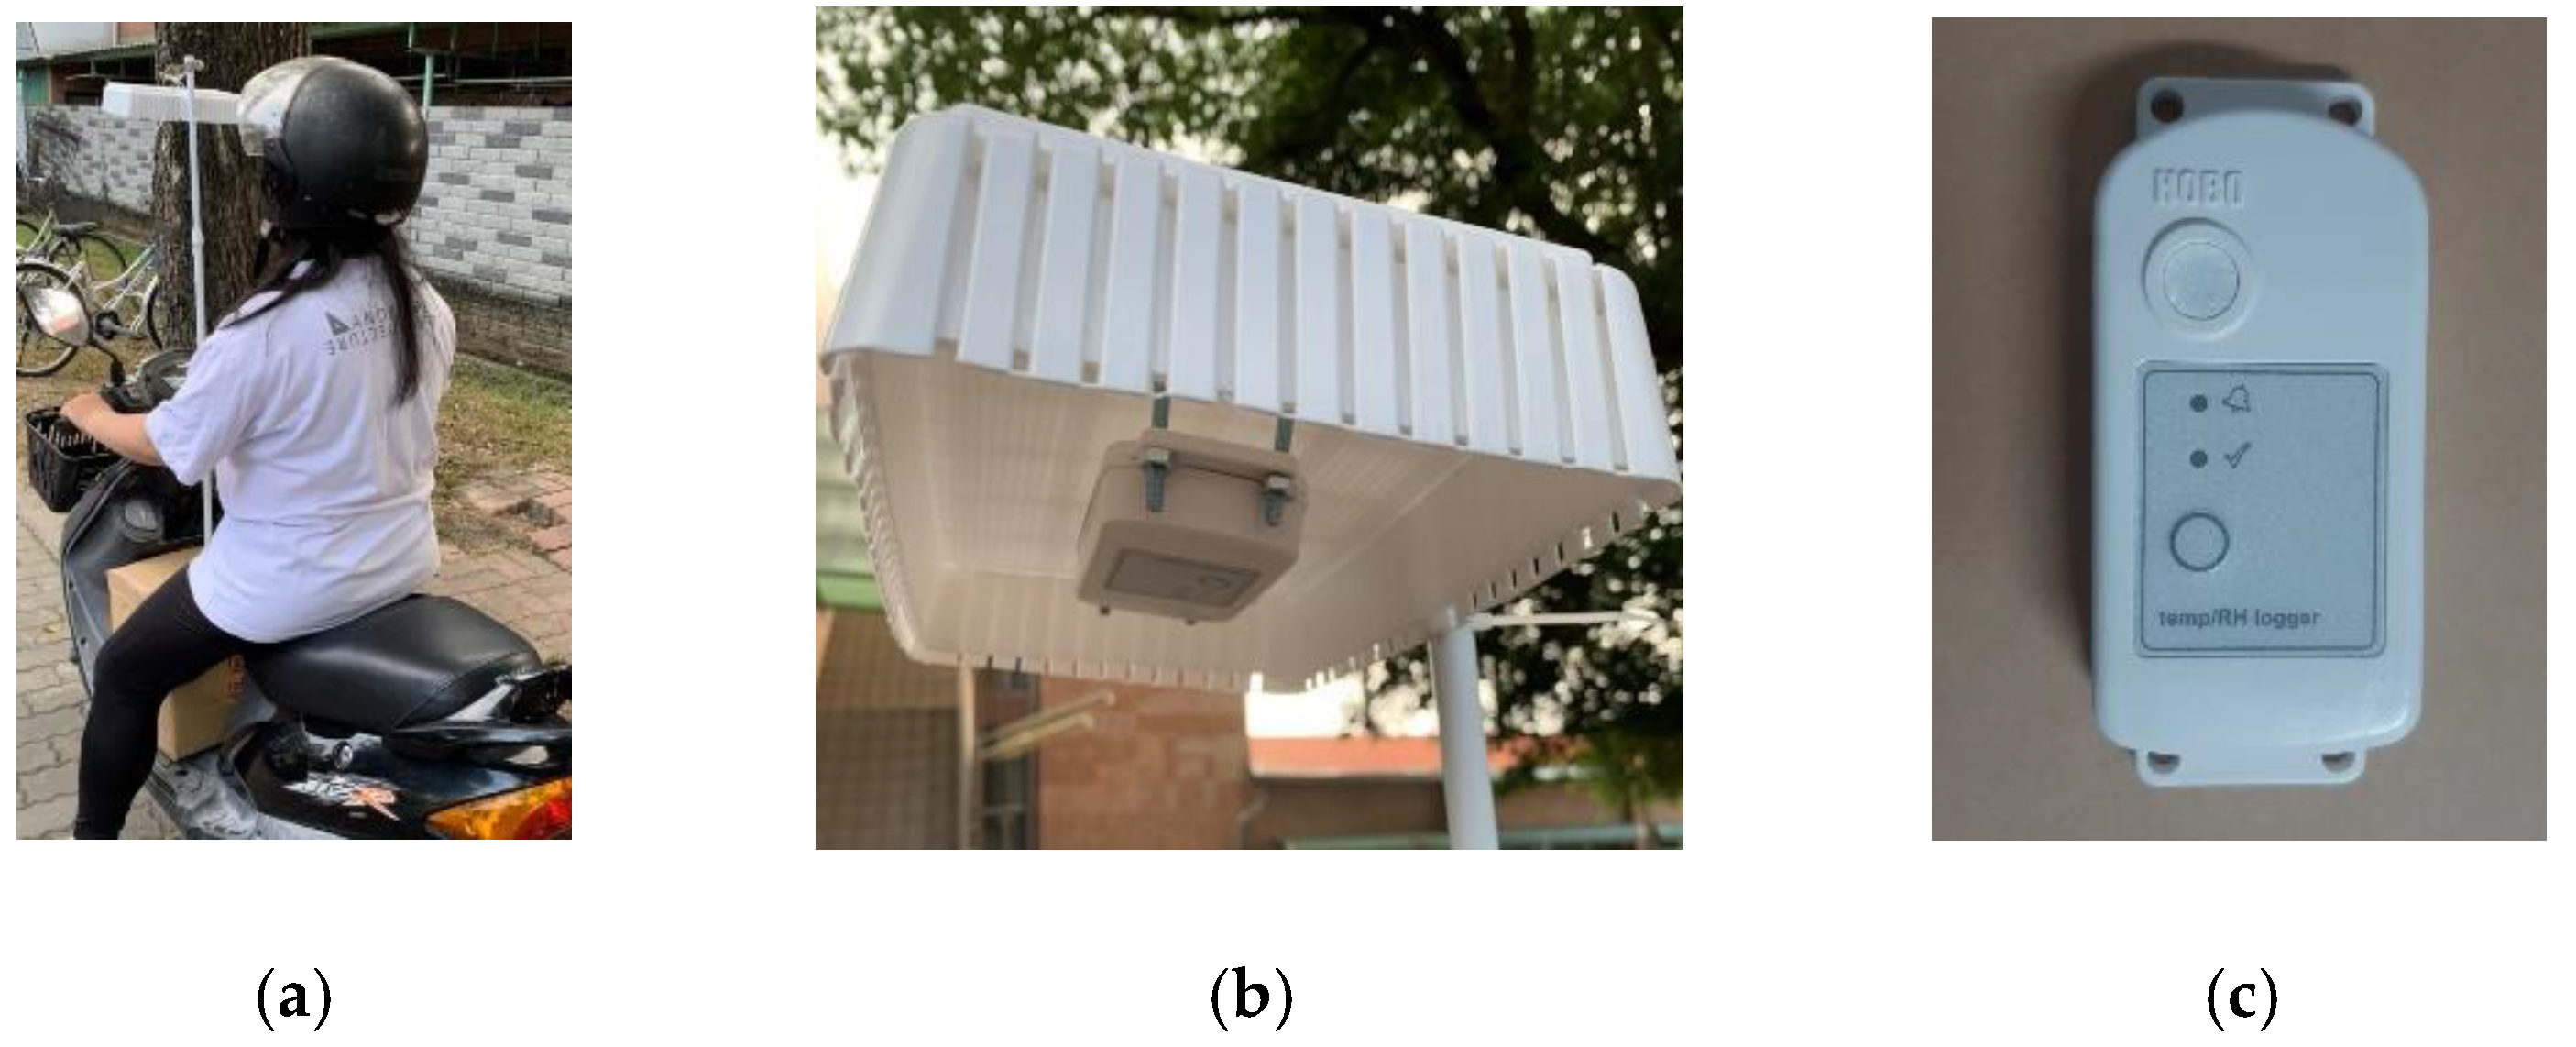
The measurement and recording device adopted was the outdoor temperature and humidity recorder HOBO MX2301 (Onset Co. U.S.), which exhibits a temperature measurement range from −40 °C to 70 °C with an accuracy of ±0.2 °C (Figure 2). Data were also collected and recorded every 5 min at a fixed weather station on the Lantan Campus, National Chiayi University, for time synchronization correction purposes. The device used at the weather station was a HOBO RX3000 instrument (Onset Co. U.S.), which has a temperature measurement accuracy of ±0.2 °C.

2.1.3. Correction of Time Synchronization

For each hourly observation, the data recorded at the time period midpoint were adopted as reference data for the subsequent correction. For example, an hourly observation was obtained over the time period from 13:00 to 14:00, and the time period midpoint was 13:30. As mentioned above, data were collected and recorded every 5 min at the fixed weather station, and the data were measured and recorded every 2 min along the survey routes. The latter data were corrected based on a period of 2 min. In particular, if data were collected at 11:32 and 11:37 at the weather station, and data were measured at 11:34 during the survey, the 11:32 weather station data were applied to correct the 11:34 survey data to realize time synchronization. The time correction range was from approximately ±0.2 °C to ±0.9 °C, with an average of −0.06 °C.

2.1.4. Background Weather Conditions

In general, it is easier to observe the UHI phenomena for weak regional circulation (i.e., land–sea breeze) or on sunny summer days with no rain. Table 1 summarizes the background weather conditions during the survey. The wind speed was 2.20 m/s, and the average radiation reached approximately 2.19 MJ/m2 during the daytime (the average was calculated over the survey period from 11:00 to 15:00 on 28 July 2019). The average wind speed was 0.68 m/s at midnight (on 30 July 2019).

2.2. Analysis of the 100 m Scale Built-Environment Factors

This study first analyzed 2D factors such as the BCR and GCR, and 3D factors such as the FAR and SVF, to investigate their influence on UHI effects. In detail, aerial photographs of Chiayi city from 2017 [34] were collected and used to analyze the artificial coverage ratio and GCR in each survey point area. The BCR describes the proportion of the urban land cover plan area occupied by building objects, and the GCR represents the proportion of the urban land cover plan area occupied by vegetation (parks and green areas).
As explained by Oke et al. (2017) [7], the urban canopy microclimate affects a horizontal space that commonly ranges from 30–200 m. The buffer size or survey scale is a variable that has not been clearly defined, and it appears to affect the UHII correlation analyses. We first chose 100 m as the buffer size and analyzed the built-environment factors for the area within a 100 m radius of each survey point. These built-environment factors were re-analyzed on 200 and 1000 m scales and compared to previous studies (see the details in Section 3.3.3).

2.2.1. D-Factors: Building Coverage Ratio (BCR) and Green Coverage Ratio (GCR)

The BCR and GCR are 2D factors reflecting the land-use pattern. These two ratios were calculated using the 2017 Chiayi city aerial photographs [35]. From the Chiayi city aerial photographs, an image was extracted for each of the 87 measuring points and the surrounding 100 m circled area. Then the image-processing software Photoshop was used to calculate the pixel numbers for the buildings, plants, and total pixel number in the enclosed circled area. Finally, the values of BCR and GCR were calculated using Equations (1) and (2). The detailed BCR and GCR calculation formulas are as follows:
BCR = PBCR/Ptol
GCR = PGCR/Ptol
  • PBCR: BCR pixel number of the circular area with a 100 m radius
  • PGCR: GCR pixel number of the circular area with a 100 m radius
  • Ptol: total pixel number of the circular area with a 100 m radius

2.2.2. D-Factors: SVF and FAR

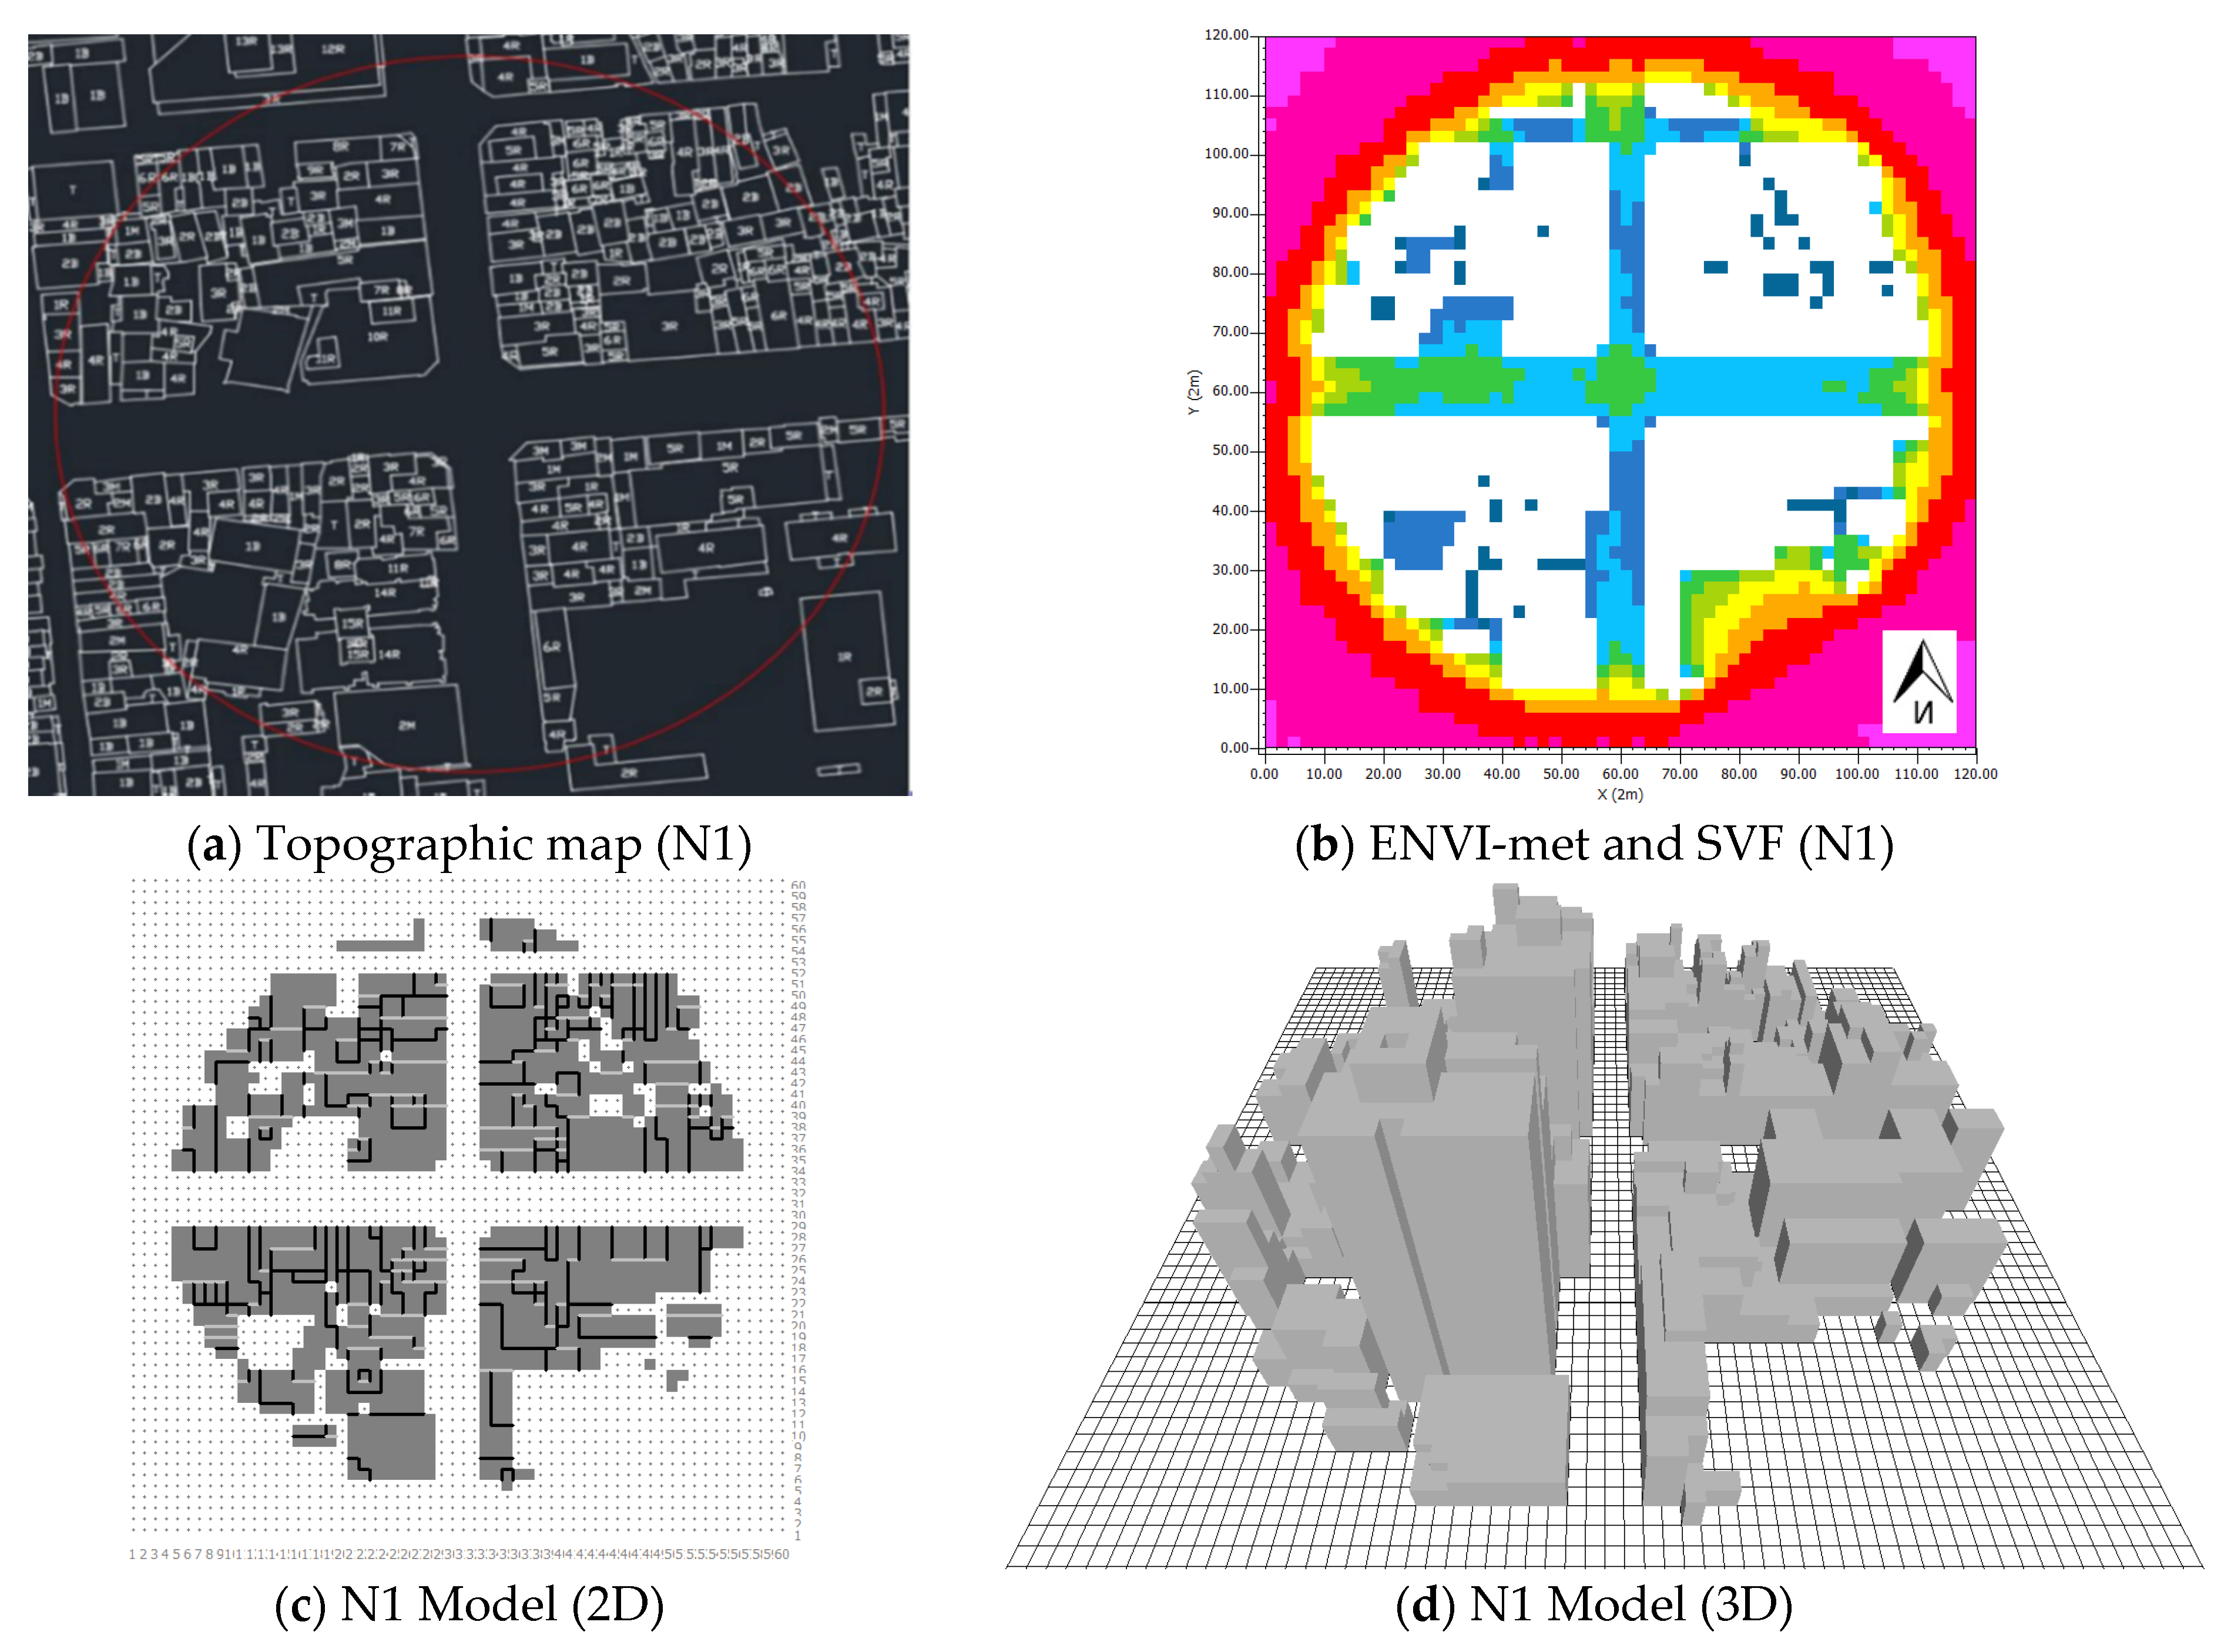
The SVF was calculated based on the building geometry and story height according to a numerical topographic map of Chiayi city [35]. As shown in Figure 3a, the building height was marked in the enclosed area of each building. The building forms, heights, and distribution were first obtained for the area within a 100 m radius of each survey point from the numerical topographic map of Chiayi city. Then, by using those data, the ENVI-met software was employed to establish a 3D model (Figure 3d) and calculate the SVF, and the results are shown in Figure 3b. In detail, the white parts are the buildings, and the other colors indicate the SVF values calculated at the grid (2 m × 2 m) located on the ground floor. Finally, the average of all SVF values obtained by deducting the building parts within a radius of 100 m was taken as the SVF representative values for each survey point.
The FAR was calculated with Equation (3). The BCR calculation approach is summarized in Section 2.2.1. FAve was determined in Equation (4) and calculated from the building height based on the numerical topographic map of Chiayi city. First, the number of floors of each building (Fi) and the number of buildings (n) within a 100 m radius of each survey point were calculated. Then, according to Equations (4) and (5), the values of FAve were calculated.
FAR = BCR × F Ave
F Ave = H Tot n
H Tot = i = 1 n F i
  • FAR: Floor area ratio
  • FAve: Average story number in the area
  • HTot: Total story number in the area
  • n: Building number in the area
  • Fi: Story number of a single building

2.3. Correlation Analysis

To better understand the correlation between the air temperature and each built-environment factor, linear regression analysis was performed, which yielded the coefficient of correlation (r) as a reference indicator for the analysis. In addition, to facilitate a thorough understanding of the results in terms of r for discussion and comparison purposes, we referred to previous studies [24,27] and statistical definitions to define the magnitude of the correlation according to the following three types. If r was equal to or greater than 0.50, the factor was considered to be highly correlated with the UHI. If r was 0.3 to 0.5, the factor was considered to be moderately correlated with the UHI. If r was less than 0.30, the factor was considered to be weakly correlated with the UHI.

3. Results and Discussion

3.1. UHI Survey Results

The results of the automotive-mobile observation in the summer of 2018 were obtained using a geographic information system (GIS) to calculate the isothermal lines by using the Kriging method (the black lines in Figure 4 and Figure 5) to present the spatial distribution of the temperature data. Figure 4 and Figure 5 show the survey results of the UHI during each time period in the daytime on 28 July 2018 and at midnight on 30 July 2018. The UHII was evaluated based on △Tu-r (the difference between the highest and lowest temperatures in a specific region during each survey time period), as listed in Table 2. The table indicates that during the daytime, the UHI phenomenon was the most profound at 14:00, and the UHII reached as high as 3.9 °C. At midnight, the UHI phenomenon was the most notable at 01:30, and the UHII was as high as 2.5 °C (please refer to the study of Huang et al. [17] for more details on the spatial distributions of the UHI and urban land-use pattern).

3.2. Analysis of the Canopy-Scale Built-Environment Factors

To make the spatial distribution results of the built-environment factors liable to connect with the urbanization status of the study area, the GIS distribution map of each factor was presented by integrating the results of the district-scale population density from Huang et al. [17].

3.2.1. Green Coverage Ratio (GCR)

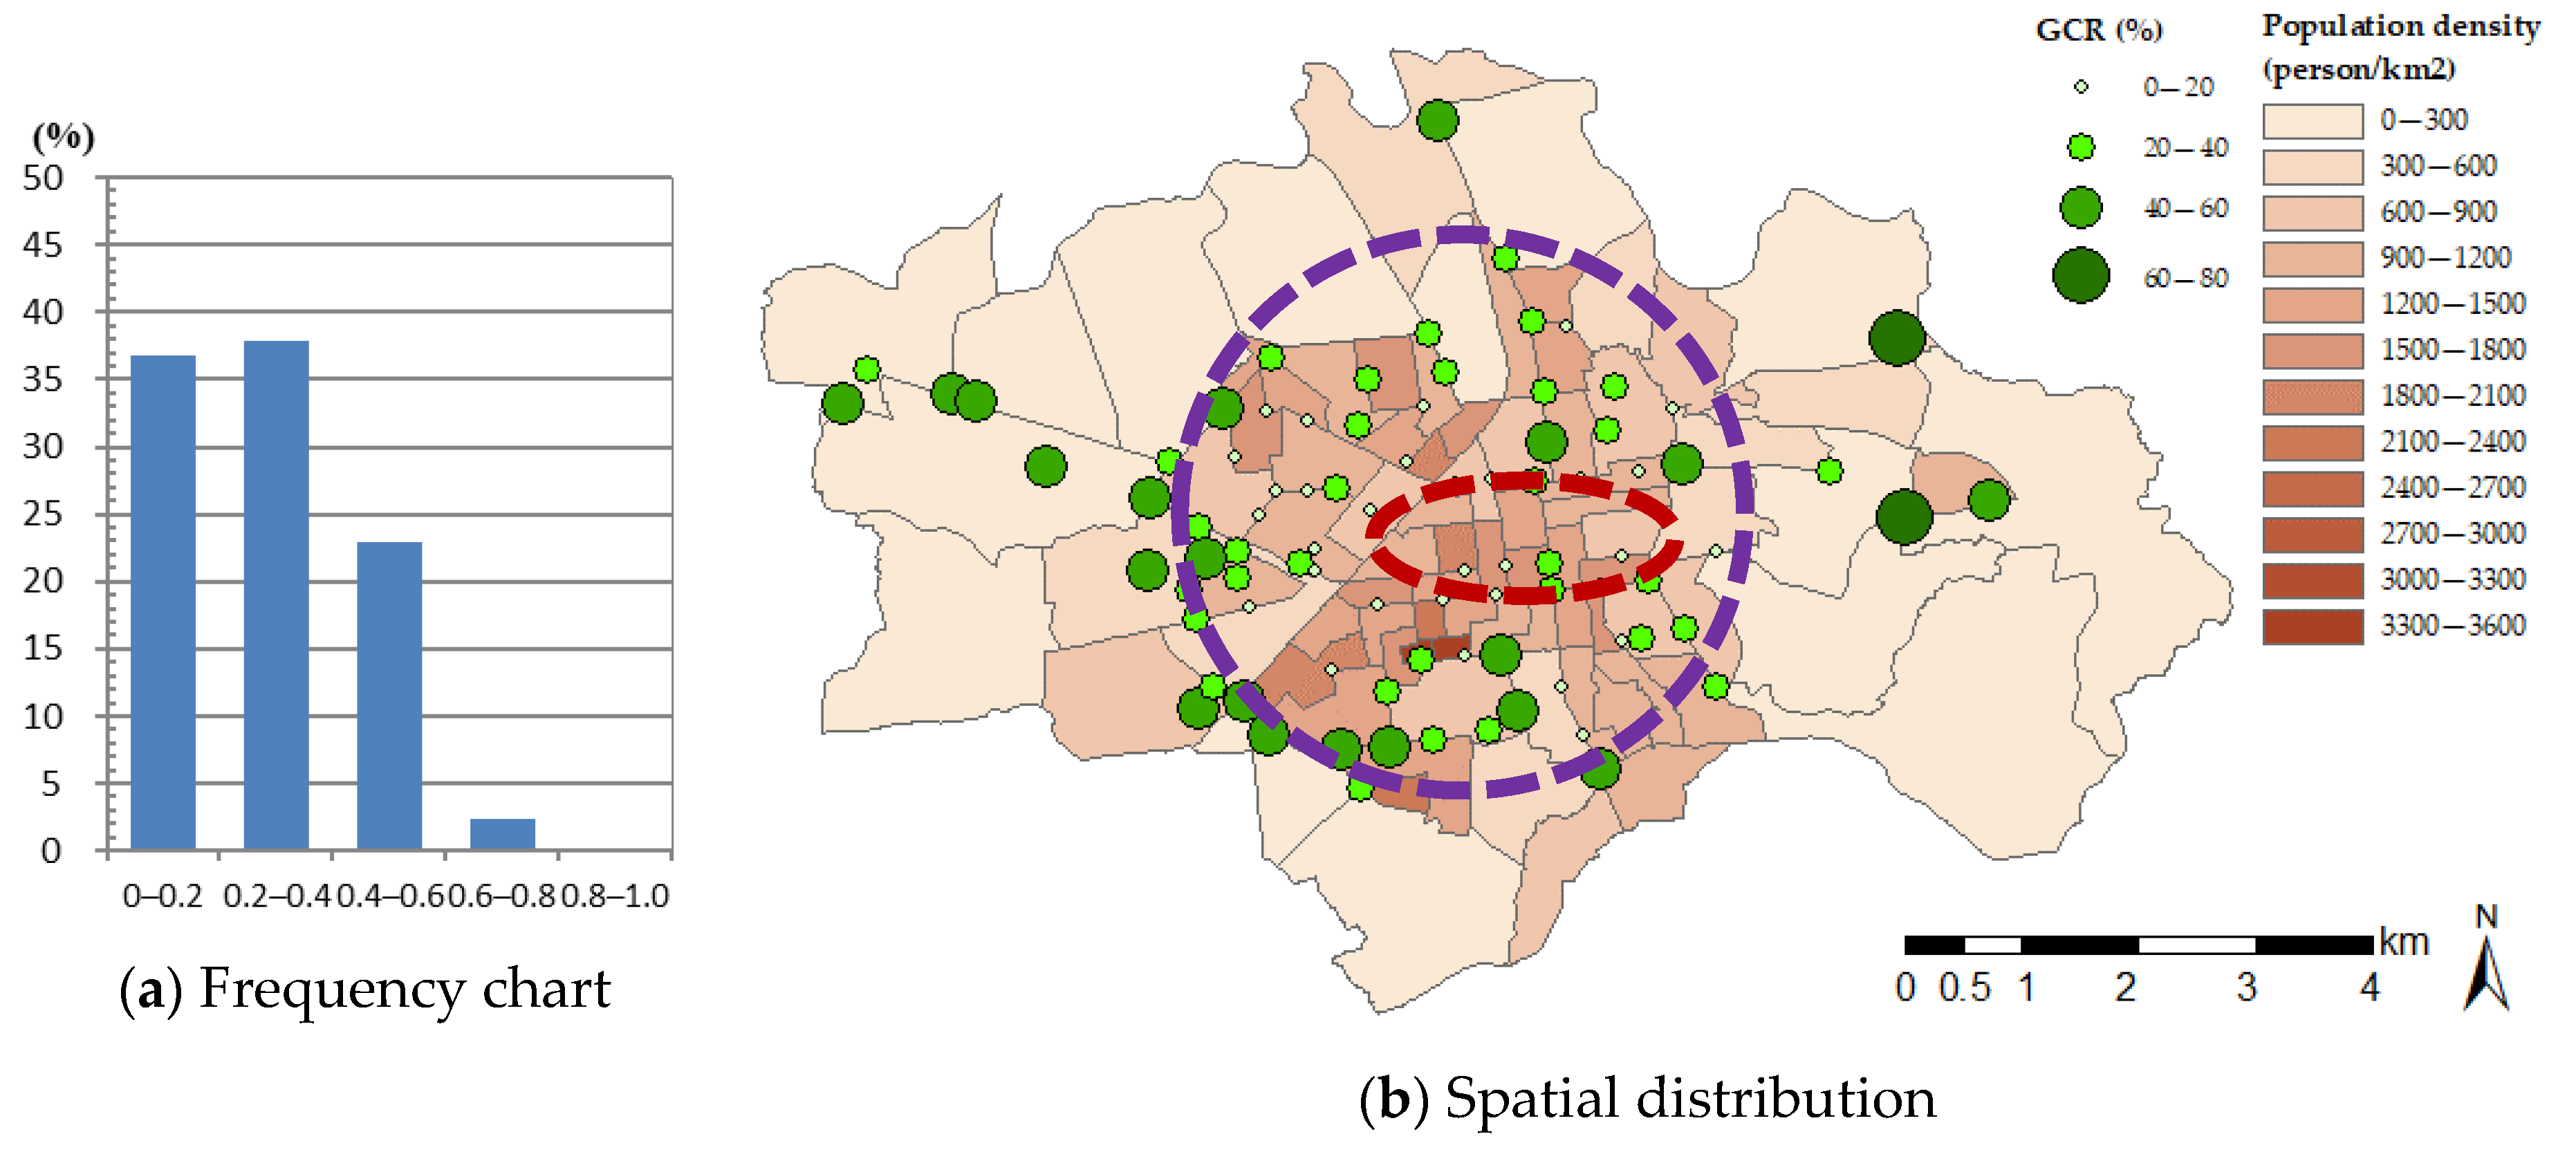
Figure 6 shows a summary of the analysis results of the GCR. The results indicate that at most of the survey points (i.e., 65 points or 75% of the survey points), the GCR was 0–0.4. In addition, at 23% of the survey points, the GCR was 0.4 to 0.6, whereas at only 2% of the survey points (or 2 survey points), the GCR was higher than 0.6 (Figure 6a). Figure 6b also shows the spatial distribution of the GCR. It was found that the closer the survey point occurred to the train station (the area enclosed by the red dotted line) and downtown area (the area enclosed by the purple dotted line), the lower the GCR was (<0.2). Conversely, the closer the survey point was to the rural area (the area outside the two enclosed areas), the higher the GCR was (>0.4).

3.2.2. Building Coverage Ratio (BCR)

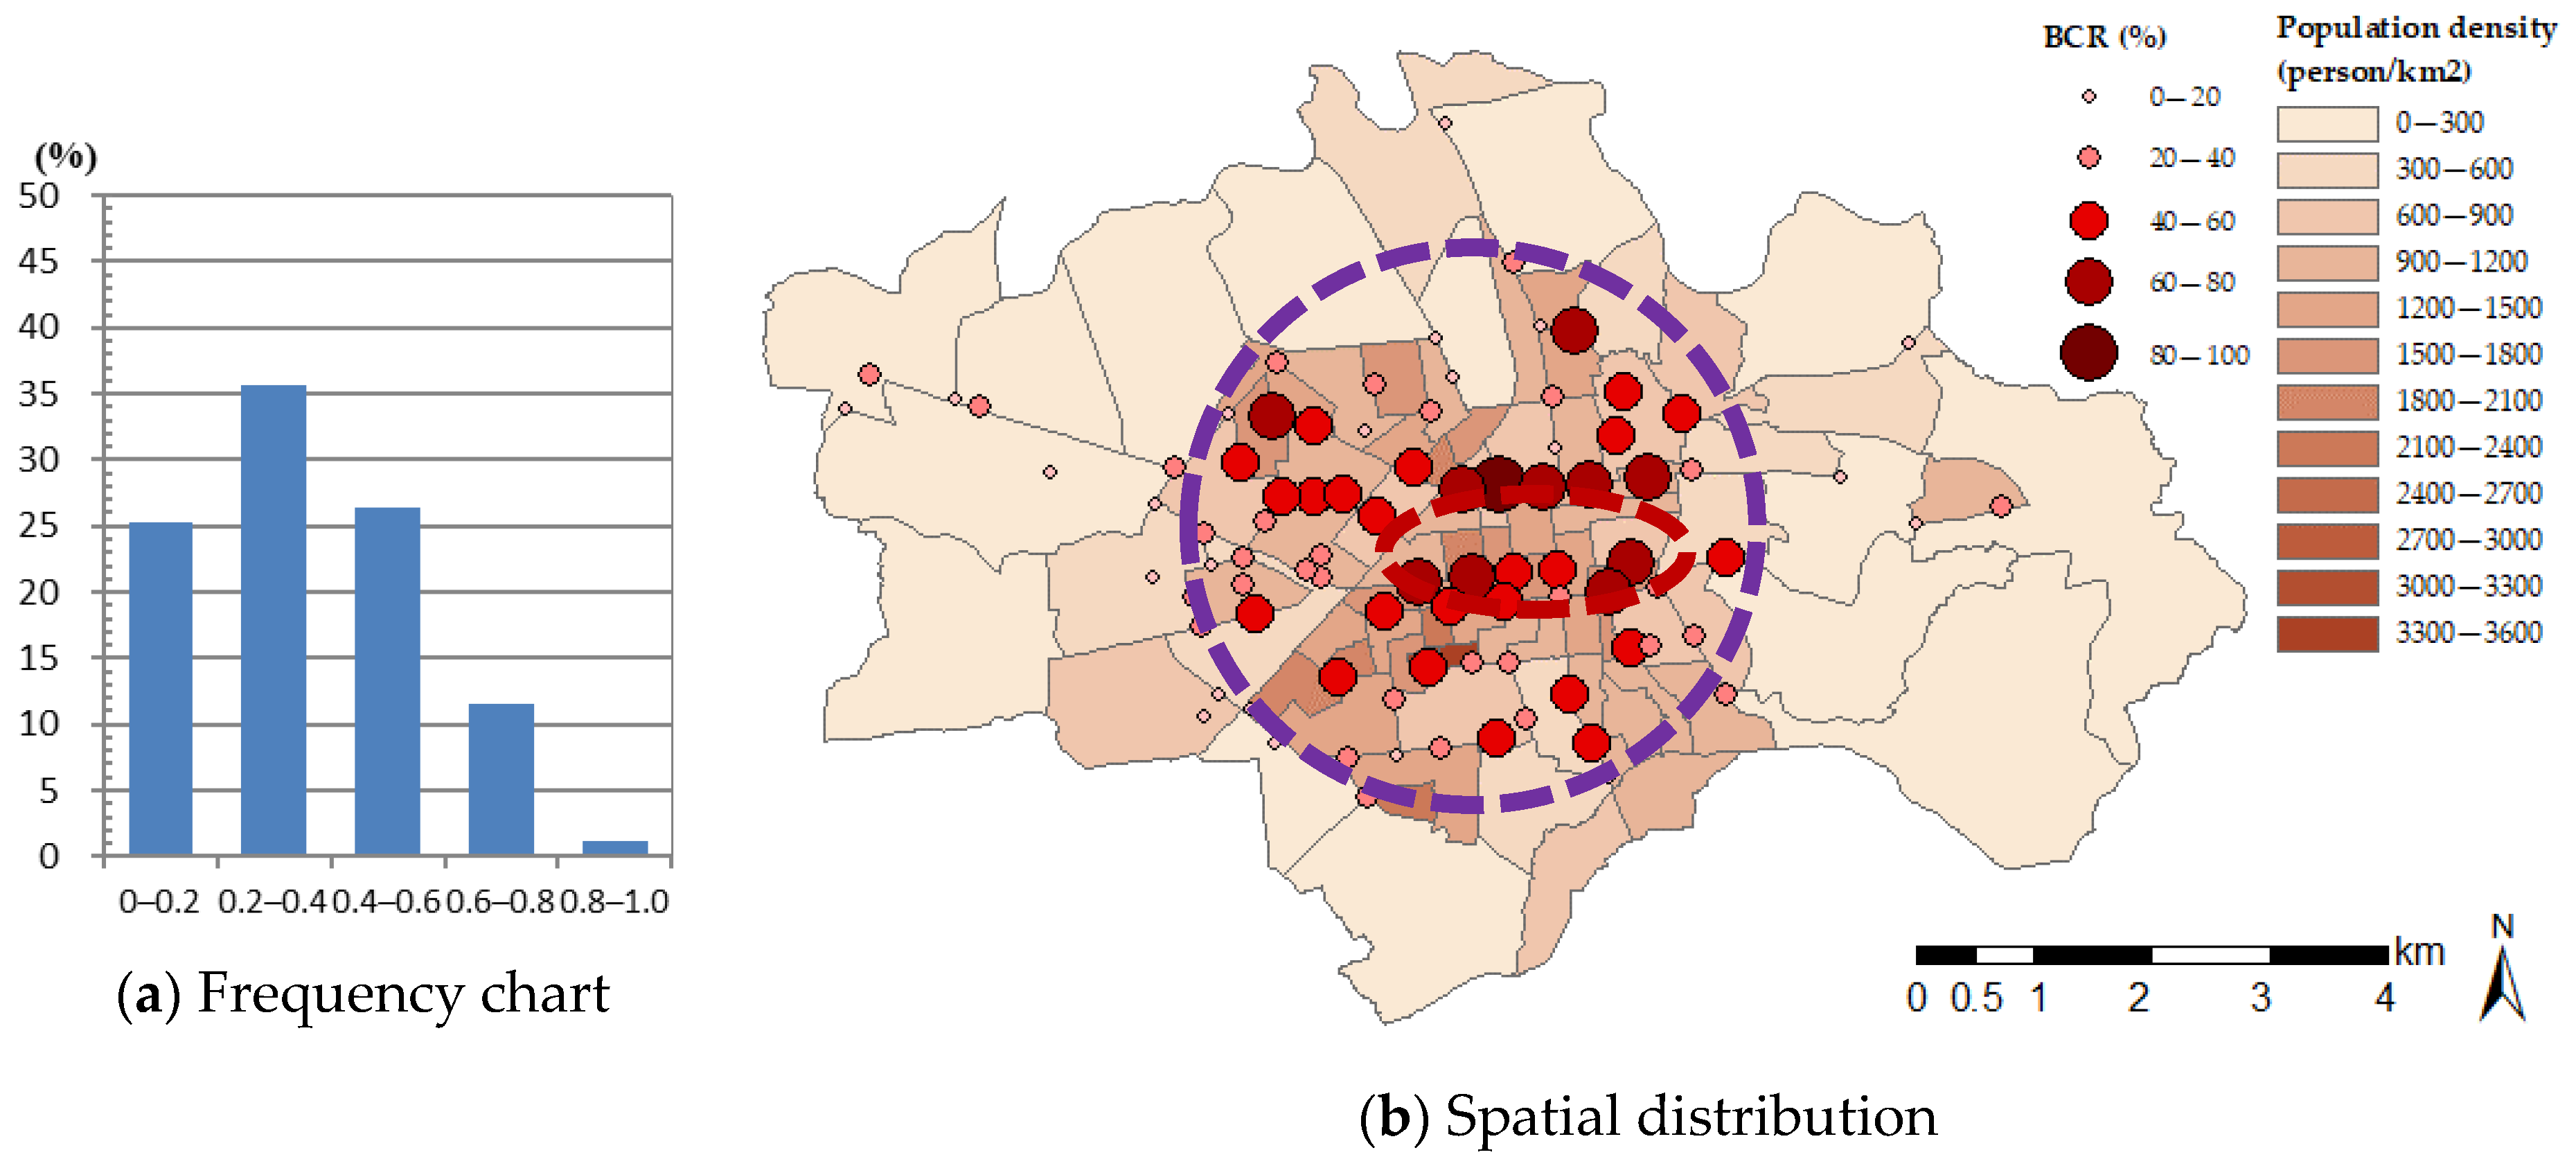
Figure 7 shows an overview of the BCR analysis results. The results reveal that at most survey points (i.e., 53 points or 61% of the survey points), the BCR was 0–0.4. In terms of the remaining points, at 26% of the survey points, the BCR was 0.4 to 0.6, whereas at only 12% of the survey points, the BCR was higher than 0.6 (Figure 7a). Figure 7b also reveals the spatial distribution of the BCR. When the survey points were located close to the train station and downtown area, the BCR increased to 0.4 or greater. Conversely, when the survey points were closer to the boundary of the city and rural area, the BCR decreased to 0.2 or lower.

3.2.3. Floor Area Ratio (FAR)

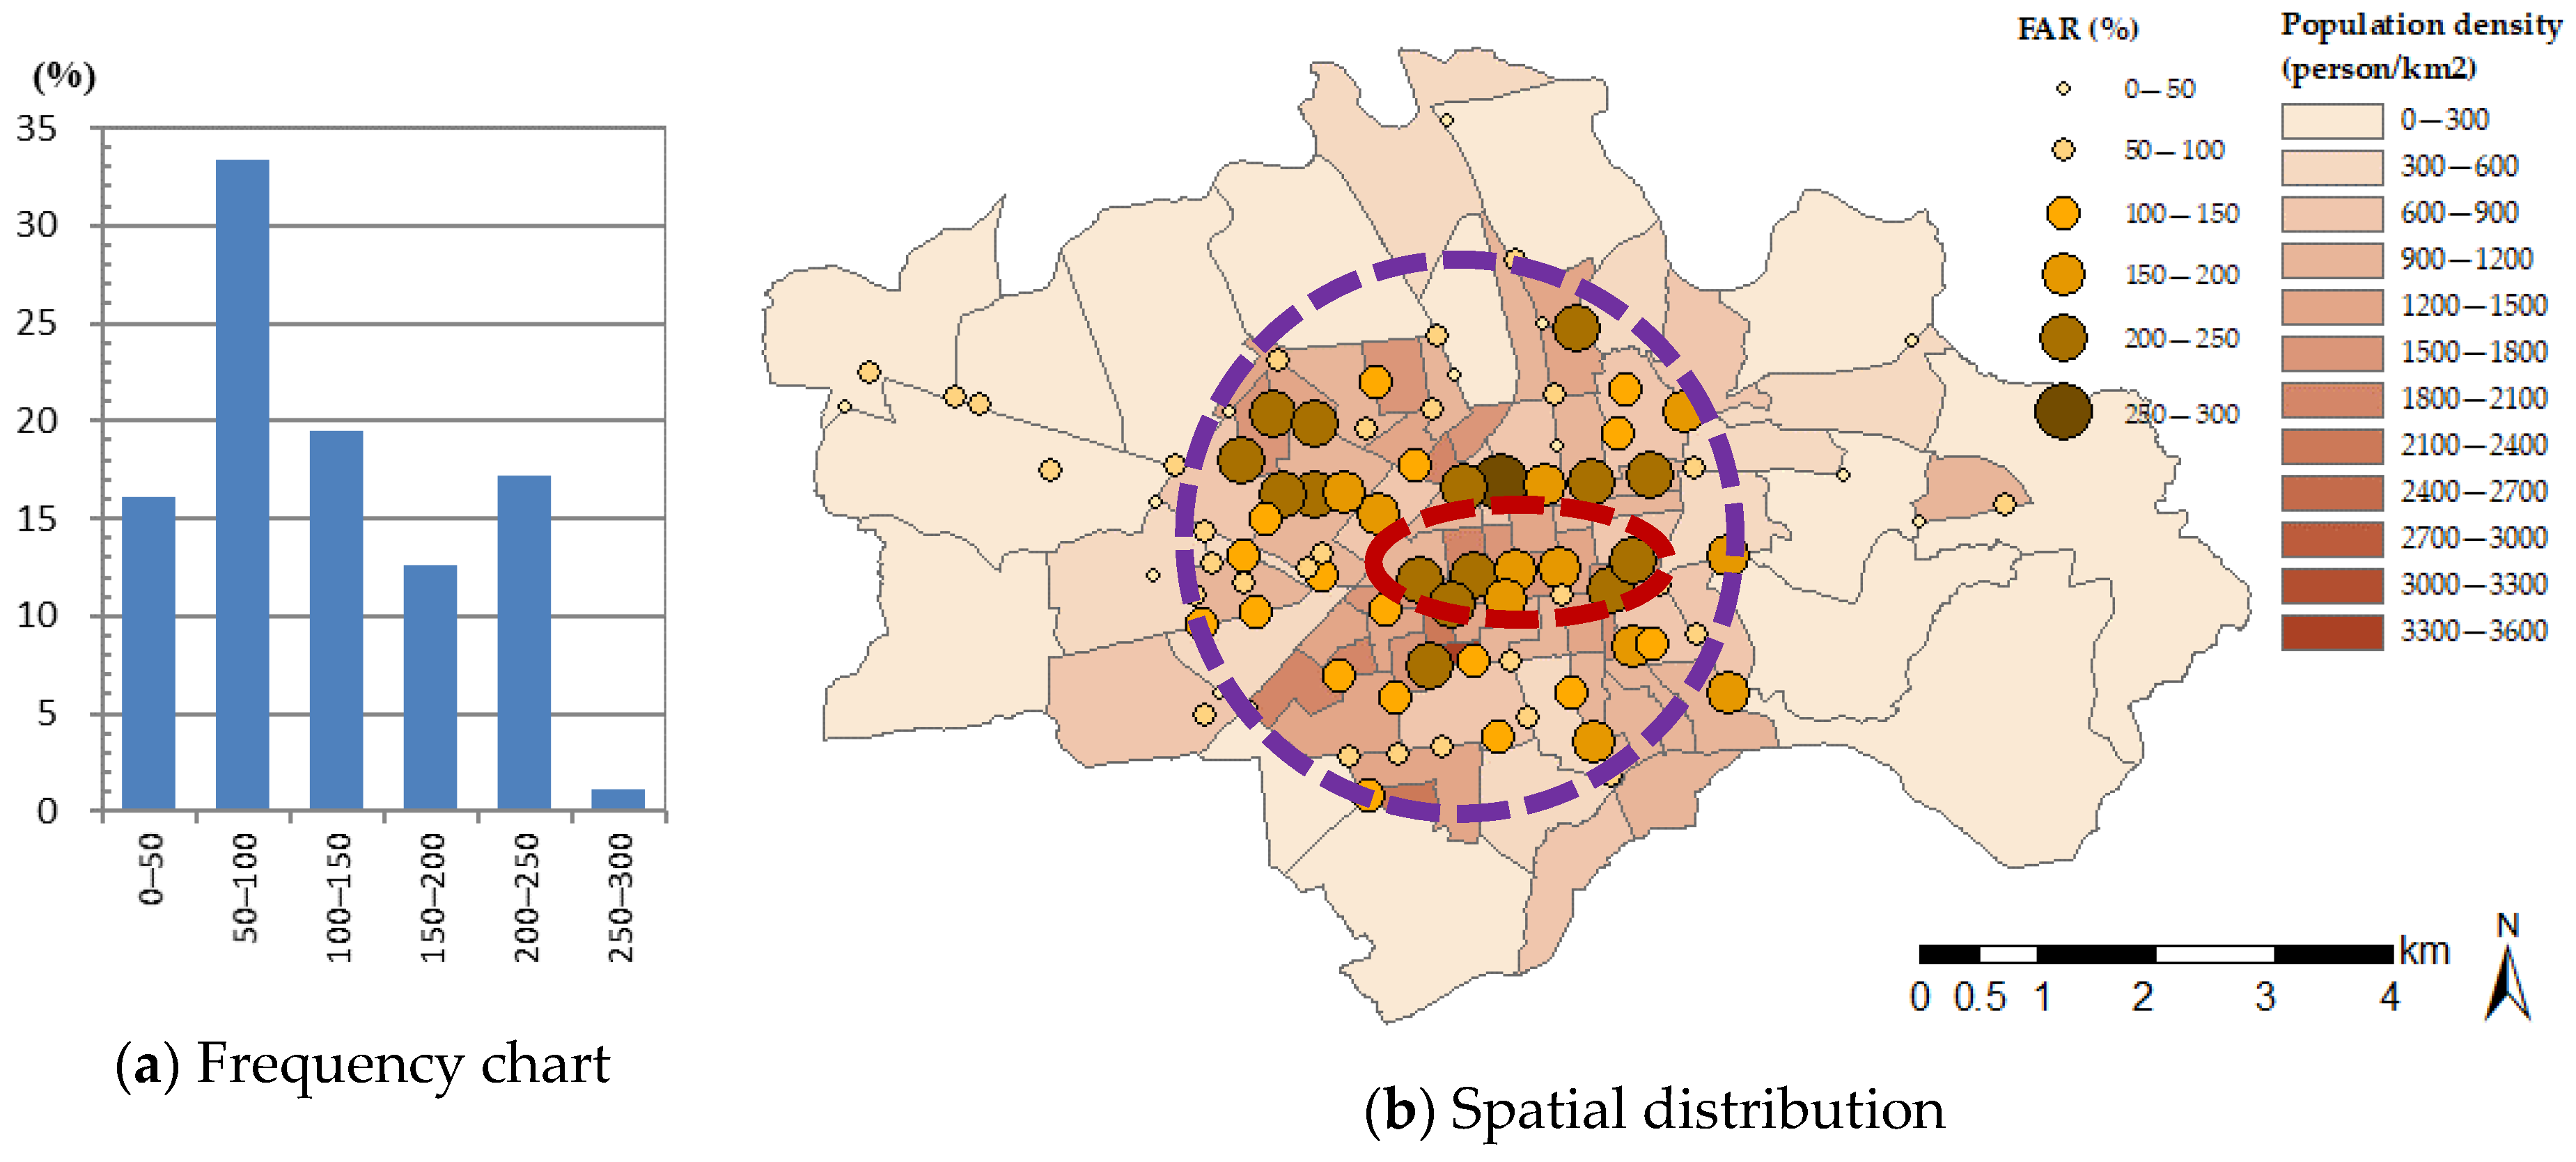
Figure 8 shows a summary of the FAR analysis results. The results indicate that at 50% of the survey points, the FAR was lower than 100%. Among the remainder, 20% of the survey points had an FAR of 100–150%, 13% of the survey points had an FAR of 150–200%, and 17% of the survey points had an FAR of 200–250% (Figure 8a). Figure 8b also shows the spatial distribution of the FAR. When the survey point was located close to the train station and downtown area, the FAR greatly increased to 150% or greater. Conversely, when the survey point was located close to the boundary of the city and rural area, the FAR decreased to 100% or lower.

3.2.4. Sky View Factor (SVF)

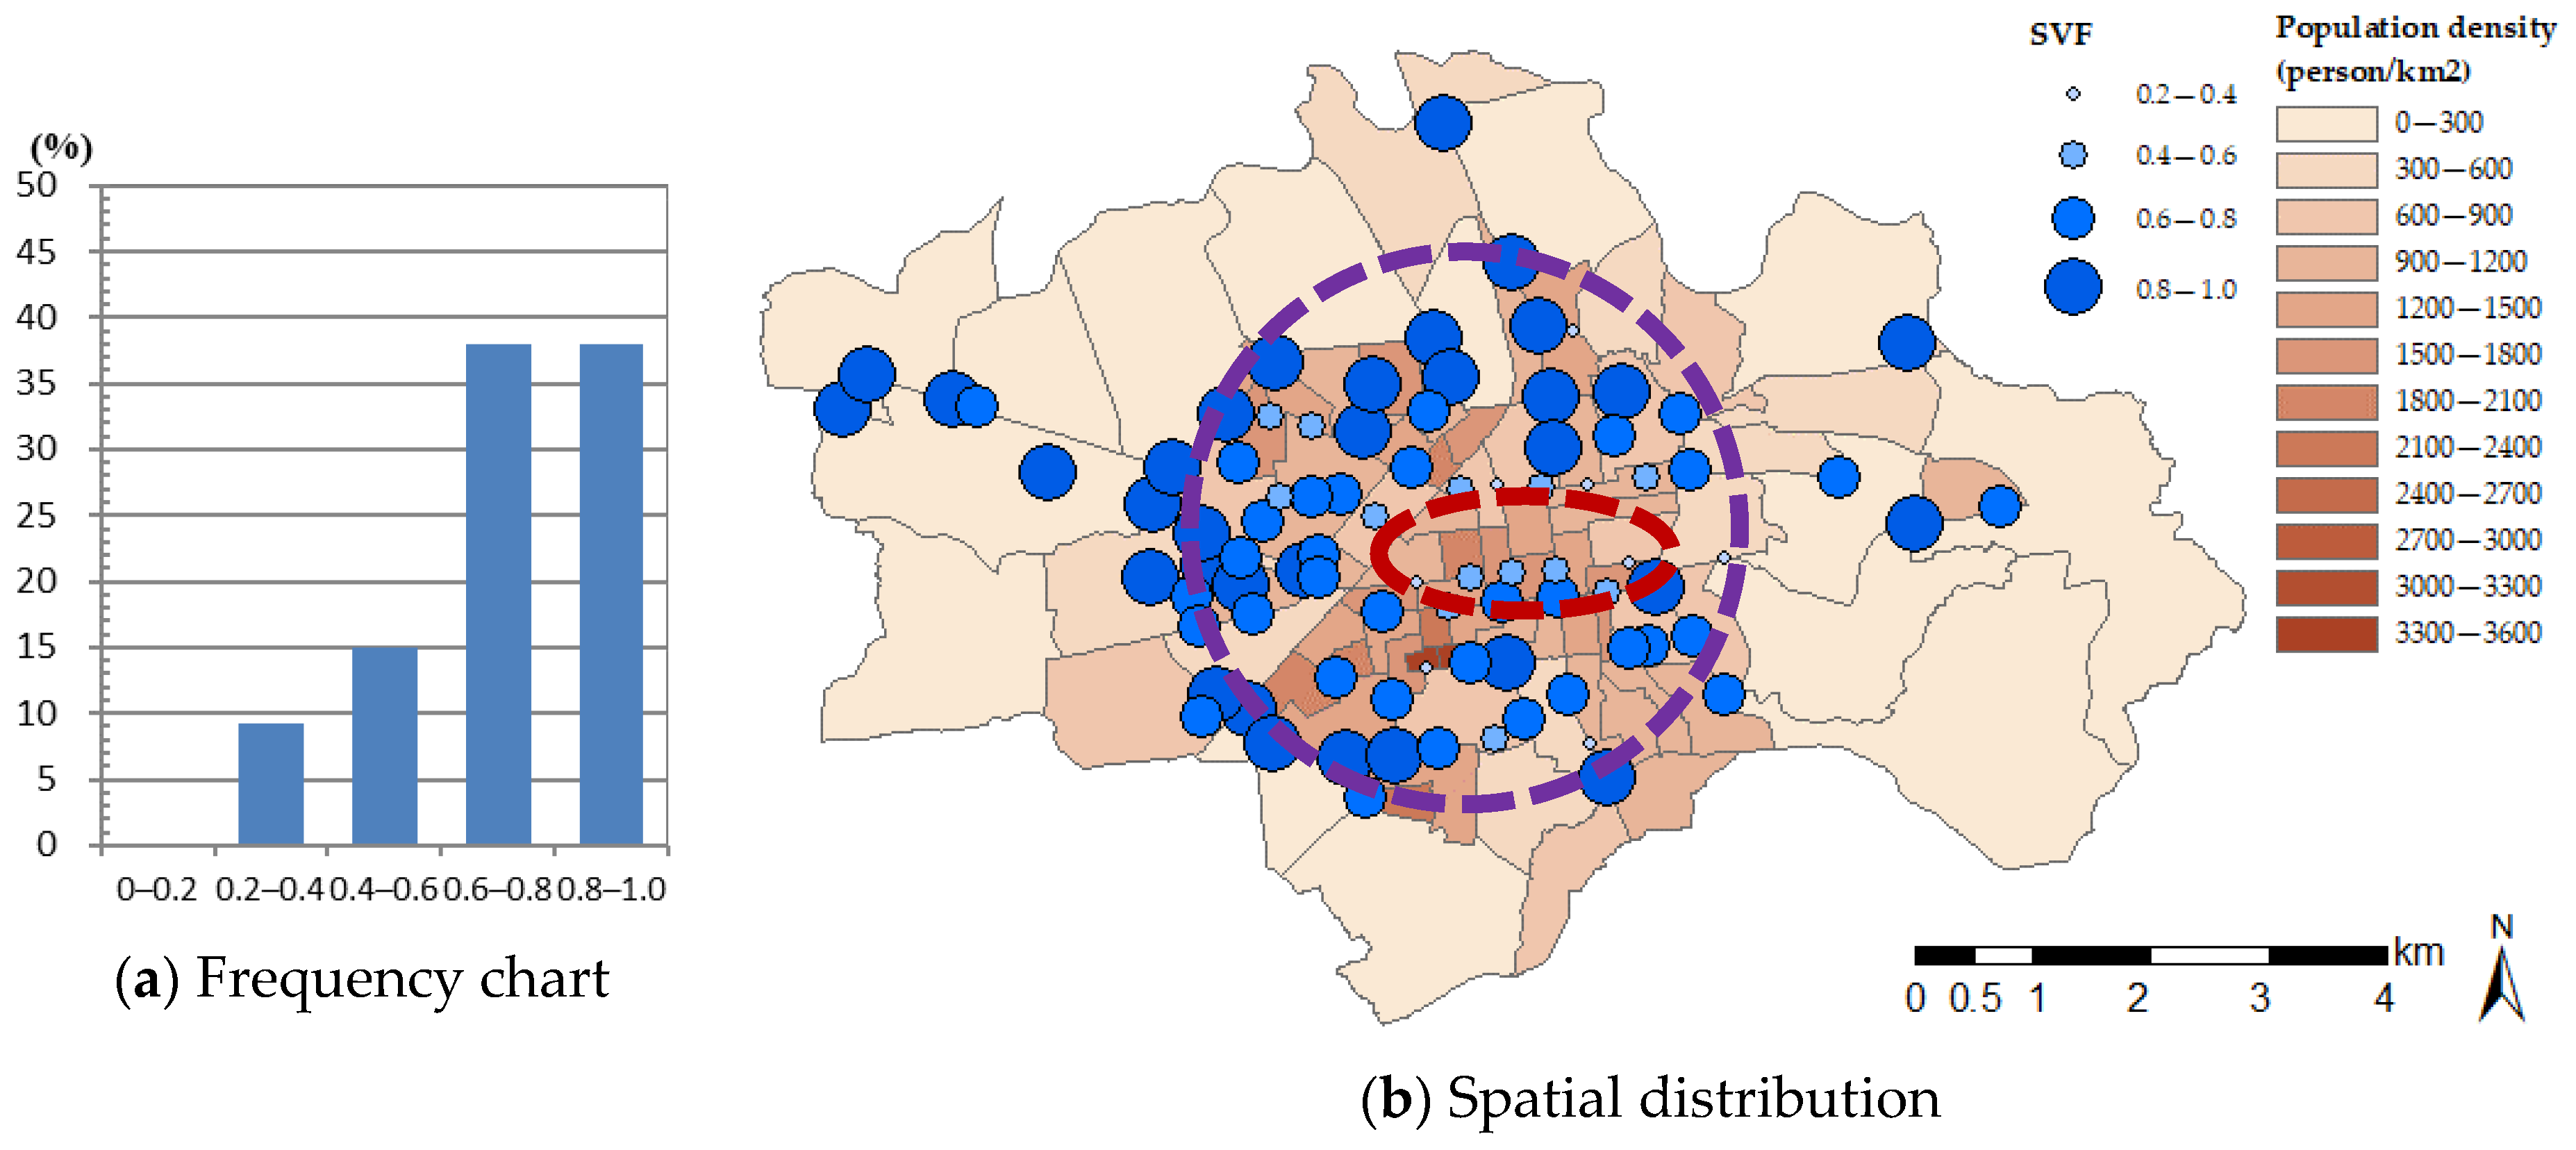
Figure 9 shows a summary of the analysis results of the SVF. At most of the survey points (i.e., 66 points or 76% of the survey points), the SVF was 0.6 to 1.0. Among the remaining points, 15% of the survey points had an SVF of 0.4–0.6, whereas 9% of the survey points exhibited an SVF of 0.2–0.4 (Figure 9a). Figure 9b also shows the spatial distribution of the SVF. A survey point closer to the train station and downtown area had a lower SVF (0.2–0.6). A similar trend was observed at the nearby northern survey points. The other survey points had high SVF values (>0.6).

3.3. Correlation between the UHI and the Canyon-Scale Built-Environment Factors

3.3.1. Daytime Relationship

Table 3 summarizes the results of the correlation analysis between the daytime UHI effect and canyon-scale built-environment factors. The correlation was stronger in the afternoon (13:00–14:00) than at midday (12:00). The factors of BCR and FAR were positively correlated with the air temperature, whereas GCR and SVF were negatively correlated with the air temperature. The coefficient of correlation (r) reached its maximum value at 13:00. In particular, the r was higher than 0.37 between the air temperature and the 2D factors, and the r was higher than 0.4 between the air temperature and the 3D factors (i.e., moderately correlated). r attained its second-highest value at 14:00; r was between 0.28 and 0.37 for the 2D factors and between 0.28 and 0.30 for the 3D factors.
The spatial distribution of r at 13:00 was analyzed in greater detail. In the northern area, r was as low as 0.23 for the GCR. Except for this case, r was higher than 0.4 for the other 2D factors (i.e., moderately correlated), and r reached approximately 0.5 for the 3D factors. In the southern area, r was as low as 0.28 for the BCR, which was a 2D factor; r was as low as 0.14 for the SVF, which was a 3D factor; r was 0.41–0.45 for the other factors. In the western area, r was approximately 0.5 for both 2D and 3D factors, and r was as high as 0.6 for the BCR.

3.3.2. Midnight Relationship

Table 4 summarizes the results of the correlation analysis between the midnight UHI and canyon-scale built-environment factors. It was found that r was higher than or approaching 0.3 for the GCR at 00:30 and 01:30. Except for these cases, r indicated a low correlation. At 00:30, at which the coefficient of correlation was relatively high, the GCR and SVF were negatively correlated with the air temperature, and r was low for the SVF. The BCR and FAR were positively correlated with the air temperature, but r was low for these two factors.
The spatial distribution of r was also analyzed in greater detail. In the northern area, all factors revealed a low correlation with the air temperature, and r was 0.01–0.19. In the southern area, the 2D factors attained a high correlation, and r was as high as 0.6 for the GCR at 00:30. However, the 3D factors revealed a low correlation, and r was approximately 0.22. In the western area, the 2D factors achieved a relatively high correlation, and r was as high as 0.63 for the BCR at 00:30. The 3D factors were highly correlated, and r was as high as 0.65 for the FAR.

3.3.3. Comparison to Previous Studies

(1) Correlation with the Daytime UHI
The 2D factors such as the GCR and BCR attained both positive and negative correlations, respectively, with the daytime air temperature, and the results of the present study agreed well with those of previous studies [14,15]. The 3D factors such as the FAR revealed a positive correlation with the air temperature, and this result also agreed well with those of previous studies [21,22]. The present study demonstrated a negative correlation between the SVF and air temperature, and this result differed from those of early-day studies [19,20]. Diverse opinions exist on the correlation between the SVF and daytime air temperature. A work reported in 2010 [36] indicated that compared to the air temperature, the mean radiant temperature (MRT) affected by solar radiation is more relevant to the SVF. Recently, the relationship among SVF, air temperature, and MRT was studied. There existed either a positive or negative correlation between SVF and daytime air temperature where the correlation between MRT and air temperature did not differ between the daytime and midnight surveys [20,37,38]. At present, the correlation between SVF and air temperature remains to be definitively established, which is perhaps affected by the urban geometry of different regions. This study determined the SVF value by taking the average value for all the grid points in the 2 m x 2 m area on the ground, whereas the other studies usually determined the SVF value using a single point or several on a street. The difference in the SVF calculation methods could be one of the reasons the results were affected and is recommended for further study.
In regard to the coefficient of correlation (r), the 2D factors in this study were moderately correlated with the UHI (r ≥ 0.37), and the coefficient of correlation was comparable to those reported in previous studies (r = 0.3~0.6). The 3D factors in this study were also moderately correlated with the air temperature (r ≥ 0.4), and the coefficient of correlation was comparable to those determined in previous studies (r = 0.3~0.5).
The relationship between canopy-scale built-environment characteristics and the UHI effect was also studied in Taipei on the 200 m scale [30] (please refer to Table 5). After comparison, the 2D factors such as the GCR and BCR were more correlated with the UHI in Chiayi city than they were in Taipei. R increased from 8% to 13%. These results suggest that the 2D built-environment factors such as the GCR and BCR likely impact the UHI of a medium-size city as greatly as that of a megacity. Specifically, in the early stage of urban development or during the period of growth, the change in land use plays a key role in affecting the UHI phenomenon. It should be noted that the above two cities were surveyed on two different scales (i.e., a 100 m scale for Chiayi city and a 200 m scale for Taipei). The scale effect is examined at the end of this section.
(2) Correlation with the Midnight UHI
The daytime and midnight surveys yielded almost the same trends between the air temperature and built-environment factors. The 2D factors such as the GCR and BCR revealed positive and negative correlations, respectively, with the midnight air temperature, and the results of the present study agreed well with those of previous studies. The 3D factors such as the FAR attained a positive correlation with the midnight air temperature, and this result also conformed to those of previous studies. Either a positive or negative correlation was found between the SVF and midnight air temperature.
The coefficient of correlation (r) increased to 0.4 for the GCR, a 2D built-environment factor, but decreased to 0.3 or lower for the other factors. In other words, the relation between the midnight UHI and the BCR, FAR, or SVF was not as statistically notable as that between the midnight UHI and the GCR. This probably occurred because of artificial heat emission and corresponding effects. Similar results were also obtained in a 2010 survey in Shanghai, China [39].
The results of the present study in Chiayi city were also compared to those in Taipei (Table 5). The 2D factors such as the GCR and BCR were more correlated with the air temperature in Chiayi city than they were in Taipei. r decreased by 5–18%, which implies that there may be another factor governing the cold island effect in a medium-size city at midnight. The two cities were surveyed on two different scales: a 100 m scale for Chiayi city and a 200 m scale for Taipei. The scale effect is described at the end of this section.
(3) Buffer Size and Scale Effects
There exists no specific standard for the selection of the buffer size in canopy-scale UHI effect research. The buffer sizes therefore vary from one study to another. It was not until quite recently that the effect of the buffer size was studied. For example, Foissard et al. [31] collected temperature data from 22 fixed weather stations with a buffer size ranging from 100 to 1000 m and performed a correlation analysis between UHI and built-environment factors in Renne, a medium-sized city in France with a population of 210,000 people. They found that the BCR attained the highest correlation under the 200 m buffer size, whereas the GCR exhibited the highest correlation under the 900 m buffer size, and the results only differed approximately 4% from the 200 m results. With a buffer size ranging from 100 to 1000 m, Lan et al. [21] conducted a similar study in Wuhan, a large city in China. Their 200 m results revealed the highest correlation between UHI and 2D factors such as the building density, and 3D factors such as the FAR and building height.
Therefore, the factors were re-analyzed with a buffer size of 200 m to understand how the sampling range may have affected the correlation between the canopy-scale air temperature and the built-environment factors in this study. In addition, the GCR and BCR were analyzed with a buffer size of 1000 m to compare with the GCR and BCR analyzed for the same area in 1999 [23], as indicated in Table 6. With the use of the same temperature data, changing the buffer size from 100 to 200 m resulted in very similar coefficients of correlation (r) between the (13:00) daytime air temperature and 2D factors such as the GCR and BCR, but the scale effect caused r to increase by 5–9% for the 3D factors such as the FAR and SVF. Except for the FAR, the other factors attained a high correlation with the (00:30) midnight air temperature, and the increase was approximately 4–25%. Specifically, a considerable variation in the coefficients of correlation was observed between the SVF and air temperature. The 1000 m scale SVF was slightly correlated with the air temperature, whereas the 200 m scale SVF was moderately correlated with the air temperature (please refer to Table 6).
In regard to 2D factors such as the GCR and BCR, with increasing buffer size from 200 to 1000 m the coefficients of correlation (r) with the daytime UHI did not increase but decreased instead (please refer to Table 6). Except for the BCR, the coefficients of correlation (r) with the midnight UHI also decreased. These examples indicate that a large buffer size does not necessarily yield a high correlation. However, Chen et al. conducted a similar survey in Chiayi city in 1999 with a buffer size of 1000 m and reported a high correlation between the UHI and GCR [23,24] (see Table 5). The reason may be that as explained in the previous study, 2D factors such as the GCR may attain the highest correlation with the UHI under a survey radius of 900 m [31]. In addition, the 1999 survey was conducted in the early stage of urban development; therefore, the land use may have had more notable impacts on the UHI effect. Although the effects of land use were widely studied in the past, scale effects have not received much research attention.
Based on the above work, it is recommended to adopt a buffer size of 200 m to study the relationship between canopy-scale built-environment characteristics and the UHI effect. In particular, the correlation changes with the buffer size, and it was more appropriate to limit the size to a certain threshold. At present, there are still few studies on the buffer size or survey scale in canyon-scale UHI research. It is therefore recommended to further study the effects for other regions or cities.

4. Conclusions

With Chiayi city selected as an example of a tropical, medium-sized city, we analyzed the correlation between 2D and 3D canopy-scale built-environment factors and air temperature. Based on the above work, the following conclusions were drawn.
  • During the daytime, the wind speed was 1.84 m/s, and the radiation reached approximately 2.17 MJ/m2 on average. Under these conditions, the 2D and 3D built-environment factors attained similar coefficients of correlation with the air temperature. The coefficient of correlation attained a peak value of 0.4 at 13:00.
  • The wind speed reached 1.84 m/s at midnight, and the daytime radiation was approximately 2.76 MJ/m2 on average. Under these conditions, the 2D and 3D built-environment factors exhibited the highest correlation with the air temperature at 00:30, and the coefficient was from 0.1 to 0.4.
  • The 2D factors such as the GCR and BCR attained high correlation coefficients with the UHI. The trend was more significant in medium-sized cities than it was in large cities in the same country.
  • In regard to the correlation between 2D factors such as the GCR and BCR and 3D factors such as the FAR, the present study produced similar observations as previous studies. The SVF, a 3D factor, revealed a positive or negative correlation with the air temperature. Similar results were recently reported [20,37,38]. The correlation between the SVF and air temperature requires further study, especially considering different urban geometric characteristics and SVF calculation methods.
  • With buffer sizes of 100, 200, and 1000 m, built-environment factors were analyzed and correlated to the air temperature. The buffer size of 200 m generated the highest correlation, whereas the buffer size of 1000 m yielded the lowest correlation. As the number of relevant studies is small, it is recommended to further study the buffer size and scale effects in other regions worldwide.
This study presents the results of a case study on canopy UHI effects in a tropical, medium-sized city. There are still relatively few studies on UHI effects for medium-sized cities in the tropics, but the corresponding changes and characteristics can often reproduce those of the early stages of urban development [17]. It is therefore recommended to further study canopy UHI effects for other medium-sized cities. The UHI of this study was limited to summer data and did not reflect seasonal differences. It is recommended to also include winter data in future studies. The buffer size or survey scale is a variable that has not been clearly defined, but it appears to affect the UHI correlation analyses. The survey scales and findings of this study can provide an important reference for the scale effects in studying the UHI effects. Particularly, the correlation between the SVF and the UHI changed greatly with the survey area or calculation methods. This scale effect still needs further study, especially for different SVF calculation methods and urban geometric characteristics.

Author Contributions

Conceptualization, J.-M.H. and H.-Y.C.; methodology, J.-M.H.; software, J.-M.H., L.-C.C., and Y.-S.W.; validation, J.-M.H.; formal analysis, J.-M.H. and L.-C.C.; investigation, Y.-S.W. and L.-C.C.; data curation, J.-M.H.; writing—original draft preparation, J.-M.H. and H.-Y.C.; writing—review and editing, J.-M.H. and H.-Y.C.; visualization, J.-M.H.; project administration, J.-M.H.; funding acquisition, J.-M.H. and H.-Y.C. All authors have read and agreed to the published version of the manuscript.

Funding

The support for this study received from the Ministry of Science and Technology, Taiwan, through grant no. MOST 107-2221-E-415-002-MY2 is gratefully acknowledged.

Institutional Review Board Statement

Not applicable.

Informed Consent Statement

Not applicable.

Data Availability Statement

The data are not publicly available due to Support agency restrictions.

Conflicts of Interest

The authors declare no conflict of interest.

References

  1. Akbari, H.; Davis, S.; Dorsano, S.; Huang, J.M.; Winnett, S. (Eds.) Cooling Our Communities: A Guidebook on Tree Planting and Light-Colored Surfacing; U.S. Environmental Protection Agency, Office of Policy Analysis, Climate Change Division: Washington, DC, USA, 1992.
  2. Brown, R.D.; Terry, J.G. Microclimatic Landscape Design: Creating Thermal Comfort and Energy Efficiency; John Wiley & Sons, Inc.: New York, NY, USA, 1995. [Google Scholar]
  3. Givoni, B. Climate Consideration in Building and Urban Design; Van Nostrand Reinhold: New York, NY, USA, 1998. [Google Scholar]
  4. UN United Nations. World Urbanization Prospects 2018. UN Population Division. Available online: https://population.un.org/wup/ (accessed on 5 August 2020).
  5. Oke, T.R. Boundary Layer Climates, 2nd ed.; Routledge: London, UK; New York, NY, USA, 1987. [Google Scholar]
  6. Oke, T.R. Initial Guidance to Obtain Representative Meteorological Observations at Urban Sites, Instruments and Observing Methods; Report, No. 81, WMO/TD-No.1250; WMO: Geneva, Switzerland, 2006; p. 51. Available online: https://www.wmo.int/pages/prog/www/IMOP/publications/IOM-81/IOM-81-UrbanMetObs.pdf (accessed on 1 October 2020).
  7. Oke, T.R.; Mills, G.; Christen, A.; Voogt, J.A. Urban Climates; Cambridge University Press: Cambridge, UK, 2017. [Google Scholar]
  8. Meng, L.; Mao, J.; Zhou, Y.; Richardson, A.D.; Lee, X.; Thornton, P.E.; Ricciuto, D.M.; Li, X.; Dai, Y.; Shi, X.; et al. Urban warming advances spring phenology but reduces the response of phenology to temperature in the conterminous United States. Proc. National Acad. Sci. USA 2020, 117, 4228–4233. [Google Scholar] [CrossRef] [PubMed]
  9. Erell, E.; Pearlmutter, D.; Williamson, T. Urban Microclimate: Designing the Spaces between Buildings; Routledge: London, UK, 2011; p. 266. [Google Scholar]
  10. Li, H.; Zhou, Y.; Li, X.; Meng, L.; Wang, X.; Wu, S.; Sodoudi, S. A new method to quantify surface urban heat island intensity. Sci. Total Environ. 2018, 624, 262–272. [Google Scholar] [CrossRef] [PubMed]
  11. Li, H.; Zhou, Y.; Wang, X.; Zhou, X.; Zhang, H.; Sodoudi, S. Quantifying urban heat island intensity and its physical mechanism using WRF/UCM. Sci. Total Environ. 2019, 650, 3110–3119. [Google Scholar] [CrossRef] [PubMed]
  12. Lowry, W.P. Atmosphere Ecology for Designers and Planners; Peavine Publications: McMinnville, OR, USA, 1988; p. 435. [Google Scholar]
  13. Bridgman, H.; Warner, R.; Dodson, J. Urban Biophysical Environments; Oxford University Press: Oxford, UK, 1995. [Google Scholar]
  14. Pakarnseree, R.; Chunkao, K.; Bualert, S. Physical characteristics of Bangkok and its urban heat island phenomenon. Build. Environ. 2018, 143, 561–569. [Google Scholar] [CrossRef]
  15. Liu, L.; Lin, Y.; Wang, L.; Wang, D.; Shiu, T.; Chen, X.; Wu, Q. Analysis of local-scale urban heat island characteristics using an integrated method of mobile measurement and GIS-based spatial interpolation. Build. Environ. 2017, 117, 191–207. [Google Scholar] [CrossRef]
  16. Nguyen, T.M.; Lin, T.H.; Chan, H.P. The environmental effects of urban development in Hanoi, Vietnam from satellite and meteorological observations from 1999–2016. Sustainability 2019, 11, 1768. [Google Scholar] [CrossRef] [Green Version]
  17. Huang, J.-M.; Chang, H.-Y.; Wang, Y.-S. Spatiotemporal Changes in the Built Environment Characteristics and Urban Heat Island Effect in a Medium-sized City, Chiayi City, Taiwan. Sustainability 2020, 12, 365. [Google Scholar] [CrossRef] [Green Version]
  18. Alobaydi, D.; Bakarman, M.A.; Obeidat, B. The Impact of Urban form Configuration on the Urban Heat Island: The Case Study of Baghdad, Iraq. Procedia Eng. 2016, 145, 820–827. [Google Scholar] [CrossRef]
  19. Ramírez-Aguilar, E.A.; Lucas Souza, L.C. Urban form and population density: Influences on Urban Heat Island intensities in Bogotá, Colombia. Urban Clim. 2019, 29, 100497. [Google Scholar] [CrossRef]
  20. Jin, H.; Cui, P.; Wong, N.H.; Ignatius, M. Assessing the Effects of Urban Morphology Parameters on Microclimate in Singapore to Control the Urban Heat Island Effect. Sustainability 2018, 10, 206. [Google Scholar] [CrossRef] [Green Version]
  21. Lan, Y.; Zhan, Q. How do urban buildings impact summer air temperature? The effects of building configurations in space and time. Build. Environ. 2017, 125, 88–98. [Google Scholar] [CrossRef]
  22. Yin, C.; Yuanb, M.; Lu, Y.; Huang, Y.; Liu, Y. Effects of urban form on the urban heat island effect based on spatial regression model. Sci. Total Environ. 2018, 634, 696–704. [Google Scholar] [CrossRef] [PubMed]
  23. Lin, H.T.; Chen, K.T.; Kuo, H.C. Experimental Analysis on the Urban Heat Island Effect for the Middle Scale Cities in Taiwan. J. Plan. 2001, 28, 47–64. (In Chinese) [Google Scholar] [CrossRef]
  24. Chen, K.T. The Analysis of Urban Heat Island Effects of the Middle and Small Scale Cities in Taiwan. Master’s Thesis, Department of Architecture, National Cheng Kung University, Tainan, Taiwan, 2000. Available online: https://hdl.handle.net/11296/gr9mt8 (accessed on 10 August 2020). (In Chinese).
  25. Wong, N.H.; Yu, C. Study of green areas and urban heat island in a tropical city. Habitat Int. 2005, 29, 547–558. [Google Scholar] [CrossRef]
  26. Ramakreshnan, L.; Aghamohammadi, N.; Fong, C.S.; Ghaffarianhoseini, A.; Wong, L.P.; Sulaiman, N.M. Empirical study on temporal variations of canopy-level Urban Heat Island effect in the tropical city of Greater Kuala Lumpur. Sustain. Cities Soc. 2019, 44, 748–762. [Google Scholar] [CrossRef]
  27. Lin, H.T.; Lee, K.P.; Chen, K.T.; Lin, L.J.; Kuo, H.C.; Chen, T.C. Experimental Analyses of Urban Heat Island Effects of the Four Metropolitan Cities in Taiwan(Ⅰ)—The Comparision of the Heat Island Intensities Between Taiwan and the World Cities. J. Archit. 1999, 31, 51–73. (In Chinese) [Google Scholar]
  28. Sun, C.Y. A street thermal environment study in summer by the mobile transect technique. Theor. Appl. Climatol. 2011, 106, 433–442. [Google Scholar] [CrossRef]
  29. Sun, C.Y.; Jian, Z.X. Heat Island Effect of Taipei Metropolitan Area. J. City Plan. 2016, 43, 437–462. (In Chinese) [Google Scholar] [CrossRef]
  30. Busato, F.; Lazzarin, R.M.; Noro, M. Three years of study of the Urban Heat Island in Padua: Experimental results. Sustain. Cities Soc. 2014, 10, 251–258. [Google Scholar] [CrossRef]
  31. Foissard, X.; Dubreuil, V.; Quénol, H. Defining scales of the land use effect to map the urban heat island in a mid-size European city: Rennes (France). Urban Clim. 2019, 29, 100490. [Google Scholar] [CrossRef]
  32. Rajagopalan, P.; Lim, K.C.; Jamei, E. Urban heat island and wind flow characteristics of a tropical city. Sol. Energy 2014, 107, 159–170. [Google Scholar] [CrossRef]
  33. Taiwan Central Weather Bureau. Available online: https://www.cwb.gov.tw/eng/ (accessed on 1 October 2020).
  34. Stewart, I.D.; Oke, T.R. Local Climate Zones for Urban Temperature Studies. Bull. Am. Meteorol. Soc. 2012, 93, 1879–1900. [Google Scholar] [CrossRef]
  35. Urban Development Department, Chiayi City. Available online: https://3dmap.chiayi.gov.tw/gis/ (accessed on 1 October 2019).
  36. Krüger, E.L.; Minella, F.O.; Rasia, F. Impact of urban geometry on outdoor thermal comfort and air quality from field measurements in Curitiba, Brazil. Build. Environ. 2011, 46, 621–634. [Google Scholar] [CrossRef]
  37. Wang, Y.; Berardic, U.; Akbari, H. Comparing the effects of urban heat island mitigation strategies for Toronto, Canada. Energy Build. 2016, 114, 2–19. [Google Scholar] [CrossRef]
  38. Wang, Y.; Berardic, U.; Akbari, H. Analysis of urban heat island phenomenon and mitigation solutions evaluation for Montreal. Sustain. Cities Soc. 2016, 26, 438–446. [Google Scholar] [CrossRef]
  39. Yang, F.; Lau, S.S.Y.; Qian, F. Summertime heat island intensities in three high-rise housing quarters in inner-city Shanghai China: Building layout, density and greenery. Build. Environ. 2010, 45, 115–134. [Google Scholar] [CrossRef]
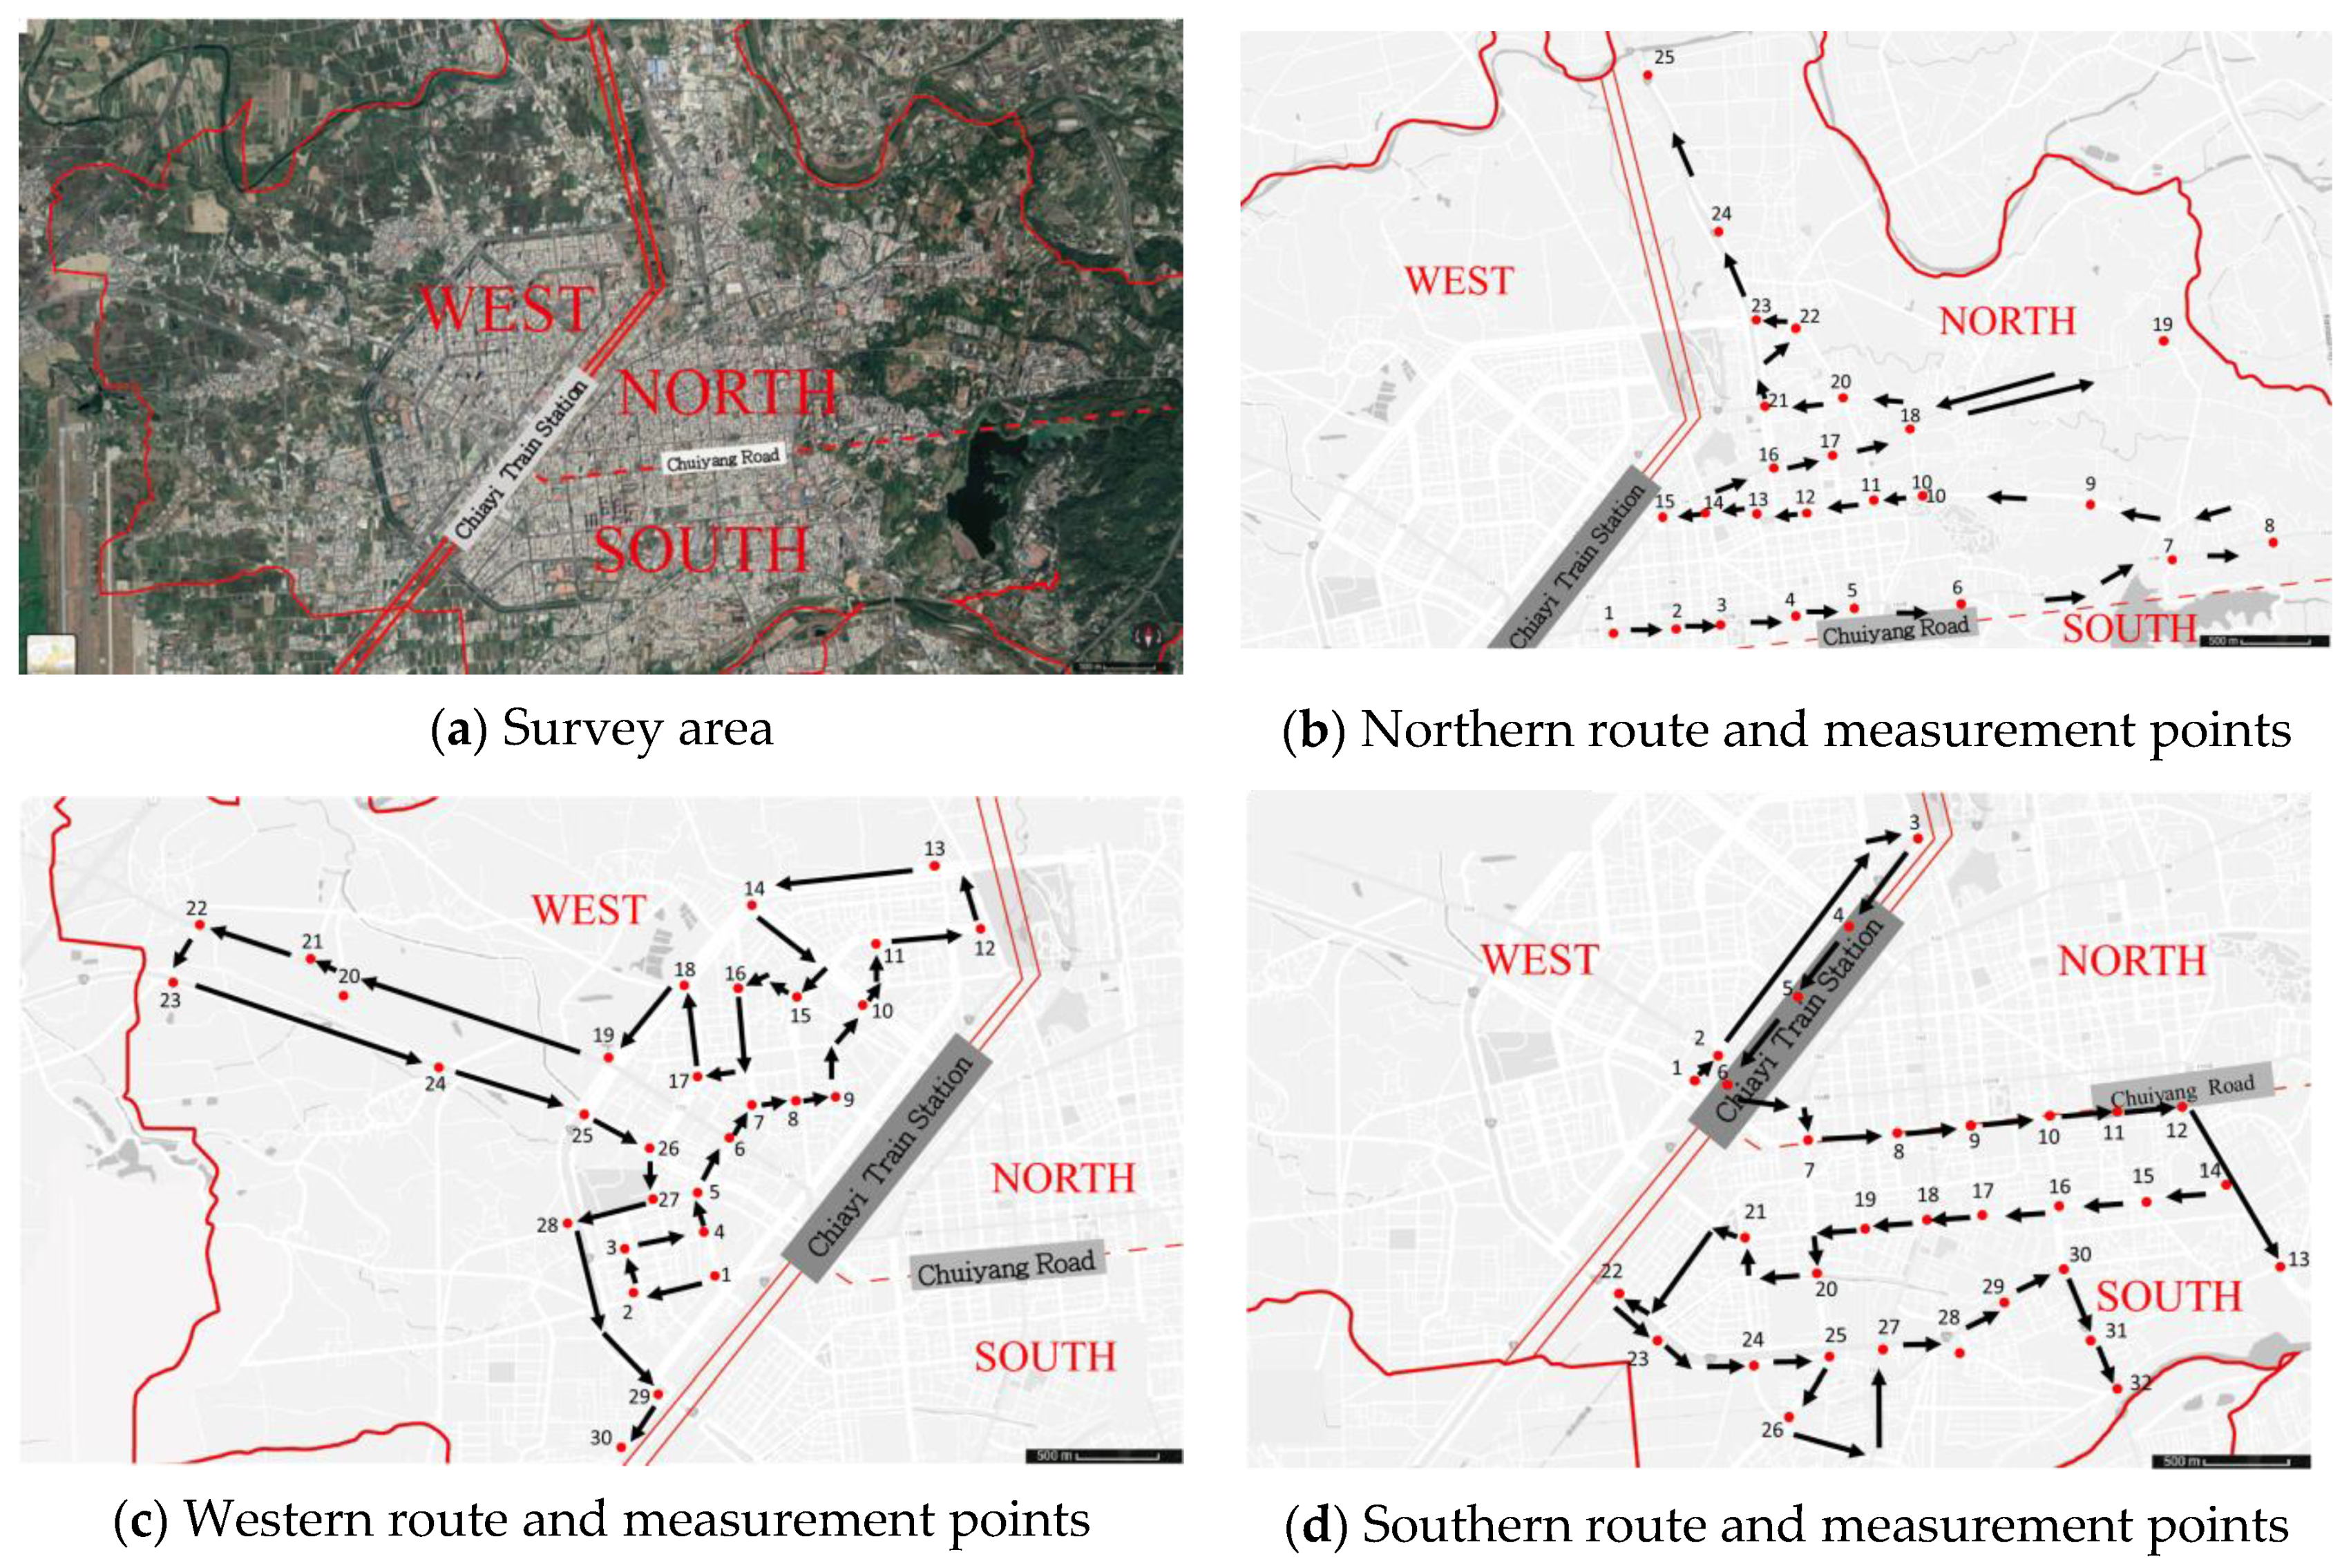
Figure 1. Survey area, 3 routes, and location of 87 measurement points.
Sustainability 13 00868 g001
Figure 2. Photos of instruments and facilities used in the mobile observation method. (a) The photo of the instrument set on the mobile platform. (b) The photo of the instrument setting light shield. (c) The air temperature and humidity recorder HOBO MX2301.
Sustainability 13 00868 g002
Figure 3. Calculation of the SVF. (N1 means the No. 1 measuring point in the northern route (Figure 1b)).
Sustainability 13 00868 g003
Figure 4. Spatial distribution of the air temperature during the daytime on 28 July 2018 (°C).
Sustainability 13 00868 g004
Figure 5. Spatial distribution of the air temperature at midnight on 30 July 2018 (°C).
Sustainability 13 00868 g005
Figure 6. Frequency chart and spatial distribution of the canopy-scale GCR.
Sustainability 13 00868 g006
Figure 7. Frequency chart and spatial distribution of the canopy-scale BCR.
Sustainability 13 00868 g007
Figure 8. Frequency chart and spatial distribution of the canopy-scale FAR.
Sustainability 13 00868 g008
Figure 9. Frequency chart and spatial distribution of the canopy-scale SVF.
Sustainability 13 00868 g009
Table 1. Background weather conditions during the survey [33].
ParameterDaytimeMidnight
28 July30 July 201831 July 2018
121314152324123
Temperature (°C)33.834.034.033.628.728.428.127.126.7
Wind velocity (m/s)1.12.03.12.61.10.70.90.40.3
Cloud cover (0~10)7778----------
Radiation (MJ/m2)1.822.432.492.030.00.00.00.00.0
Note: The data from 11:01–12:00 were marked as 12.
Table 2. Summary of the UHII survey results.
TimeDaytime (28 July 2018)Midnight (30–31 July 2018)
12:0013:0014:0023:3000:3001:30
Tmax (°C)3836.537.529.329.128.5
Tmin (°C)3533.533.627.627.726.0
ΔTu-r (°C)3.03.03.91.71.42.5
Table 3. List of coefficients of correlation (r) between the daytime air temperature on 28 July 2019, and canyon-scale built-environmental factors.
r12:0013:0014:00
All ZonesGCR0.07−0.37−0.38
BCR−0.130.430.27
FAR−0.130.430.26
SVF0.11−0.40−0.28
Northern Zone (45%, BCR)GCR−0.33−0.22−0.27
BCR0.260.370.32
FAR0.290.360.33
SVF−0.08−0.49−0.37
Southern Zone (40%, BCR)GCR−0.26−0.39−0.59
BCR0.320.260.38
FAR0.280.310.31
SVF−0.23−0.15−0.35
Western Zone (30%, BCR)GCR0.33−0.48−0.39
BCR−0.450.580.30
FAR−0.450.550.28
SVF0.28−0.46−0.41
Notes: : r ≥ 0.5; : 0.3 ≤ r < 0.5.
Table 4. List of coefficients of correlation (r) between the midnight air temperature on 30 July 2019, and the canyon-scale built-environment factors.
r23:3000:3001:30
All ZonesGCR0.11−0.40−0.27
BCR−0.180.220.03
FAR−0.160.250.06
SVF0.30−0.100.12
Northern Zone (45%, BCR)GCR−0.02−0.21−0.10
BCR−0.110.010.02
FAR−0.150.03−0.02
SVF0.290.010.14
Southern Zone (40%, BCR)GCR0.25−0.60−0.44
BCR−0.220.300.12
FAR−0.190.250.16
SVF0.24−0.190.03
Western Zone (30%, BCR)GCR−0.13−0.41−0.59
BCR0.090.630.58
FAR0.060.650.53
SVF−0.06−0.42−0.53
Notes: : r ≥ 0.5; : 0.3 ≤ r < 0.5.
Table 5. Comparison to previous studies in Taiwan.
Chiayi CityTaipei [29]
Present StudyPrevious Study [23,24]
Survey and Analysis MethodsSurvey MethodLocomotive-Mobile ObservationsLocomotive-Mobile ObservationsLocomotive-Mobile Observations
Survey Points87208750
Buffer Size100 m1000 m200 m
Survey Time201819992012
Daytime
(13:00)
Midnight
(00:30)
Daytime
(14:00)
Midnight
(02:00)
Daytime
(12:00–14:00)
Midnight
(02:00–04:00)
r2DGCR−0.37−0.40−0.62−0.60−0.29−0.45
BCR0.430.22--0.300.40
Artificial Coverage Ratio (ACR)
(= −GCR)
--0.630.52--
3DFAR0.420.29----
SVF−0.41−0.11----
Table 6. List of coefficients of correlation (r) between the built-environment factors and UHI with a survey radius (R) of 200 and 1000 m.
Coefficients of Correlation (r)DaytimeMidnight
12:0013:0014:0023:3000:3001:30
R = 200 m2DGCR0.16−0.37−0.310.02−0.44−0.29
BCR−0.170.390.24−0.110.260.07
3DFAR−0.300.510.15−0.220.170.06
SVF0.16−0.46−0.270.18−0.350.23
R = 1000 m2DGCR0.02−0.17−0.43−0.04−0.29−0.31
BCR−0.130.290.340.010.390.26
Notes: : r ≥ 0.5; : 0.3 ≤ r < 0.5.
Publisher’s Note: MDPI stays neutral with regard to jurisdictional claims in published maps and institutional affiliations.