Article

Advanced Ultra-Supercritical Coal-Fired Power Plant with Post-Combustion Carbon Capture: Analysis of Electricity Penalty and CO2 Emission Reduction

Faculty of Engineering, University of Rijeka, 51000 Rijeka, Croatia
*
Author to whom correspondence should be addressed.
Sustainability 2021, 13(2), 801; https://doi.org/10.3390/su13020801
Submission received: 25 November 2020 / Revised: 6 January 2021 / Accepted: 13 January 2021 / Published: 15 January 2021
(This article belongs to the Special Issue Sustainability of Carbon Capture and Utilisation)

Abstract

:
This article presents the performance analysis of a 700 MW future planned advanced ultra-supercritical (A-USC) coal-fired power plant fitted with post-combustion carbon capture and storage (CCS) technology. The reference A-USC unit without CCS achieves a net efficiency of 47.6% with CO2 emissions of 700 kgCO2/MWh. Relatively to subcritical units, the net efficiency of the A-USC is 8%-pts higher while CO2 emissions are 16.5% lower. For a CO2 removal rate of 90%, the net efficiency of the CCS integrated A-USC unit is 36.8%. The resulting net efficiency loss is 10.8%-pts and the electricity output penalty is 362.3 kWhel/tCO2 for present state CCS technology. The study continues with the assessment of interface quantities between the capture unit and the steam cycle affecting the performance of the A-USC. Improved CO2 absorbents could alleviate the net efficiency loss by 2–3%-pts, and enhanced CO2 compression strategies and advanced heat integration could further reduce the efficiency loss by 0.5–1.2%-pts and 0.4–0.6%-pts, respectively. The total efficiency gain from CCS technology upgrades is estimated at 3.6%-pts, thus bringing down the net efficiency loss to 7.2%-pts and the electricity output penalty to 241.7 kWhel/tCO2.

1. Introduction

Nowadays, fossil fuels are still the backbone of power generation. In 2019, fossil fuels generated 62.7% of the total global electricity [1]. By energy source, coal contributes with 36.4% in the total electricity generation [1]. Due to pressing environmental and climate concerns, decarbonization of the electric power industry has become imperative. The IEA scenarios in the 2020 World Energy Outlook predicts the reduction of CO2 emissions from the power industry by as much as 60% between 2020 and 2030 [2]. Three-fourths of this reduction will be achieved from the rapid decline of conventional coal-fired generation. However, the share of advanced supercritical coal power plants is expected to rise in order to meet the ongoing growth in global electricity demand [3]. Supercritical steam cycles paired to carbon capture and storage (CCS) technologies are going to be integrated into future clean coal power plants [4]. By 2030, most of the advanced coal power plants will be upgraded with carbon capture, utilization, and storage (CCUS) technologies.
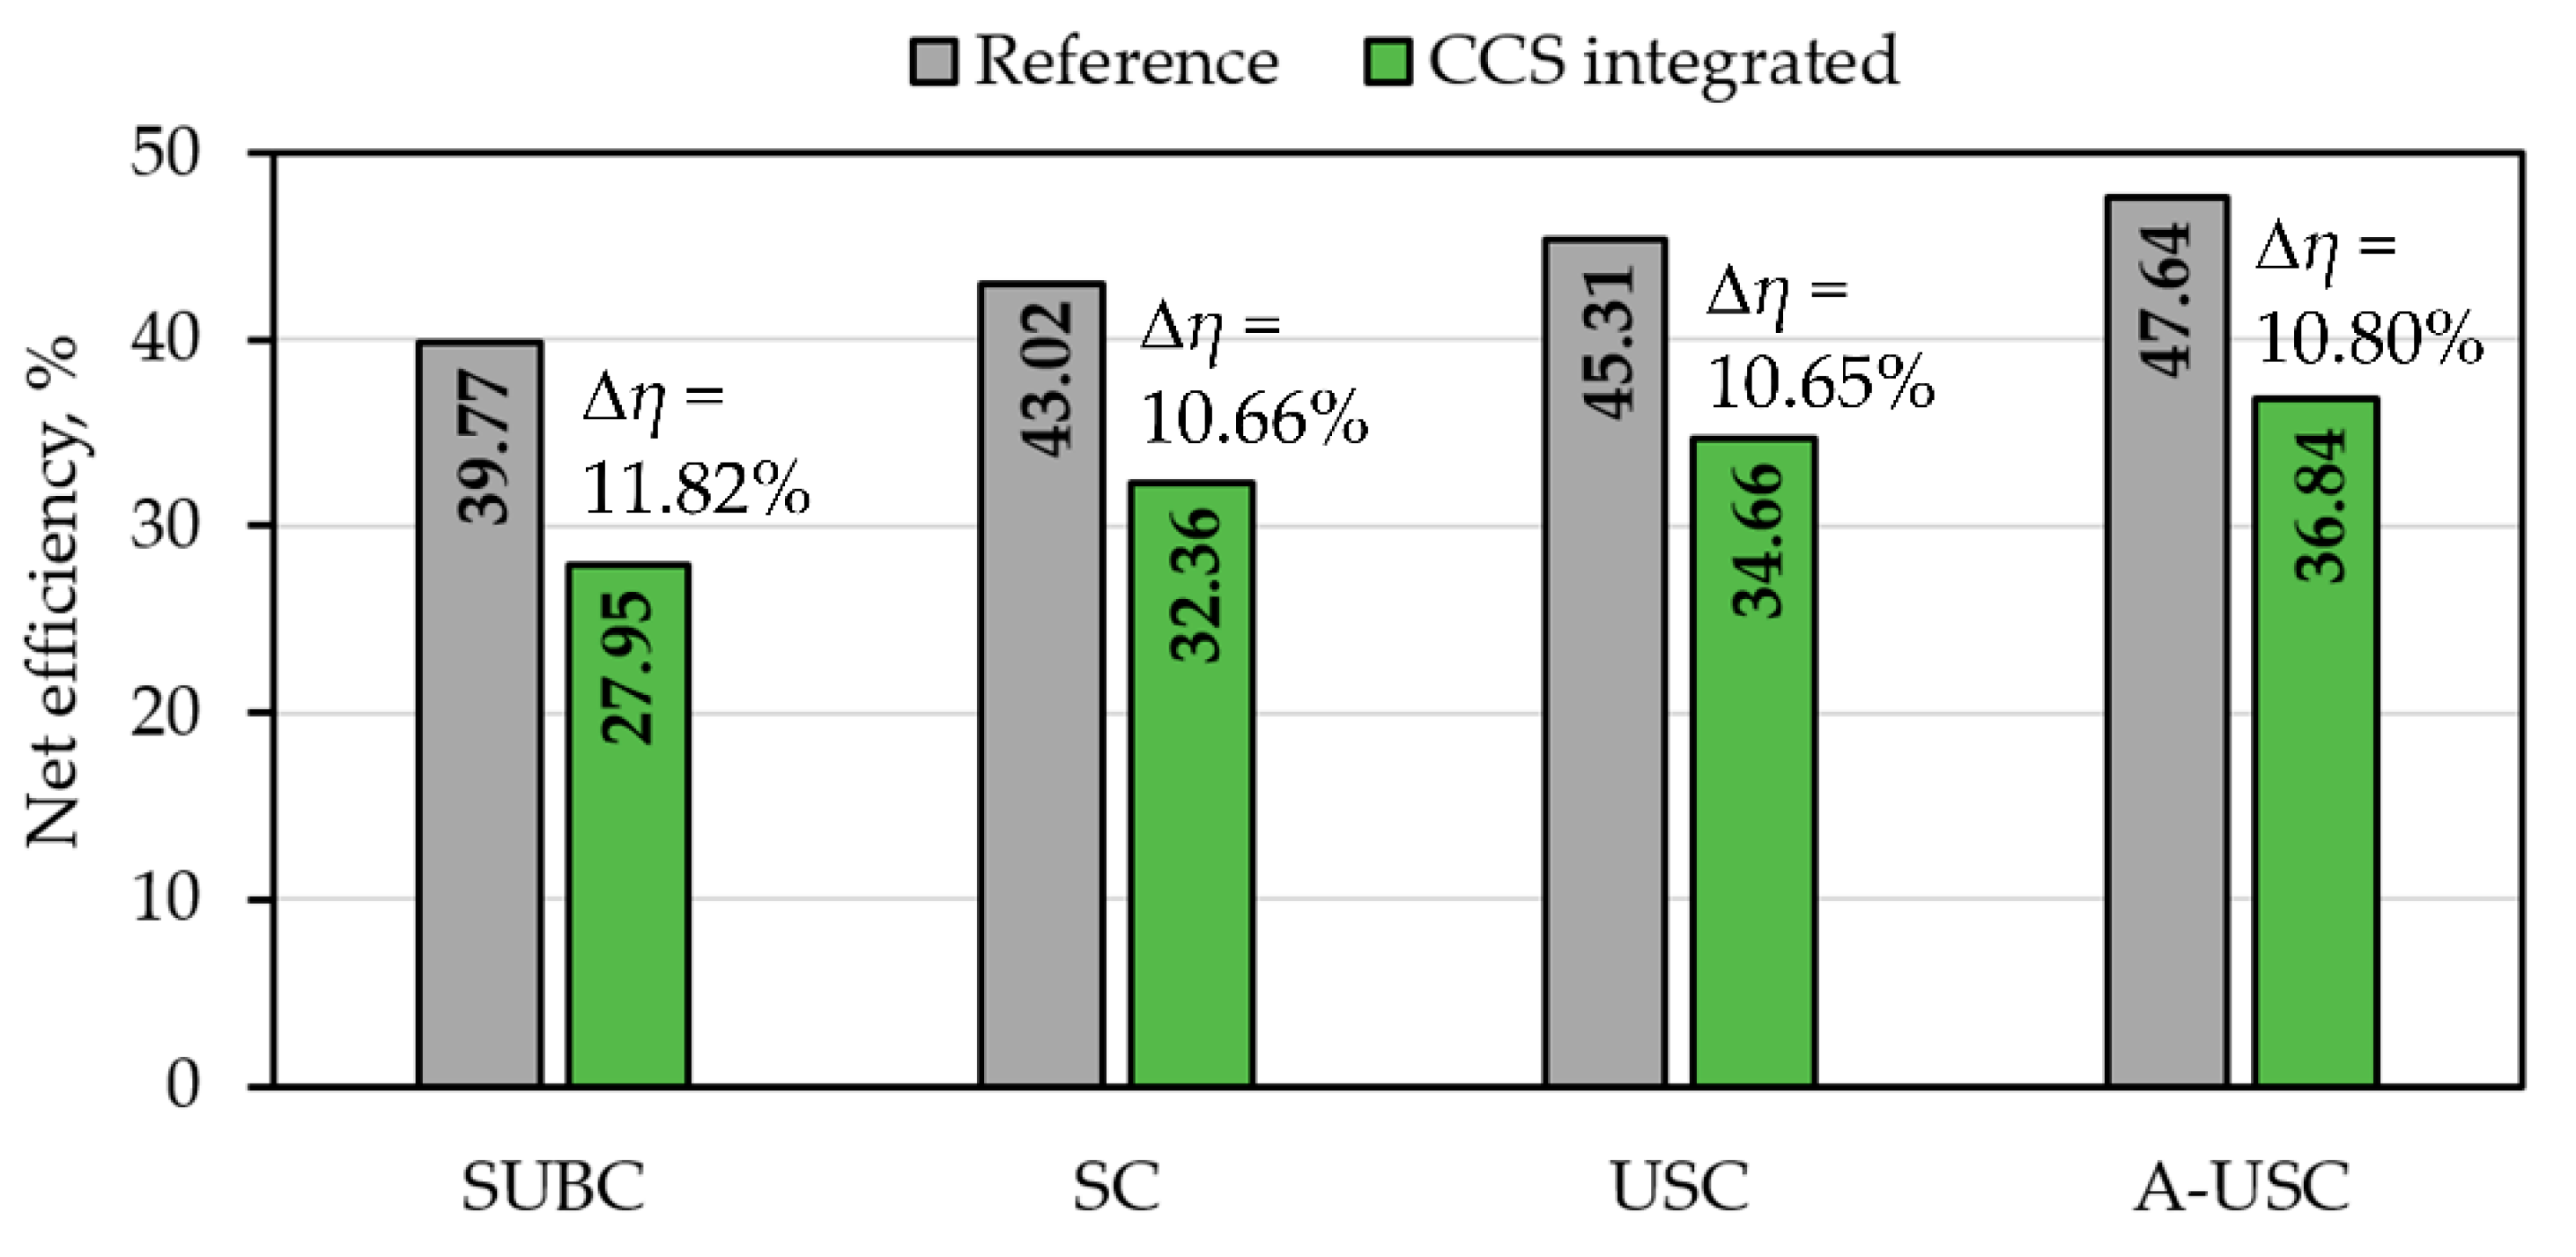
Subcritical power plants (SUBC) achieve thermal efficiency in the range between 34% and 40% (based on coal LHV) with the global average efficiency around 36%, whereas modern supercritical power plants (SC) reach efficiencies between 42% and 45% [5]. Ultra-supercritical power plants (USC) employ advanced metal alloys to withstand extreme steam conditions and achieve even higher efficiencies. A record-high net efficiency of 47.5% was achieved by the RDK Block 8 unit in Germany [6]. This is due to the elevated steam conditions: Superheat and reheat steam temperatures of 600/620 °C and steam pressures of up to 275 bar. Advanced ultra-supercritical power plants (A-USC) are expected to enter operation in the next decade and will approach 50% net electricity generation efficiency [7] with the use of advanced metal alloys capable of withstanding steam temperatures and pressures over 700 °C and 350 bar [8,9]. These advanced alloys (superalloys) are being developed by adding chromium (Cr), nickel (Ni), cobalt (Co), vanadium (V), wolfram (W), and molybdenum (Mo) to ferritic steels to obtain higher temperature- and corrosion-resistance [5,8].
Increased thermal efficiency leads to reduced emissions of greenhouse gases and pollutants. To put it into perspective, replacing an old conventional subcritical power plant with a new supercritical corresponds to a 10% efficiency gain and a CO2 emission reduction of more than 20%. For example, a conventional coal-fired power plant generates electricity at 36% thermal efficiency while having specific emissions of around 1000 kgCO2/MWhel. An USC unit with 46% thermal efficiency generates 28% (0.46/0.36 = 1.28) more electricity per unit of fuel heat input than the subcritical unit, whereas the emissions are 781 kgCO2/MWhel (1000/1.28 = 781), a 21.9% reduction. A-USC coal power plants could achieve even lower CO2 emissions, around 700 kg/MWh [10]. Further CO2 emission reductions, down to 100 kg/MWh, would be possible only with the implementation of post-combustion carbon capture and storage (CCS) for the treatment of flue gases released during fossil fuel combustion.
The Global Status of CCS 2020 [11] reports 26 commercial CCS facilities currently in operation with a total capture and storage capacity of 40.7 million tonnes of CO
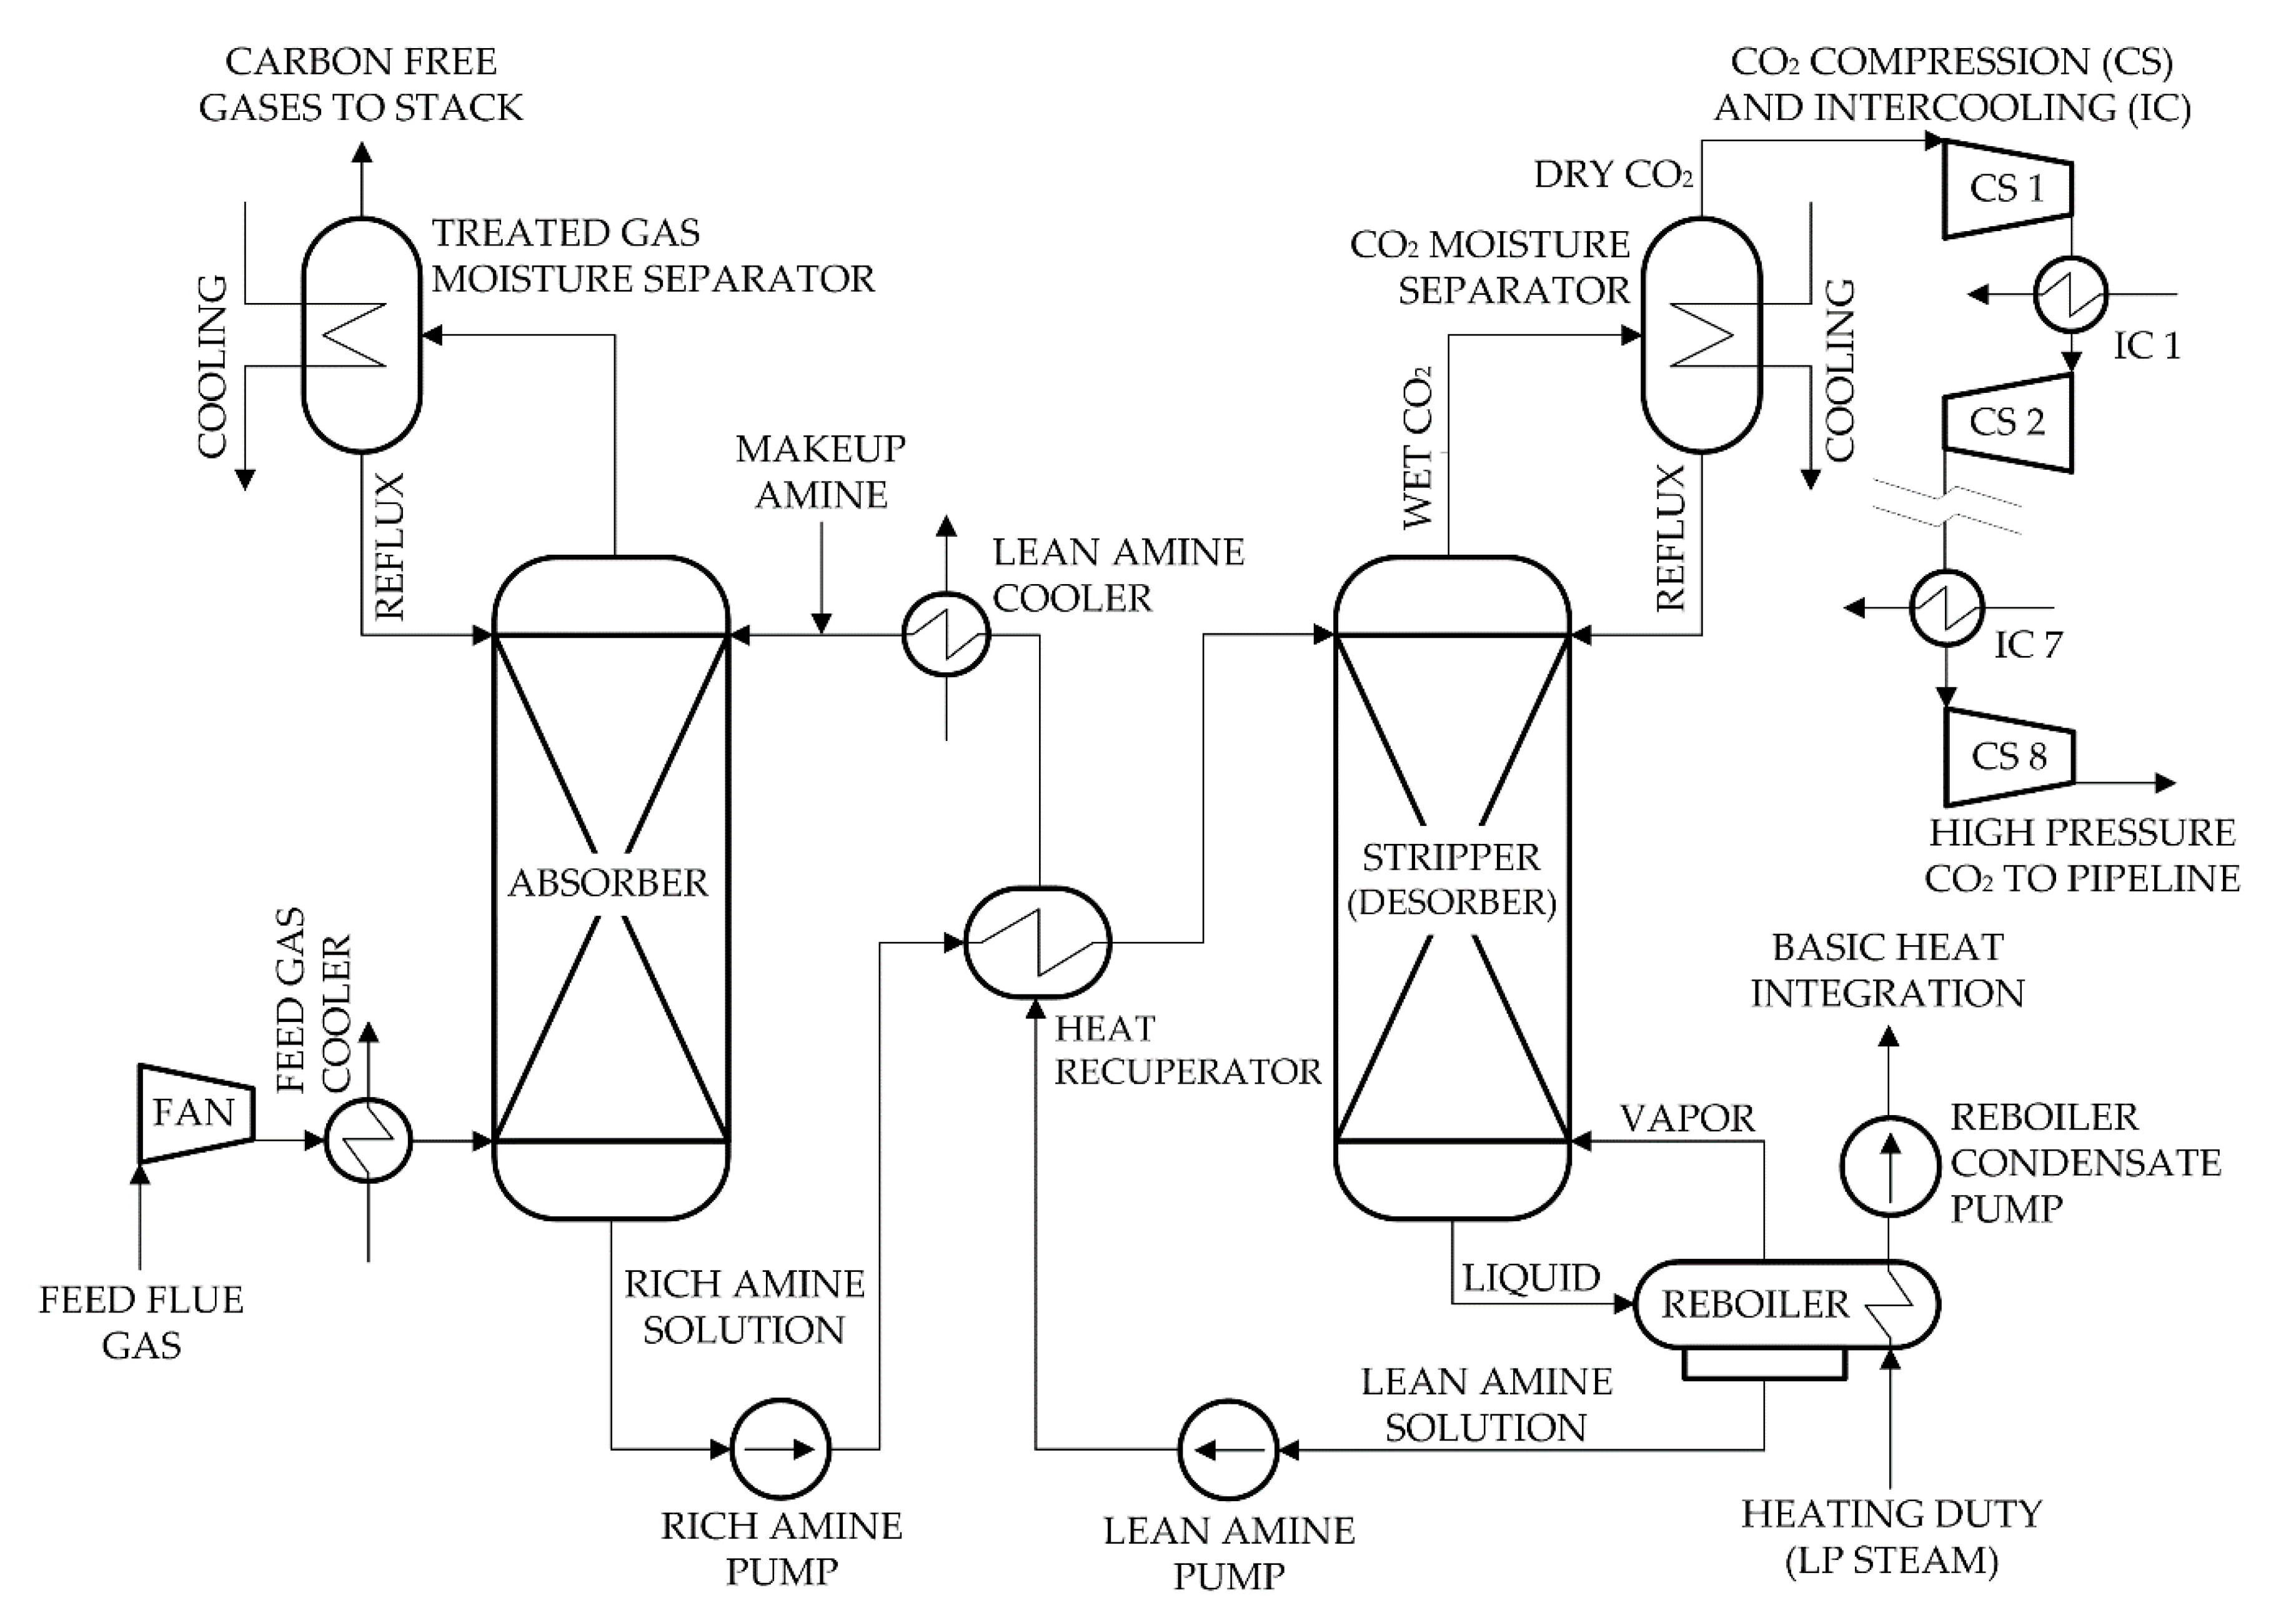
2 per year (Mtpa). CCS units are being used in the following industries: Natural gas processing (30.5 Mtpa), power generation (2.4 Mtpa), hydrogen production (2.2 Mtpa), fertilizer production (1.8 Mtpa), methanol and ethanol production (1.6 Mtpa), oil refining (1.4 Mtpa), iron and steel production (0.8 Mtpa). At present, two capture demonstration projects are up and running in the power generation sector: The Boundary Dam power plant and the Petra Nova power plant [12]. Both are using amine-based post-combustion capture, applied on one coal-fired unit each, and the captured carbon is transported via pipelines to enhanced oil recovery fields. Enhanced oil recovery (30.7 Mtpa) and storage in dedicated geological formations (10 Mtpa) are the two types of carbon storages used in these industries. By 2050, the CCS sector is envisioned to grow to a total global installed capacity of 5600 Mtpa of CO2 [11].
The estimated costs of CCS projects for fossil fuel power plants span over wide ranges of values, as reported in the relevant literature [13,14]. The costs of CCS depend on the fuel type, the costs of labor, materials, operation and maintenance, the carbon capture technology, the costs of transport and storage, and the type of project (greenfield or retrofit). The levelized cost of electricity (LCOE) is between 61 and 87 US$/MWh in power plants without CCS and between 94 and 163 US$/MWh for power plants with CCS [13,14]. The LCOE could be reduced to between 61 and 139 US$/MWh when the captured CO2 is sold to enhanced oil recovery projects instead of simply storing it in geological formations. The cost of captured CO2 is between 33 and 58 US$/tCO2, while the cost of avoided CO2 (including compression, transport, and storage) is between 44 and 86 US$/tCO2 [13,14]. Post-combustion CCS for combined cycle natural gas turbines (CCGT) or SCPC power plants with oxy-fuel combustion are predicted to operate with similar costs. Slightly higher costs were estimated for coal-based integrated gasification combined cycles (IGCC) with pre-combustion CCS [14]. The specific costs of CO2 transport are between 2 and 15 US$/tCO2, depending on the pipeline capacity, type (onshore or offshore), and length [14,15]. The specific costs of CO2 storage are estimated between 1 and 18 US$/tCO2, depending on the storage type (depleted oil/gas field, geological formation, or ocean storage) and the potential of using EOR credits. The worldwide CO2 storage capacity is 400 billion tonnes in discovered capacities in oil and gas fields (depleted or for EOR projects) and 12,000 billion tonnes in potential (estimated) storage capacities in geological (saline) formations [16]. The CO2 storage capacities are such that exceeds the global net-zero emission scenario. It is estimated that the CCS industry would be cost-effective with carbon prices between 40 and 80 US$/tCO2 [11].
CCS technology offers vast potentials for CO2 reduction in the power industry, in the cement, iron, and steel production industries, and in the oil, natural gas, and chemical processing industries [17]. Different countries are developing their own legal and technical frameworks for future large-scale CCS implementation. Lee et al. [18,19] stressed the importance of developing reliable methodologies for quantifying CO2 emission reduction through CCS at national basis. Nasirov et al. [20] analyzed decarbonization possibilities in developing countries and concluded that wind and solar energy are future of electricity generation, but still 15% of the electricity will be from coal by 2050. Kumar Shukla et al. [21] reviewed the clean coal potentials for the power industry in India. They concluded that post-combustion CCS is the solution for achieving a 30% CO2 emission reduction by 2030 in India. Yun et al. [22] analyzed four scenarios for the power industry in South Korea. They concluded that the CCS coal scenario offers a good perspective in terms of greenhouse gases emissions control and electricity prices. Markewitz et al. [23] studied the potential of CCS technology for the cement industry, which contributes 5% of the global CO2 emissions. They concluded that CCS can remove 70–90% of the CO2 emissions from the cement industry in Germany at avoidance costs between 77 and 115 EUR/tCO2. Toktarova et al. [24] analyzed different pathways for the decarbonization of the steel industry in Sweden. They showed that top gas recycling blast furnaces and electric arc furnaces fitted with CCS technology could reduce CO2 emissions by 83% in 2045. Adu et al. [25] studied the CO2 avoidance costs for post-combustion CCS technology integrated in coal-fired and natural gas combined cycle power plants. They concluded that, at 90% CO2 capture efficiency, the CO2 avoidance costs are $72/tCO2 for the coal-fired plant and $94/tCO2 for the natural gas combined cycle.
CCS is an energy-intensive technology affecting substantially the plant performance. In coal-fired power plants, previous studies have reported net efficiency losses in the range between 7 and 11%-pts [26,27,28] and electricity output penalties between 300 and 400 kWh/tCO2 [29]. Vu et al. [26] compared the techno-economical aspects of carbon capture on USC steam cycles with air-combustion and oxy-fuel combustion. They concluded that oxy-fuel CCS power plants offer an advantage over air-combustion CCS power plants. The net efficiency loss and levelized cost of electricity was 7%-pts and $59/MWh in the first case, whereas 10%-pts and $64/MWh in the second case. Liebenthal et al. [27] estimated the net efficiency loss at 10.94%-pts for a CCS retrofit project on a supercritical power plant achieving 45.5% net efficiency at the design point. Li and Liang [30] assessed a CCS retrofit project for an existing USC power plant with 1000 MW capacity and estimated the efficiency loss at 8.6%-pts for 90% capture rate and 6%-pts for a 50% capture rate. Xu et al. [31] estimated that modified boiler structures, waste heat recovery, and steam bleed turbines could be used to reduce the efficiency loss from 12.65% down to 8.79%-pts Jackson and Brodal [32] found that the efficiency loss can be reduced through the optimization of the CCS compression process. Compressor designs with multiple impellers per stage and variable pressure ratios are proposed.
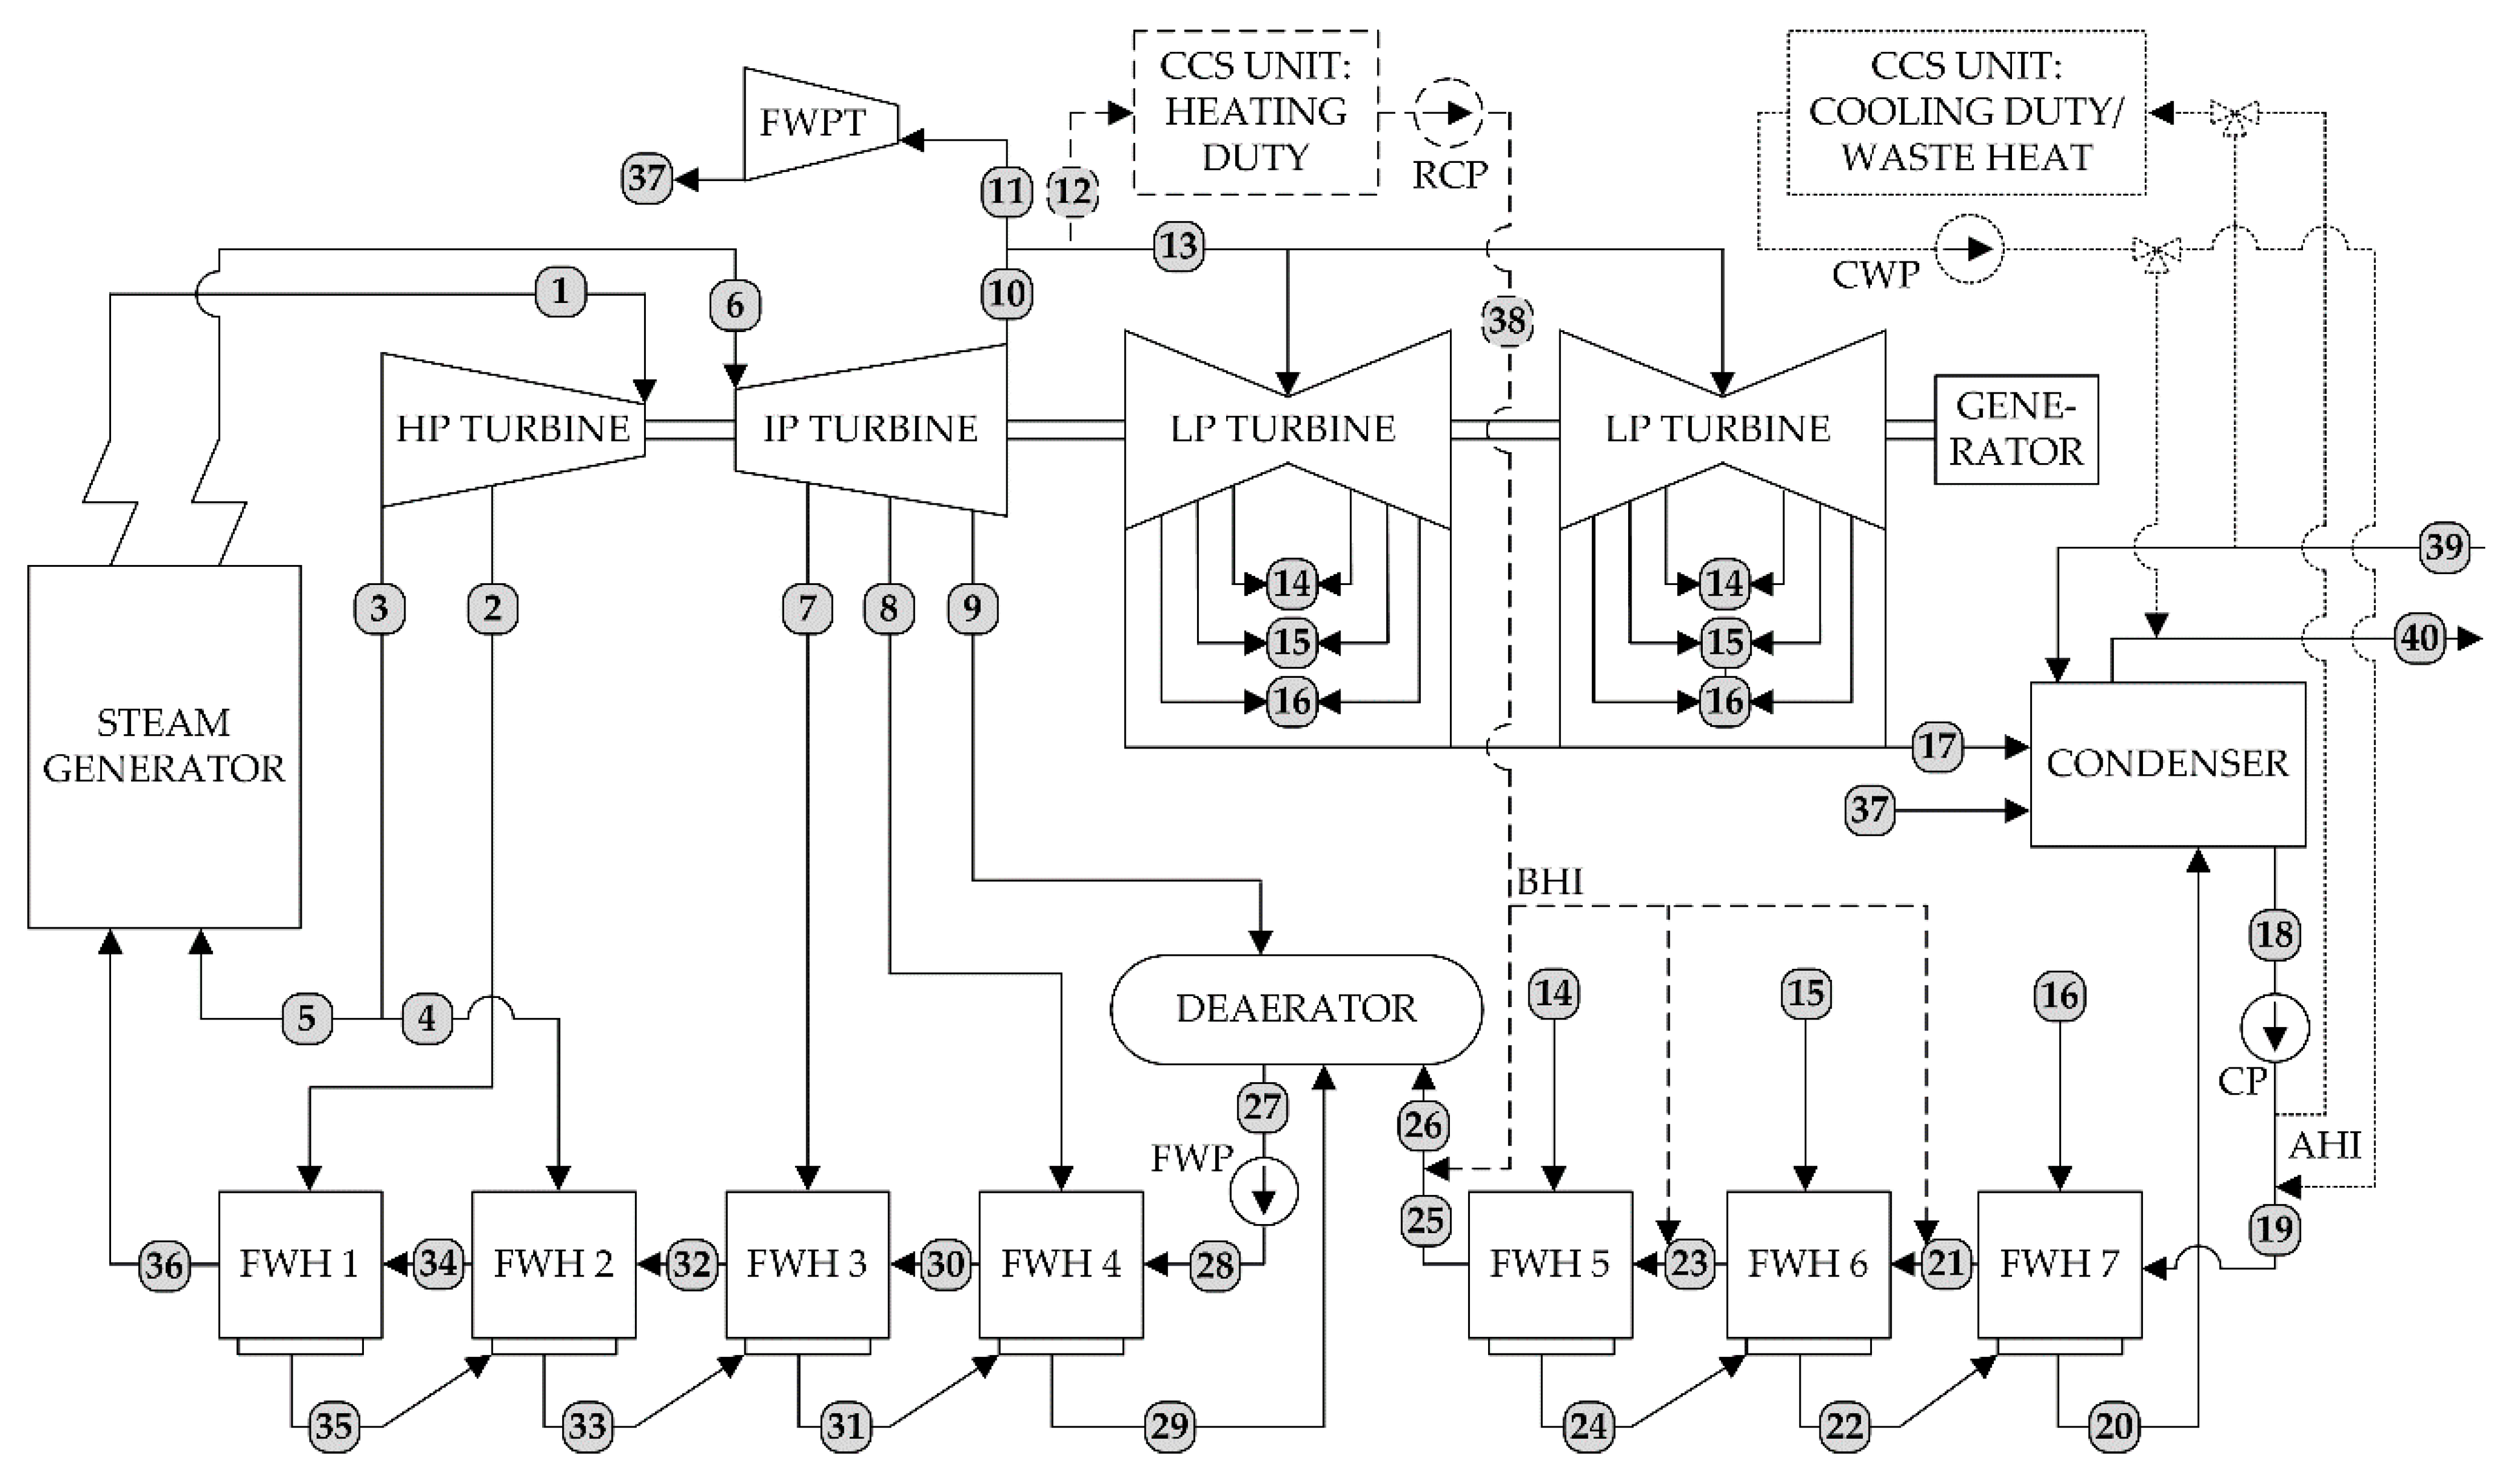
The previous research is mainly focused on the performance analysis of CCS retrofit projects for coal-fired power plants. The present study makes a step forward by assessing the impact of CCS technology on four different generations of coal-fired power plants including the subcritical (SUBC), the supercritical (SC), the ultra-supercritical (USC), and the advanced ultra-supercritical (A-USC) steam cycle using performance simulation analysis. The simulation approach consists of using appropriate mass and energy balance equations to the power plant components. The obtained results from the simulation code are validated against results found in the literature. Particular attention is given to the power plant-CCS interface quantities and their effects on the efficiency loss and electricity penalty. The performance of the A-USC power plant is assessed through the combined effects of reboiler heating duty and temperature, the compression and intercooling strategy, and the advanced heat integration. The analysis is concluded with the comparison between the performance of present-state and future upgraded CCS technology.

2. Methodology

2.1. The Reference Steam Cycle

In the present study, a coal-fired power plant with net electricity capacity of 700 MW is selected as the reference power plant without CCS. The analyzed steam cycle configuration comprises a single-stage reheat and eight feedwater heaters (FWH), as shown in Figure 1. Steam cycle configurations with double reheat and nine or more feedwater heaters are also possible. The double reheat steam cycle would increase the thermal efficiency by an additional 1% but at added capital and maintenance costs [33,34]. Four feedwater heaters (FWH 1–4) are placed at the high-pressure side while three feedwater heaters (FWH 5–7) and the deaerator are placed at the low-pressure side. The electricity generation unit includes a high-pressure (HP) turbine, an intermediate pressure (IP), two double-flow low pressure (LP) turbines and the electric generator. Superheated steam enters the HP turbine at state ① and expands to state ③. The cold reheat ⑤ is brought into the boiler reheat section and enters the IP turbine at state ⑥. In the IP turbine, steam expands to state ⑩ and is brought to the LP turbines where it expands to state ⑰. The steam quality in the exhaust state ⑰ is around 0.9 and depends on the reheat pressure in ⑥. The cycle thermal efficiency could be increased by raising the reheat pressure at the expense of lower steam qualities and accelerated erosion in the last stages of the LP turbines. In the present analysis, the reheat pressure is limited at one-fifth of the main steam pressure in order to avoid exhaust steam qualities below 0.88. In the condenser, the exhaust steam is turned into liquid water ⑱. The condensate pump (CP) sends water to the low pressure FWHs ⑲. In the three LP FWHs, the condensate water is subsequently heated to states ㉑, ㉓, and ㉕. The deaerator removes dissolved gases from the feedwater and feeds the feedwater pump (FWP). The FWP provides the necessary water head ㉘ while overcoming the pressure drops in the high-pressure FWHs and in the boiler. The FWP is driven by the feedwater pump turbine (FWPT) running on steam extraction ⑪. The exhaust steam from the FWPT ㉞ is sent to the condenser. The condenser pressure is 0.04 bar, corresponding to coolant inlet and outlet temperatures of 17 °C ㊴ and 25 °C ㊵. After the FWP, feedwater is preheated to states ㉚, ㉜, ㉞, and ㊱ as it passes the four HP FWHs. The FWHs are shell-and-tubes heat exchangers where feedwater is heated by extracted steam ②, ④, ⑦, ⑧, ⑨, ⑭, ⑮, and ⑯. The deaerator is a direct-contact heat exchanger where feedwater ㉖ is heated by the extracted steam ⑨ and the subcooled condensate ㉙.
The steam cycle performance is analyzed through four generations of coal-fired power plants. Each next generation represents an improvement over the previous one in terms of efficiency and CO2 emissions. The first steam cycle corresponds to a subcritical power plant (SUBC) with superheat/reheat steam temperatures of 540/540 °C and preheat/reheat steam pressures of 170/35 bar. The second cycle refers to a supercritical power plant (SC) with steam temperatures of 580/580 °C and pressures of 250/50 bar. The third cycle is a modern ultra-supercritical power plant (USC) with increased steam temperatures 600/610 °C and pressures 300/60 bar. The fourth steam cycle corresponds to the future planned advanced ultra-supercritical power plant (A-USC) with even higher steam temperatures 700/720 °C and pressures 350/75 bar. The SC, USC, and A-USC power plants operate with an IP/LP crossover pressure of 4 bar, a planned design feature, representing the CO2 capture-readiness of these steam cycles. The SUBC power plant operates at a higher IP/LP crossover pressure of 7.5 bar, which still offers the possibility of CCS retrofit. The four steam cycles use the same condenser pressure of 0.04 bar and utilize the same type of coal. The basic steam conditions are given in Table 1 and the coal composition is reported in Table 2.
The turbine isentropic efficiency, including inlet valve losses, is 0.90 for HP turbine, 0.94 for IP turbine, and 0.885 for LP turbine [33]. The FWP efficiency is 0.85 and the CP efficiency is 0.80 [35]. The pressure drop in the steam generator is 50 bar for main steam and 5 bar for reheat steam [33]. The pressure drop in steam pipes is 0.03, expressed as a fraction of inlet steam pressure. The outlet temperature of the subcooled liquid condensate is 5 K above the feedwater inlet temperature [36]. The feedwater outlet temperature is 2 K below the steam saturation temperature. The drive power to feedwater and condensate pumps is supplied by a feedwater pump turbine (FWPT) running on steam bled from the IP/LP crossover. The efficiency of the steam generator is 0.949 based on fuel LHV. The electric generator efficiency is 0.988 and the mechanical efficiency is 0.99 [34]. The net efficiency of the analyzed steam cycle configuration is maximized by optimizing the quantity and pressure of the nine steam extractions. A general approach is to distribute the feedwater heating range into equivalent enthalpy increments among the FWHs [36,37]. Water and steam properties are calculated using the IAPWS-IF97 standard built in the CoolProp database.

2.2. The CCS Integrated Steam Cycle

The post-combustion CCS unit is fitted into the flue gas line along with the other treatment units (electro-static precipitator, DeNOx and DeSOx). Flue gases are directed into the absorber column, where the cold solvent forms a rich solution by absorbing CO2. The carbon-free flue gases are discharged into the atmosphere through the stack. Before solvent regeneration in the stripper, the rich solution is preheated in the lean/rich solution heat recuperator. Inside the stripper, the rich solution is separated into lean solution and wet CO2. The lean solution is sent back to the absorber through the heat recuperator. On the other side, moisture is removed from CO2 in the moisture separator (overhead condenser) and dry CO2 is compressed in an 8-stage compression process (CS 1–CS 8). Between compression stages, CO2 temperature is decreased in water cooled intercoolers (IC 1–IC 7). High-pressure CO2 is fed into the pipeline and transported to permanent storage, enhanced oil recovery, or industrial use. The heating demand needed in the solvent reboiler is supplied by low-pressure steam extracted from the IP/LP crossover pipe ⑨. The schematic diagram of the amine-based CCS unit is shown in Figure 2. The present study does not perform a detailed chemistry simulation of the CO2 absorption process, rather it studies how the CCS unit affects the performance of the coal-fired power plant. To this end, a wide range of interface quantities between the CCS unit and the steam cycle was assumed, reflecting different types of CO2 absorbents and CCS processes. Specifically, the reboiler heating duty necessary for solvent regeneration is assumed in the range between 1.5 and 5.0 MJth/kgCO2 [38]. The cooling duty, which encompasses the cooling demands for moisture separation, feed gases cooling, lean amine cooling, and CO2 compression intercooling, is assumed between 2.3 and 6.3 MJth/kgCO2 [29]. The auxiliary power duty needed for the operation of cooling water pumps, flue gases fans, and solvent pumps is assumed between 0.07 and 0.21 MJel/kgCO2 [27]. The above CCS energy requirements correspond to absorber temperatures between 30 and 50 °C and absorber pressures of around 1 bar [38], stripper (desorber) temperatures between 80 and 160 °C and stripper pressures between 1 and 10 bar, [27], L/G (liquid-to-gas ratio) ratios between 2 and 6 kg/kg [38], lean solution loading between 0.05 and 0.3 mol/mol, and rich solution loading between 0.3 and 0.6 mol/mol [39]. The exact CCS operation parameters cannot be determined without running a full chemistry simulation of the CCS unit, which is beyond the scope of the present study.
The CCS unit greatly affects the performance and the efficiency of the power plant. Carbon capture-ready steam cycles (SC, USC, and A-USC) employ an IP/LP pressure of 4 bar, matching reboiler temperatures of 120–140 °C. On the other hand, the CCS retrofitted SUBC steam cycle uses throttles and pressure-maintaining valves to control the steam condition in the IP/LP crossover, which leads to increased electricity penalties [35]. CO2 compression is the second largest energy consumer in the CCS unit with power demands of 0.30–0.35 MJel/kgCO2 [38]. Because steam is extracted from the main cycle, the condenser thermal load reduces but the overall thermal discharge increases since heat is removed both from the CO2 capture process and from CO2 compression. For example, in a state-of-the-art CCS unit with 30 wt% monoethanolamine (MEA), the heating duty is 3.5 MJth/kgCO2, the cooling duty is 4.6 MJth/kgCO2, and the auxiliary power duty for cooling water pumps, solvent pumps, and gas blowers is 0.15 MJel/kgCO2 (CO2 compression excluded), estimated from correlations in [27].
Basic heat reintegration (BHI: Dashed lines in Figure 1) is achieved by returning the reboiler condensate ㊳ into the LP feedwater preheating line respecting the temperature level. The exact injection point depends on the temperature in the reboiler. For the analyzed steam cycle configuration, there are three possible injection points: (1) Between FWH5 and deaerator for reboiler temperatures higher than 130 °C, (2) between FWH5 and FWH6 for reboiler temperatures in the range between 100 °C and 130 °C, and (3) between FWH6 and FWH7 for reboiler temperatures below 100 °C. Advanced heat integration (AHI: dotted lines in Figure 1) consists of redirecting the LP condensate towards CO2 intercoolers and the overhead condenser to recycle the low temperature waste heat available in the CCS unit. When the LP feedwater preheating line cannot allocate the entire quantity of waste heat, the cooling system removes the excessive waste heat from the CCS unit.

2.3. Thermal Efficiency and Electricity Output Penalty

The principal input parameters for steam cycle calculations are the net electric power Nel,net,ref of the reference steam cycle (700 MW), the steam conditions in Table 1, and the coal composition in Table 2. The gross electric power Nel,gross,ref is obtained adding auxiliary power consumption Nel,aux,ref to the net electric power. In the present study, the auxiliary power is estimated at 35 MW, that is 5% of net electric power (700 MW). The auxiliary power consumers are primary air and combustion air fans, cooling tower fans, mill grinders, flue gases fans, flue gas treatment (desulfurization, electrostatic precipitators, DeNOx treatment), condensate pumps, circulating water pumps, water treatment, and ash handling. The FWP is not accounted in the auxiliary power duty since it is turbine-driven and provided for by a separate steam extraction from the IP/LP crossover (Figure 1.)
N el , gross , ref = N el , net , ref + N el , aux , ref
The live steam mass flow rate is determined from the gross electric power and the mechanical work of the HP, IP, and LP turbines, augmented by mechanical (ηm) and generator (ηg) losses
m ˙ steam = N el , gross , ref η g η m i ( 1 j ε j ) ( h i 1 h i )
The live steam mass flow rate m ˙ steam is subsequently reduced by the steam extractions εj. Note that the steam cycle configuration shown in Figure 1 contains a total of 10 possible steam extractions, including the FWPT extraction (ε11) and the CCS extraction (ε12). The CCS extraction is ε12 = 0 in the reference steam cycle and ε12 > 0 in the CCS integrated steam cycle. The enthalpy difference (hi–1hi) refers to the actual enthalpy drop obtained as the product of the isentropic enthalpy drop and the turbine isentropic efficiency. The fuel heat input (LHV) is determined from superheat and reheat duties, and taking into account the steam generator efficiency ηsg
Q ˙ fuel , LHV = Q ˙ superheat + Q ˙ reheat η sg = m ˙ steam ( h 1 h 36 ) + m ˙ steam ( 1 ε 2 ε 4 ) ( h 6 h 5 ) η sg  
The reference power plant gross efficiency ηgross,ref is obtained dividing the gross electric power by the LHV-based fuel heat input Q ˙ fuel,LHV
η gross , ref = N el , gross , ref Q ˙ fuel , LHV
The net efficiency ηnet,ref is obtained dividing the net electric power (1) by the fuel heat input (3)
η net , ref = N el , net , ref Q ˙ fuel , LHV
The gross electric output in the CCS integrated steam cycle Nel,gross,CCS is reduced due to the steam extraction supplying the thermal duty to the CCS unit.
N el , gross , CCS = N el , gross , ref Δ N el , gross
The power loss factor σ is the ratio between the gross electric power loss ΔNel,gross and the extracted steam heat flow Q ˙ steam,CCS
σ = Δ N el , gross Q ˙ steam , CCS  
The gross efficiency ηgross,CCS of the CCS integrated power plant is then
η gross , CCS = N el , gross , CCS Q ˙ fuel , LHV
The net electric output of the CCS integrated power plant Nel,net,CCS is obtained from its gross electric output reduced by the auxiliary power consumption of the reference steam cycle and the auxiliary power consumption in the CCS unit
N el , net , CCS = N el , gross , CCS N el , aux , ref N el , aux , CCS
The CCS auxiliary power comprises the CO2 compression power duty and the parasitic power consumption for CO2 capture, in cooling water pumps, solvent pumps, and flue gases fan
N el , aux , CCS = m ˙ CO 2 i = 1 8 h i h i 1 η comp + m ˙ CO 2 w el , CCS
The captured CO2 mass flow rate m ˙ CO2 is obtained assuming a CO2 capture rate of 0.9 in the absorber. The CO2 compression efficiency is ηcomp = 0.80. An eight-stage compression with intercooling between stages and a final CO2 pressure of 150 bar are assumed as the baseline compression scenario. The specific parasitic consumption of the other electric consumers is assumed wel,CCS = 0.15 MJel/kgCO2. The CCS-integrated power plant net thermal efficiency ηnet,CCS is defined as the ratio between the net electric power in the CCS power plant and the LHV-based fuel heat input
η net , CCS = N el , net , CCS Q ˙ fuel , LHV
The efficiency penalty caused by the CCS unit to the coal-fired power plant is determined as
Δ η net = η net , ref η net , CCS
The electricity output penalty (EOP) of the CCS integrated power plant is a measure of performance loss caused from the CCS unit. It is calculated as ratio of the net electricity power loss and the mass flow rate of captured and compressed CO2.
EOP = N el , net , ref N el , net , CCS m ˙ CO 2

2.4. Thermodynamic Calculations

The thermodynamic analysis of the coal-fired power plant integrated with CCS technology was carried out using a simulation code written in the programming language Visual Basic for Applications (VBA), version 7.1, whereas the host application is MS Excel. The fluid physical properties are obtained from the CoolProp wrapper (subroutine) functions available for MS Excel. The steam cycle components—the steam generator, the turbines, the condenser, the feedwater heaters (FWH 1–FWH 7), the deaerator, the feedwater pump (FWP), the condensate pump (CP), the feedwater pump turbine (FWPT), and the basic (BHI) and the advanced (AHI) heat integrations are modelled using the control volume approach. Each control volume is described with the appropriate mass and energy conservation equations and neglecting heat losses towards the surrounding. The mass relations equate the sum of inlet streams mass rates to the sum of outlet streams mass rates. The energy relations equate the sum of inlet streams total enthalpies to the sum of outlet streams total enthalpies, taking into account the added or the extracted heat rates ( Q ˙ ) and the added or the extracted work rates (W) in the observed control volumes. Table 3 lists the mass and energy conservation equations for all the component in the steam cycle. The systems of mass and energy conservation equations can be solved once the steam cycle input parameters are defined. The steam cycle input parameters comprise the steam superheat pressure and temperature, the steam reheat pressure and temperature, the condenser pressure, and the IP/LP crossover pressure, with the values reported in Table 1. The input parameters enable to calculate the steam superheat enthalpy (h1), the reheat steam enthalpy (h6), the steam enthalpies in the IP/LP crossover (h10 = h11 = h12 = h13), and the enthalpy of liquid water from the condenser (h18). The live steam mass flow rate ( m ˙ 1 ) is obtained from equation (2), taking that the net electric capacity of the reference steam cycle is 700 MW and assuming steady-state operation. The steam extraction enthalpies (h2, h3, h7, h8, h9, h14, h15, and h16) are calculated assuming equally distributed enthalpy increments in the FWHs, a strategy yielding maximum thermal efficiency in steam cycles [36,37]. The steam extraction ratios (ε2, ε3, ε7, ε8, ε9, ε14, ε15, and ε16), are obtained as the ratios between the extracted steam mass rates ( m ˙ 2 , m ˙ 3 , m ˙ 7 , m ˙ 8 , m ˙ 9 , m ˙ 14 , m ˙ 15 , and m ˙ 16 ) and the live steam mass rate ( m ˙ 1 ), using mass and energy relations for FWH 1–7 and the deaerator.

3. Results and Discussion

3.1. Steam Cycle Validation

The calculated net efficiency in the reference steam cycle is compared against results found in the literature. Table 4 reports the steam cycle type and the basic steam input parameters: Superheat and reheat temperatures (S/R T) and pressures (S/R P). The studies referenced in Table 4 use different inputs for the same parameters: Turbine efficiency, generator efficiency, boiler efficiency, approach temperatures, mechanical losses, steam pressure drops, auxiliary power consumption, and other, all affecting the final net efficiency results. The validation is carried out by taking into account all the available input values found in the referenced studies and assuming those not provided. For example, steam cycles #1, #2, and #3 are ultra-supercritical (USC) steam cycles with similar steam conditions. However, the range of the reported net efficiencies is larger than 3.7 percentage points. This is because of different input values for the same steam cycle parameters and, especially, because of different approaches to auxiliary power consumption. Specifically, steam cycles #1 and #3 assume an auxiliary power consumption of 5–6% while steam cycle #2 completely neglects it. Aiming for a fair validation, the present study includes auxiliary power consumption in all the steam cycles, except when validating against steam cycle #2. Overall, the present methodology for steam cycle calculations provides reliable results and is applied for further analysis.

3.2. The Reference Steam Cycle

The steam cycle configuration in Figure 1 is analyzed for four different steam cycle conditions. This section presents a detailed analysis of the reference A-USC cycle with the most advanced steam parameters, corresponding to future planned coal-fired power plants. The temperature-entropy chart of the reference A-USC steam cycle is shown in Figure 3. The main feature of supercritical steam cycles (SC, USC, and A-USC) is steam superheat occurring above the saturation curves and the critical point of water (㊱ → ①). Only in the case of a subcritical steam cycle (SUBC), the process ㊱ → ① enters the phase change dome, under the CP. The chart in Figure 3 uses bold lines for the main steam cycle processes, dashed lines for steam extractions, and dotted lines for saturation curves. A total of eight extractions supplying steam to the deaerator and FWHs are shown in Figure 3. Extraction ⑪ supplies steam from the IP/LP crossover to the FWPT. It is at the same state that steam would be extracted ⑫ in case of a CCS integrated steam cycle. The characteristic points in Figure 3 follows the labels given by the scheme in Figure 1. For the A-USC steam cycle, the turbines generate a gross useful work of 751.5 MW: HP turbine 219.2 MW, IP turbine 342.3 MW, and LP turbines 190.0 MW. The power plant gross electric power is 735 MW while the net electric power transmitted to the grid is 700 MW, at full load. The fuel heat input 1469.5 MW, which returns a gross electric efficiency of 50.02% and a net electric efficiency of 47.64%.
Table 5 reports the A-USC steam cycle data in terms of steam mass flow rate ( m ˙ ), temperature (T), and pressure (p) in the characteristic points. Table 6 shows the results in the four reference steam cycles obtained using the steam conditions reported in Table 1 and the input parameters discussed in Section 2.1. The results show that supercritical power plants (SC, USC, A-USC) achieve increased thermal efficiency with lower CO2 emissions when compared to subcritical power plants (SUBC). The net efficiency difference between the SUBC and the A-USC steam cycle is slightly less than 8 percentage points while CO2 emissions are reduced by 16.5%. Still, the A-USC power plant emits around 700 kg/MWhel of CO2 per unit of generated electricity, which converts into 3.4 million tonnes of CO2 for 7000 full-load hours per year.

3.3. The CCS Integrated Steam Cycle

Even though the volume fraction of CO2 in flue gases is only 14.4%, post-combustion capture can be successfully applied to remove the majority of it. Table 7 reports the most relevant results in the four CCS integrated steam cycles. The fuel heat input, the live steam, and flue gases mass flow rates are unaffected by the CCS and can be read from Table 6. The results in Table 7 are obtained using baseline CCS duties of 3.5 MJth/kgCO2 for heating (30 wt% MEA solution), 4.6 MJth/kgCO2 for cooling, 0.35 MJ/kgCO2 for an eight-stage CO2 compression with seven intercoolers, and an additional 0.15 MJel/kgCO2 for auxiliary power consumption for CO2 capture, solvent pumps, and cooling water pumps. Basic heat integration is taken into account while advanced heat integration is disregarded.
Overall, the power plant performance is largely affected by the CCS unit. The net efficiency losses are 11.82, 10.66, 10.65, and 10.80%-pts in the respective SUBC, SC, USC, and A-USC power plants, as shown in Figure 4. The power loss factor (7) arising from IP/LP steam extraction suggests that between 22.5% and 29.0% of the steam heat flow is converted into lost electricity generation. The highest overall electricity output penalty (EOP) is seen in the SUBC power plant (397.0 kWh/tCO2), mainly because of the higher steam pressure in the IP/LP crossover extraction. The lowest EOPs are achieved in the SC and USC steam cycles (357.9 and 357.7 kWh/tCO2) while the A-USC has a slightly larger EOP (362.3 kWh/tCO2). This can be explained by the reduced fuel consumption in the A-USC and the relative increase in the ratio between net electricity loss and captured CO2 rate (13). The reduced fuel consumption in the A-USC causes a reduced mass flow rate of captured CO2 along with lower auxiliary power consumption for CO2 compression. Consequently, the highest net electric power is obtained in the A-USC CCS steam cycle.
The assumed CO2 removal rate of 90% yields specific CO2 emissions between 69.5 and 83.2 kg/MWhel in the respective A-USC and SUBC steam cycles. It should be noted that these numbers represent direct CO2 emissions from coal combustion in CCS coal plants. Indirect CO2 emissions, arising from coal mining and transport as well as from the power plant construction and operation, can contribute 30% or more in total emissions [43]. Lifecycle CO2 emissions for coal CCS power plants, including direct and indirect sources, are estimated between 103 and 129 kgCO2/MWhel [44].

3.4. Factors Affecting the Electricity Penalty

3.4.1. Reboiler Heating Duty

The dominant factor affecting the electricity penalty is the reboiler heating duty for absorbent regeneration. Amine absorbents such as monoethanolamine (MEA) and methyldiethanolamine (MDEA) are considered mature technologies, commercially available for scrubbing of dilute CO2 from flue gases. MEA has high CO2 absorption rates but at the expense of large heating duties (3.1–4.2 MJth/kgCO2), caused by high enthalpies of reaction with CO2. MDEA solutions offer lower heating demands but at the drawback of reduced CO2 absorption rates. Amine solutions blended with CO2 absorption promoters [45] and non-amine absorbents are being studied to alleviate the electricity penalty in CCS integrated power plants. Aqueous ammonia (NH3), aqueous piperazine (PZ), potassium carbonate (K2CO3), and mixed-salt technology (MST) are potential alternatives with heat requirements as low as 2.0 MJth/kgCO2 [46] that could be deployed for large-scale CCS in the future.
Figure 5 shows the net efficiency loss and the electricity output penalty (EOP) in the A-USC steam cycle with respect to the specific heating duty, the reboiler temperature, and for different absorbent solutions. The reboiler heating duty determines the steam quantity while the reboiler temperature defines the steam quality to be extracted from the IP/LP crossover pipe [38]. The reboiler temperature dictates the steam condensation pressure in the reboiler and the pressure of the steam extraction from the IP/LP crossover. Generally, it can be seen that the net efficiency penalty increases with the reboiler heating duty and the reboiler temperature, which, on the other hand, depend on the absorbent type and process optimizations.
The reference 30 wt% MEA absorbent has a specific heating duty in the range between 3.2–4.5 MJth/kgCO2 at reboiler temperature of 110–130 °C [38]. The resulting net efficiency loss is between 9.73 and 13.40%-pts and EOPs between 326.6 and 449.8 kWh/tCO2. Piperazine activated absorbents (PZAA) offer higher CO2 absorption rates than MEA, with heating demands between 2.5–3.5 MJth/kgCO2 and reboiler temperatures of 110–140 °C [45,47,48]. This leads to reduced net efficiency losses, between 8.42 and 11.72%-pts, and EOPs between 282.6 and 393.4 kWh/tCO2. Chilled ammonia process (CAP) operates with duties between 2.2 and 2.8 MJth/kgCO2 [49] and reboiler temperatures of 100–150 °C [50], resulting in efficiency losses between 7.55 and 10.51%-pts and EOPs in the range of 253.4–352.8 kWh/tCO2. Further reduction in the net efficiency loss is possible with absorbent having even lower reboiler duties. For example, mixed-salt technology (MST) at demonstration scale achieves reboiler heating duties of 1.8–2.5 MJth/kgCO2 with reboiler temperatures of 110–140 °C. The net efficiency loss from MST absorption process would then be between 7.84 and 8.98%-pts and EOPs between 263.2 and 301.4 kWh/tCO2. MST offers additional gains in the compression power since CO2 pressures of 2–10 bar are attainable at the stripper outlet [46]. Overall, the reboiler heating duty is a huge burden to electricity generation in the CCS integrated A-USC coal-fired power plant. Even the lowest of heating duties, 2.0 MJth/kgCO2, causes efficiency losses of around 8%-pts and EOPs of 270 kWh/tCO2. On the other hand, these penalties come along with the benefit of large CO2 emission reductions.

3.4.2. Compression Power Duty

The CO2 compression power duty is the second most-important factor determining the electricity penalty of the CCS integrated power plant. All the results so far were obtained for a baseline CO2 compression scenario including eight-stage compression, constant pressure ratio and efficiency of 0.80 in all compressors, a total pressure rise from 1 bar at the inlet to 150 bar at the outlet, seven intercoolers with a pressure drop of 0.2 bar each, and cooling CO2 down to 30 °C between stages. The following analysis is carried out assuming the baseline CCS heating duty of 3.5 MJth/kgCO2 (30 wt% MEA) and an additional auxiliary power of 0.15 MJel/kgCO2, compression excluded.
The baseline CO2 compression, shown in Figure 6a, returns a specific auxiliary consumption of 0.345 MJel/kgCO2, whereas the theoretical minimum (isothermal compression) is 0.296 MJel/kgCO2. By selecting fewer intermediate cooling stages, the compression duty increases since the compression process departs from an optimum isothermal compression. For example, the same eight-stage compression process with three intercooling stages would need 0.386 MJel/kgCO2, an increase of 12% with respect to the baseline case, as shown in Figure 6b.
The impact of the number of intercooling stages as well as the effect of the CO2 inlet pressure on the compression power consumption is shown in Figure 7. For an eight-stage compression process, three or less intercooling return with prohibitively high efficiency losses and excessive CO2 discharge temperatures (217 °C, Figure 6b). At four intercooling stages the maximum discharge temperature is 160 °C and, relatively to the baseline case with seven intercoolers, the net efficiency losses are 0.18, 0.17, 0.16, and 0.14%-pts for inlet pressures of 1, 2, 5, and 10 bar, respectively. Additional intercooling stages bring less and less efficiency gains, whereas the difference between six and seven stages is less than 0.05%-pts for all inlet pressures. The CO2 inlet pressure depends on the solution conditions in the desorber. Generally, CO2 inlet pressures between 1 and 2 bar are attainable with MEA solutions. Just a small increment in the inlet pressure shows substantial benefits, a reduction of 18% in the compression power duty is achieved between inlet pressures of 1 bar and 2 bar. This converts into a net efficiency gain of around 0.50%-pts for four to seven intercooling stages. The efficiency gains decrease for higher inlet pressures, the efficiency gain is 1.20%-pts between 1 bar and 5 bar, and 1.70%-pts between 1 bar and 10 bar. This is expected since compression power duty contributes with 28% in the total efficiency loss of the CCS integrated A-USC power plant.

3.4.3. Advanced Heat Integration

Advanced heat integration (AHI) can be used to further reduce the CCS penalty. This includes preheating the LP condensate using low-temperature waste heat from CO2 intercoolers and from the desorber overhead condenser. The amount of waste heat that can be integrated in the LP feedwater preheating line depends on the quantity (CCS heating duty) and quality (reboiler temperature) of waste heat as well as on the feedwater temperatures in the LP preheating line. The amount of integrable waste heat is limited by the maximum temperature in the LP preheating line. Assuming that the HP and IP steam extractions are unaffected by the CCS unit, this maximum temperature would be the temperature at the feedwater tank inlet (136.2 °C, point ㉖ in Table 5.).
The net efficiency gain and the electricity output gain (EOG) in the analyzed CCS A-USC steam cycle is shown in Figure 8 against the reboiler heating duty and the reboiler temperature. It can be seen that AHI offers higher efficiency gains at low reboiler heating duties and high reboiler temperatures. For a given reboiler temperature, the net efficiency gain increases by reducing the reboiler heating duty. In addition, for a given reboiler heating duty, the net efficiency gain increases with the reboiler temperature, but with some exceptions. When the waste heat temperature and the waste heat quantity are such that the feedwater tank inlet temperature is reached, additional waste heat cannot be allocated into the LP feedwater preheating line. This means that the entire LP feedwater preheating range is supplied by waste heat, the LP FWHs are bypassed, and the LP steam extractions are closed. From this point onwards, the AHI efficiency gain drops abruptly since steam is extracted from the IP/LP crossover, but waste heat is not returned into the LP preheating line. As shown in Figure 8, the maximum LP feedwater temperature is achieved for: (1) Reboiler temperature of 140 °C and specific heating duty of 4.14 MJth/kgCO2 and (2) for reboiler temperature of 160 °C and specific heating duty of 2.69 MJth/kgCO2. AHI applied on the A-USC steam cycle configuration bring an efficiency gain of 0.53%-pts for CO2 absorption with 30 wt% MEA solution (3.50 MJth/kgCO2, 120 °C). In that case, the corresponding electricity output gain is 17.8 kWh/tCO2.

3.5. Future Outlook

The levels of contributing factors in the net efficiency loss and electricity output penalty of the A-USC power plant are shown in Figure 9. Present state levels are calculated for a specific heating duty of 3.5 MJth/kgCO2, a cooling duty of 4.6 MJth/kgCO2, a compression duty of 0.35 MJel/kgCO2, and an auxiliary duty of 0.15 MJel/kgCO2. The resulting net efficiency loss is 10.80%-pts and the EOP is 362.3 kWhel/tCO2. Steam extraction is found to contribute with 6.7%-pts, CO2 compression power contributes with 2.8%-pts, and CCS auxiliary power adds 1.3%-pts to the total efficiency loss.
The levels for future prospect are obtained assuming an average 30% reduction in CCS energy requirements relative to present day technology. The reduced heating and cooling energy duties of 2.5 MJth/kgCO2 and 3.4 MJth/kgCO2 could be achieved with enhanced CO2 absorbents, CCS process optimization, and advanced heat integration (AHI). The reduced power duties of 0.25 MJel/kgCO2 for compression and 0.11 MJel/kgCO2 for auxiliaries could be achieved with higher CO2 inlet pressures (3 bar) and highly efficient compressors. The net efficiency loss of future CCS is estimated at 7.20%-pts, an improvement of 3.6%-pts over present day available technology. The EOP would be reduced to 241.7 kWhel//tCO2, down by one-third relatively to the present EOP.
All this suggests that future planned CCS integrated A-USC power plants could operate above 40% net efficiency with direct CO2 emissions as low as 70 kg/MWhel, whereas the same units without CCS are expected to achieve 47.6% net efficiency but 10 times the amount of CO2 emissions. Present-day fossil fuel power plants without CCS are marked by high CO2 emission per unit of generated electricity: Between 877 and 1130 kgCO2/MWhel for coal and between 422 and 548 kgCO2/MWhel for natural gas. On the other hand, coal CCS would achieve CO2 emissions in the range between 103 and 129 kg/MWh, including direct and indirect emissions [44]. Natural gas CCGT power plants would achieve even lower CO2 emissions than coal, between 69 and 84 kg/MWh as reported in [44]. However, carbon emissions from coal CCS and natural gas CCS power plants would still be higher than CO2 emissions from renewable energy sources. Large hydropower and nuclear power generate electricity with CO2 emissions of 3–7 kg/MWh and 8–45 kg/MWh, respectively [51]. Solar PV and solar CSP generate electricity with emissions in the range between 29 and 80 kg/MWhel, and between 14 and 32 kg/MWh, respectively. Wind power generates electricity with lifecycle CO2 emission between 8 and 20 kg/MWh while geothermal energy has emission levels between 20 and 57 kg/MWh [51].

4. Conclusions

Advanced ultra-supercritical coal-fired power plants are expected to enter operation in the next decade. These steam cycles will use advanced steel alloys and highly efficient steam generators and turbines to generate electricity from steam conditions in excess of 700 °C and 350 bar. The estimated thermal efficiency of future planned A-USC units is 50% gross and 47.6% net. Relatively to subcritical units, the net efficiency of A-USC is 8%-pts higher while CO2 emissions are 16.5% lower. However, CO2 emissions per unit of generated electricity would still be around 700 kgCO2/MWhel.
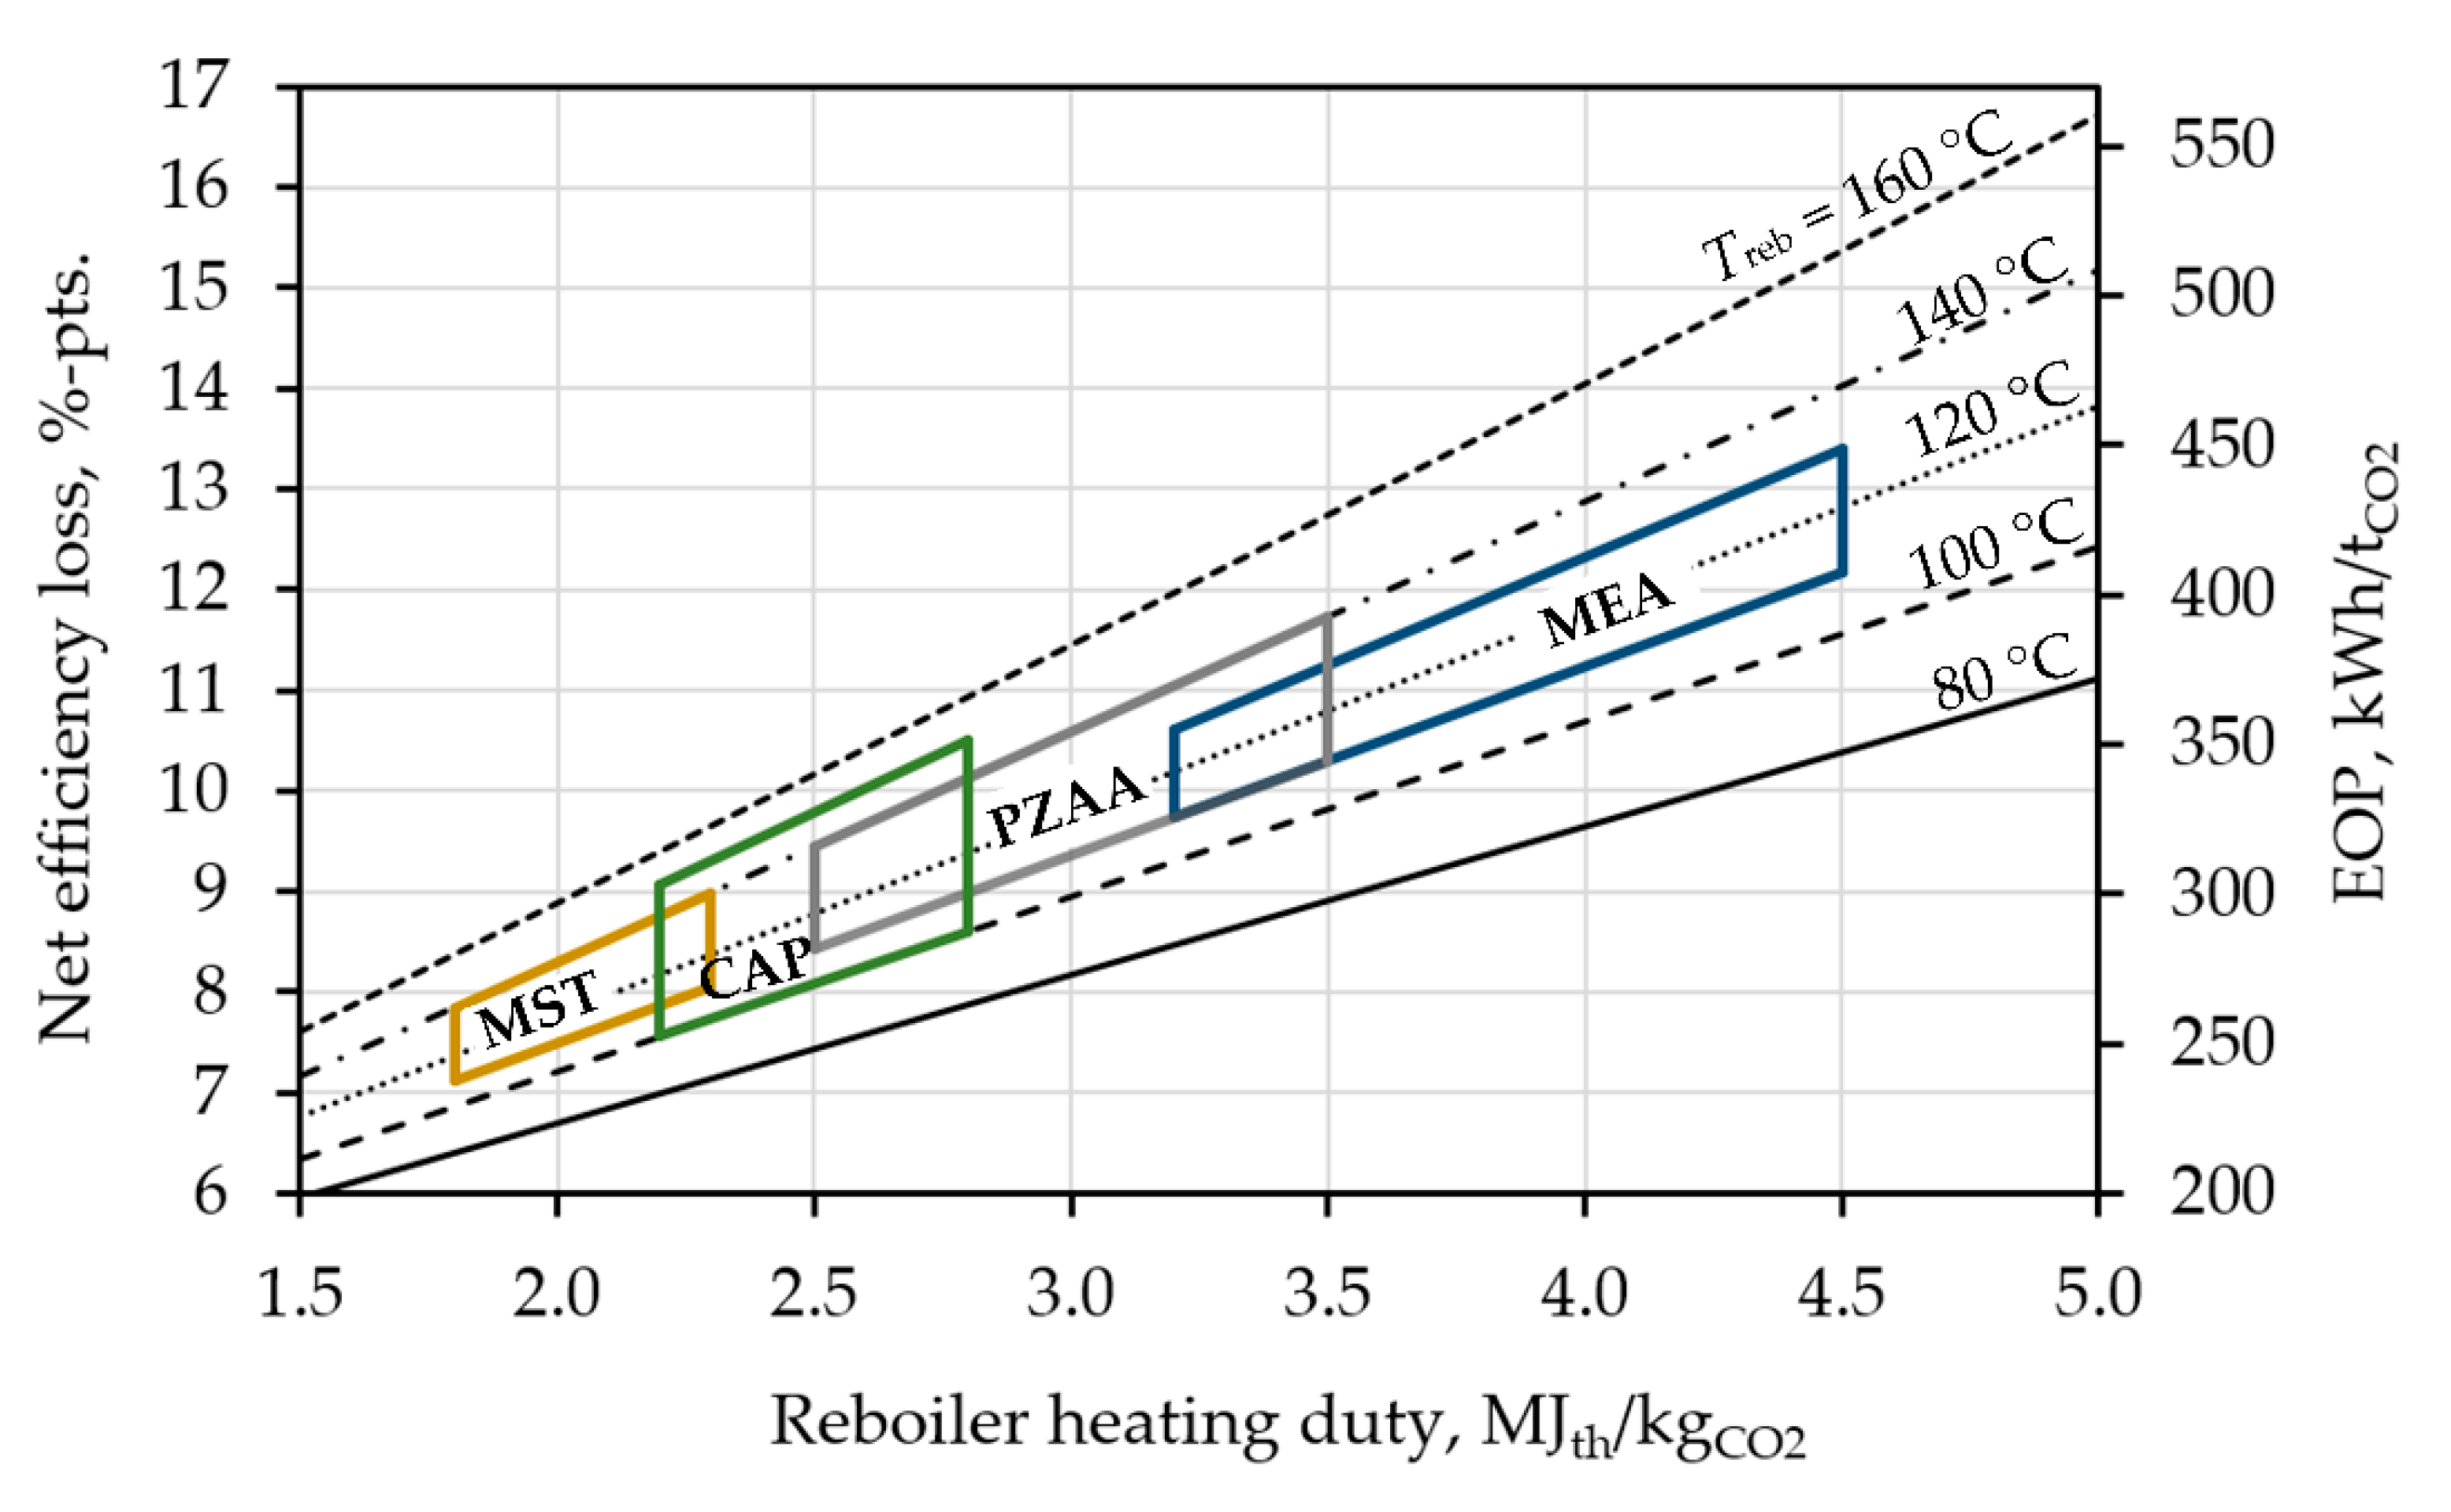
Post-combustion CO2 capture and storage can be successfully integrated into A-USC power plants to reduce CO2 emissions by 90% or more, down to 70 kgCO2/MWhel. However, the power plant performance and electricity output are largely affected by the energy requirements in CCS units. The present study analyzed the interface factors between the CCS unit the power plant affecting the A-USC steam cycle efficiency. Calculations have shown that CO2 absorption by 30 wt% MEA solution result with net efficiency losses in the range between 9.7 and 13.4%-pts depending on the reboiler heating duty and temperature. MEA based blends, piperazine activated absorbents, chilled ammonia, and mixed salts could be used instead to reduce the efficiency losses down 7.8–11.7%-pts.
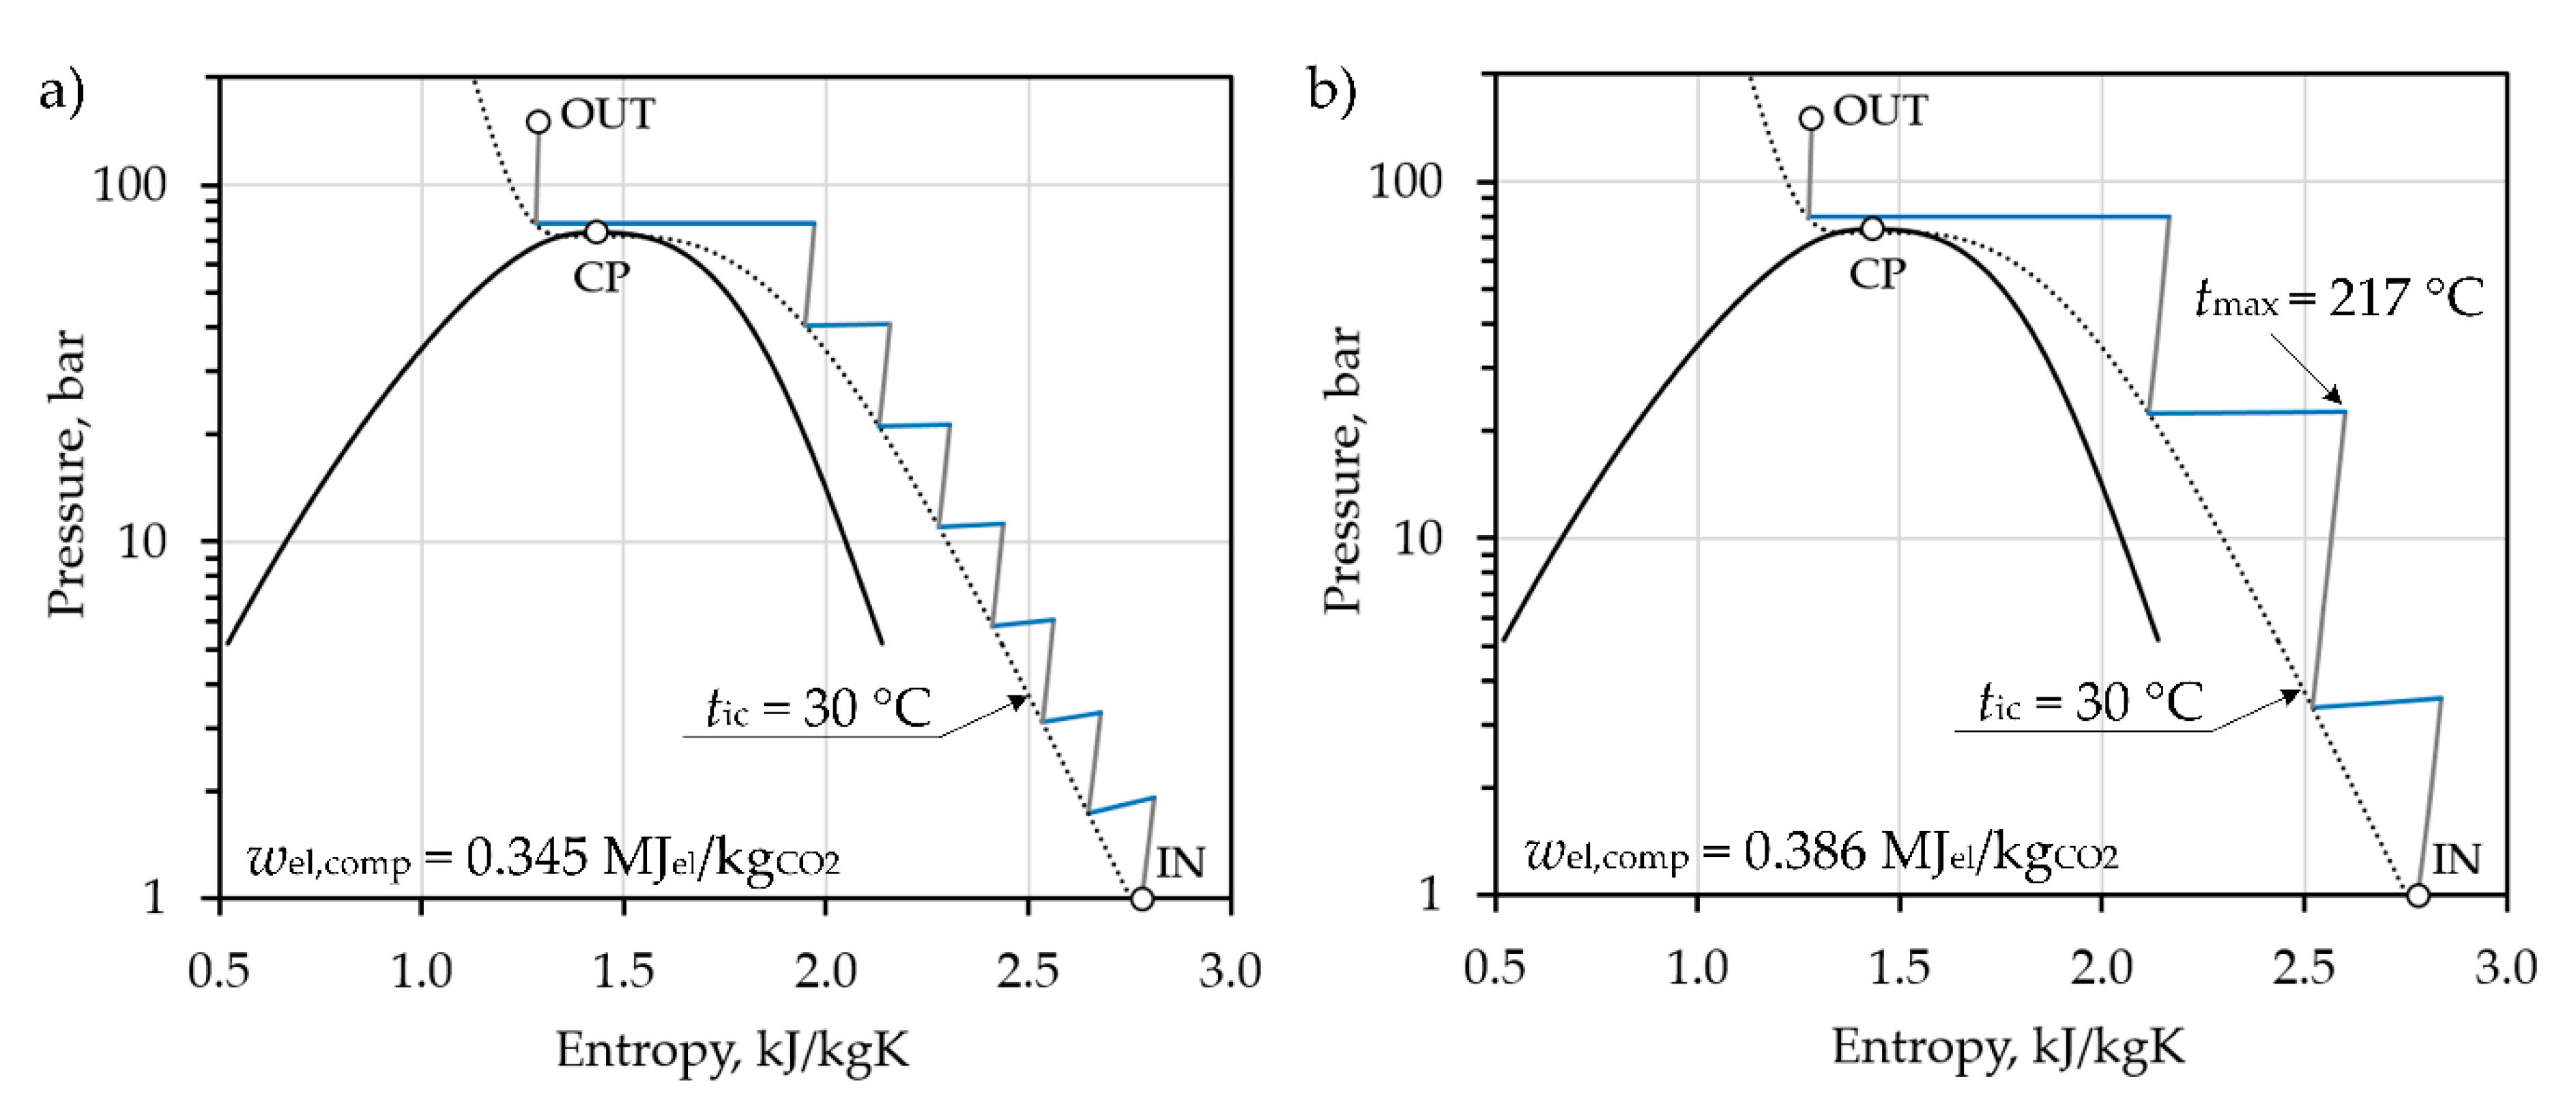
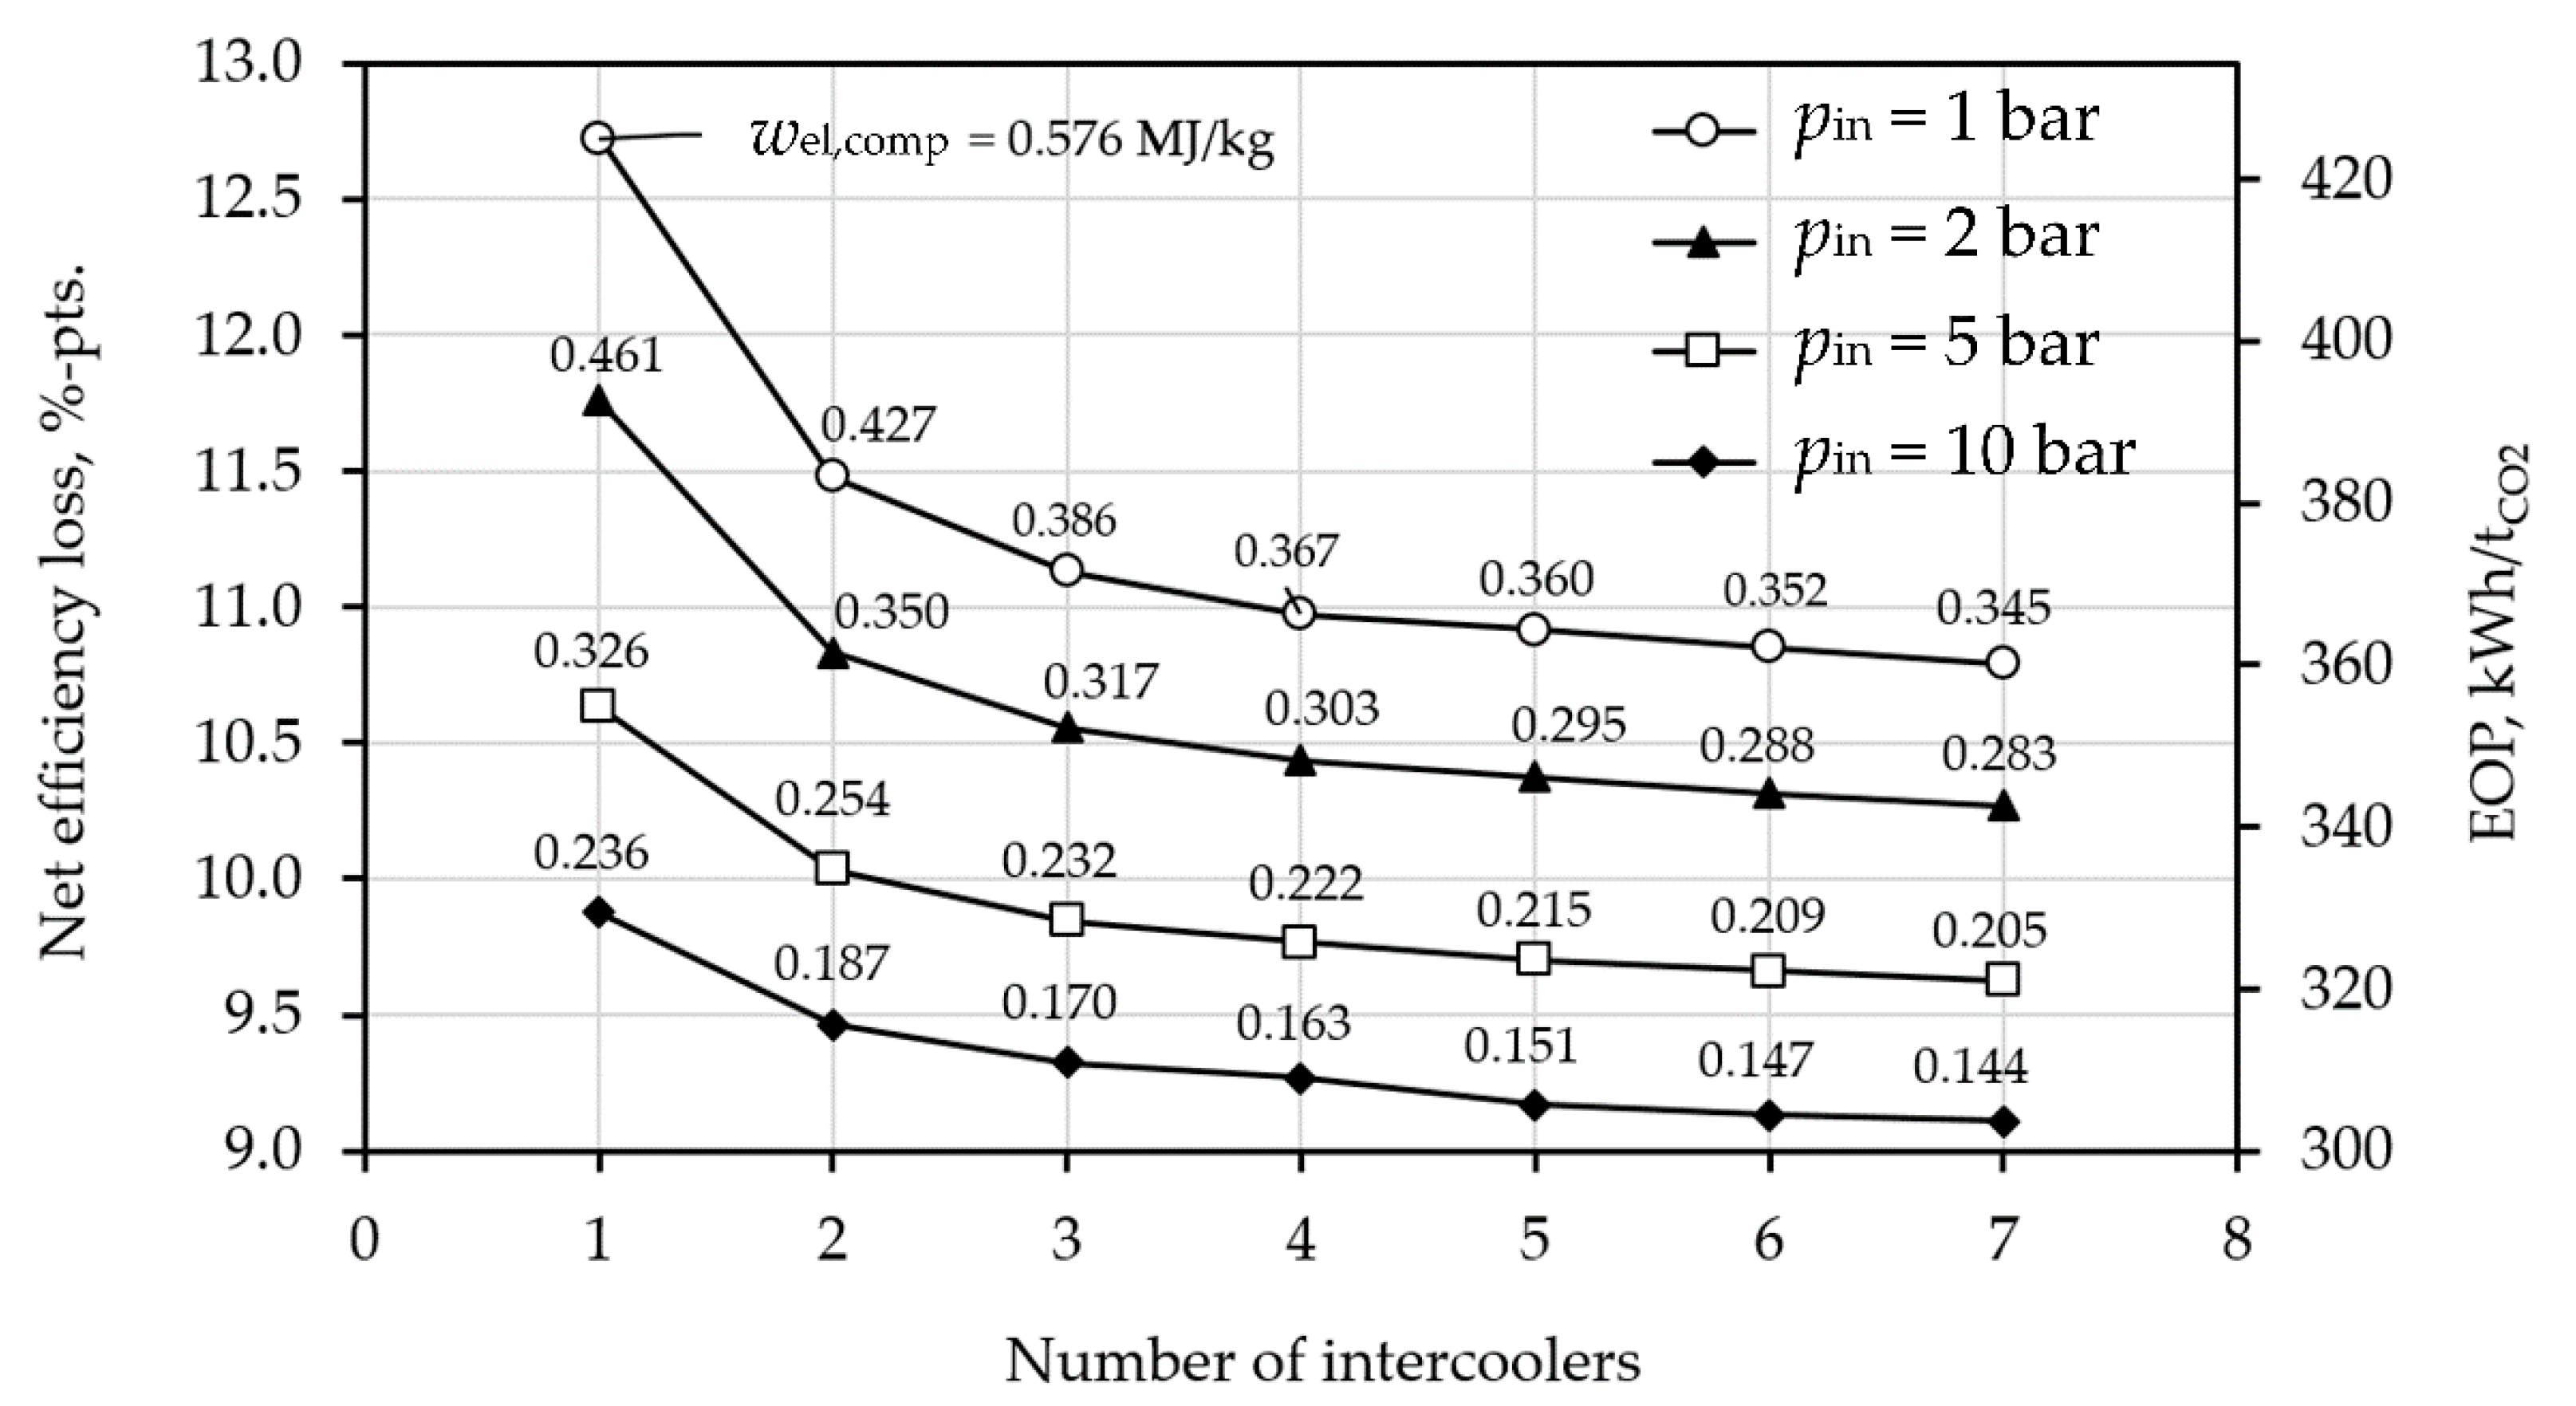
The influence of number of intercooling stages and CO2 inlet pressures were analyzed next. For an eight-stage compression process, seven intercooling stages reduce the net efficiency loss by 0.14–0.18%-pts relatively to four stages. The CO2 pressure at the compression inlet has an even stronger influence. Between inlet pressures of 1 and 2 bar there is a net efficiency gain of 0.5%-pts while between inlet pressures of 1 and 5 bar the net efficiency gain is 1.2%-pts.
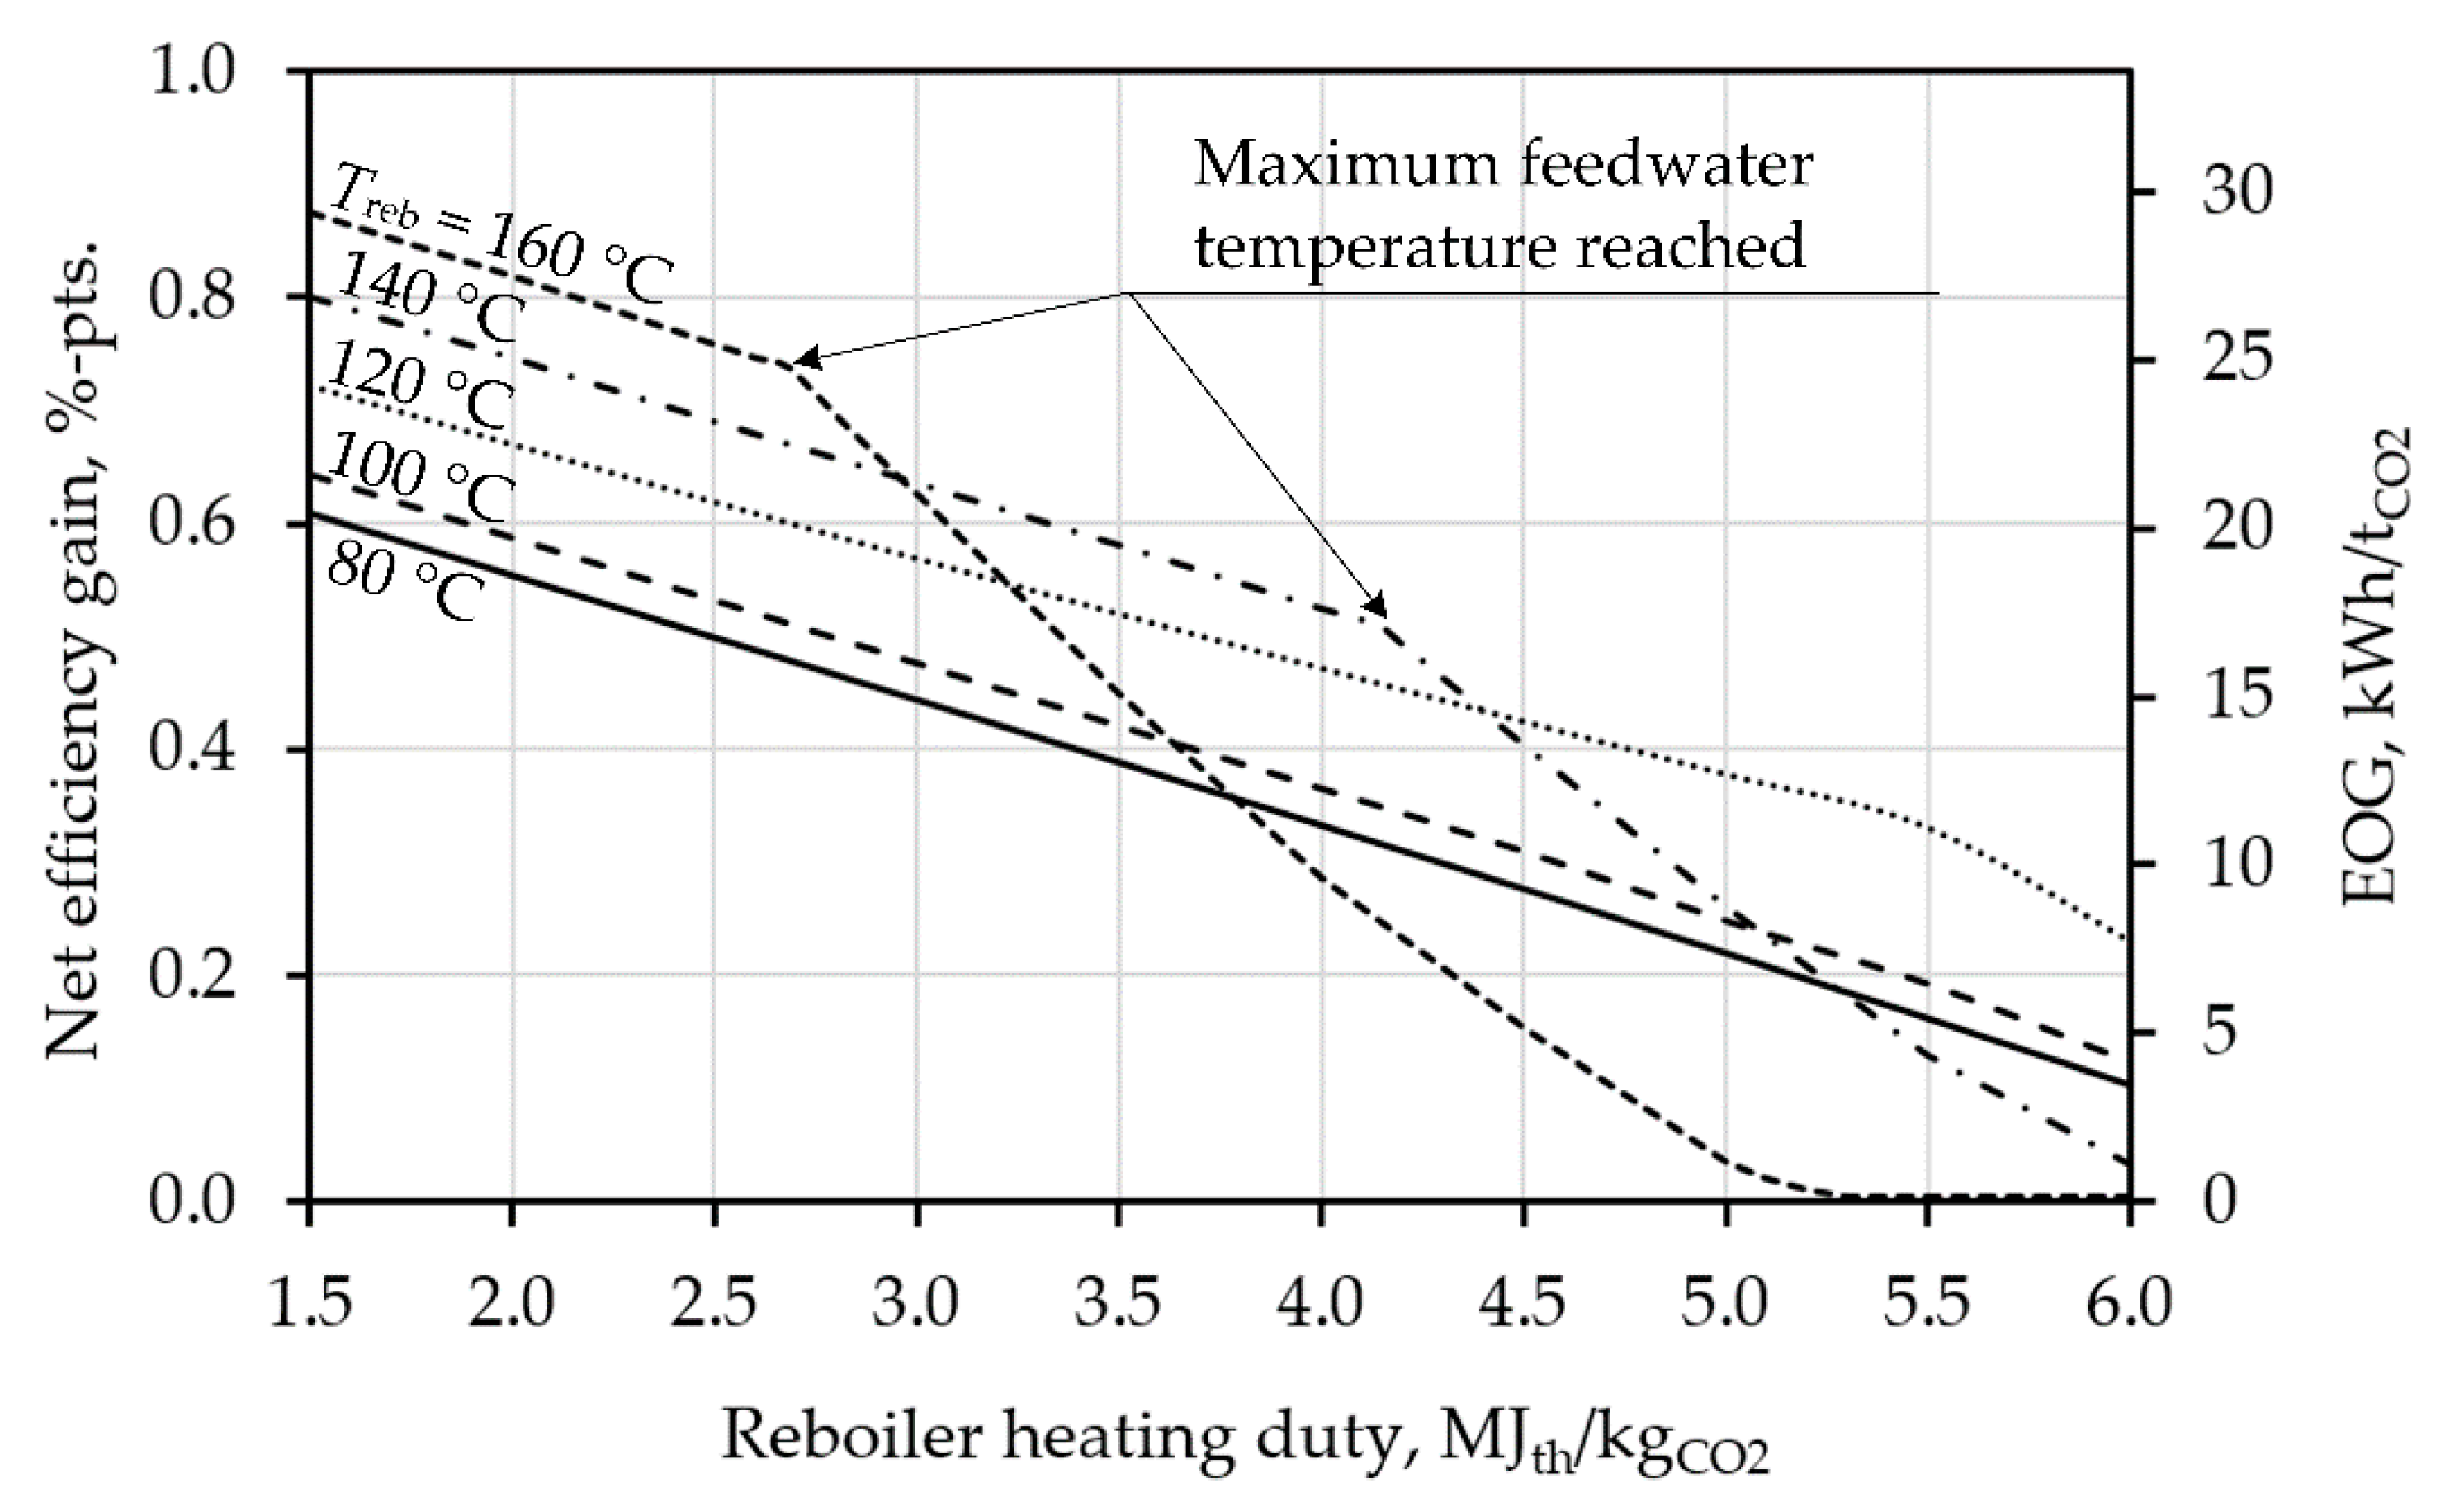
Advanced heat integration by recycling of low-temperature waste heat from the CCS unit is found to bring an additional efficiency gain of 0.4–0.6% pts to the steam cycle.
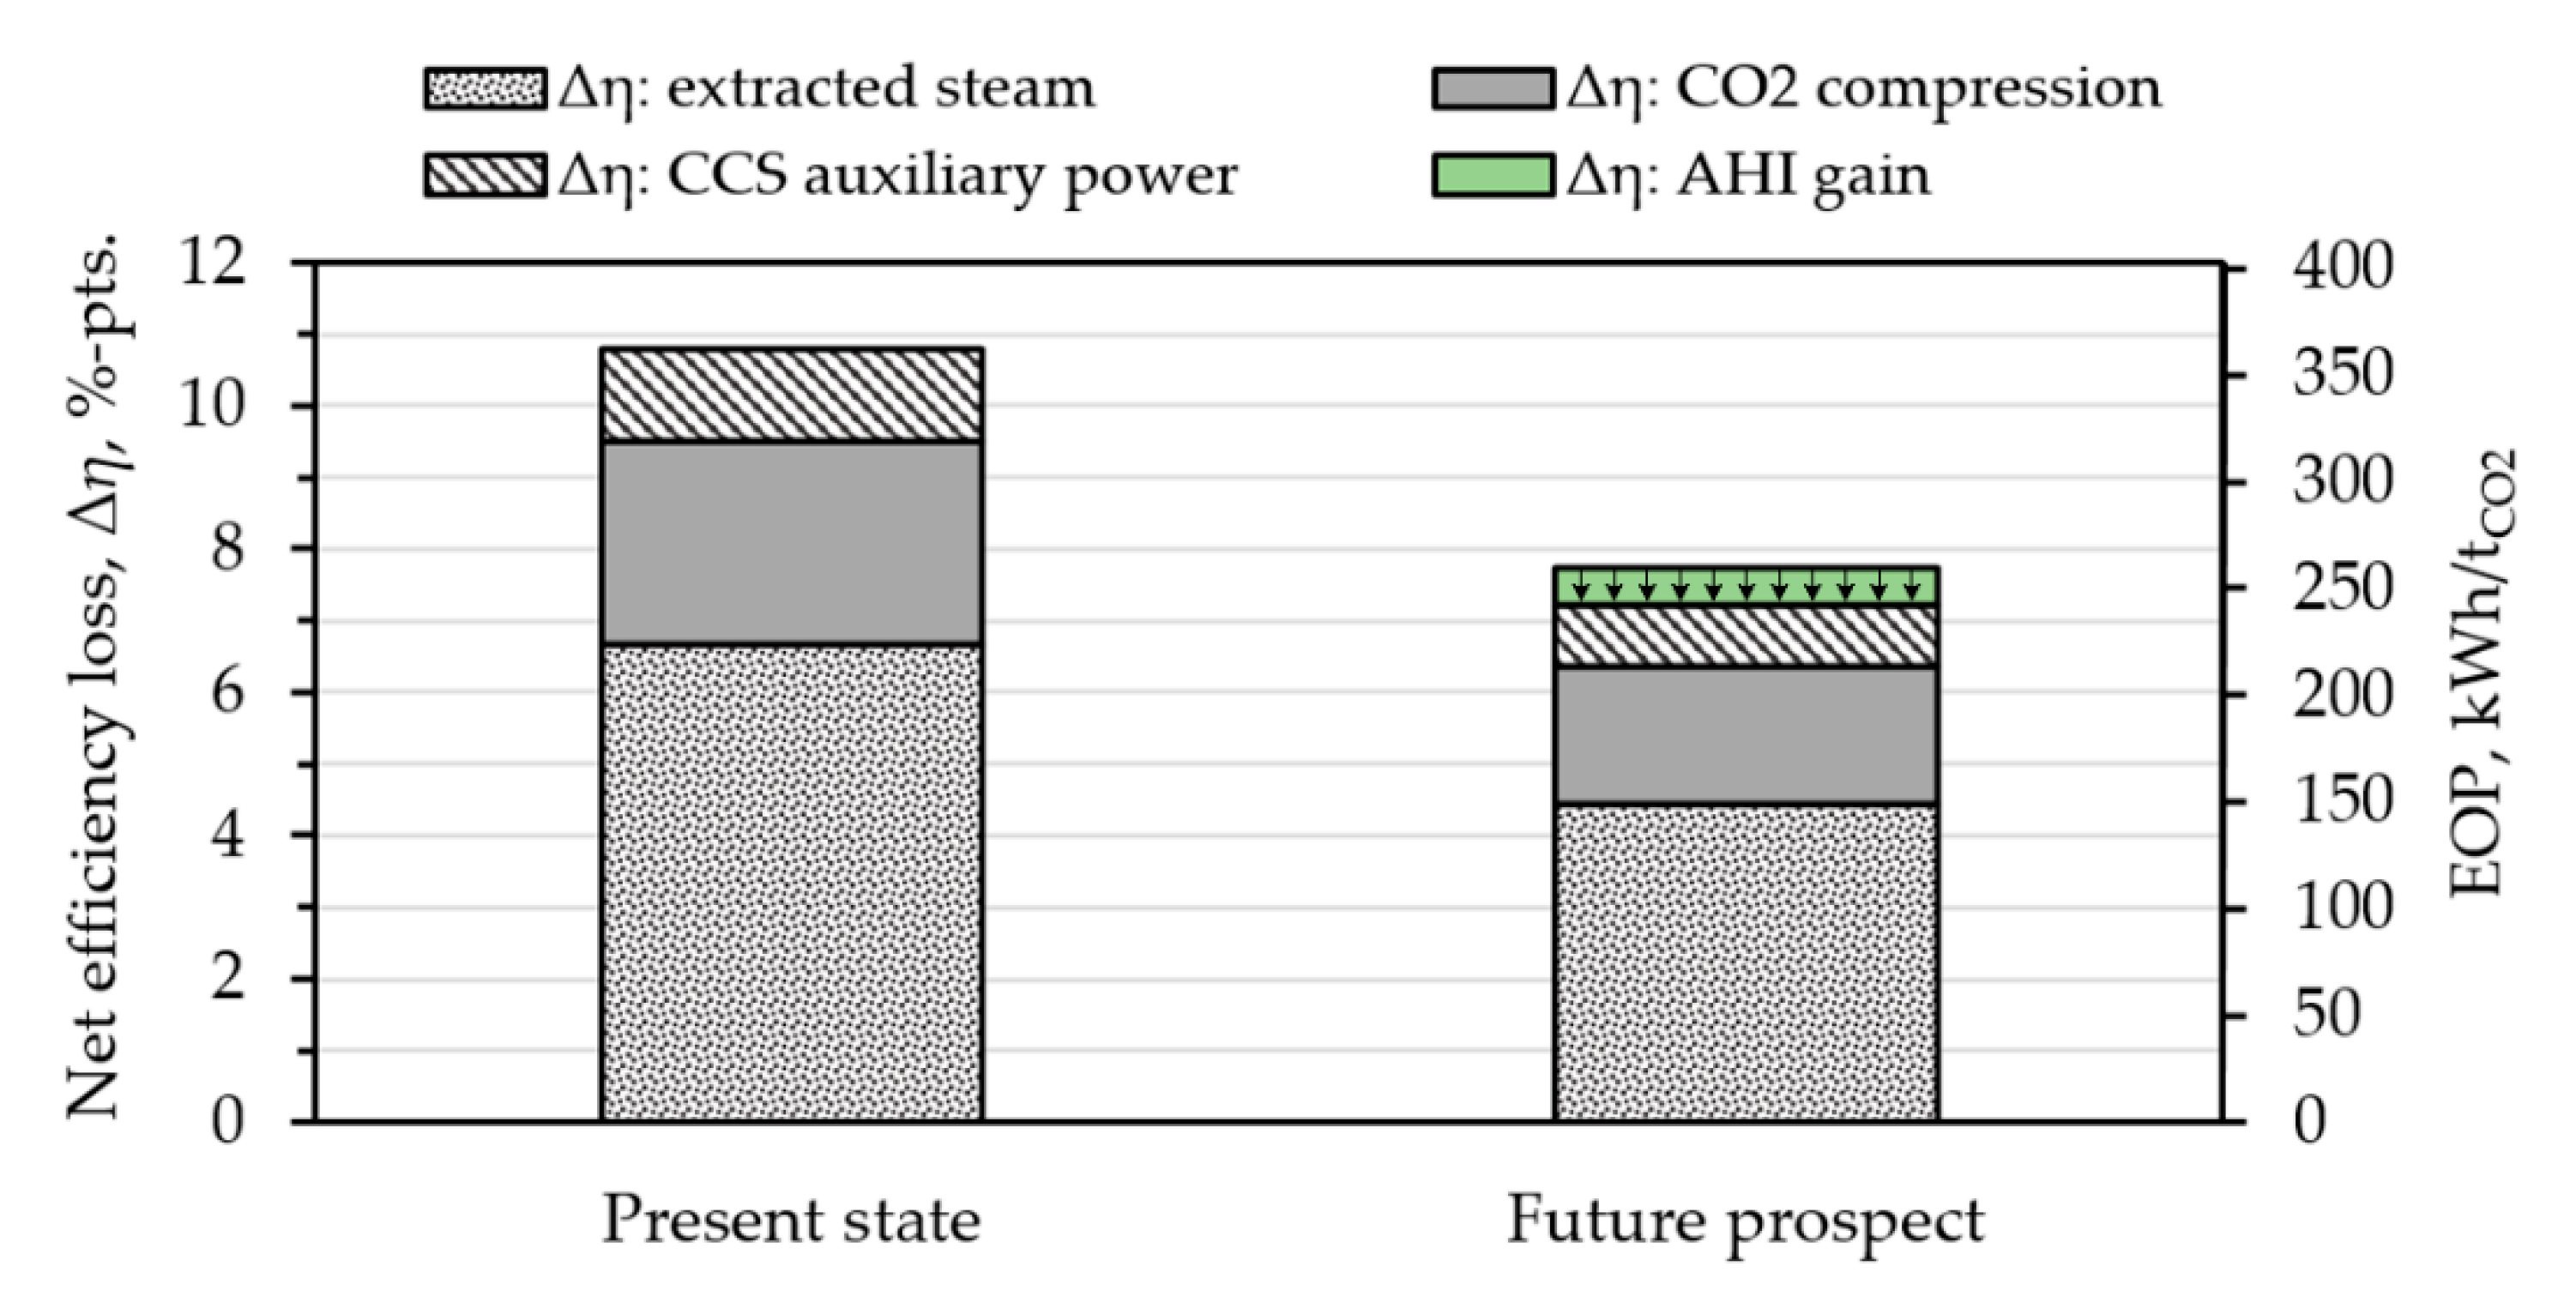
Present day CCS technology causes a net efficiency loss of 10.8%-pts and an electricity output penalty of 362.3 kWhel/tCO2 in the A-USC baseline scenario. Future CCS technology is expected to develop into the direction of reduced energy demand and improved CO2 absorption rates. Enhanced CO2 absorbents, improved compression strategies, and advanced heat integration could reduce the net efficiency loss and the electricity output penalty down to 7.2%-pts and 241.7 kWhel/tCO2, a 30% improvement over existing CCS technology.
From a technical perspective, post-combustion CCS is ready for integration into the fossil fuel electric power industry. However, the electricity penalties and the financial downsides caused by CCS are the principal reasons dissuading electric utilities from implementing CCS at large-scale. Legal and financial aspects concerning CCS and the carbon emission trading systems need further upgrades to pave the way towards the power industry decarbonization, for which CCS emerges as the solution.

Author Contributions

Conceptualization, B.T. and P.B.; methodology, B.T. and P.B.; software, P.B.; validation, P.B., I.B., and V.G.; formal analysis, B.T. and P.B.; investigation, P.B. and I.B.; resources, V.G.; data curation, P.B. and V.G.; writing—original draft preparation, B.T. and P.B.; writing—review and editing, I.B. and V.G.; visualization, P.B.; supervision, I.B. and V.G. All authors have read and agreed to the published version of the manuscript.

Funding

This research received no external funding.

Institutional Review Board Statement

Not applicable.

Informed Consent Statement

Not applicable.

Data Availability Statement

Not applicable.

Conflicts of Interest

The authors declare no conflict of interest.

References

  1. BP Statistical Review of World Energy 2020, 69th ed. 2020. Available online: https://www.bp.com/content/dam/bp/business-sites/en/global/corporate/pdfs/energy-economics/statistical-review/bp-stats-review-2020-full-report.pdf (accessed on 1 November 2020).
  2. IEA World Energy Outlook 2020. 2020. Available online: https://www.iea.org/reports/world-energy-outlook-2020/achieving-net-zero-emissions-by-2050#abstract (accessed on 1 November 2020).
  3. Jayarama Reddy, P. Clean Coal Technologies for Power Generation; CRC Press: Boca Raton, FL, USA; Taylor & Francis Group: London, UK, 2014. [Google Scholar]
  4. Nomoto, H. Advanced ultra-supercritical pressure steam turbines and their combination with carbon capture and storage systems (CCS). In Advances in Steam Turbines for Modern Power Plants; Tanuma, T., Ed.; Woodhead Publishing: Cambridge, UK, 2017; pp. 501–519. [Google Scholar]
  5. Zhang, D. Ultra-Supercritical Coal Power Plants: Materials, Technologies and Optimisation; Woodhead Publishing: Cambridge, UK, 2013. [Google Scholar]
  6. Rheinhafen-Dampfkraftwerk Block 8 Achieved A 47.5% Net Thermal Efficiency to World-Class Level. Available online: https://www.world-energy.org/article/1198.html (accessed on 20 November 2020).
  7. Tumanovskii, A.G.; Shvarts, A.L.; Somova, E.V.; Verbovetskii, E.K.; Avrutskii, G.D.; Ermakova, S.V.; Kalugin, R.N.; Lazarev, M.V. Review of the coal-fired, over-supercritical and ultra-supercritical steam power plants. Therm. Eng. 2017, 64, 83–96. [Google Scholar] [CrossRef]
  8. Di Gianfrancesco, A. Materials for Ultra-Supercritical and Advanced Ulttra-Supercritical Power Plants; Woodhead Publishing: Duxford, UK, 2017. [Google Scholar]
  9. Viswanathan, R.; Coleman, K.; Rao, U. Materials for ultra-supercritical coal-fired power plant boilers. Int. J. Press. Vessel. Pip. 2006, 83, 778–783. [Google Scholar] [CrossRef]
  10. Rasheed, R.; Javed, H.; Rizwan, A.; Sharif, F.; Yasar, A.; Tabinda, A.B.; Ahmad, S.R.; Wang, Y.; Su, Y. Life cycle assessment of a cleaner supercritical coal-fired power plant. J. Clean. Prod. 2021, 279, 123869. [Google Scholar] [CrossRef]
  11. Global Status of CCS 2020, Global CCS Institute, November 2020, Melbourne, Australia. Available online: https://www.globalccsinstitute.com/resources/global-status-report/ (accessed on 31 December 2020).
  12. Mantripragada, H.C.; Zhai, H.; Rubin, E.S. Boundary Dam or Petra Nova—Which is a better model for CCS energy supply? Int. J. Greenh. Gas Control 2019, 82, 59–68. [Google Scholar] [CrossRef]
  13. Rubin, E.S.; Davison, J.E.; Herzog, H.J. The cost of CO2 capture and storage. Int. J. Greenh. Gas Control 2015, 40, 378–400. [Google Scholar] [CrossRef]
  14. IPCC Special Report on Carbon Dioxide Capture and Storage. Intergovernmental Panel on Climate Change; Metz, B., Davidson, O., de Coninck, H.C., Loos, M., Meyer, L.A., Eds.; Cambridge University Press: Cambridge, UK; New York, NY, USA, 2005; Available online: https://archive.ipcc.ch/report/srccs/ (accessed on 31 December 2020).
  15. ZEP: The Costs of CO2 Capture, Transport and Storage, Post-demonstration CCS in the EU, European Technology Platform for Zero Emission Fossil Fuel Power Plants, Brussels, Belgium. 2009. Available online: https://zeroemissionsplatform.eu/wp-content/uploads/Overall-CO2-Costs-Report.pdf (accessed on 31 December 2020).
  16. Pale Blue Dot Energy. Global Storage Resource Classification Assessment: 2020. Available online: https://www.globalccsinstitute.com/resources/publications-reports-research/global-storage-resource-assessment-2019-update/ (accessed on 31 December 2020).
  17. Leung, D.Y.C.; Caramanna, G.; Maroto-Valer, M.M. An overview of current status of carbon dioxide capture and storage technologies. Renew. Sustain. Energy Rev. 2014, 39, 426–443. [Google Scholar] [CrossRef] [Green Version]
  18. Lee, B.J.; Lee, J.I.; Yun, S.Y.; Hwang, B.G.; Lim, C.-S.; Park, Y.-K. Methodology to calculate the CO2 emission reduction at the coal-fired power plant: CO2 capture and utilization applying technology of mineral carbonation. Sustainability 2020, 12, 7402. [Google Scholar] [CrossRef]
  19. Lee, B.J.; Lee, J.I.; Yun, S.Y.; Lim, C.-S.; Park, Y.-K. Economic evaluation of carbon capture and utilization applying the technology of mineral carbonation at coal-fired power plant. Sustainability 2020, 12, 6175. [Google Scholar] [CrossRef]
  20. Nasirov, S.; O’Ryan, R.; Osorio, H. Decarbonization tradeoffs: A dynamic general equilibrium modeling analysis for the Chilean power sector. Sustainability 2020, 12, 8248. [Google Scholar] [CrossRef]
  21. Kumar Shukla, A.; Ahmad, Z.; Sharma, M.; Dwivedi, G.; Nath Verma, T.; Jain, S.; Verma, P.; Zare, A. Advances of carbon capture and storage in coal-based power generating units in an Indian context. Energies 2020, 13, 4124. [Google Scholar] [CrossRef]
  22. Yun, T.; Kim, Y.; Kim, J.-Y. Feasibility Study of the Post-2020 Commitment to the Power Generation Sector in South Korea. Sustainability 2017, 9, 307. [Google Scholar] [CrossRef] [Green Version]
  23. Markewitz, P.; Zhao, L.; Ryssel, M.; Moumin, G.; Wang, Y.; Sattler, C.; Robinius, M.; Stolten, D. Carbon capture for CO2 emission reduction in the cement industry in Germany. Energies 2019, 12, 2432. [Google Scholar] [CrossRef] [Green Version]
  24. Toktarova, A.; Karlsson, I.; Rootzén, J.; Göransson, L.; Odenberger, M.; Johnsson, F. Pathways for low-carbon transition of the steel industry—a Swedish case study. Energies 2020, 13, 3840. [Google Scholar] [CrossRef]
  25. Adu, E.; Zhang, Y.; Liu, D.; Tontiwachwuthikul, P. Parametric process design and economic analysis of post-combustion CO2 capture and compression for coal- and natural gas-fired power plants. Energies 2020, 13, 2519. [Google Scholar] [CrossRef]
  26. Vu, T.T.; Lim, Y.I.; Song, D.; Mun, T.-Y.; Moon, J.-H.; Sun, D.; Hwang, Y.-T.; Lee, J.-G.; Park, Y.C. Techno-economic analysis of ultra-supercritical power plants using air- and oxy-combustion circulating fluidized bed with and without CO2 capture. Energy 2020, 194, 116855. [Google Scholar] [CrossRef]
  27. Liebenthal, U.; Linnenberg, S.; Oexmann, J.; Kather, A. Derivation of correlations to evaluate the impact of retrofitted post-combustion CO2 capture processes on steam power plant performance. Int. J. Greenh. Gas Control 2011, 5, 1232–1239. [Google Scholar] [CrossRef]
  28. Stepczynska-Drygas, K.; Łukowicz, H.; Dykas, S. Calculation of an advanced ultra-supercritical power unit with CO2 capture installation. Energy Convers. Manag. 2013, 74, 201–208. [Google Scholar] [CrossRef]
  29. Lucquiaud, M.; Gibbins, J. On the integration of CO2 capture with coal-fired power plants: A methodology to assess and optimize solvent-based post-combustion capture systems. Chem. Eng. Res. Des. 2011, 89, 1553–1571. [Google Scholar] [CrossRef]
  30. Li, J.; Liang, X. CO2 capture modelling for pulverized coal-fired power plants: A case study of aan existing 1 GW ultra-supercritical power plant in Shandong, China. Sep. Purif. Technol. 2012, 94, 138–145. [Google Scholar] [CrossRef]
  31. Xu, C.; Li, X.; Liu, X.; Li, J. An integrated de-carbonization supercritical coal-fired power plant incorporating a supplementary steam turbine, process heat recovery and a modified boiler structure. Appl. Therm. Eng. 2020, 178, 115532. [Google Scholar] [CrossRef]
  32. Jackson, S.; Brodal, E. Optimization of the energy consumption of a carbon capture and sequestration related carbon dioxide compression processes. Energies 2019, 12, 1603. [Google Scholar] [CrossRef] [Green Version]
  33. Electric Power Research Institute. Engineering and Economic Evaluation of 1300 °F Series Ultra-Supercritical Pulverized Coal Power Plants: Phase 1. EPRi Technical Update Report 1015699. 2008. Available online: https://www.epri.com/research/products/1015699 (accessed on 1 November 2020).
  34. Tramošljika, B. Analysis of the Thermal Power Plant Plomin C: Comparison of Gas and Coal Variants. Graduate Thesis, Faculty of Engineering, University of Rijeka, Rijeka, Croatia, 2019. Available online: https://urn.nsk.hr/urn:nbn:hr:190:542885 (accessed on 1 November 2020).
  35. Lucquiaud, M. Steam Cycle Options for Capture-Ready Power Plants, Retrofit and Flexible Operation with Post-Combustion CO2 Capture. Ph.D. Thesis, Imperial College, London, UK, 2020. [Google Scholar] [CrossRef]
  36. Espatolero, S.; Cortés, C.; Romeo, L.M. Efficiency improvement strategies for the feedwater heaters network designing in supercritical coal-fired power plants. Appl. Therm. Eng. 2014, 73, 447–458. [Google Scholar] [CrossRef]
  37. Bejan, A. Power Generation, chapter 8. In Advanced Engineering Thermodynamics, 4th ed.; John Wiley & Sons, Inc.: Hoboken, NJ, USA, 2016. [Google Scholar]
  38. Feron, P.H.M. Absorption-Based Post-Combustion Capture of Carbon Dioxide; Woodhead Publishing: Duxford, UK, 2016. [Google Scholar]
  39. Puxty, G.; Maeder, M. A simple chemical model to represent CO2–amine–H2O vapor–liquid-equilibria. Int. J. Greenh. Gas Control 2013, 17, 215–224. [Google Scholar] [CrossRef]
  40. Kowalczyk, T.; Ziółkowski, P.; Badur, J. Exergy analysis of the Szewalski cycle with a waste heat recovery system. Arch. Thermodyn. 2015, 36, 25–48. [Google Scholar] [CrossRef] [Green Version]
  41. Espatolero, S.; Cortés, C.; Romeo, L.M. Optimization of boiler cold-end and integration with the steam cycle in supercritical units. Appl. Energy 2010, 87, 1651–1660. [Google Scholar] [CrossRef]
  42. Booras, G.; Powers, J.; Riley, C.; Hendrix, H. Engineering and Economic Analysis of an Advanced Ultra-Supercritical Pulverized Coal Power Plant with and without Post-Combustion Carbon Capture; EPRI: Palo Alto, CA, USA, 2015. Available online: https://www.osti.gov/servlets/purl/1243059 (accessed on 1 November 2020).
  43. Hertwich, E.G.; Gibon, T.; Bouman, E.A.; Arvesen, A.; Suh, S.; Heath, G.A.; Bergesen, J.D.; Ramirez, A.; Vega, M.I.; Shi, L. Integrated life-cycle assessment of electricity-supply scenarios confirms global environmental benefit of low-carbon technologies. Proc. Natl. Acad. Sci. USA 2015, 112, 6277–6282. [Google Scholar] [CrossRef] [Green Version]
  44. Pehl, M.; Arvesen, A.; Humpenöder, F.; Popp, A.; Hertwich, E.G.; Luderer, G. Understanding future emissions from low-carbon power systems by integration of life-cycle assessment and integrated energy modelling. Nat. Energy 2017, 2, 939–945. [Google Scholar] [CrossRef]
  45. Khan, B.A.; Ullah, A.; Saleem, M.W.; Khan, A.N.; Faiq, M.; Haris, M. Energy Minimization in Piperazine Promoted MDEA-Based CO2 Capture Process. Sustainability 2020, 12, 8524. [Google Scholar] [CrossRef]
  46. Jayaweera, I.; Jayaweera, P.; Elmore, R.; Bao, J.; Bhamidi, S. Update on mixed-salt technology development for CO2 capture from post-combustion power stations. Energy Procedia 2014, 63, 640–650. [Google Scholar] [CrossRef] [Green Version]
  47. Kvamsdal, H.M.; Romano, M.C.; van der Ham, L.; Bonalumi, D.; van Os, P.; Goetheer, E. Energetic evaluation of a power plant integrated with piperazine-based CO2 capture process. Int. J. Greenh. Gas Control 2014, 28, 343–355. [Google Scholar] [CrossRef]
  48. Li, H.; Le Moullec, Y.; Lu, J.; Chen, J.; Valle Marcos, J.C.; Chen, G. Solubility and energy analysis for CO2 absorption in piperazine derivatives and their mixtures. Int. J. Greenh. Gas Control 2014, 31, 25–32. [Google Scholar] [CrossRef]
  49. Jilvero, H.; Normann, F.; Andersson, K.; Johnsson, F. Thermal Integration and Modelling of the Chilled Ammonia Process. Energy Procedia 2011, 4, 1713–1720. [Google Scholar] [CrossRef] [Green Version]
  50. Darde, V.; Thomsen, K.; van Well, W.J.M.; Stenby, E.H. Chilled ammonia process for CO2 capture. Energy Procedia 2009, 1, 1035–1042. [Google Scholar] [CrossRef] [Green Version]
  51. Moomaw, W.; Burgherr, P.; Heath, G.; Lenzen, M.; Nyboer, J.; Verbruggen, A. Annex II: Methodology. In IPCC: Special Report on Renewable Energy Sources and Climate Change Mitigation. 2011. Available online: https://www.ipcc.ch/site/assets/uploads/2018/03/Annex-II-Methodology-1.pdf (accessed on 31 December 2020).
Figure 1. The analyzed steam cycle configuration. The dashed and dotted components are present only in the carbon capture and storage (CCS) integrated steam cycle and represent the CCS heating and cooling duties with the respective basic (BHI) and advanced heat integration (AHI).
Sustainability 13 00801 g001
Figure 2. The schematic diagram of the amine-based CCS unit.
Sustainability 13 00801 g002
Figure 3. Temperature-entropy chart of the reference advanced ultra-supercritical (A-USC) steam cycle with. superheat/reheat temperatures of 700/720 °C and pressures of 350/75 bar.
Sustainability 13 00801 g003
Figure 4. Reference and CCS integrated power plants net efficiencies.
Sustainability 13 00801 g004
Figure 5. Net efficiency loss and electricity output penalty against reboiler heating duty and temperature for the A-USC power plant.
Sustainability 13 00801 g005
Figure 6. Pressure-entropy chart for the eight-stage CO2 compression with: (a) Seven intercooling stages (b) three intercooling stages.
Sustainability 13 00801 g006
Figure 7. Net efficiency loss, electricity output penalty (EOP) and compression power duty as function of the number of intercooling stages and CO2 inlet pressure.
Sustainability 13 00801 g007
Figure 8. Net efficiency gain and electricity output gain (EOG) from advanced heat integration.
Sustainability 13 00801 g008
Figure 9. Present state and future prospect on the net efficiency loss and electricity penalty for CCS integrated A-USC units.
Sustainability 13 00801 g009
Table 1. Basic input parameters for the analyzed steam cycle.
Steam ConditionsSUBCSCUSCA-USC
Superheat temperature, °C540580600700
Superheat pressure, bar170250300350
Reheat temperature, °C540580610720
Reheat pressure, bar35506075
IP/LP crossover pressure, bar7.5444
Condenser pressure, bar0.040.040.040.04
Table 2. Ultimate analysis of bituminous coal.
Carbon (C), %65.90
Hydrogen (H), %4.30
Oxygen (C), %8.00
Nitrogen (N), %1.40
Sulphur (C), %1.00
Ash, %11.7
Moisture, %7.7
Low heating calorific value (LHV), MJ/kg26.3
Table 3. Mass and energy conservation equations for the steam cycle components.
ComponentMass EquationEnergy Equation
Steam superheat m ˙ 36 = m ˙ 1 m ˙ 36 h 36 + Q ˙ superheat = m ˙ 1 h 1
Steam reheat m ˙ 5 = m ˙ 6 m ˙ 5 h 5 + Q ˙ reheat = m ˙ 6 h 6
HP turbine m ˙ 1 = m ˙ 2 + m ˙ 3 m ˙ 1 h 1 = m ˙ 2 h 2 + m ˙ 3 h 3 + W T , HP
IP turbine m ˙ 6 = m ˙ 7 + m ˙ 8 + m ˙ 9 + m ˙ 10 m ˙ 6 h 6 = m ˙ 7 h 7 + m ˙ 8 h 8 + m ˙ 9 h 9 + m ˙ 10 h 10 + W T , IP
IP/LP extraction m ˙ 10 = m ˙ 11 + m ˙ 12 + m ˙ 13 m ˙ 10 h 10 = m ˙ 11 h 11 + m ˙ 12 h 12 + m ˙ 13 h 13
BHI (with CCS) m ˙ 12 = m ˙ 38 ( BHI ) m ˙ 12 h 12 + W RCP = Q CCS , heating + m ˙ 38 ( BHI ) h 38 ( BHI )
LP turbine m ˙ 13 = m ˙ 14 + m ˙ 15 + m ˙ 16 + m ˙ 17 m ˙ 13 h 13 = m ˙ 14 h 14 + m ˙ 15 h 15 + m ˙ 16 h 16 + m ˙ 17 h 17 + W T , LP
Condenser m ˙ 17 + m ˙ 20 + m ˙ 37 = m ˙ 18 m ˙ 17 h 17 + m ˙ 20 h 20 + m ˙ 37 h 37 = m ˙ 18 h 18 + Q ˙ condenser
CP m ˙ 18 = m ˙ 19 m ˙ 18 h 18 + W CP = m ˙ 19 h 19
AHI (with CCS) m ˙ 18 = m ˙ 19 ( AHI ) m ˙ 18 h 18 + W CWP + Q CCS , cooling = m ˙ 19 ( AHI ) h 19 ( AHI )
FWH 7 m ˙ 16 + m ˙ 19 + m ˙ 22 = m ˙ 20 + m ˙ 21 m ˙ 16 h 16 + m ˙ 19 h 19 + m ˙ 22 h 22 = m ˙ 20 h 20 + m ˙ 21 h 21
FWH 6 m ˙ 15 + m ˙ 21 + m ˙ 24 = m ˙ 22 + m ˙ 23 m ˙ 15 h 15 + m ˙ 21 h 21 + m ˙ 24 h 24 + m ˙ BHI h BHI = m ˙ 22 h 22 + m ˙ 23 h 23
FWH 5 m ˙ 14 + m ˙ 23 = m ˙ 24 + m ˙ 25 m ˙ 14 h 14 + m ˙ 23 h 23 + m ˙ BHI h BHI = m ˙ 24 h 24 + m ˙ 25 h 25
Deaerator m ˙ 9 + m ˙ 26 + m ˙ 29 = m ˙ 27 m ˙ 9 h 9 + m ˙ 25 h 25 + m ˙ 29 h 29 + m ˙ BHI h BHI = m ˙ 27 h 27
FWP m ˙ 27 = m ˙ 28 m ˙ 27 h 27 + W FWP = m ˙ 28 h 28
FWPT m ˙ 11 = m ˙ 37 m ˙ 11 h 11 = m ˙ 37 h 37 + W FWPT
FWH 4 m ˙ 8 + m ˙ 28 + m ˙ 31 = m ˙ 29 + m ˙ 30 m ˙ 8 h 8 + m ˙ 28 h 28 + m ˙ 31 h 31 = m ˙ 29 h 29 + m ˙ 30 h 30
FWH 3 m ˙ 7 + m ˙ 30 + m ˙ 33 = m ˙ 31 + m ˙ 32 m ˙ 7 h 7 + m ˙ 30 h 30 + m ˙ 33 h 33 = m ˙ 31 h 31 + m ˙ 32 h 32
FWH 2 m ˙ 4 + m ˙ 32 + m ˙ 35 = m ˙ 33 + m ˙ 34 m ˙ 4 h 4 + m ˙ 32 h 32 + m ˙ 35 h 35 = m ˙ 33 h 33 + m ˙ 34 h 34
FWH 1 m ˙ 2 + m ˙ 34 = m ˙ 35 + m ˙ 36 m ˙ 2 h 2 + m ˙ 34 h 34 = m ˙ 35 h 35 + m ˙ 36 h 36
Table 4. Steam cycle validation against results found in the literature.
Steam CycleInput ParametersNet Efficiency
#TypeS/R T S/R PRef. NoPresent Study
1USC600/620 °C285/60 bar45.49% [27]45.21%
2USC650/670 °C300/70 bar47.58% [40] *47.40% *
3USC590/610 °C300/57 bar43.84% [41]44.15%
4A-USC733/760 °C242.3/51 bar44.87% [42]44.72%
5A-USC680/700 °C352/73.5 bar46.31% [33]46.63%
* Auxiliary power consumption excluded.
Table 5. Reference A-USC steam cycle: m ˙ -T-p data.
Point m ˙ (kg/s)T (°C)p (Bar)Point m ˙ (kg/s)T (°C)p (Bar)
1493.40700.00350.0021348.8965.0719.00
241.45517.30128.442240.2970.071.12
3451.96443.3380.0023348.89100.8118.00
434.99443.3380.002420.51105.813.43
5416.95443.3380.0025348.89136.1917.00
6416.95720.0075.0026348.89136.1917.00
724.50630.6146.4627493.40173.438.60
823.56519.2624.1128493.40180.08404.00
920.00372.478.8729124.51185.0823.39
10348.89274.284.0030493.40218.44403.00
1137.93274.113.8831100.95223.4445.06
12---32493.40255.52402.00
13310.96274.113.883376.45260.5277.60
1420.51263.743.5434493.40290.89401.00
1519.78152.821.153541.45295.89124.59
1619.00x = 0.9750.2836493.40325.56400.00
17251.67x = 0.9130.043737.93x = 0.9130.04
18348.8929.000.0438---
19348.8929.1620.003919235.2317.004.50
2059.2934.160.274019235.2325.002.00
Table 6. Results for the reference steam cycles.
Power Plant TypeSUBCSCUSCA-USC
Fuel heat input, MWth1760.11627.21544.81469.5
Live steam mass flow rate, kg/s625.2592.7563.7493.0
Flue gases mass flow rate, kg/s762.6705.1669.4636.7
CO2 emissions, kg/s161.8149.6142.1135.1
CO2 emissions, kg/MWhel832.3769.5730.5694.9
Condenser thermal discharge, MWth905.0786.6714.6643.1
Gross electric power, MWel735735735735
Net electric power, MWel700700700700
Gross thermal efficiency, %41.7645.1747.5850.02
Net thermal efficiency, %39.7743.0245.3147.64
Table 7. Results for the CCS integrated steam cycles.
Power Plant TypeSUBCSCUSCA-USC
CCS steam extraction, kg/s203.7195.6191.3175.1
CCS heating load, MWth509.8471.3447.5425.6
CCS cooling load, MWth668.5618.0586.8558.2
CCS auxiliary power, MWel68.665.363.960.8
Captured CO2, kg/s145.6134.6127.9121.6
CO2 emissions, kg/s16.215.014.213.5
CO2 emissions, kg/MWhel83.277.073.169.5
Gross electric power, MWel595.5626.9634.2637.2
Net electric power, MWel491.9526.6535.4541.4
Power loss factor σ, − 0.2900.2360.2250.230
Overall EOP, kWhel/tCO2397.0357.9357.7362.3
Gross thermal efficiency, %33.8338.5341.0643.36
Net thermal efficiency, %27.9532.3634.6636.84
Net efficiency loss, %-pts.11.8210.6610.6510.80
Publisher’s Note: MDPI stays neutral with regard to jurisdictional claims in published maps and institutional affiliations.

