Article

Spontaneous Variety-Seeking Meal Choice in Business Canteens Impedes Sustainable Production

Institute of Vocational Education and Work Studies, Department Education for Sustainable Nutrition and Food Science, Technische Universität Berlin, 10587 Berlin, Germany
*
Author to whom correspondence should be addressed.
Sustainability 2021, 13(2), 746; https://doi.org/10.3390/su13020746
Submission received: 18 December 2020 / Revised: 10 January 2021 / Accepted: 12 January 2021 / Published: 14 January 2021
(This article belongs to the Special Issue Sustainable Consumer Behavior and Food Marketing)

Abstract

:
Sustainable meal choices in the out-of-home catering market are essential to attaining the Sustainable Development Goals. This study investigated consumers’ acceptance of different features that help service providers to work more sustainably. For this purpose, data of a choice experiment and a supporting online questionnaire were analyzed using latent class analysis (LCA) and the data of n = 373 employees. Examined attributes in the choice experiment were menu variety, menu type, ordering system, ingredients and price. LCA led to four consumer segments: variety seekers (27.6%), spontaneous decisionmakers—vegetarian (25.7%), spontaneous decisionmakers—meat (24.1%) and vegetarians/vegans (22.6%). Results showed that consumers in all four segments expected to have the choice between different menus in company canteens. Moreover, they preferred spontaneous choice to preordering. Both preferences hamper sustainable production and consumption in the catering sector.

1. Introduction

The out-of-home catering market is the second biggest food branch in Germany, with 12.4 billion guests per year in 2019. On average, each guest uses these services more than 140 times a year [1,2]. The out-of-home catering market consists of four major segments: hotel and restaurant catering, fast-food catering, event catering and company catering. In 2019, German employees spent 7.4 billion euros on their meals at work. The sector of company catering reported growth rates of about 2 to 3% per year [1,2,3]. Improving the sustainability of the dishes offered and ensuring that healthy and more sustainable options are also chosen by guests are both relevant means to reach the Sustainable Development Goal 12 by 2030. In this regard, company canteens need to know the factors determining consumers’ meal choice at business lunches in order to promote their most sustainable dishes to orient the out-of-home catering market towards increased sustainability. Research illustrates that, in general, consumers’ eating habits and meal choices can be influenced by different means, such as System 1 nudges (e.g., default options), System 2 nudges (e.g., information or label) or participation activities [4,5,6,7,8,9,10,11,12]. In particular, consumers’ eating habits and meal choice are shown to be affected by search attributes (e.g., price, nutritional composition, variety) [9,13,14], experience attributes (e.g., taste, habit) [9,15], credence characteristics (e.g., organic or regional produce) [13,16,17], sociodemographics (e.g., age, gender) [14,18], and time (e.g., convenience, accessibility) [9,15,19] and can be differentiated into product-based and process-based choices [20]. Considering that kitchen chefs already have the goal of influencing guests’ eating behavior towards a more sustainable and healthy direction [21], our study contributes to this research field by focusing on the consumers choice. Four meal choice determinants are investigated as particular choices made in out-of-home consumption occasions, especially in a business context, and that impact overall sustainability. These are: (1) menu variety, (2) ordering system, (3) menu type and (4) ingredients.
Determinant (1) refers to the variety of dishes offered every day in business canteens and restaurants. This can be considered a sustainability issue since the amount of food waste resulting from preparation and overproduction is often positively correlated with the range of dishes offered at one time [22,23,24], which also leads to avoidable costs from the supply side. It is also up to the consumer to decide whether a narrow selection of dishes is sufficient or whether a wider selection should be available. This desire for variety is also known as variety-seeking behavior [25,26,27,28]. Consumers tend to deviate from previously used products or choices, even if they are satisfied with them, due to the curiosity of the new experience [29,30,31]. Variety seeking behavior is often seen in settings where the risk of making a bad choice is low, such as within the out-of-home catering sector.
Determinant (2) refers to the use of an ordering system. This also contributes to the predictability of demand. Preorders instead of spontaneous choice help kitchen staff to better plan product purchases and food preparation and thus reduce the amount of food produced that goes unconsumed [23,32,33]. Moreover, previous literature indicates that consumers tend to select healthier dishes while preordering instead of choosing spontaneously in the canteen [34,35,36].
Determinant (3) refers to the menu type and (4) to the ingredients used. Organic or regional produce and vegan and vegetarian options, in contrast to conventional and meat production, are factors that reduce CO2 emissions and the amount of pesticides used in agricultural production [16,17,37,38,39]. These can also be considered relevant for social and ethical reasons [40,41].
Furthermore, it is important to know whether only experienced and regular canteen users, or potential guests as well, are favoring these determinants that are responsible for the current unsustainable situation in the out-of-home catering sector [16,42,43,44]. If potential guests do not accept the offer on the grounds that it is unsustainable, marketing strategies to attract more customers, as well as a change to the product offer, could also be helpful to improve sustainability in the out-of-home catering sector. Therefore, differences between both groups could be used to apply adaptations on the producer side (e.g., cooking processes, ingredients, recipes, management of natural and monetary resources) or on the consumer side (e.g., information- or behavior-based strategies) [10,45,46]. Based on the current situation in out-of-home catering, which is mainly driven by regular canteen users, a segmentation process for the different underlying meal choice preferences via latent class analysis could supply more detailed recommendations to business canteen providers to improve sustainability. Therefore, this study proceeds as follows: after the presentation of the study design, the empirical context and methods are applied. The survey results are then presented and discussed, focusing on both consumer and producer behavior that impacts the sustainability performance of business catering, and conclusions are drawn.

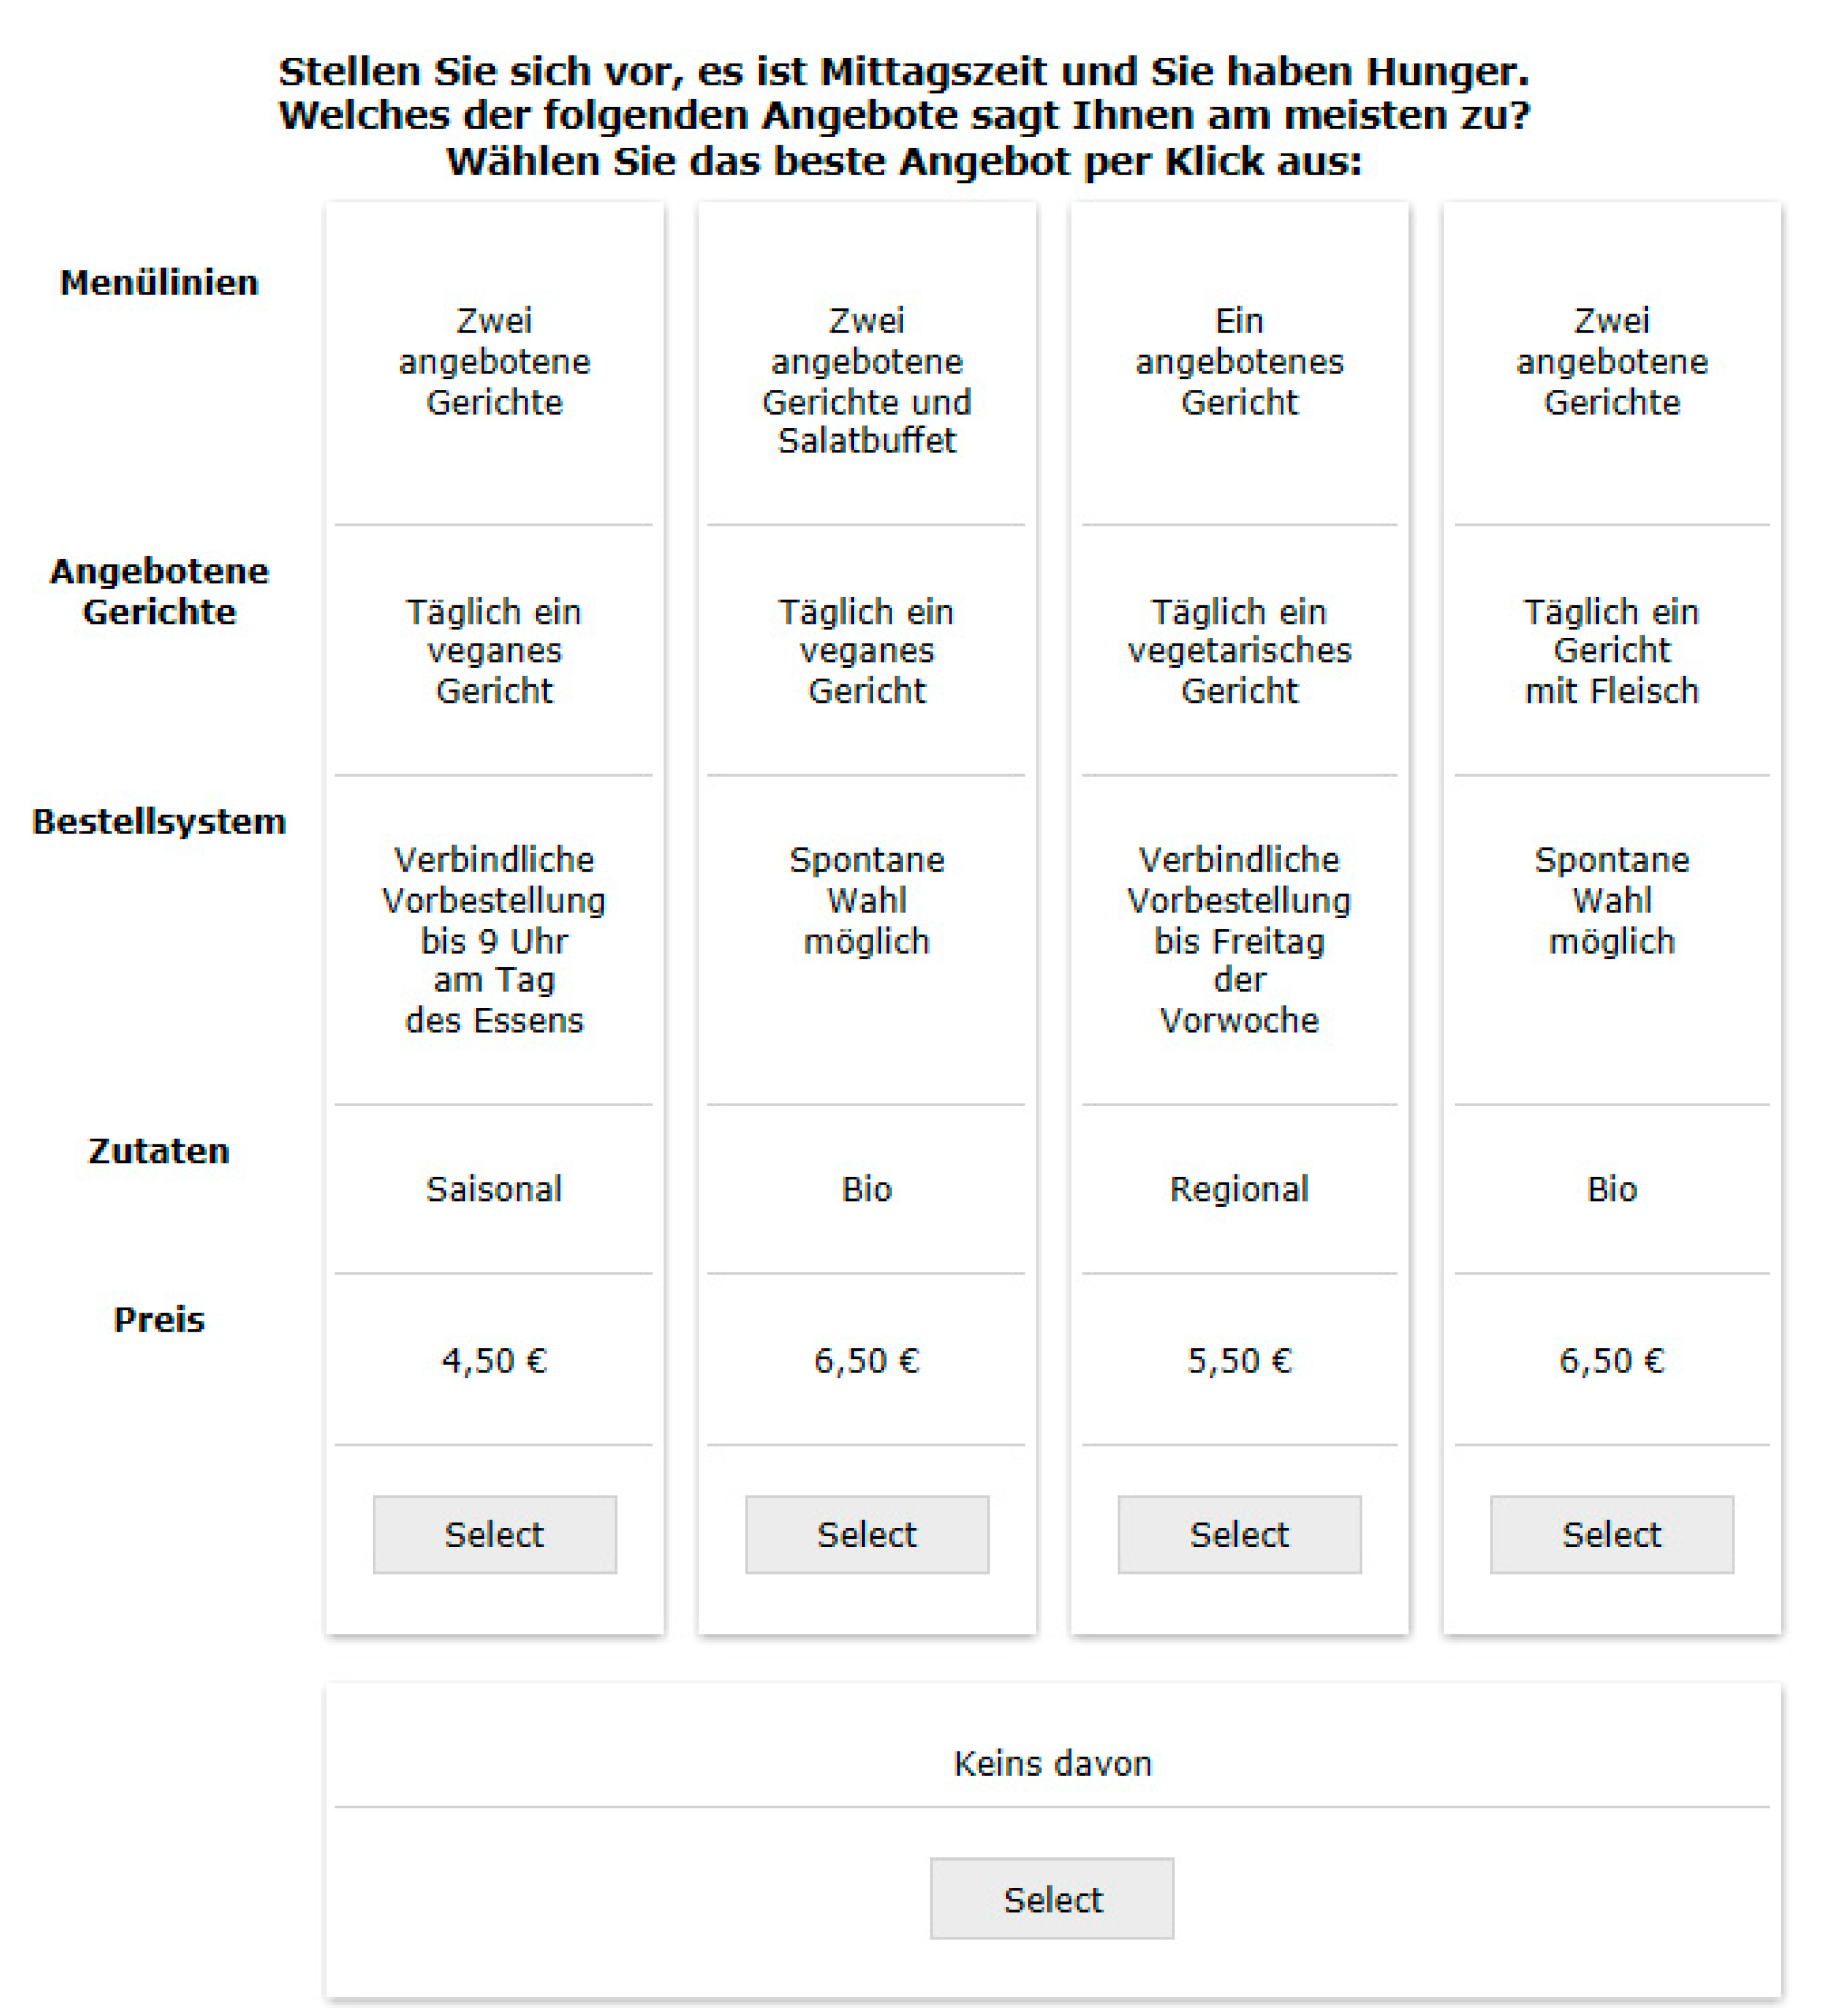
2. Materials and Methods

An online choice experiment in combination with an online questionnaire allowed us to assess the relevance of five meal attributes and their determining factors inside business canteens. The choice experiment was generated with a complete factorial design (full profile design) as there was a sufficiently high number of potential respondents. Results were evaluated with a choice-based conjoint analysis, as well as logistic regression (logit), willingness to pay (WTP) and latent class analyses using Sawtooth Software, and Stata software was employed to conduct logistic regression analyses on latent class membership [47,48,49]. In the choice experiment, a total of eight random tasks per respondent were administered to the participants. Each choice set contained four choice alternatives and an additional opt-out option (see Appendix A, Figure A1). Each alternative consisted of five attributes and three attribute levels each. The attributes tested included menu variety, i.e., the number of different dishes offered each day (one dish offered, two dishes offered, two dishes offered plus salad buffet); the menu type, i.e., whether the offered dishes were vegan, vegetarian or not (one vegetarian dish daily, one vegan dish daily, one meat dish daily); the preferred ordering system (preorder until the end of the previous week, preorder by 9 a.m. on the day of eating, spontaneous choice possible) and desired ingredients (organic, local, seasonal). Price (4.50, 5.50, 6.50€) was included for analyzing WTP (linear model) and because of its particular relevance in consumption decisions. The questionnaire covered the areas of general food choice preferences (based on an adaptation of the Food Choice Questionnaire [50,51]), including product- as well as process-based questionnaire items (for an overview, see Appendix A, Table A1).

3. Results

3.1. Sample Characteristics

In total, 373 respondents working in the Ministry for Environment, Agriculture, Conservation and Consumer Protection of the State of North Rhine-Westphalia and the State Agency for Nature, Environment and Consumer Protection of the State of North Rhine-Westphalia participated in autumn 2017. Of these, 201 were regular canteen users and 172 were identified as potential guests as they only visited the business canteen a maximum of once a week. With regard to the sample characteristics (see Appendix A, Table A2), slightly more female participants took part in the survey than male (female canteen users A: 53.2%; female potential guests B: 57.0%). The largest share of the survey was accounted for by the age group of 45 years or older (A: 52.2%; B: 50.0%). Regarding household size, single-person households (A: 24.9%; B: 18.0%) and two-person households (A: 33.3%; B: 41.3%) dominated the sample. The household income was fairly evenly distributed between canteen users and potential guests, except for the lowest income category, with a peak between 3600–5000€ in the group of canteen users (A: 32.3%).

3.2. Latent Class Approach for Analyzing the Regular Canteen Users

Due to the high opt-out rates of the potential guests (see Appendix A, Table A3), the latent class analysis was only conducted with the 201 employees who used their canteens several times a week. The canteen users had lower opt-out rates that were explainable by a better ability to imagine the choice tasks displayed in the choice experiment.
Regarding the latent class segmentation, Table 1 illustrates that the four-group solution has the best goodness of fit values and is therefore used in the following calculations. The consistent Akaike information criterion (CAIC) in particular, where smaller values are preferred over larger ones, decreases down to the four-group solution and then starts increasing to the five-group solution again. The consistent Akaike information criterion is the most used criterion for determining group segmentation [48,52,53]. The Bayesian information criterion (BIC), where smaller values are preferred [54], decreases until the four-group solution and then decreases only slightly from the four to the five-group solution.
The first 27.6% of all canteen users (see Table 2) preferred to have a large variety of dishes offered each day in their business canteen and showed the highest relevance for this attribute level compared to the other groups. Group 1 could therefore be called “variety seekers”. The second most important issue for this group was to have the possibility of choosing spontaneously but preordering on the day of eating would be an acceptable option as well. While meat dishes were favored, vegetarian dishes were also acceptable, but vegan dishes were perceived as unattractive. Group 1 revealed the highest interest in organic ingredients compared to the other groups.
The second group of the latent class analysis consisted of 25.7% of all canteen users. Respondents categorized into this group were considered “spontaneous decisionmakers (vegetarian)” due to the highest partworth utilities for “spontaneous choice” and the highest average importances for the attribute “ordering system”. As expected, they strongly rejected the two preordering options. Regarding the other attributes, they preferred a high variety of meals offered, as well as vegetarian and organic dishes. Spending more money was not necessarily a problem for this group; their partworth utilities were close to zero, and their lowest average importance was for price.
Group 3 were considered “spontaneous decisionmakers (meat)”, with 24.1% of all canteen users. As the second most important attribute, they clearly preferred “one meat dish daily” and did not choose vegan or vegetarian dishes. The only attribute that was more important to this group was an ordering system with spontaneous choice. Regarding other choice attributes, they liked to have a larger variety of meals offered as well as affordable prices, and wanted to have local instead of organic ingredients. Overall, they had the most difficulty selecting between our choice options and used the opt-out option several times more than the other groups.
The group “vegetarian/vegan” consumers made up 22.6% of the canteen users. Their most important attribute was the menu type, with the vegetarian option clearly on top, followed by vegan dishes. “One meat dish daily” was strongly rejected by this group. An ordering system with a spontaneous choice attribute level was the second most important, followed by cheap and affordable prices. This group had the lowest partworth utilities and highest average importances for price and thus wanted to spend less than the other three groups. Variety in offered dishes was preferred, as well as organic ingredients.
A logistic regression on latent class membership was conducted to compare the results of the different latent class segments of our choice experiment with their stated intentions in the questionnaire (see Table 3). With a factor analysis (eigenvalues > 1) and a varimax rotation (Kaiser–Meyer–Olkin (KMO) criterion: 0.802), six relevant factors were condensed and checked for reliability using Cronbach’s alpha indicator, where values should not drop below 0.6 [55]. The values for Cronbach’s alpha varied between the six factors, ranging from 0.721 to 0.883 (for an overview of the included items see, Appendix A, Table A1). These factors, as well as sociodemographic information, were included in a logistic regression on latent class membership. Therefore, four separate logistic regressions were executed, each of these with one of the four latent classes as a dependent variable.
The difference between the two latent classes 2 and 3, which strongly prefer to spontaneously choose their meals, can be explained by the factor of social and environmental compatibility (included items: origin of ingredients, social and environmental standards, naturalness). Here, the “spontaneous decisionmakers (vegetarian)” clearly prefer to choose their dishes according to social and environmental compatibility (β = 0.580 **, standard error (SE) = 0.220) and therefore tend to make their meal choices based on process-oriented factors. “Spontaneous decisionmakers (meat)” are less likely to be in the age category of ≤44 (β = −1.413 *, SE = 0.640) and do not care much about social and environmental compatibility (β = −0.643 ***, SE = 0.193) but tend to choose product-oriented factors. Hence, they prefer to eat appealing dishes (included items: consistency, smell, appearance) at business lunch (β = 0.547 *, SE = 0.215). On the contrary, canteen users categorized into the vegetarian and vegan latent class are more likely to be ≤44 years-old (β = 1.559 *, SE = 0.773) and do not care much about product-oriented factors, e.g., appealing impressions (β = −0.568 *, SE = 0.232). However, in accordance with their selections in the choice experiment, they do consider the process-oriented factors of social and environmental compatibility (β = 0.422 *, SE = 0.215).
Overall, there were only a few significant differences between the sociodemographic factors. Group membership was not determined by gender, household size or household income in our study. Compared to previous heterogeneous nutrition studies, this was not a surprising result [56,57,58,59]. Age was the only sociodemographic factor that was able to distinguish between two of our latent classes.

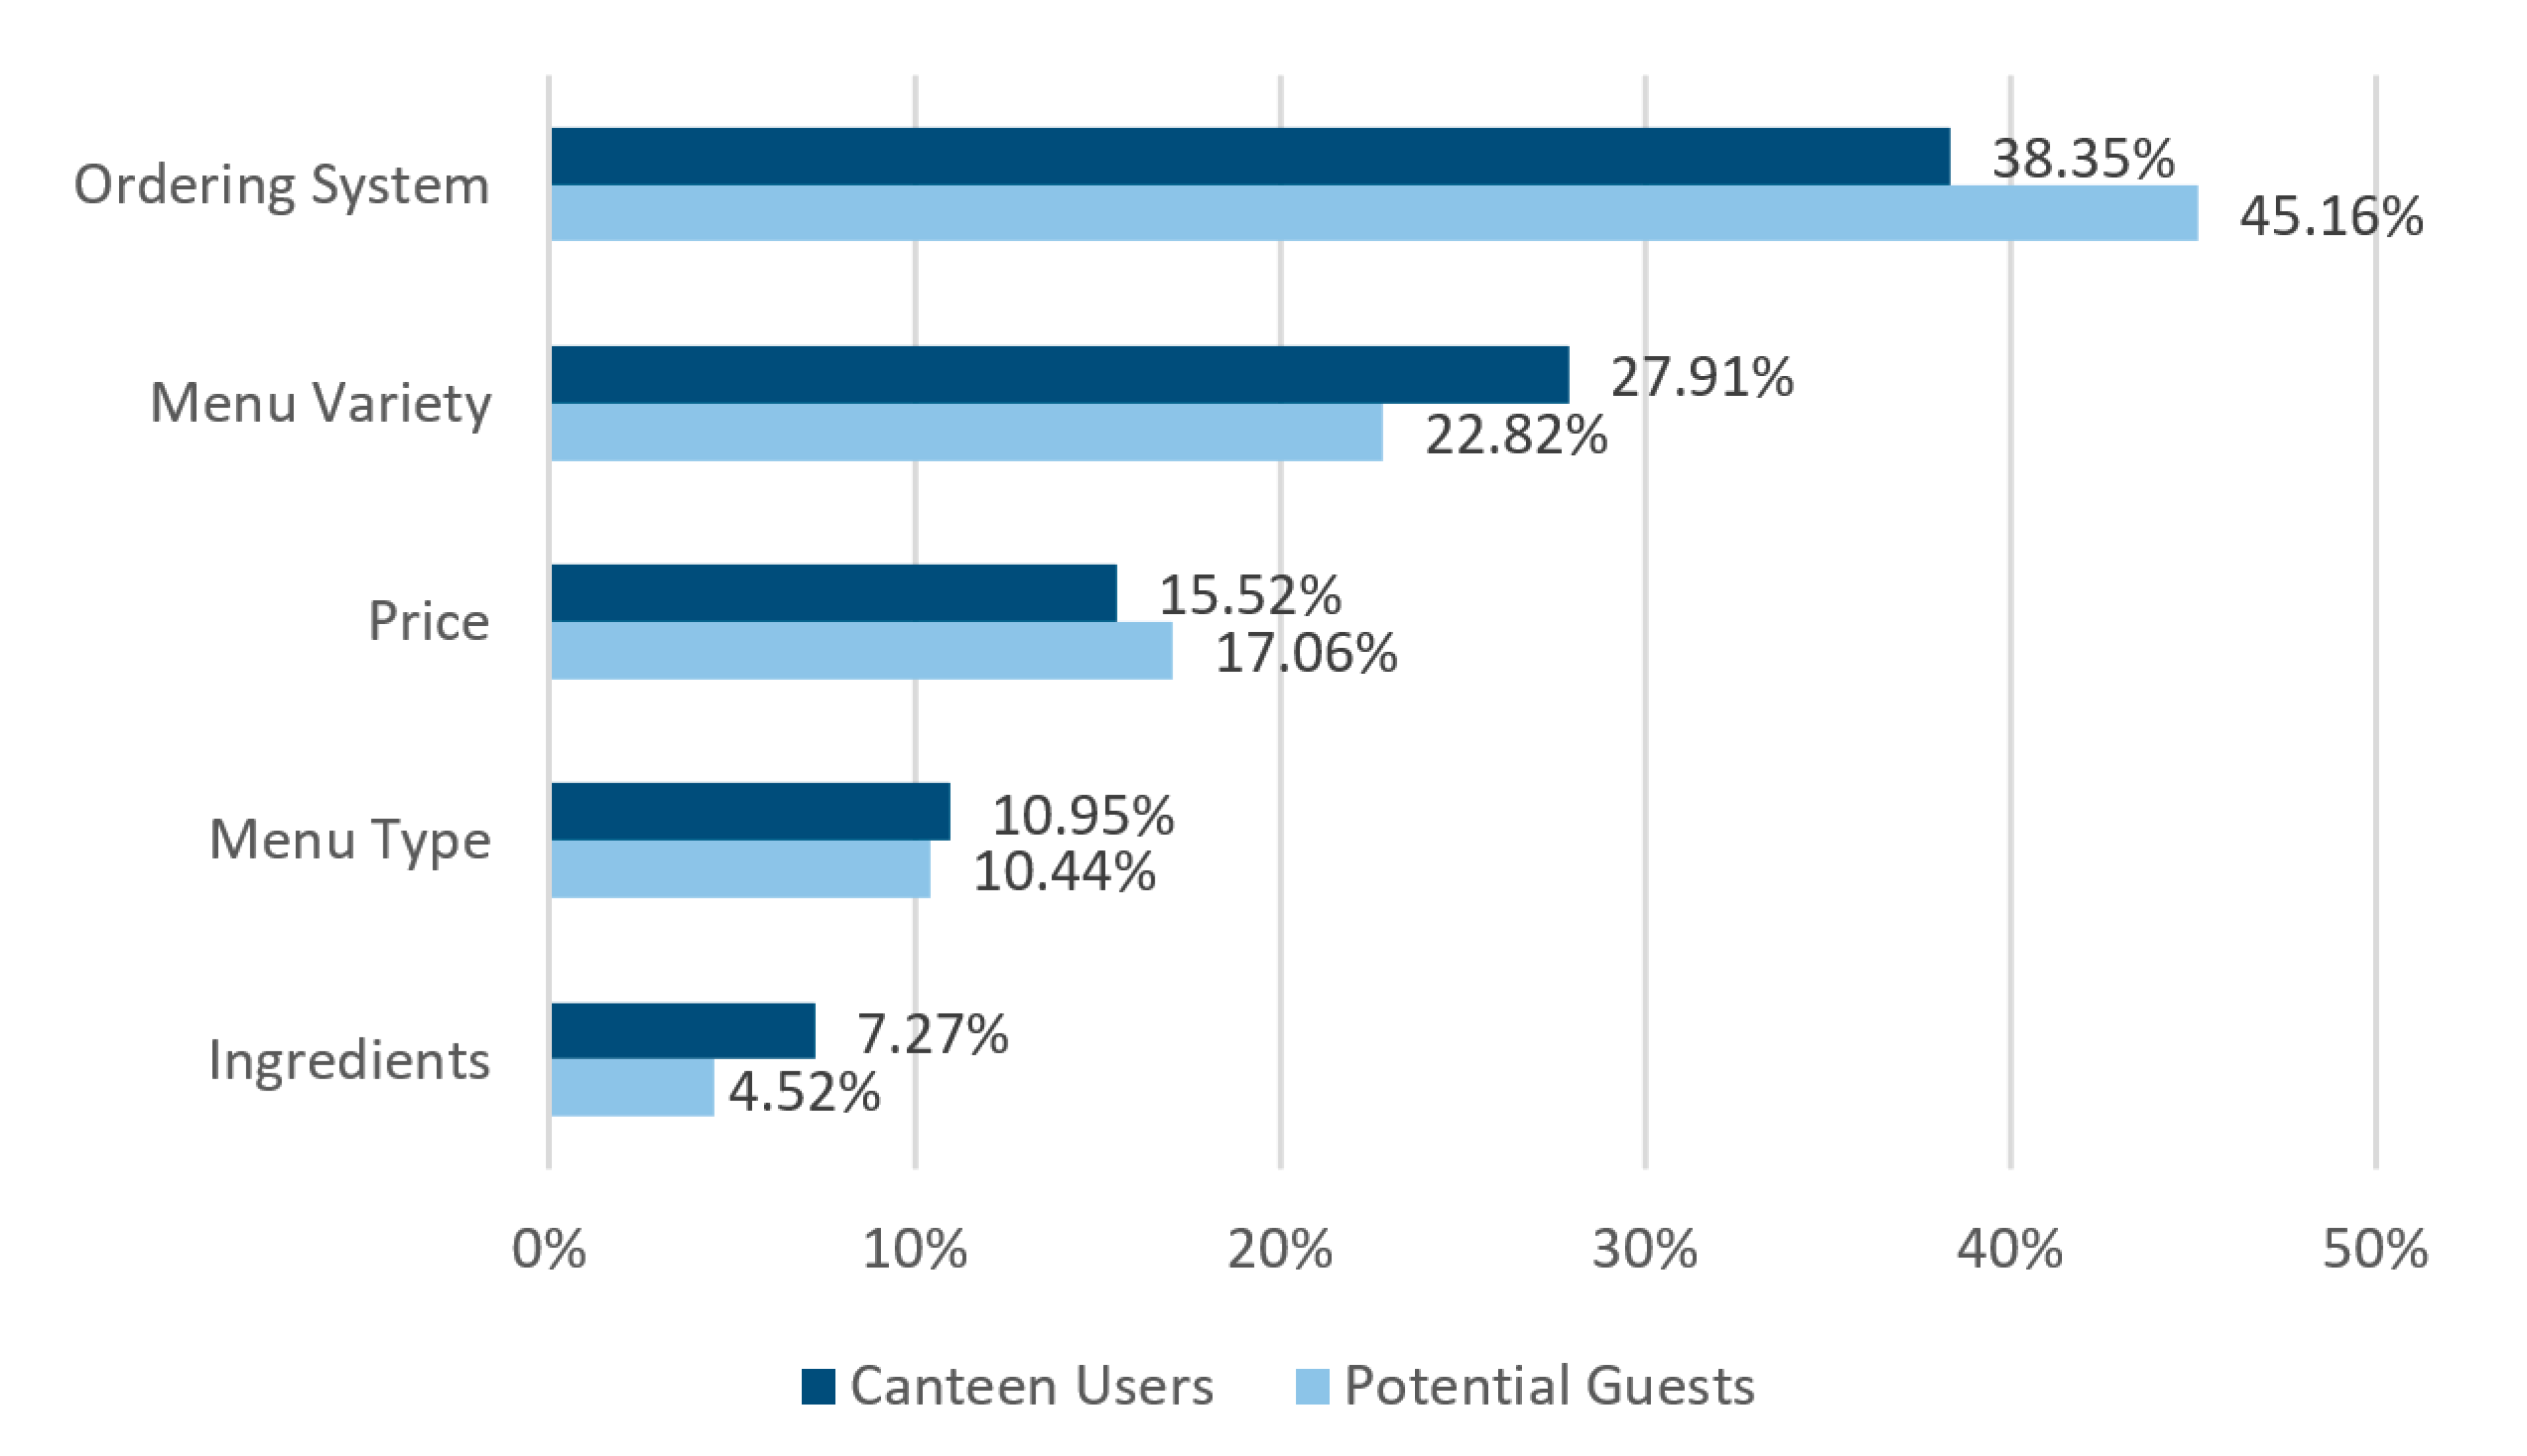
3.3. Meal Choice Determinants Impacting Overall Sustainability in Business Canteens

To assess the relevance of the different meal attributes for those already eating the food offered in the canteen but also for those not currently eating there, the full data set was divided into A) canteen users (employees who use their canteen at least twice a week up to every day), and B) potential guests (employees who do not or only rarely visit their canteen, up to a maximum of one visit per week).
The analysis of the average importances (see Figure 1) clearly reveals that the ordering system (spontaneous choice, preordering) is the most important attribute for both groups (canteen users A: 38.35%; potential guests B: 45.16%). This is followed by the second most desired attribute, menu variety, i.e., the number of dishes offered per day (A: 27.91%; B: 22.82%). The third most important attribute is price (A: 15.52%; B: 17.06%), followed by the menu type (vegan, vegetarian, meat) (A: 10.95%; B: 10.44%) and last, the ingredients (organic, local, seasonal) (A: 7.27%; B: 4.52%). Figure 1 illustrates that, based on average importances, no major differences in the ranking of desired attributes between canteen users and potential guests can be reported (which is also confirmed by logit analyses regarding the individual attribute levels—see Appendix A, Table A3).

3.4. Willingness to Pay for Meal Choice in Business Canteens

Taking the willingness to pay measures as another visualization of relevance and welfare (see Appendix A, Table A4), the estimated extra cost of 2.65 to 2.70€ for spontaneous choice instead of preordering paints a clear picture. Preordering in the previous week is discarded with WTP values of −2.25€ for canteen users and −2.65€ for potential guests. The WTP for the attribute level “two dishes offered plus salad buffet” (on average, employees are willing to spend around 1.65€ (canteen users) and 1.27€ (potential guests) more for this option) further reveals the significance of unrestricted choice variety. Thus, if a canteen only wants to offer one dish per day, guests’ willingness to pay for the remaining dish might be lower compared to a situation in which more dishes can be chosen. However, this result is only certain for the case in which consumers are not informed about the advantages of the reduced choice for them, the canteen and sustainability issues in general. The third most valued attribute is the menu type of a daily vegetarian option. Employees are willing to spend around 0.70€ more to have this vegetarian option. Employees were willing to pay around 0.29€ (potential guests) and up to 0.42€ (canteen users) more for the option of organic food as opposed to other meal ingredients such as local or seasonal food.

4. Discussion

Regarding the goal of assessing the extent to which consumers would accept different means of improving company canteen meal sustainability, four aspects were tested in an online choice experiment. Two of these aspects were directly related to meals (labeling of local, organic and seasonal produce as well as vegan, vegetarian or meat dishes) while the other two aspects were related to the service (preordering systems vs. spontaneous choice, and the number of different dishes offered per day and thus the variety of meals available).
Our findings, especially the desire for a wide variety of meals offered each day, spontaneous choice and meat components at business lunch, could impede progress towards the goal of sustainable out-of-home catering. Vegetarian and vegan dishes are better options regarding CO2 emissions as well as their overall sustainability impact [16,37,39]. As previous research shows, the desired variety of meals, as well as the preference for spontaneous choice, increase the amount of kitchen food waste and plate leftovers [22,23,24]. A preordering system, combined with reduced meal variety per day, would allow kitchen staff to better plan required meal quantities [23,32].
The finding that consumers prefer to choose their meal out of a varied selection can be explained using the concept of variety-seeking behavior. This concept assumes that consumers tend to change their commonly used products, even if they are satisfied with them, because the new experience is a benefit on its own [25,26,27,28].
Better planning reduces food waste and thus saves (natural and monetary) resources. In the best case, the saved monetary resources could be used to improve meal quality and not only business revenues. This assumption sounds plausible, but this line of thought did not occur to the study participants or was not shared. Results showed that participants did not include the criterion of an overall benefit for sustainability (by choosing in advance and from a smaller selection) into their personal utility function. In this regard, it is important to bear in mind that study participants were not informed about the overall goal of the survey. Hence, they were not told that less variety-seeking and more preordering could save resources. A lack of environmental knowledge could certainly have hindered participants in their choice of sustainably in the experiment since mostly vegan or vegetarian diets, and organic or regional produce are commonly known to be environmentally friendly [21]. However, as the participants worked in state authorities dealing with resource topics, this explanation lacks plausibility. An even more reasonable explanation is provided by present bias or hyperbolic discounting [60,61]. Present bias or hyperbolic discounting describes the finding that consumers prefer benefits they gain today from a current behavior to possible greater future benefits of a different current behavior that appears less attractive today. Restricting one’s own pleasure by preordering or choosing the only dish available for the sake of sustainability benefits for all creatures, climate and the planet in an uncertain future does not appeal to everyone. In addition to the present bias, it may simply be a perceived lower sense of responsibility for sustainable behavior when dining out of the home compared to at home. This includes a lack of perceived influence regarding the choice of ingredients and the food offered in out-of-home catering.
The current literature revealed that consumers tended to make healthier choices while preordering their meals for lunch breaks instead of spontaneously choosing them at the counter [34,35,36]. Although spontaneous choice prevailed in our choice experiment, the option of preordering (until 9 a.m.) was perceived as a tolerable possibility by variety seekers as well as potential guests. In many cases, canteen users simply could not imagine using a preordering system as they have not yet had any experience with these systems. Consequently, they had little preference for preordering systems (which could be explained by the status quo bias). Therefore, when introducing such systems, it is important that the application used to purchase dishes, as well as the exchange of payment, such as food vouchers, for previously purchased dishes, is made as easy as possible. In other words, the offer must be adapted as far as possible to the customer, not the customer to the offer.
It could be assumed that a price discount offered for each meal preordered (until 9 a.m.) would attract guests’ attention. A possible trade-off between indicated consumer demands and sustainable consumption could be the possibility of preordering (until 9 a.m.) one “most sustainable” vegetarian dish daily, which would be offered at an attractive price to lure consumers with both economic and sustainability incentives. Regarding ingredients, the canteen staff could alternate between organic and local ingredients to address the preferences of canteen users as well as potential guests. Another trade-off variant could be achieved by preordering (until 9 a.m.) the main component of the meal (e.g., meat and processed food) and spontaneously choosing side dishes, for example, a buffet containing salads and vegetables with better health and sustainability impacts. These variants should be tested in future studies to reveal which of the two ordering systems, here preordering for the main component and spontaneous choice for the side dishes, would satisfy the urge of consumers for variety seeking and their need for spontaneous choice.

5. Conclusions

Even though respondents worked in two state authorities of agriculture and could thus be assumed as more knowledgeable than an average German canteen user, the study results revealed a distinct preference for food choice attributes that hindered sustainable production in out-of-home catering. The most obvious conclusions to be drawn from our data were that, no matter how often respondents ate a business lunch or how business canteen users were segmented, they showed a clear preference for menu variety and spontaneous choice. Less important were other dish characteristics related to the ingredients, although vegetarian as well as meat options available each day and organic ingredients were preferred by the majority of respondents. Social and environmental compatibility as a process-oriented factor was only prioritized by respondents who already preferred vegetarian or vegan meal offers.
Previous literature revealed that canteen users tended to reject obvious changes in the meal offers, especially when respondents were older [62]. A remaining possibility for strengthening sustainable meal choices is to nudge consumers and help them subconsciously opt for the healthier and more sustainable choices [9,12,63,64,65]. While System 1 nudges address fast, automatic and emotional thinking, System 2 nudges focus on slow, exhausting and logical thinking [5,10]. If company canteens decide to allow spontaneous choice with its fast, automatic and emotional characteristics, it is advisable to use System 1 nudges (e.g., default options at the counter or in the menu) to nudge guests towards more sustainable meal choices. If company canteens decide to offer preordering and want to enhance its attractiveness, it is advisable they employ System 2 nudges (e.g., information for preordering at the counter or displaying labels while preordering) to further boost sustainable meal choices [10,64,65,66].
As illustrated above, the clear preference for spontaneous choice and menu variety, as well as the need for meat at business lunch displayed by our choice experiment, hamper sustainable production and consumption in the catering sector.

Author Contributions

Conceptualization, P.O. and N.L.; data curation, P.O.; formal analysis, P.O.; funding acquisition, N.L.; investigation, P.O. and N.L.; methodology, P.O. and N.L.; project administration, N.L.; resources, N.L.; software, P.O.; supervision, N.L.; writing—original draft, P.O. and N.L.; writing—review and editing, P.O. and N.L. All authors have read and agreed to the published version of the manuscript.

Funding

This research was funded by the Ministry for Environment, Agriculture, Conservation and Consumer Affairs of the German State of North Rhine-Westphalia (MULNV), grant number REFORDAT-325.

Institutional Review Board Statement

Not applicable.

Informed Consent Statement

Informed consent was obtained from all subjects involved in the study.

Data Availability Statement

The data presented in this study are available on request from the corresponding author.

Acknowledgments

This research was carried out as part of the project “Nachhaltige Ernährung und Vermeidung von Lebensmittelverlusten in Kantinen” in cooperation with the Institute of Sustainable Nutrition and Food Production (iSuN) at the Münster University of Applied Sciences. The authors would specifically like to thank Bettina Lorenz (TU Berlin), Silke Friedrich (iSuN), Gero Oertzen (State Agency for Nature, Environment and Consumer Protection (LANUV)), Nicola Deipenbrock (LANUV), Katrin Emde (LANUV) and Isabel Meyer (MULNV) for their support and advice in the design and implementation of the data collection for this study. The authors gratefully acknowledge the advice and support given by the reviewers. We also acknowledge the support of the Open Access Publication Fund of TU Berlin.

Conflicts of Interest

The authors declare no conflict of interest. The funders had no role in the design of the study; in the collection, analyses, or interpretation of data; in the writing of the manuscript, or in the decision to publish the results.

Appendix A

Figure A1. Example choice set of the choice experiment. Note: The choice experiment was executed in the German language. Translation: Imagine it is lunchtime and you are hungry. Which of the following offers appeal to you the most? Select the best offer by clicking. Menu variety/Menu Type/Ordering system/Ingredients/Price. Option 1: Two dishes offered/one vegan dish daily/preorder by 9 a.m./seasonal/4.50€. Option 2: Two dishes offered plus salad buffet/one vegan dish daily/spontaneous choice/organic/6.50€. Option 3: One dish offered/one vegetarian dish daily/preorder the previous week/local/5.50€. Option 4: Two dishes offered/one meat dish daily/spontaneous choice/organic/6.50€. Opt-out option: None.
Sustainability 13 00746 g0a1
Table A1. Factor analysis of the questionnaire items.
Questionnaire ItemsMeanStd. Err.Factor Loading
Social and environmental compatibility (Cronbach’s alpha: 0.883)
Whether regional ingredients are used.3.730.0730.7226
Whether social standards (e.g., Fairtrade) are met.3.370.0800.7210
Whether the origin of the ingredients is clearly marked.3.360.0870.7022
How natural the ingredients are.3.950.0700.6847
Whether seasonal ingredients are used.3.780.0710.6737
Whether environmental standards (e.g., MSC—Marine Stewardship Council) are met.3.490.0820.6653
Whether organic ingredients are used.3.440.0870.6618
Whether artificial ingredients are contained.3.730.0810.5607
Whether additives are contained.3.580.0840.5509
Health
(Cronbach’s alpha: 0.882)
A low calorie content.2.990.0840.7580
Whether the food will help me keep my weight under control.3.200.0910.7303
A low fat content.3.280.0790.7242
Whether the food keeps me healthy.3.880.0730.7092
A high fibre content.3.200.0790.6873
A high vitamin content.3.630.0720.6263
A high protein content.2.810.0840.5791
Whether the food is good for skin/hair/nails/teeth.2.390.0820.5722
Influence on mood
(Cronbach’s alpha: 0.865)
Whether eating helps me cope with stress.2.490.0880.8430
Whether a meal will help me relax.2.800.0860.8380
Whether a meal cheers me up.2.860.0900.7881
Whether a meal makes me feel good.3.700.0790.6130
Whether a meal will help me cope with my life.2.200.0870.6024
Familiarness with the meals
(Cronbach’s alpha: 0.722)
Whether I habitually eat a certain offer.2.190.0710.7070
Whether I’m familiar with a meal.2.340.0750.6471
Whether the food can be eaten quickly.2.030.0640.6281
Whether a meal is one of my favourite dishes.2.930.0880.5548
Appealing impression
(Cronbach’s alpha: 0.765)
The mouthfeel (consistency) of the dishes.4.000.0640.5806
The smell of the dishes.3.990.0580.5745
The appearance of the dishes.3.960.0570.5706
Financial aspects
(Cronbach’s alpha: 0.721)
That my meal isn’t expensive.2.950.0760.7122
That my choice is cheap.2.090.0720.5782
Note: The following items had no factor loading over 0.5 and were excluded: whether the dish is vegetarian; whether the dish is vegan; how nutritious the food is; whether the food contains ingredients I can’t handle; the taste of the dishes; a good price-performance ratio of my selection; whether I can just eat the food (e.g., no spaghetti with sauce); whether I get the food fast at the food counter. Items were based on [50,51].
Table A2. Sample characteristics.
Sociodemographic
Attributes
A: Canteen UsersB: Potential Guests
FrequencyShare (%)FrequencyShare (%)
GenderFemale10753.29857.0
Male9446.87342.4
N/A--10.6
Age≤447537.36738.9
≥4510552.28650.0
N/A2110.51911.1
Household
Size
15024.93118.0
26733.37141.3
32411.93017.4
43316.42916.9
>4115.563.5
N/A168.052.9
Household
Income
<1300€52.5105.8
1300–2600€4321.44425.6
2600–3600€3818.93017.4
3600–5000€6532.34325.0
>5000€4120.43721.5
N/A94.584.7
N 201172
Table A3. Logit models for canteen users and potential guests.
AttributeAttribute LevelsA: Canteen UsersB: Potential Guests
βStd. Err.t RatioβStd. Err.t Ratio
Menu VarietyOne dish offered−0.8780.059−14.982 ***−0.6650.060−11.112 ***
Two dishes offered0.1290.0492.661 **0.0720.0521.376
Two dishes offered plus salad buffet0.7490.04715.885 ***0.5940.05011.844 ***
Menu TypeOne vegetarian dish daily0.3220.0466.935 ***0.3290.0516.470 ***
One vegan dish daily−0.3160.050−6.316 ***−0.2340.054−4.317 ***
One meat dish daily−0.0060.048−0.126−0.0960.052−1.826
Ordering SystemPre-order
(previous week)
−1.0160.064−15.810 ***−1.2390.079−15.717 ***
Spontaneous choice1.2200.04825.407 ***1.2400.05422.852 ***
Pre-order by 9 a.m.−0.2040.053−3.821 ***−0.0020.059−0.026
IngredientsOrganic0.1880.0473.986 ***0.1350.0512.653 **
Local0.0470.0480.978−0.0080.053−0.161
Seasonal−0.2350.050−4.689 ***−0.1270.054−2.356 *
Price−0.4520.043−10.525 ***−0.4680.046−10.173 ***
None0.4490.0716.331 ***0.7250.0739.865 ***
Goodness of Fit
Akaike Info Criterion (AIC)3932.873468.02
Consistent Akaike Info Criterion (CAIC)3996.693530.28
Bayesian Information Criterion (BIC)3986.693520.28
Chi-Square1263.09981.16
        N201172
Note: *** p < 0.001, ** p < 0.01, * p < 0.05.
Table A4. Willingness to pay (WTP) measures for canteen users and potential guests.
AttributeAttribute LevelsCanteen UsersPotential Guests
WTPWTP
Menu VarietyOne dish offered−1.94€−1.42€
Two dishes offered0.29€0.15€
Two dishes offered plus salad buffet1.65€1.27€
Menu TypeOne vegetarian dish daily0.71€0.70€
One vegan dish daily−0.70€−0.50€
One meat dish daily−0.01€−0.20€
Ordering SystemPre-order (previous week)−2.25€−2.65€
Spontaneous choice2.70€2.65€
Pre-order by 9 a.m.−0.45€0.00€
IngredientsOrganic0.42€0.29€
Local0.10€−0.02€
Seasonal−0.52€−0.27€
        None0.99€1.55€
        N201172
Note: WTP was calculated with the attribute price as a linear function (output of the logit analysis).

References

  1. BVE—Bundesvereinigung der Deutschen Ernährungsindustrie e.V. Jahresbericht 2019_2020. Available online: https://www.bve-online.de/presse/infothek/publikationen-jahresbericht/bve-jahresbericht-ernaehrungsindustrie-2020 (accessed on 31 July 2020).
  2. BVE—Bundesvereinigung der Deutschen Ernährungsindustrie e.V. Jahresbericht 2017_2018. Available online: https://www.bve-online.de/presse/infothek/publikationen-jahresbericht/jahresbericht-2018 (accessed on 8 April 2020).
  3. BVE—Bundesvereinigung der Deutschen Ernährungsindustrie e.V. Jahresbericht 2018_2019. Available online: https://www.bve-online.de/presse/infothek/publikationen-jahresbericht/bve-jahresbericht-ernaehrungsindustrie-2019 (accessed on 7 May 2020).
  4. Diliberti, N.; Bordi, P.L.; Conklin, M.T.; Roe, L.S.; Rolls, B.J. Increased Portion Size Leads to Increased Energy Intake in a Restaurant Meal. Obes. Res. 2004, 12, 562–568. [Google Scholar] [CrossRef]
  5. Kahneman, D. Thinking, Fast and Slow; Macmillan: New York, NY, USA, 2011. [Google Scholar]
  6. Goeminne, P.C.; de Wit, E.H.; Burtin, C.; Valcke, Y. Higher Food Intake and Appreciation with a New Food Delivery System in a Belgian Hospital. Meals on Wheels, a Bedside Meal Approach: A Prospective Cohort Trial. Appetite 2012, 59, 108–116. [Google Scholar] [CrossRef] [PubMed]
  7. Morizet, D.; Depezay, L.; Combris, P.; Picard, D.; Giboreau, A. Effect of Labeling on New Vegetable Dish Acceptance in Preadolescent Children. Appetite 2012, 59, 399–402. [Google Scholar] [CrossRef] [PubMed]
  8. Fenger, M.H.; Witzel, J.A.; Hansen, F.; Grunert, K.G. Delicious Words—Assessing the Impact of Short Storytelling Messages on Consumer Preferences for Variations of a New Processed Meat Product. Food Qual. Prefer. 2015, 41, 237–244. [Google Scholar] [CrossRef]
  9. Lorenz, B.A.; Langen, N. Determinants of How Individuals Choose, Eat and Waste: Providing Common Ground to Enhance Sustainable Food Consumption out-of-Home. Int. J. Consum. Stud. 2018, 42, 35–75. [Google Scholar] [CrossRef] [Green Version]
  10. Ohlhausen, P.; Langen, N.; Friedrich, S.; Speck, M.; Bienge, K.; Engelmann, T.; Rohn, H.; Teitscheid, P. Auf der Suche nach dem wirksamsten Nudge zur Absatzsteigerung nachhaltiger Speisen in der Außer-Haus-Gastronomie. Vierteljahrsh. Wirtsch. 2018, 87, 95–108. [Google Scholar] [CrossRef]
  11. Ohlhausen, P.; Langen, N. When a Combination of Nudges Decreases Sustainable Food Choices Out-Of-Home—The Example of Food Decoys and Descriptive Name Labels. Foods 2020, 9, 557. [Google Scholar] [CrossRef]
  12. Arno, A.; Thomas, S. The Efficacy of Nudge Theory Strategies in Influencing Adult Dietary Behaviour: A Systematic Review and Meta-Analysis. BMC Public Health 2016, 16, 676. [Google Scholar] [CrossRef] [Green Version]
  13. Price, S.; Viglia, G.; Hartwell, H.; Hemingway, A.; Chapleo, C.; Appleton, K.; Saulais, L.; Mavridis, I.; Cueto, F.J.P. What Are We Eating? Consumer Information Requirement within a Workplace Canteen. Food Qual. Prefer. 2016, 53, 39–46. [Google Scholar] [CrossRef] [Green Version]
  14. Nordström, J.; Thunström, L. The Impact of Price Reductions on Individuals’ Choice of Healthy Meals Away from Home. Appetite 2015, 89, 103–111. [Google Scholar] [CrossRef] [Green Version]
  15. Blanck, H.M.; Yaroch, A.L.; Atienza, A.A.; Yi, S.L.; Zhang, J.; Mâsse, L.C. Factors Influencing Lunchtime Food Choices among Working Americans. Health Educ. Behav. 2009, 36, 289–301. [Google Scholar] [CrossRef] [PubMed]
  16. Wahlen, S.; Heiskanen, E.; Aalto, K. Endorsing Sustainable Food Consumption: Prospects from Public Catering. J. Consum. Policy 2012, 35, 7–21. [Google Scholar] [CrossRef]
  17. Honkanen, P.; Verplanken, B.; Olsen, S.O. Ethical Values and Motives Driving Organic Food Choice. J. Consum. Behav. Int. Res. Rev. 2006, 5, 420–430. [Google Scholar] [CrossRef]
  18. Sjöberg, A.; Hallberg, L.; Höglund, D.; Hulthen, L. Meal Pattern, Food Choice, Nutrient Intake and Lifestyle Factors in The Göteborg Adolescence Study. Eur. J. Clin. Nutr. 2003, 57, 1569. [Google Scholar] [CrossRef] [PubMed] [Green Version]
  19. Jabs, J.; Devine, C.M. Time Scarcity and Food Choices: An Overview. Appetite 2006, 47, 196–204. [Google Scholar] [CrossRef]
  20. Caswell, J.A.; Anders, S.M. Private Versus Third Party Versus Government Labeling. In The Oxford Handbook of the Economics of Food Consumption and Policy; Oxford University Press: Oxford, UK, 2011; pp. 472–498. [Google Scholar]
  21. Irrgang, W. Internorga GV-Barometer Das Innovations- und Investitionsklima in der Gemeinschaftsgastronomie. Available online: https://www.internorga.com/fileadmin/internorga/2018/pdf/in18_gv-barometer.pdf (accessed on 8 April 2020).
  22. Halloran, A.; Clement, J.; Kornum, N.; Bucatariu, C.; Magid, J. Addressing Food Waste Reduction in Denmark. Food Policy 2014, 49, 294–301. [Google Scholar] [CrossRef]
  23. Heikkilä, L.; Reinikainen, A.; Katajajuuri, J.-M.; Silvennoinen, K.; Hartikainen, H. Elements Affecting Food Waste in the Food Service Sector. Waste Manag. 2016, 56, 446–453. [Google Scholar] [CrossRef]
  24. Pirani, S.I.; Arafat, H.A. Reduction of Food Waste Generation in the Hospitality Industry. J. Clean. Prod. 2016, 132, 129–145. [Google Scholar] [CrossRef]
  25. McAlister, L.; Pessemier, E. Variety Seeking Behavior: An Interdisciplinary Review. J. Consum. Res. 1982, 9, 311–322. [Google Scholar] [CrossRef] [Green Version]
  26. Simonson, I. The Effect of Purchase Quantity and Timing on Variety-Seeking Behavior. J. Mark. Res. 1990, 27, 150–162. [Google Scholar] [CrossRef]
  27. van Trijp, H.C.; Steenkamp, J.-B.E. Consumers’ Variety Seeking Tendency with Respect to Foods: Measurement and Managerial Implications. Eur. Rev. Agric. Econ. 1992, 19, 181–195. [Google Scholar] [CrossRef]
  28. Kahn, B.E.; Isen, A.M. The Influence of Positive Affect on Variety Seeking among Safe, Enjoyable Products. J. Consum. Res. 1993, 20, 257–270. [Google Scholar] [CrossRef]
  29. Kim, Y.H.; Sauerwald, P.; Sukpatch, K. Are You Looking for Special Menu? An Examination of Variety Seeking Behavior for Special Menu (VaSM) Model. Int. J. Gastron. Food Sci. 2020, 100295. [Google Scholar] [CrossRef]
  30. Echelbarger, M.; Maimaran, M.; Gelman, S.A. Children’s Variety Seeking in Food Choices. J. Assoc. Consum. Res. 2020, 5, 322–328. [Google Scholar] [CrossRef]
  31. Çanakçı, S.D.; Birdir, K. The Relation among Food Involvement, Food Variety Seeking and Food Neophobia: A Study on Foreign Tourists Visiting Turkey. Curr. Issues Tour. 2020, 23, 917–928. [Google Scholar] [CrossRef]
  32. Mirosa, M.; Munro, H.; Walker, E.M.; Pearson, D. Reducing Waste of Food Left on Plates: Interventions Based on Means-End Chain Analysis of Customers in Foodservice Sector. Br. Food J. 2016, 118, 2326–2343. [Google Scholar] [CrossRef]
  33. Bellina, L. Feeding Cities Sustainably: The Contribution of a ‘Eero-Foodwaste-City’ to Sustainable Development Goal 2, ‘Zero Hunger.’ In Food Futures: Ethics, Science and Culture; Wageningen Academic Publishers: Wageningen, The Netherlands, 2016; pp. 315–341. [Google Scholar]
  34. Stites, S.D.; Singletary, S.B.; Menasha, A.; Cooblall, C.; Hantula, D.; Axelrod, S.; Figueredo, V.M.; Phipps, E.J. Pre-Ordering Lunch at Work. Results of the What to Eat for Lunch Study. Appetite 2015, 84, 88–97. [Google Scholar] [CrossRef]
  35. van Epps, E.M.; Downs, J.S.; Loewenstein, G. Advance Ordering for Healthier Eating? Field Experiments on the Relationship between the Meal Order–Consumption Time Delay and Meal Content. J. Mark. Res. 2016, 53, 369–380. [Google Scholar] [CrossRef] [Green Version]
  36. Miller, G.F.; Gupta, S.; Kropp, J.D.; Grogan, K.A.; Mathews, A. The Effects of Pre-Ordering and Behavioral Nudges on National School Lunch Program Participants’ Food Item Selection. J. Econ. Psychol. 2016, 55, 4–16. [Google Scholar] [CrossRef]
  37. Leuenberger, M.; Jungbluth, N.; Büsser, S. Environmental Impact of Canteen Meals: Comparison of Vegetarian and Meat Based Recipes. In Proceedings of the International Conference on LCA in the Agri-Food, Bari, Italy, 22–24 September 2010; Volume 22. [Google Scholar]
  38. Muller, A.; Schader, C.; Scialabba, N.E.-H.; Brüggemann, J.; Isensee, A.; Erb, K.-H.; Smith, P.; Klocke, P.; Leiber, F.; Stolze, M. Strategies for Feeding the World More Sustainably with Organic Agriculture. Nat. Commun. 2017, 8, 1290. [Google Scholar] [CrossRef] [Green Version]
  39. Norja, H.R.; Kurppa, S.; Helenius, J. Dietary Choices and Greenhouse Gas Emissions—Assessment of Impact of Vegetarian and Organic Options at National Scale. Prog. Ind. Ecol. Int. J. 2009, 6, 340–354. [Google Scholar] [CrossRef]
  40. Food and Agriculture Organization. Building a Common Vision for Sustainable Food and Agriculture-Principles and Approaches; Food and Agriculture Organization: Quebec City, QC, Canada, 2014. [Google Scholar]
  41. Foresight, U.K. The Future of Food and Farming. In Final Project Report, London; The Government Office for Science: London, UK, 2011. [Google Scholar]
  42. Kasim, A.; Ismail, A. Environmentally Friendly Practices among Restaurants: Drivers and Barriers to Change. J. Sustain. Tour. 2012, 20, 551–570. [Google Scholar] [CrossRef]
  43. Reisch, L.; Eberle, U.; Lorek, S. Sustainable Food Consumption: An Overview of Contemporary Issues and Policies. Sustain. Sci. Pract. Policy 2013, 9, 7–25. [Google Scholar] [CrossRef]
  44. Rückert-John, J. Zukunftsfähigkeit der Ernährung außer Haus. In Nachhaltigkeit und Ernährung. Produktion-Handel-Konsum. Frankfurt am Main; von Brunner, K.M., Schönberger, G.U., Eds.; Campus: Frankfurt, Germany, 2005; pp. 240–262. [Google Scholar]
  45. Saulais, L. Responsibility, Strategies and Perspectives. In The Routledge Handbook of Sustainable Food and Gastronomy; Routledge: Abingdon, UK, 2015; p. 253. [Google Scholar]
  46. de Visser-Amundson, A.; Kleijnen, M. Nudging in Food Waste Management: Where Sustainability Meets Cost-Effectiveness. In Food Waste Management: Solving the Wicked Problem; Närvänen, E., Mesiranta, N., Mattila, M., Heikkinen, A., Eds.; Springer International Publishing: Cham, Switzerland, 2020; pp. 57–87. ISBN 978-3-030-20561-4. [Google Scholar]
  47. Meyerding, S.; Kürzdörfer, A.; Gassler, B. Consumer Preferences for Superfood Ingredients—The Case of Bread in Germany. Sustainability 2018, 10, 4667. [Google Scholar] [CrossRef] [Green Version]
  48. Orme, B. Latent Class v4: Software for Latent Class Estimation for CBC Data. Sawtooth Software Research Paper Series. Available online: http://www.sawtoothsoftware.com (accessed on 31 July 2020).
  49. Orme, B.K.; Chrzan, K. Becoming an Expert in Conjoint Analysis: Choice Modeling for Pros; Sawtooth Software: Provo, UT, USA, 2017; ISBN 978-0-9993677-0-4. [Google Scholar]
  50. Scheibehenne, B.; Miesler, L.; Todd, P.M. Fast and Frugal Food Choices: Uncovering Individual Decision Heuristics. Appetite 2007, 49, 578–589. [Google Scholar] [CrossRef] [Green Version]
  51. Steptoe, A.; Pollard, T.M.; Wardle, J. Development of a Measure of the Motives Underlying the Selection of Food: The Food Choice Questionnaire. Appetite 1995, 25, 267–284. [Google Scholar] [CrossRef] [Green Version]
  52. Bozdogan, H. Model Selection and Akaike’s Information Criterion (AIC): The General Theory and Its Analytical Extensions. Psychometrika 1987, 52, 345–370. [Google Scholar] [CrossRef]
  53. Ramaswamy, V.; DeSarbo, W.S.; Reibstein, D.J.; Robinson, W.T. An Empirical Pooling Approach for Estimating Marketing Mix Elasticities with PIMS Data. Mark. Sci. 1993, 12, 103–124. [Google Scholar] [CrossRef]
  54. Nylund, K.L.; Asparouhov, T.; Muthén, B.O. Deciding on the Number of Classes in Latent Class Analysis and Growth Mixture Modeling: A Monte Carlo Simulation Study. Struct. Equ. Model. Multidiscip. J. 2007, 14, 535–569. [Google Scholar] [CrossRef]
  55. Nunnally, J. Psychometric Methods; McGraw-Hill: New York, NY, USA, 1978. [Google Scholar]
  56. Nu, C.T.; MacLeod, P.; Barthelemy, J. Effects of Age and Gender on Adolescents’ Food Habits and Preferences. Food Qual. Prefer. 1996, 7, 251–262. [Google Scholar] [CrossRef]
  57. Westenhoefer, J. Age and Gender Dependent Profile of Food Choice. In Diet Diversification and Health Promotion; Karger Publishers: Basel, Switzerland, 2005; Volume 57, pp. 44–51. [Google Scholar]
  58. Laraia, B.A.; Leak, T.M.; Tester, J.M.; Leung, C.W. Biobehavioral Factors That Shape Nutrition in Low-Income Populations: A Narrative Review; Elsevier: Amsterdam, The Netherlands, 2017. [Google Scholar]
  59. Janßen, D.; Langen, N. The Bunch of Sustainability Labels—Do Consumers Differentiate? J. Clean. Prod. 2017, 143, 1233–1245. [Google Scholar] [CrossRef]
  60. Laibson, D. Golden Eggs and Hyperbolic Discounting. Q. J. Econ. 1997, 112, 443–478. [Google Scholar] [CrossRef] [Green Version]
  61. O’Donoghue, T.; Rabin, M. Doing It Now or Later. Am. Econ. Rev. 1999, 89, 103–124. [Google Scholar] [CrossRef] [Green Version]
  62. Walther, B.A.-S.L.; Langen, N. Sustainable Changes in a Worksite Canteen: An Exploratory Study on the Acceptance of Guests. J. Clean. Prod. 2020, 259, 120737. [Google Scholar] [CrossRef]
  63. Bucher, T.; Collins, C.; Rollo, M.E.; McCaffrey, T.A.; de Vlieger, N.; van der Bend, D.; Truby, H.; Cueto, F.J.P. Nudging Consumers towards Healthier Choices: A Systematic Review of Positional Influences on Food Choice. Br. J. Nutr. 2016, 115, 2252–2263. [Google Scholar] [CrossRef]
  64. Skov, L.R.; Lourenco, S.; Hansen, G.L.; Mikkelsen, B.E.; Schofield, C. Choice Architecture as a Means to Change Eating Behaviour in Self-Service Settings: A Systematic Review. Obes. Rev. 2013, 14, 187–196. [Google Scholar] [CrossRef]
  65. Wilson, A.L.; Buckley, E.; Buckley, J.D.; Bogomolova, S. Nudging Healthier Food and Beverage Choices through Salience and Priming. Evidence from a Systematic Review. Food Qual. Prefer. 2016, 51, 47–64. [Google Scholar] [CrossRef]
  66. Langen, N.; Dubral, R.; Ohlhausen, P.; Bauske, E.; Speck, M.; Rohn, H.; Teitscheid, P. Review von Interventionsstudien aus den Bereichen Nudging, Information und Partizipation und deren Methodischer Fundierung sowie Ableitung von Stellschrauben zur Steigerung Nachhaltigen Essverhaltens; Technische Universität Berlin: Berlin, Germany, 2017. [Google Scholar]
Figure 1. Average importance of attributes for meal choice in canteens.
Sustainability 13 00746 g001
Table 1. Goodness of fit criteria of the latent class analysis.
Number of
Latent Classes
Log LikelihoodAICCAICBICChi-Square
2−1767.813577.633711.673690.671640.32
3−1702.943469.883674.133642.131770.07
4−1650.183386.353660.813617.811875.60
5−1608.123324.253668.923614.921959.70
Table 2. Partworth utilities of the different canteen user segments (latent class analysis).
Class 1Class 2Class 3Class 4
Variety SeekersSpontaneous Decisionmakers
(Vegetarian)
Spontaneous
Decisionmakers (Meat)
Vegetarians/Vegans
Class Size 27.6%25.7%24.1%22.6%
AttributeAttribute Levels
Menu VarietyOne dish offered−91.92 ***−67.20 ***−51.73 ***−37.89 ***
Two dishes offered12.01 *6.2010.879.95
Two dishes offered plus salad buffet79.91 ***60.99 ***40.85 ***27.94 ***
Menu TypeOne vegetarian dish daily16.80 **38.11 ***−3.2165.16 ***
One vegan dish daily−52.58 ***−23.84 ***−46.94 ***38.78 ***
One meat dish daily35.79 ***−14.27 *50.16 ***−103.94 ***
Ordering systemPreorder (previous week)−65.85 ***−121.18 ***−88.62 ***−55.58 ***
Spontaneous choice52.57 ***156.70 ***107.85 ***60.38 ***
Preorder (by 9 a.m.)13.28 *−35.51 **−19.23−4.79
IngredientsOrganic27.89 ***15.37 **−9.9615.68 *
Local−9.34−1.338.1811.60
Seasonal−18.56 **−14.04 *1.78−27.27 ***
Price−37.46 ***−1.28−47.86 ***−53.08 ***
None−129.36 ***83.62 ***149.05 ***−99.37 ***
Attribute Importance (%)
Menu Variety34.3725.6418.5213.17
Menu type17.6712.3919.4233.82
Ordering system23.6855.5839.2923.19
Ingredients9.295.883.638.59
Price14.990.5119.1421.23
Note: Attribute levels and attribute importances determining labelling of the classes are marked in bold. *** p < 0.001, ** p < 0.01, * p < 0.05.
Table 3. Logistic regression on latent class membership of canteen users.
Variety SeekersSpontaneous Decisionmakers
(Vegetarian)
Spontaneous Decisionmakers
(Meat)
Vegetarians/Vegans
β (Std. Error)pβ (Std. Error)pβ (Std. Error)pβ (Std. Error)p
FAC1
Social and environmental compatibility
−0.134
(0.173)
0.580
(0.220)
**−0.643
(0.193)
***0.422
(0.215)
*
FAC2
Health
0.094
(0.180)
−0.271
(0.196)
0.085
(0.191)
0.127
(0.210)
FAC3
Influence on mood
−0.148
(0.182)
0.193
(0.192)
−0.250
(0.198)
0.229
(0.203)
FAC4
Familiarness with the meal
0.139
(0.190)
0.128
(0.199)
0.057
(0.200)
−0.352
(0.211)
FAC5
Appealing impression
0.061
(0.191)
−0.158
(0.207)
0.547
(0.215)
*−0.568
(0.232)
*
FAC6
Financial aspects
−0.339
(0.203)
−0.100
(0.219)
0.222
(0.218)
0.297
(0.226)
Gender
(female)
−0.196
(0.350)
0.473
(0.371)
−0.394
(0.373)
0.050
(0.389)
Age ≤ 440.720
(0.619)
−0.925
(0.642)
−1.413
(0.640)
*1.559
(0.773)
*
Age ≥ 45−0.037
(0.605)
0.267
(0.593)
−0.708
(0.585)
0.706
(0.774)
Household Size ≤ 2−0.517
(0.664)
1.409
(1.127)
0.042
(0.701)
−0.614
(0.712)
Household Size ≥ 30.196
(0.671)
1.681
(1.134)
−0.413
(0.729)
−1.434
(0.778)
Household Income ≤ 3600€1.015
(1.171)
1.172
(1.172)
−0.416
(0.867)
−0.811
(0.822)
Household Income > 3600€1.021
(1.160)
0.946
(1.160)
−0.443
(0.855)
−0.778
(0.806)
Constant−1.945
(1.259)
−3.728
(1.528)
*0.296
(0.973)
−0.884
(1.000)
Observations201 201 201 201
Pseudo R20.0600 0.1261 0.1299 0.1359
Note: *** p < 0.001, ** p < 0.01, * p < 0.05.
Publisher’s Note: MDPI stays neutral with regard to jurisdictional claims in published maps and institutional affiliations.

