1. Introduction
It is widely agreed that dynamics of building stocks are relatively poorly known even if it is recognized to be an important research topic. Better understanding of building stock dynamics and future development is crucial, e.g., for sustainable management of the built environment [
1]. More advanced and transparent modeling of building stocks also contributes to improving analyses that lean on building stock data. The research fields that are in need of improved information on building stocks include but are not limited to land use planning, energy analysis, life cycle assessment, life cycle costing, mass flow analysis, calculation of green gross domestic product, service life estimation of components, simulation of maintenance and refurbishment, cultural heritage protection, comfort and public health, and resilience. As the fields for which building stock information is relevant are various, different levels of detail in building stock development may be significant for analysis within these fields. For example, depending on the intended use, in some cases, information related to buildings or dwellings is of interest while, in others, a further subdivision according to building types or age bands is relevant. Thus, a simple and transparent modeling approach that is modifiable to several purposes should serve the needs of these various fields.
Research on built environments often has important policy implications, such as contributing to strategies to achieve the goals set by the EU (e.g., energy performance of buildings [
2,
3], low-carbon economy [
4,
5], and no net land take by 2050 [
6]). Despite the importance, many analyses still seem to rely on vague assumptions about the development of building stock. In sustainability-related research, the description of the stock’s current state is usually based on approaches using constructed building archetypes (e.g., [
7]) or sample buildings (e.g., [
8]). As an alternative to those, Nägeli et al. [
9] introduced an approach where the idea is to create synthetic microdata on building stocks to describe individual buildings and their usage instead of using aggregate average archetype buildings. Yet another recent approach by Nägeli et al. [
10] is an agent-based building stock model which combines a bottom-up building stock model (BSM) with agent-based modeling (ABM) to incorporate the interaction between building owners’ decision making and relevant influencing factors. Moreover, previous literature on building stock dynamics covers topics like reconstitution of building stock dynamics [
1], mortality of building stock [
11], statistical analysis on demolished buildings [
12], and vacancy of residential buildings [
13].
Even if the abovementioned approaches in the previous literature are enough to provide a relatively good understanding of the current states of building stocks, options for modeling long-term future development of building stocks are limited. To forecast construction demand, researchers have used, e.g., multiple regression analysis [
14], a panel vector error correction approach [
15], a combination of neural networks and genetic algorithms [
16], grey forecasting [
17], and Box–Jenkins model [
18]. However, these modeling approaches tend to be better suited for predicting short- or medium-term development than for long-term projections. In some of the most closely related studies, dynamic material flow analysis has been applied to model housing stock long-term in the Netherlands [
19] and in Norway [
20,
21]. However, those focus on housing stock alone while our approach also pays attention to other building types. Moreover, there are established practices to assess long-term housing needs in many countries. These include but are not limited to Finland [
22,
23], Sweden [
24,
25], Norway [
26], Denmark [
27], England [
28], the US [
29], and Australia [
30].
To create feasible strategies towards sustainability targets, a better understanding of the development of building stocks is urgently needed. Specifically, various analyses on built environments require long-term projections of building stock development. However, long-term forecasts even at their best include a great amount of uncertainty. Recognizing this inherent uncertainty, we propose a transparent calculation model for modeling building stock development, QuantiSTOCK. Our approach not only provides a tangible tool for understanding the development when selected assumptions are valid but also, most importantly, allows for studying the sensitivity of results to alternative developments of the key variables. Thus, this relatively simple modeling approach provides fruitful grounds for understanding the impact of different key variables, which is needed to facilitate meaningful debate on different housing, land use, and environment-related policies.
The model is particularly developed for modeling the development of Finnish building stock but may also be widely applied to other geographic locations when fitted for location-specific data. The developed QuantiSTOCK model may be extended in numerous ways and lays the groundwork for modeling the future developments of building stocks. The presented model may be used to a wide range of analyses ranging from assessing housing demand at the regional level to providing input for defining sustainable pathways towards climate targets. Thus, the results should be of interest to a wide range of researchers, policymakers, and community stakeholders who contribute to housing and land use policies.
This work is divided as follows:
Section 2 outlines the modeling approach, which is followed by the
Section 3 that explains the modeling procedure. In
Section 4, the results of the analysis are presented, and thereafter,
Section 5 provides the discussion. Finally, concluding remarks are presented in
Section 6.
2. Modeling Approach
The quantitative building stock model (QuantiSTOCK) provides a relatively straightforward calculation-based approach to model future development of building stocks. The basic assumptions for modeling are that, logically, (1) population change and (2) mortality of existing buildings are the main drivers for quantitative changes in the building stock. Moreover, (3) gross floor area per capita ratio is an important modeling attribute that captures many overlapping processes, including but not limited to changes in residential density and distribution of housing types, and potential excess of new construction.
Two distinct advantages of the selected method are its comprehensibility and transparency. Comprehensibility refers to the modeling procedure being based on logical attributes that are suggested by common sense, while transparency, in this context, means that the modeling is based on publicly available data and the modeling procedure is clearly described in contrast to various black-box models; thus, the reader can understand how the model is constructed and what the role of the different modeling attributes is.
Relying on publicly available statistics, the model is easy to update when new statistics become available. Moreover, application of the model only requires relatively little effort in comparison to more complicated simulation approaches. Recognizing the fact that publicly available data from Statistics Finland is of an exceptionally high quality and well documented, which is not always the case, it is important that the applicability of publicly available data is evaluated case-by-case. When the reliability of public data is low, it is necessary that the user compiles a consistent dataset for modeling.
As projections of needed new construction cannot be considered an exact science, there is no such model that would produce an exact number of future needs [
25]. Thus, it is critical to understand that, due to the great uncertainty about the predictor attributes in the long-term, it is by no means self-evident that the prediction accuracy of more complicated approaches would be any better than the outcome from this stripped-down model. For example, According to Boverket [
25], Schmuecker [
31] obtains similar results using a more simple method compared to the results from more advanced approaches used in England. Another important aspect of using a relatively simple approach is that it allows transparently, putting into perspective which factors are important relative to the big picture. In contrast, complicated modeling approaches may focus on complicated descriptions of the modeling procedure while the understanding of the critical factors may be blurred.
Here, the selected modeling approach does not aim to produce any exact numbers of future development as it would not be meaningful in terms of long-term projections, but the objective is to picture the potential pathways of future development and help to understand the impacts of these alternative scenarios. Such an approach helps us to understand the relationships between the key attributes and building stock development. Even if a great amount of uncertainty is still present in the selected modeling approach, this strategy combined with relevant sensitivity analyses provides a tangible tool for understanding the boundaries within which future development will fall into.
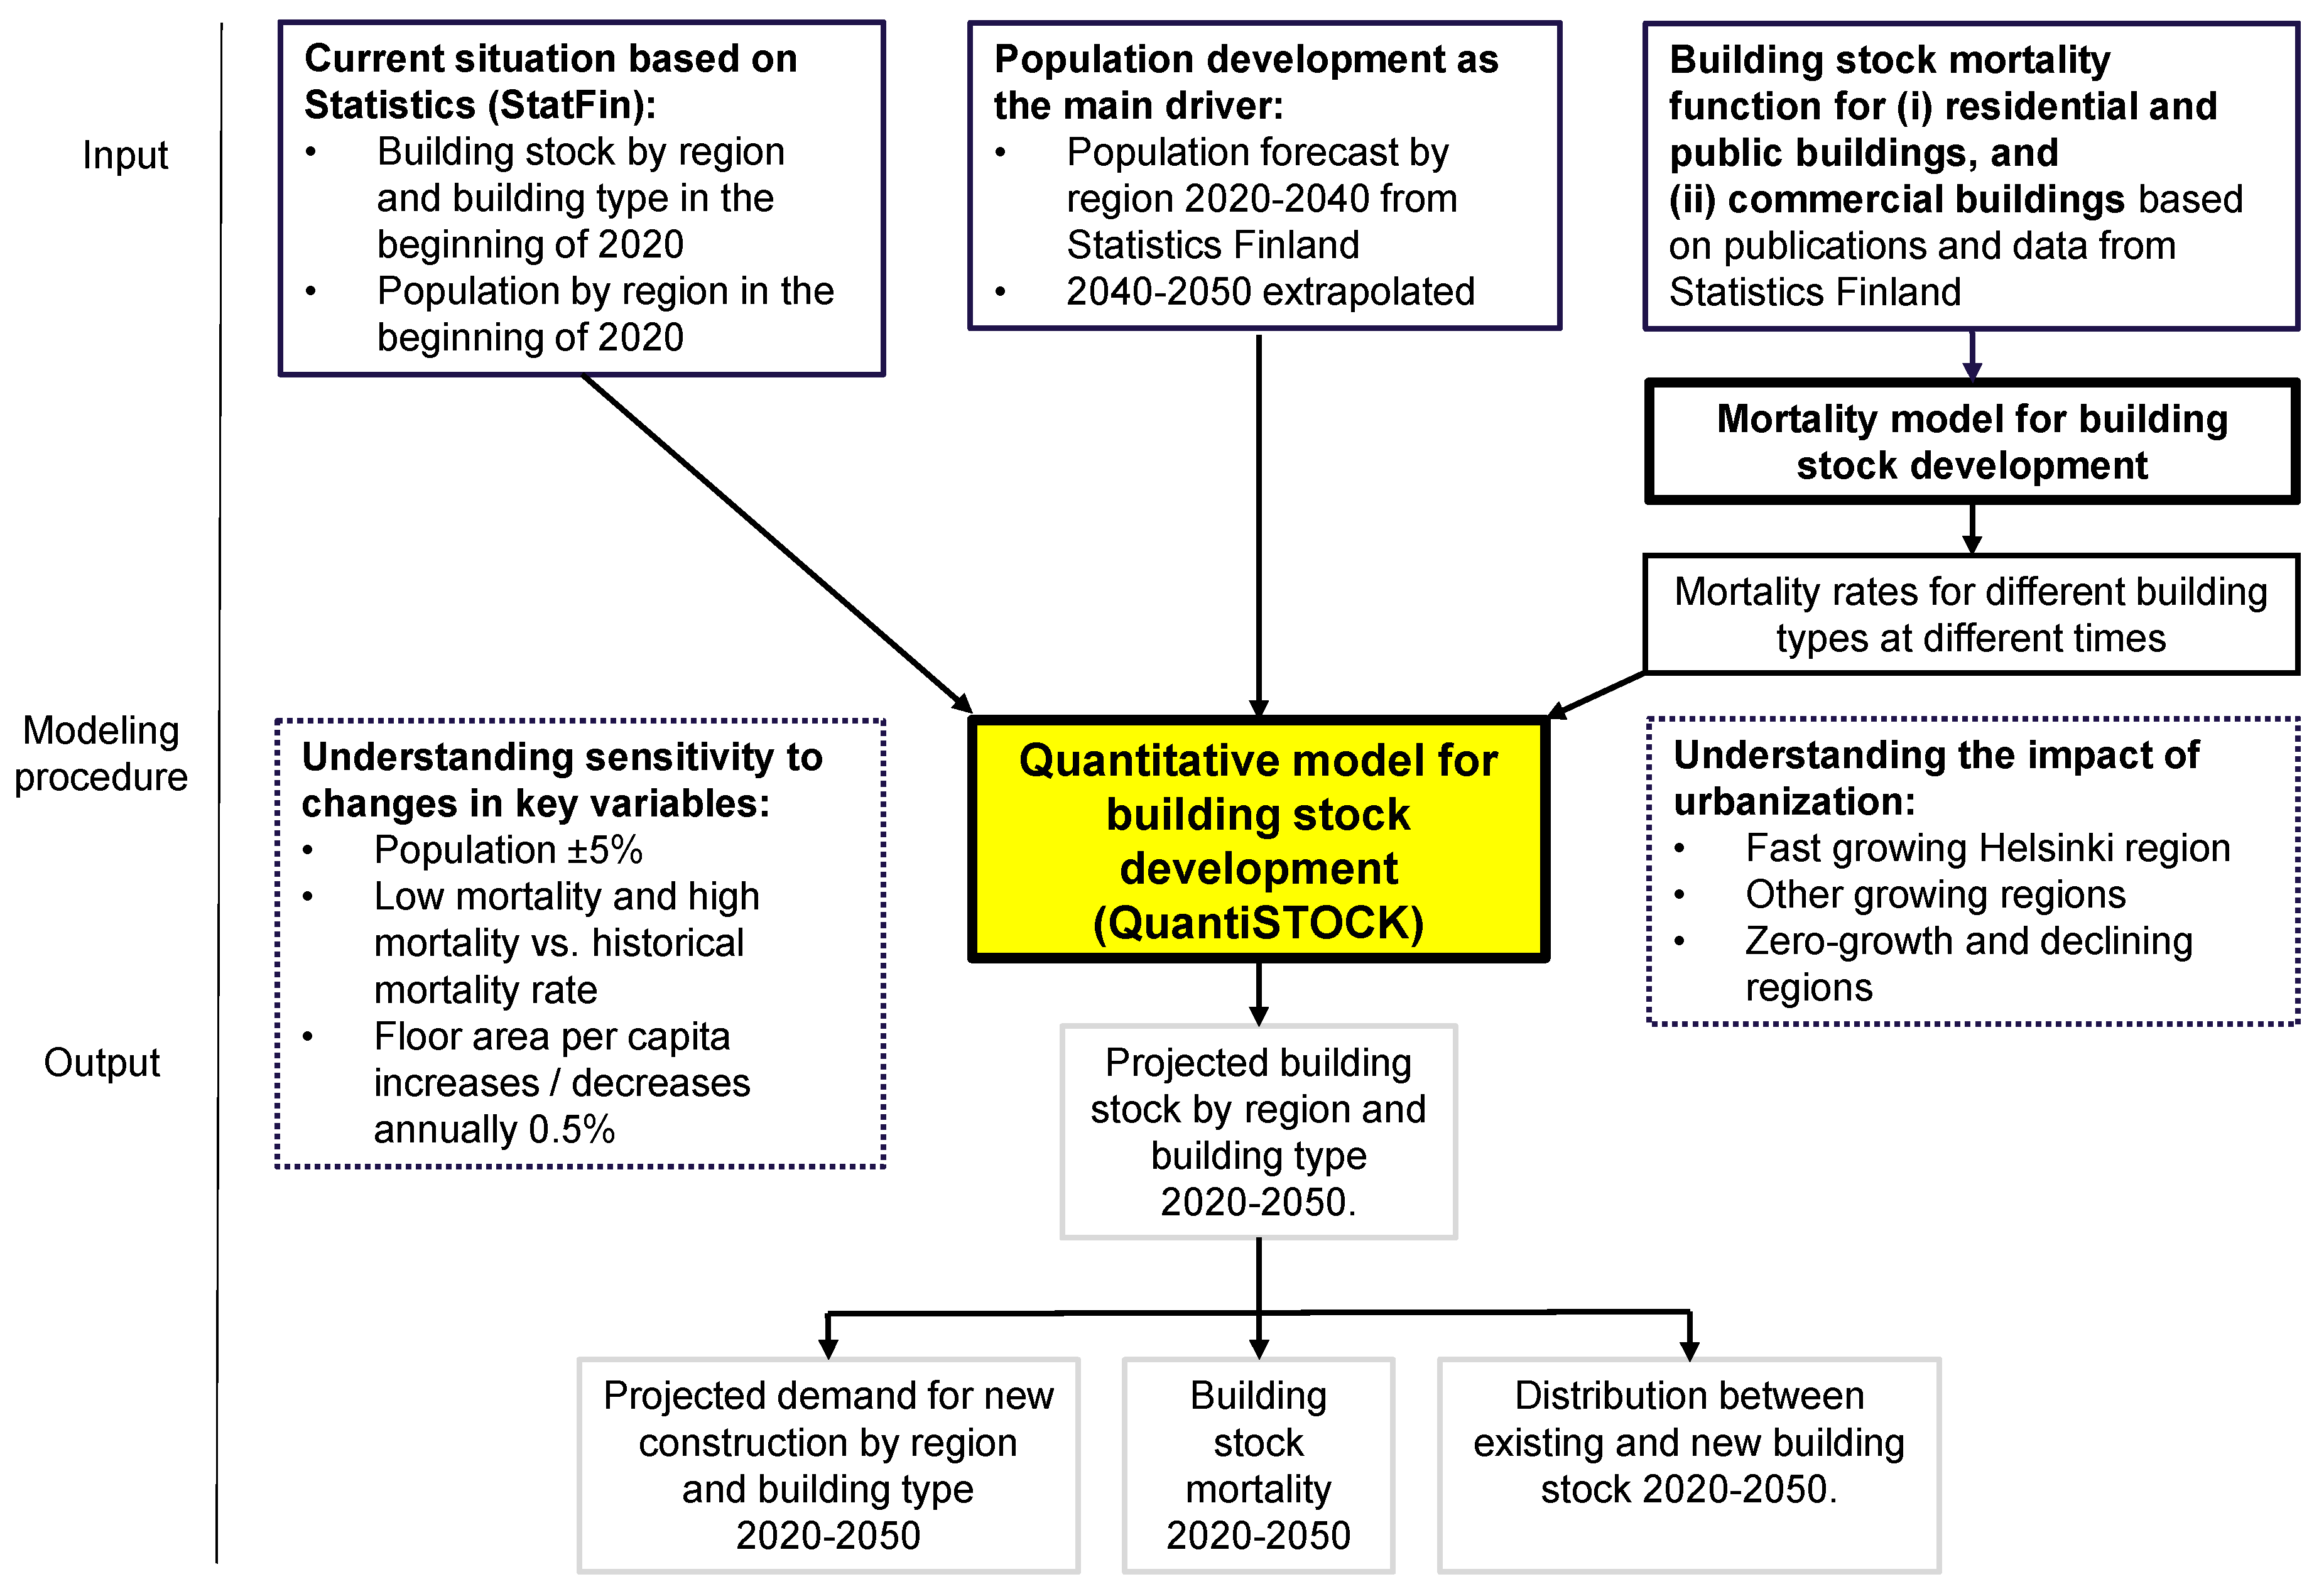
The structure of the QuantiSTOCK modeling approach is presented in
Figure 1. The first step is to define the situation of the building stock at the beginning of the modeling period and then to define the modeling attributes for the future projection. As the modeling parameters are uncertain estimates, sensitivity to their changes is also necessary to be modeled to better understand the boundaries for the actual development. In this study, the sensitivity of building stock development to following key variables is modeled: mortality rate (low, historical, and high), population change (a decrease or an increase of five percent relative to the official population projection), and residential gross floor area per capita ratio (an annual decrease or increase of 0.5 percent relative to that in 2020). The lower and upper limits for the sensitivity analysis are defined by the research group members so that the values should present plausible boundaries for the fluctuation range of the variable. These steps are explained more precisely in the following
Section 3, where a detailed description of the modeling procedure is provided.
As the urbanization trend still strongly affects the development of building stocks, allowing regional level heterogeneity is important. However, due to the high uncertainty of modeling attributes, a too fine-grained modeling approach is not meaningful either. In this study, this has been addressed by grouping the Finnish cities into three groups. The first group only includes the fast-growing Helsinki region, while the second group contains other Finnish cities that are growing but still at a slower pace than the capital region. Those include the regions of Tampere, Turku, Oulu, and Jyväskylä. The third group contains the rest of the cities that are, based on the official population projection, non-growing or declining in the study period. This grouping simplifies the modeling but still allows heterogeneity between the regions that are on different development paths.
As an outcome, the QuantiSTOCK model produces a projection of the building stock development in the study period. In this paper, the projection is presented for the above described grouping of cities: (i) fast-growing Helsinki region, (ii) growing regions, and (iii) zero-growth or declining regions. Moreover, an aggregation of the development of the entire Finnish building stock is presented. In addition to the overall development of the building stock, the outcome includes the projected demand for new construction, volume of building stock mortality, and distribution between the existing and new building stock in the study period of 2020–2050.
3. Modeling Procedure
The main steps of the QuantiSTOCK modeling approach are illustrated in
Figure 1 in the previous section and now follows a more detailed description of the modeling procedure. The starting point for the modeling is the current state of the building stock. In this study, that is the existing building stock in Finland at the beginning of 2020. The building stock data follow the classification of buildings by Statistics Finland [
32]. However, industrial and agricultural buildings are excluded from the model, as due to their heterogeneous nature, modeling attempts would not be meaningful in this context. Other important inputs for the QuantiSTOCK model are the regional distribution of population at the beginning of the modeling period and the regional population projection, which in this study, was available for the period of 2020–2040. To cover the entire study period, the official population projection was extrapolated to reach the end of 2050. The used population projection is described in more detail in
Section 3.1. Moreover, gross floor area per capita ratios are calculated based on the situation at the beginning of the modeling period as more precisely described in
Section 3.1. The raw data for all the above mentioned input data sets were acquired from the StatFin database [
33]. The fourth required input data for the QuantiSTOCK model are mortality rates for different building types, which are defined based on mortality functions that lean on history statistics. As mortality data are not directly available from the statistics, the definition of mortality and creation process of mortality rates are explained in detail in
Section 3.2.
When all input data is available, the modeling procedure may start to model the development of building stock in the study period. First, demand for annual new construction is modeled based on the parameters in Equations (1) and (2):
When demand at the beginning of the year < stock at the beginning of the year:
When demand at the beginning of the year > stock at the beginning of the year:
where annual change in demand = gross floor area per capita ratio × annual population growth + annual change in gross floor area per capita ratio × total population.
Equation (1) is applied when the demand at the beginning of the year is less than the size of existing stock, while Equation (2) is used when the demand at the beginning of the year is greater than the stock at the beginning of the year. Demand is modeled separately for each building type and separately for the three region groups, including (i) the fast-growing Helsinki region, (ii) growing regions, and (iii) zero-growth and declining regions. Furthermore, the regional analysis is also aggregated to describe the development of the entire Finnish building stock.
The next step is to model the size of the building stock at the beginning of next year, which is performed based on the parameters in Equations (3) and (4):
When demand for new housing construction < 0
When demand for new housing construction > 0
Equation (3) is used when there is no demand for new construction, while Equation (4) is applied when demand for new construction occurs. Again, modeling is performed separately for each building type and separately for the three region groups and, in the final stage, the regional results are aggregated to describe the development of the entire Finnish building stock. Next, a more detailed description of the definitions of the modeling attributes follows.
3.1. Population Growth and Gross Floor Area per Capita
In the QuantiSTOCK model, population growth is a main modeling attribute for the demand of residential building stock.
Figure 2 depicts the population projection for the study period of 2020–2050. From 2020 to 2040, it follows the official regional population projection from Statistics Finland while, for the period of 2040–2050, the assumed population growth is extrapolated from the official projection. The impact of urbanization is easy to see in
Figure 2. In 2020, the fast-growing Helsinki region, growing regions, and zero-growth and declining regions accommodate 29%, 21%, and 50% of the population, respectively, while, in 2050, it is projected that the respective proportions are 34%, 23%, and 43%. This should notably affect building stock dynamics within these region groups. However, it is important to notice that, even in declining regions, new construction is needed as the existing buildings do not meet all the demand and migration within regions also occurs. In particular, the ageing demographic structure causes moves from more distant rural locations to more attractive locations that are close to district centers and better services.
Moreover, gross floor area per capita ratio is used to assess how many square meters of each building type are needed. The QuantiSTOCK model operates with gross floor areas instead of more detailed descriptions of building stock units. In the interest of simplicity, this allows for a straightforward approach that still provides important information for multiple purposes. Still, an indicative distribution between (i) detached houses, (ii) semi-detached and row houses, and (iii) apartment buildings is reported based on official statistics, with an assumption that the proportions of these different residential building types are assumed to remain at the same level throughout the study period. However, these distributions are reported for information purposes only and they do not affect the modeling procedure where the possible variation in different types of housing units is included in gross floor per capita ratio. Even if this is the case in the base version of the QuantiSTOCK model, alternative approaches such as using headship rate method (e.g., [
23,
25]) may be incorporated in the model if relevant.
It is also good to notice that, as dwelling densities tend to vary with various factors, such as residential building type and location, we instead use gross floor area ratio per capita as an input in the QuantiSTOCK model. This allows for including uncertainties about various factors into one modeling attribute. Those include changes in residential density and changes in proportions of different residential building types and even potential excess of new construction. In this study, the gross floor area per capita ratio is specified based on the official statistics at the beginning of the study period. For residential buildings, the proportion of gross floor area that is reported to be “non-permanently occupied” is excluded from the ratio. As ratios differ between different regions, a separate ratio is defined for each of the three region types. Furthermore, the ratio is assumed to remain at the same level throughout the study period.
For non-residential buildings, including public buildings and commercial buildings, the gross floor area per capita ratio is specified in the same way as for housing but, with the exception, that the “non-permanently occupied” floor area of public or commercial buildings cannot be distinguished. In the QuantiSTOCK model, different building types are categorized based on the classification of buildings by Statistics Finland [
32]. However, we also include office buildings in the group of commercial buildings while our specification of public buildings includes transport and communication buildings, buildings for institutional care, assembly buildings, and educational buildings.
3.2. Mortality of Building Stock
Mortality rates of the existing buildings are yet another central input for the QuantiSTOCK model. As there are different types of mortality, including (A) demolition, (B) alterations to purpose of use, and (C) merger of spaces, it is important to explain what mortality of building stock means in the context of this paper. As the QuantiSTOCK model operates with gross floor areas, the types of mortality that are included are limited to types A and B. This outline is due to data limitations, as demolition of buildings and alterations to purpose of use are visible in building stock statistics while merger of spaces is not. It is also important to notice that types A and B cannot be separated from each other as only the total changes are reported in the official statistics.
To predict the mortality of the existing building stock, mortality functions were constructed based on the official statistics from Statistics Finland: more precisely, Population and Housing Census reports with ten-year intervals between 1950 and 2000 that were acquired from the Doria repository of Statistics Finland [
34] that is maintained by National Library of Finland, while the latest cross sections for the years 2010 and 2018 were acquired from the StatFIN database [
33]. The collected data account for the size of the stock for different types of buildings by year of building at different cross-sectional years, allowing for construction of separate mortality functions for each classified purpose of use by completion decades. These mortality functions describe the proportion of buildings from their respective decades that still exist at different cross sections of time.
Second, an integrated mortality function for each purpose of use was constructed based on the mortality functions that depict buildings from different decades separately. The first two steps provided information on the differences and similarities between the mortality of different purpose of use classes, allowing further integration of the mortality functions for similarly behaving purposes of use classes. The final integration resulted in two different mortality functions for the entire building stock, including (A) mortality of residential and public buildings, and (B) mortality of commercial buildings (
Figure 3). The figure reveals a faster mortality of commercial buildings relative to residential and public buildings. More precisely, the pace of mortality of commercial buildings rapidly increases after the age of 40, and by the age of 70, the majority of commercial buildings do not exist anymore. At the same time, the lifecycle of residential and public buildings is notably longer.
The middle line (black) in
Figure 3 depicts the statistics-based mortality of buildings. However, there is no guarantee that the mortality rate of building stock in the future should follow this history, which makes sensitivity analysis for alternative development paths necessary. To make the sensitivity analysis meaningful, plausible lower and upper limits for mortality development were defined by the members of the research group. In
Figure 3, the upper line (green) depicts a low mortality scenario and the lower line (red) denotes a fast mortality scenario. By studying these three alternatives, an adequate understanding of the impact of changes within realistic boundaries should be achieved.
The final step is to convert the mortality functions into a usable form in terms of the QuantiSTOCK model. This is done by using a mortality sub-model, where the different variations of mortality functions are combined with the data on the current building stock. To define mortality rates for different building types at different cross sections in the future, the mortality sub-model also incorporates the needed new construction over time. These mortality rates, which are used as an input for the QuantiSTOCK model, are defined separately for (A) residential buildings and public buildings, and (B) commercial buildings. The rates vary between ten-year periods.
3.3. Validation of the Modeling Procedure
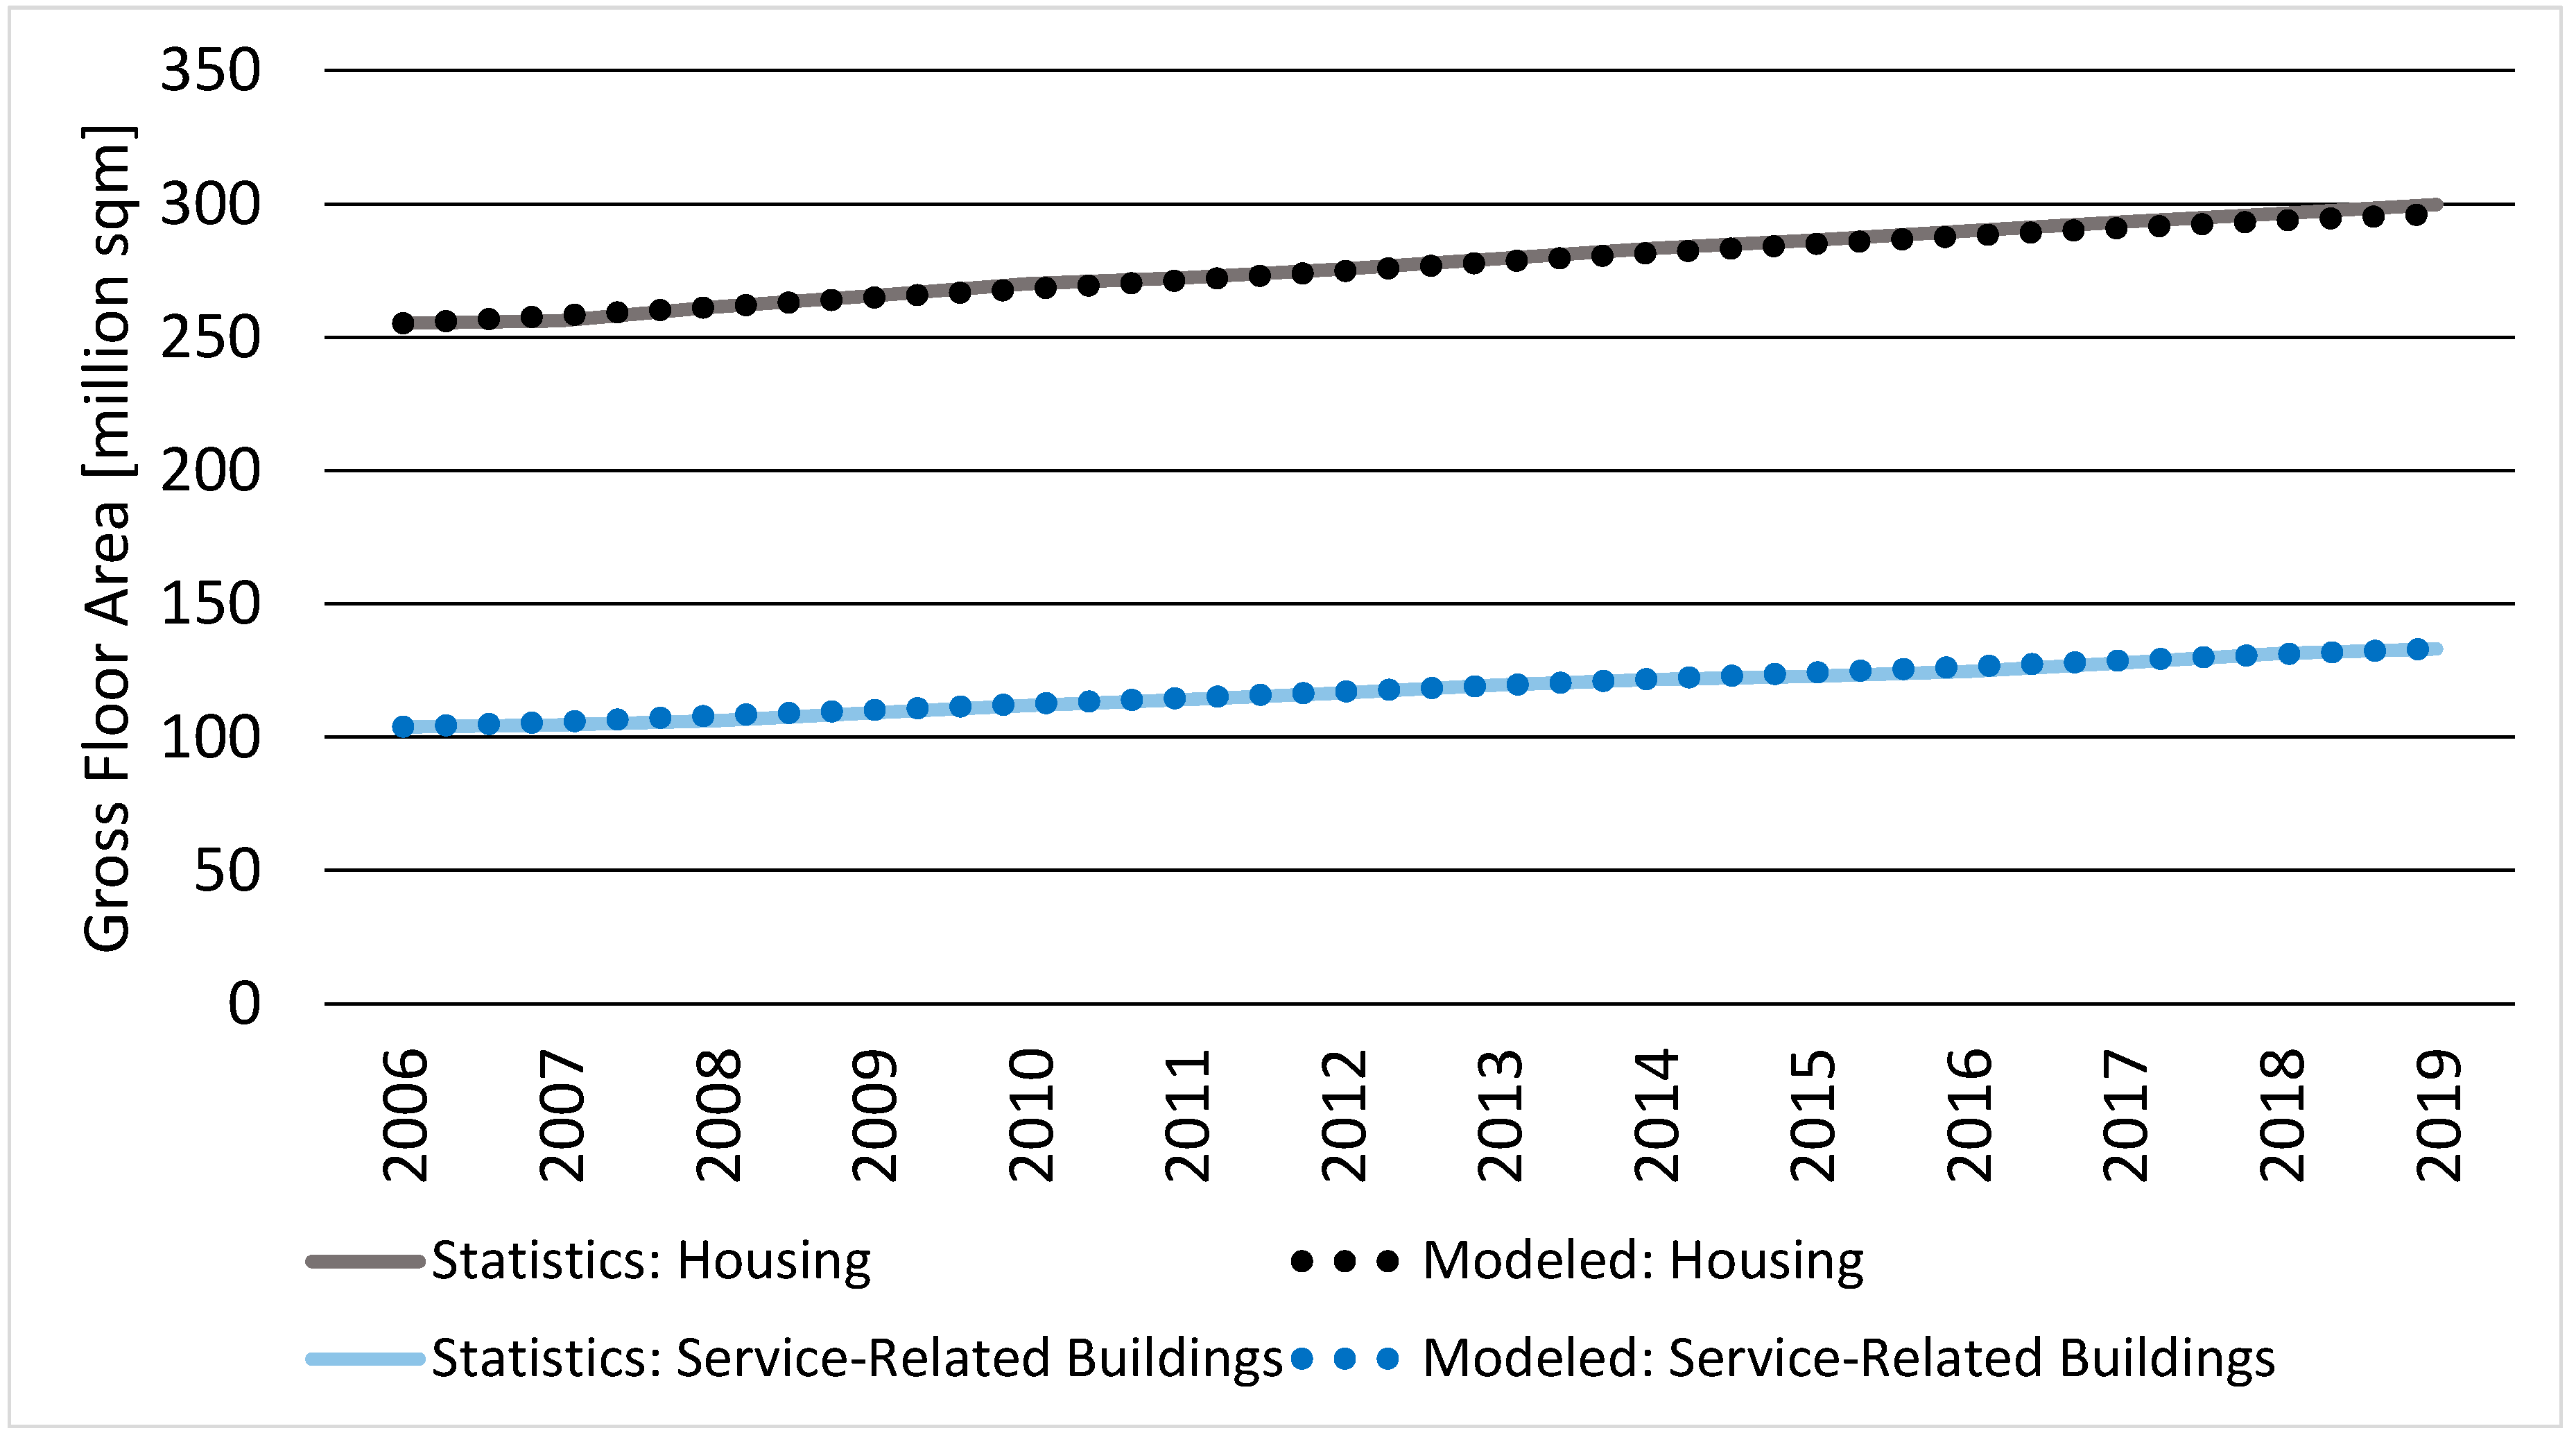
To validate the modeling procedure, development of the Finnish building stock in a past period from 2006 to 2019 was modeled using the QuantiSTOCK model. Then, the modeled results were compared to the building stock statistics for the same period to prove that the outcomes are in the expected range. In the test period, the gross floor area per capita ratio annually increased by 0.8% for residential buildings while the yearly increase of gross floor area for non-residential buildings was 1.7%, which was taken into account in the modeling attributes.
Figure 4 shows that the calculation-based results from the QuantiSTOCK model seem to correspond well with the actual development of the building stock. This proves that the model is capable of producing accurate results, if the modeling attributes are in line with the actual development. However, the challenge here is to be able to assess the real development of modeling attributes. Given that uncertainty is always present in these assessments, the importance of sensitivity checks should be emphasized in an attempt to find the boundaries for real future development.
4. Results
In this section, the modeling results for the Finnish building stock in the period of 2020–2050 are presented. The results are provided for the entire building stock, and regional differences are reported in accordance with (i) the fast-growing Helsinki region, (ii) growing regions, and (iii) zero-growth and declining regions. Moreover, sensitivity to changes in the mortality rate, population growth, and floor area per capita ratio is illustrated.
4.1. Modeled Development of Finnish Building Stock
Figure 5 depicts the modeled development of the Finnish building stock in the period of 2020–2050. The results suggest that, in 2050, less than 25 percent of the building stock is built after 2020. This finding confirms the importance of addressing the existing building stocks in strategies to achieve the EU’s carbon neutral targets by 2050. Another interesting observation based on the results is that the total size of the Finnish building stock will not increase if the population development is in line with the 2019 population projection from Statistics Finland. Instead, a decrease of two percent is modeled relative to the building stock size in 2020.
In
Figure 6, the focus is on a need for new construction over the study period and its distribution into residential buildings and non-residential buildings, including public and commercial buildings. In the study period of 2020–2050, 65 percent of the need for new construction is modeled to be residential buildings, equaling 65 million square meters of gross floor area (if evenly distributed, some 49,000 housing units annually). At the same time, non-residential buildings represent 35 percent of the need for new construction, equaling 35 million square meters of gross floor area.
4.2. Regional Differences
In
Figure 7, the modeled development is presented separately for the three different region groups, including (a) the fast-growing Helsinki region, (b) growing regions, and (c) zero-growth and declining regions. This more fine-grained representation reveals clear differences between the region groups, making the interpretations more meaningful. The modeling reveals that building stock is growing by 17 percent (19 million square meters of gross floor area) in the fast-growing Helsinki region and by 6 percent (5.5 million square meters) in other growing regions, while in zero-growth and declining regions, the total stock decreases 14 percent (33 million square meters). Despite the decreasing total stock, new construction is also needed in the zero-growth and declining regions due to migration from more distant locations to district centers, where the ageing population has better access to services, increasing demand for housing in regionally central locations.
Figure 8 reveals the distribution of the modeled new production into residential and non-residential buildings. In the fast-growing Helsinki region, the proportion of residential new production is 65 percent, equaling 33 million square meters of gross floor area (some 25,000 housing units annually). In the group of other growing regions, the proportion of new residential building production is 68 percent, equaling 19 million square meters of gross floor area (some 14,000 new housing units annually). In the zero-growth and declining regions, the proportion of residential buildings is 62 percent, equaling 13 million square meters (some 10,000 new housing units annually).
4.3. Sensitivity Analysis
As modeling of future development always leans on assumptions, it is important to recognize the key variables and explore how the modeling results are affected if values of these variables vary. This kind of sensitivity analysis allows a better understanding of the boundaries for actual development as modeling only one potential development scenario could result in faulty conclusions. Below, the sensitivity of building stock development to mortality rate, population change, and residential gross floor area per capita ratio is illustrated, ceteris paribus.
4.3.1. Sensitivity to Mortality Rate
Figure 9 depicts the impact of mortality rate on the development of building stock. The panels reveal that mortality rate has a notable impact on the structure of the future building stock. Specifically, in the low mortality scenario, the proportion of new construction since 2020 is 13 percent; in the history-based scenario, it is 23 percent; and in the high mortality scenario, it is 35 percent of the stock. However, based on the results, changes in the mortality rate alone do not seem to affect the total size of the building stock but the size of the stock is the same in all three scenarios at the end of the study period. This is because of the assumption that all mortality has to be replaced with new production within the region. The reasoning behind this is that, if this proportion of the building stock was an essential part of accommodating residents in the region before its mortality, these people need a place to live after the mortality as well if population growth is not negative. Whereas the total size of the building stock starts decreasing, if the population growth turns negative. Then, only the proportion of mortality that has a demand in the market is replaced with new production.
4.3.2. Sensitivity to Population Growth
In
Figure 10, the impact of changes in population growth is illustrated. The middle scenario (b) is based on the official population projection from StatFIN database [
33], and sensitivities to a decrease and an increase of 5 percent (approximately 270,000 residents, equaling to some 9000 residents annually if evenly distributed over the study period) are modeled in scenarios (a) and (c). The figure reveals that the impact is notable on both new production and the total size of the building stock. The total size of the stock is 6 percent (27 million square meters) smaller in 2050 than in 2020 in scenario (a), a little less than 2 percent (8 million square meters) greater in scenario (b), and over 2 percent (11 million square meters) greater in scenario (c). At the same time, the respective proportions of new production since 2020 at the end of the study period are 19 percent, 23 percent, and 28 percent, of which the proportion of housing is some 65 percent in all scenarios.
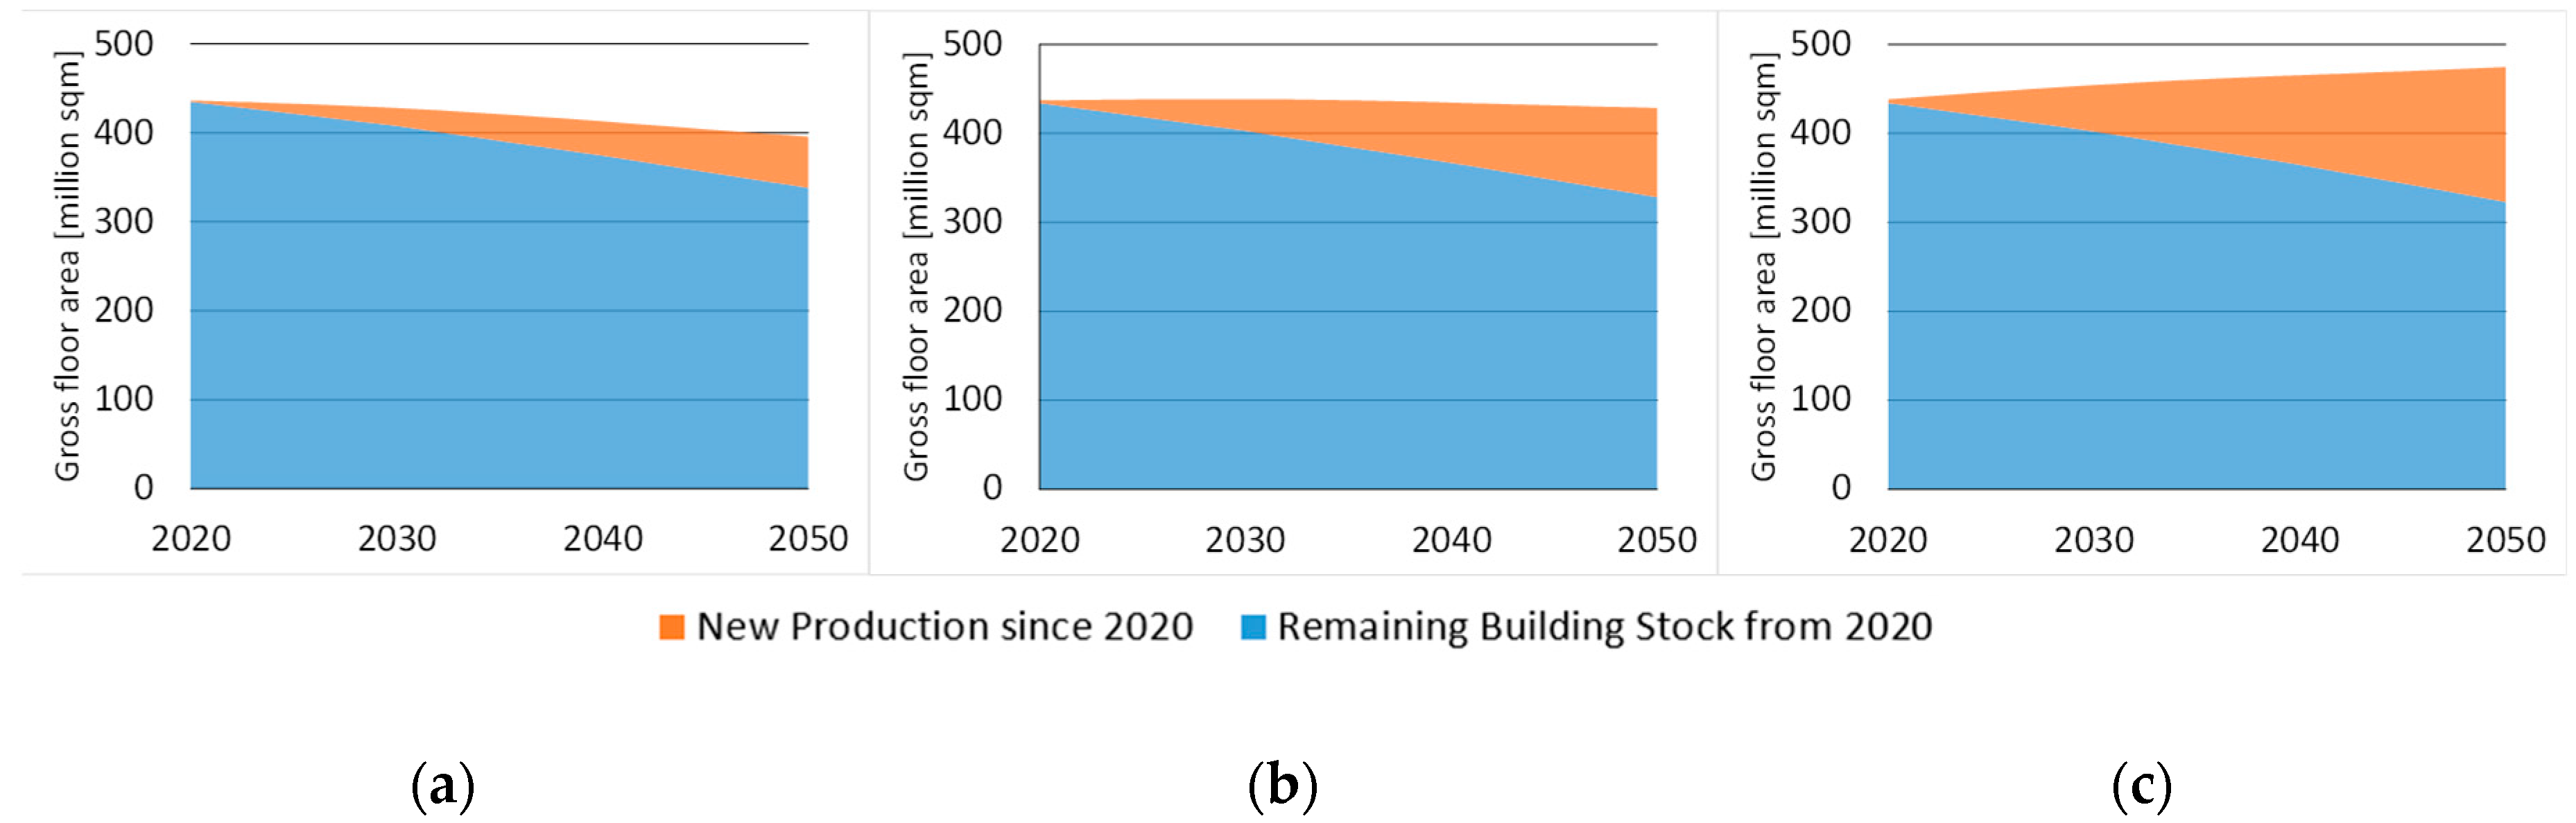
4.3.3. Sensitivity to Residential Gross Floor Area per Capita
Finally,
Figure 11 illustrates the sensitivity to changes in residential gross floor area per capita ratio that captures several overlapping processes, including but not limited to changes in residential density and distribution of housing types, and potential excess of new construction. In scenario (a), the residential gross floor area per capita annually decreases by 0.5 percent; in scenario (b), the ratio remains the same as is in 2020 throughout the modeling period; and in scenario (c), the residential gross floor area per capita ratio annually increases by 0.5 percent. The figure reveals that the impact is notable on both new production and the total size of the stock. The total size of the stock in 2050 is modeled to be 9 percent (41 million square meters) smaller, 2 percent (8 million square meters) smaller, and 8 percent (36 million square meters) greater than the total stock size in 2020 in scenarios (a), (b), and (c), respectively. At the same time, the proportion of new production since 2020 in the respective scenarios is 15 percent, 23 percent, and 32 percent, of which the proportion of residential buildings is 38 percent, 65 percent, and 77 percent in scenarios (a), (b), and (c), respectively. The proportion of residential buildings since 2020 varies notably between the scenarios, as only residential gross floor area per capita ratio is changed, while the ratio for non-residential buildings remains the same. Changing gross floor area per capita ratios for both residential and non-residential buildings at the same time would not be meaningful, as the ratios may develop towards opposite directions, making scrutinizing only one change at a time more informative.
5. Discussion
In this paper, we introduced a calculation-based model for modeling the quantitative future development of building stocks in the long-term. The previous literature covers various ways to describe the current state of the building stock, including approaches that are based on constructed building archetypes [
7], sample buildings [
8], synthetic microdata [
9], and agent-based building stock model [
10]. Moreover, there are numerous papers where advanced forecasting approaches have been applied to produce short- or medium-term forecasts, for example, on construction demand. These approaches include but are not limited to multiple regression analysis [
14], a panel vector error correction model [
15], a combination of neural networks and genetic algorithms [
16], grey forecasting [
17], and Box–Jenkins model [
18]. As our focus is on long-term modeling, the most closely related studies lean on material flow analysis [
19,
20,
21] and various assessment approaches to forecast long-term housing needs [
22,
23,
24,
25,
26,
27,
28,
29,
30]. However, these most closely related studies are usually limited to projections of housing stocks while other building types are excluded from the analysis. The presented QuantiSTOCK model provides a novel contribution to sustainable management of building stocks by combining approaches akin to what has been presented on dynamic material flow analysis in [
21], on the assessment of housing needs in [
23,
25], and on mortality analysis in [
11]. In addition to residential buildings, as opposed to the previous literature, the QuantiSTOCK model also covers other building types. The only excluded building categories are industrial and agricultural buildings as their heterogenic nature would make modeling highly uncertain.
The base version of the QuantiSTOCK model operates in gross floor area units and provides a relatively straightforward calculation-based approach to model future development of building stocks, where (1) population growth, (2) mortality of existing buildings, and (3) gross floor area per capita ratio are the three main drivers for quantitative changes in the building stock. The population growth input is directly based on the official population projection from the StatFIN database [
33]. Regarding mortality, the compiled mortality functions are akin to the survival functions in [
11], but in our simplified approach, we do not apply any mathematical equations but the curves are rather visually fitted based on the points from history statistics. Next, curves that are relatively similar to each other were merged, which in this study resulted in separate mortality curves for (i) residential and public buildings, and (ii) commercial buildings. Finally, taking also into account the current state of building stock and cumulative need for new construction, the mortality curves are translated into mortality rates. These mortality rates vary with time as the building stock evolves. These rates provide a statistics-based base scenario for the analysis, which is complemented with low and high scenarios that provide boundaries for the range of variation.
In terms of gross floor per capita ratio, it is important to notice that this ratio is a multifaceted modeling attribute that captures many overlapping processes, including but not limited to changes in residential density and distribution of housing types, and potential excess of new construction. Thus, using gross floor area per capita ratio differs from using residential density as a modeling attribute instead. For example, urbanization trends contribute to an increasing proportion of apartment buildings where residential densities tend to be lower than in single-family houses. Additionally, as a result of increased housing prices in urban centers, more and more people may still prefer good locations but choose to consume less floor area, which also leads to lower gross floor area per capita ratio. On the other hand, if excessive new construction occurs in an area, it may seem that residential density has increased. However, in such a case, the actual reason for the higher gross floor area per capita ratio—or at least part of it—would be that more new construction has been delivered to the market in relation to the number of new residents who have moved in. Thus, it is important to properly consider which factors may affect gross floor area per capita ratio in each case. Relative to the methods in assessing housing needs in [
23,
25], our base modeling approach is a simplified version as QuantiSTOCK does not take into account headship rates for different groups. However, we recognize that this may be necessary for some analyses, for example, if the data allows a more detailed analysis for different age cohorts or the number of housing units is of a particular interest. To address these potential needs, the QuantiSTOCK model is easily modifiable to include such an alternative modeling approach. Another distinct advantage of the QuantiSTOCK approach is that it relies on publicly available statistics, making it easy to update the model when new statistics becomes available. Of course, this is limited to locations where public high-quality data are available. Otherwise, it is advisable to use self-compiled data that is tailored for the analysis. In cases where high-quality data are easily accessible, application of the model only requires relatively little effort, as opposed to more complicated simulation approaches. It is also critical to understand that, because of the great uncertainty about the predictor attributes in the long-term, it is not self-evident that application of more complicated approaches would results in more accurate outcomes than the outcome from this stripped-down model. This is supported by Boverket [
25] who reports that Schmuecker [
31] obtained similar results using a simpler method compared to more advanced approaches used in England. Another important aspect in using a relatively simple approach is that it allows one to transparently put into perspective which factors are important relative to the big picture. In contrast, complicated modeling approaches may focus on complicated descriptions of the modeling procedure, leaving an actual understanding of the critical factors blurred.
The QuantiSTOCK model seeks to provide a simplified and transparent modeling approach that is easy to understand. In this paper, we use “demand for new construction” and “need for new construction” as synonyms. The demand is considered here as objectively assessed need for new construction that is required to address changes in demographics and building stocks. In other words, the definition for demand is broader than the strict traditional definition in economics. As long-term projections even at the best include a great amount of uncertainty, the focus here is rather on major lines than in trifling matters. It is still good to bear in mind that a simplified approach always requires choices and approximations that may also hide some critical aspects. Therefore, it is critical to understand the impact of the incorporated assumptions as well as to perform adequate sensitivity checks for the development of key modeling attributes. In this study, the research group members defined together the sensitivity checks for our analysis on the Finnish building stock. The challenge in this strategy is to be able to define lower and upper limits for the modeling attributes so that they provide proper boundaries for actual development. In order to succeed in setting these proper limits, expertise in the field of a built environment is necessary and the modeling results are only reliable if the interpreters understand the underlying assumptions. Still, any “black box” approaches do not solve this problem either, as they only tend to increase the risk of unexplainable and unreliable modeling results. However, we recognize that, in some contexts, it may be necessary to increase the degree of complexity in the QuantiSTOCK modeling procedure, for example, to better understand the impacts of changing demographics. It is also important to understand that economic conditions and restrictions from land use planning notably affect the volume and structure of new construction that occurs in real world.
6. Conclusions
The QuantiSTOCK model is particularly developed for modeling the development of the Finnish building stock, which was used as a development and test arena in this study due to the good availability of high-quality data. However, this relatively simple modeling approach may also be widely applied to other geographic locations when fitted for location-specific data. By being transparent, the model provides fruitful grounds for understanding the impact of different key variables. This is necessary to allow more reliable analyses on the built environment and to facilitate meaningful debate on different housing, land use, and environment-related policies. As the proposed model is relatively easily modifiable, we consider it to have a great potential to be widely applied in various fields.
The modeling using Finnish data revealed that, in the study period of 2020–2050, the total size of the Finnish building stock will not be growing and the size of the stock may even slightly decrease if the population growth is in line with the official population projection; 65 percent of the new production in the study period is modeled to be residential buildings. However, the proportion of buildings that are built since 2020 is less than 25 percent in 2050, which once again is a reminder that measures addressing the existing building stock are critical in an attempt to achieve the EU’s carbon neutral targets.
Further examination of the modeling results by region type reveals notable regional differences in the building stock development, confirming the high impact of urbanization. In the fast-growing Helsinki region, other fast-growing regions, and zero-growth and declining regions, the percentage changes of the total building stock size in the period of 2020–2050 are 17 percent, 6 percent, and −14 percent, respectively. However, the decreasing stock size does not directly mean that there is no need for new construction but that migration within these regions from more distant locations to district centers increases the demand in regionally central locations even when the total size of building stock in the region is decreasing.
Due to the uncertainty in modeling future development, sensitivity checks to changes in key modeling attributes are necessary to understand the boundaries of actual building stock development. The sensitivity analysis demonstrated that mortality rate has a notable impact on the structure of the future building stock, as proportions of new construction since 2020 varied from 13 percent to 35 percent. Also, a decrease or an increase of 5 percent (some 270,000 people) in the projected total population for 2050 had a clear impact on building stock development as the proportion of new production in 2050 varied between 19 and 28 percent and the size of the total stock varied between −6 and 2 percent. Furthermore, residential gross floor area per capita ratio was observed to have a high impact on the modeling outcome both in terms of new production and the total size of the stock. An annual decrease and increase of 0.5% in residential gross floor area per capita ratio resulted in the total size of the building stock in 2050 varying between −9 percent and 8 percent relative to the beginning of the study period. At the same time, the proportions of new construction since 2020 varied between 15 and 32 percent.
The introduced QuantiSTOCK model may be extended in numerous ways, and it lays the groundwork for modeling the future developments of building stocks. Some potentially fruitful strands for future work that could help develop the QuantiSTOCK model should be, for example, (i) a more detailed study on the dynamics of building stock development at different scales, (ii) the impact of local conditions on building stock development, (iii) the impact of municipal land use planning on building stock development, (iv) a further and more robust validation of the model using longer time horizon and data from other countries, (v) mortality differences between owner-occupied and rental buildings, and (vi) recognizing if construction techniques and materials have an impact on mortality. Nevertheless, already, today’s version of the QuantiSTOCK model may be used in a wide range of analyses ranging from assessing housing demand at the regional level to providing input for defining sustainable pathways towards climate and land use targets. Thus, the results should be of interest to a wide range of researchers, policymakers, and community stakeholders who contribute to creating better built environments.


