Article

Effect of Green Construction on a Building’s Carbon Emission and Its Price at Materialization

1
School of Civil Engineering and Architecture, East China Jiaotong University, Nanchang 330013, China
2
Department of Civil Engineering, Zhejiang University, Hangzhou 310058, China
*
Authors to whom correspondence should be addressed.
Sustainability 2021, 13(2), 642; https://doi.org/10.3390/su13020642
Submission received: 4 December 2020 / Revised: 29 December 2020 / Accepted: 5 January 2021 / Published: 12 January 2021

Abstract

:
Buildings consume many resources and generate greenhouse gases during construction. One of the main sources of greenhouse gases is carbon emission associated with buildings. This research is based on the computing rule of carbon emission at the materialization stage. By taking the features of green construction into consideration, quantitative analysis on construction carbon emission was undertaken via Life Cycle Assessment (LCA). Making use of Vensim (a system dynamics software package), we analyzed the amount of carbon emission at the materialization stage and determined the major subsystems affecting the carbon emission, then took into comprehensive consideration the differences of each subsystem’s carbon emission under different construction technologies. Under the mechanism of carbon trade at the materialization stage, the total price of carbon trades remains unchanged, while the trading price of each subsystem is adjusted. Under these conditions, a coefficient for step-wise increases in carbon price was proposed. By establishing such a system of gradient prices, construction companies are encouraged to adopt high-efficiency emission reduction technologies. Meanwhile, the system also provides a reference for the formulation of price-based policies about buildings’ carbon trading, and accelerates the process of energy conservation and emission reduction in China and the world at large.

1. Introduction

The construction industry has boosted the development of the national economy at the expense of consuming a great quantity of natural resources and causing severe environmental pollution. China, as a big CO2 (carbon dioxide) producer, is now facing pressure to reduce emissions. Under the Paris Agreement, it was proposed to limit the global temperature rise to no more than 2 °C [1]. In 2018, the 6th Comprehensive Report of IPCC pointed out that the average global temperature over pre-industrial levels had already increased by 1 °C from 0.69 °C [2,3] in 2014. These data indicate that more work should be done to push forward emission reduction. The huge global climate changes resulting from emission of greenhouse gases draws extensive attention from the international community. About 40% of energy annually consumed in the world is related to the construction industry. The amount of CO2 produced by the construction industry accounts for 36% [4] of the global total. According to data from the 2018 China Statistical Yearbook, coal consumption in the construction industry was about 75.196 million tons (standard coal equivalent), an increase of 1.77% compared to the previous year. Additionally, building-construction-related energy consumption accounted for 20 to 30% of total energy consumption, exceeding the proportions of both industry and transportation consumption. China’s carbon emissions are the largest in the world [5,6]. At the opening ceremony of the 21st UNCCC in Paris, President Xi announced that China would reach peak CO2 emission in around 2030. In the new landscape featuring harmonious development of people and nature, it is of key significance to take effective measures to reduce greenhouse gas emissions in the construction industry.
Since the 1990s, the assessment of buildings’ carbon emission and its environmental impact is one of the hot spots for today’s energy conservation and emission reduction agenda [7,8,9]. A large number of studies were conducted on the carbon emissions of buildings and the impact on the ecological environment at home and abroad. In terms of the carbon emission inventory framework system, the main focus is on life cycle impact assessment (LCA). Research into a buildings’ carbon emission and its effect on the environment is common—at present, there are four methods of calculation of CE, including the field measurement method, method of balance calculation between materials and products, emission coefficient method, and the model method [10]. Among these methods, the emission coefficient method is the most common. Li et al. [11], based on a footprint assessment standard, first proposed the use of a measurement model for carbon emission from building construction with the help of BIM (Building Information Modeling) and other relevant software. Yu et al. [12] concluded that, according to the life cycle theory residential buildings’ carbon emission exert a greater effect on the environment during operation and maintenance as well as at the materialization stage. Zhang et al. [13,14] defined the accounting scope of a buildings’ life cycle carbon emission based on the LCA theory. They also clarified the essence of low-carbon buildings, by conducting inventory analysis on carbon emission in different stages of a building’s life circle, such as the materialized stage (construction process), the operation stage, the demolition stage, and the disposal stage. Wang et al. [15,16] first put forward a calculation model for calculating a building’s carbon emission in its building stage. This model was based on the basic norm of shift consumption per unit work volume and energy consumption per shift of shift cost norm in construction machines. Based on the LCA method, Gong et al. [17] evaluated the influence of three kinds of residential buildings on the environment. These three structures are the Beijing CFC, SFC, and WFC. The research results demonstrated that the main emission source of CO2 is power consumption. All studies mentioned above can precisely calculate a building’s carbon emission at the materialized stage; however, the modeling and calculation process in these studies are complicated.
As an important market mechanism for controlling greenhouse gas emission, the carbon emission right trading is under implementation around the world. As carbon emissions are unavoidable during the construction phase of buildings, in response to the global low-carbon environmental protection order, the carbon emission trading system is used to control the carbon emissions generated during the materialization stage. The carbon emission policies are established according to resource allocation. These policies can encourage construction companies to make innovations around energy conservation and take relevant measures in construction processes to lower carbon emission. In 2002, the UK pioneered the world’s first inter-enterprise carbon emission right trading system. Later in 2005, the EU established the first transnational system, EUETS (EU Emission Trading Scheme), providing important data and guidance for carbon emission trading on a global scale. Following the EU, the United States, Japan, and Australia started their own carbon emission trading systems. Similarly, China started its own carbon emission trading pilot in 2013. China officially launched carbon emission rights trading market in December 2017 [18]. Gao et al. [19] studied the determination and trading of carbon emission rights for green buildings. Zhao et al. [20] showed that the price of carbon-labeled products has a significant impact on consumers’ purchasing behavior. Haites [21] indicated that carbon tax needs to be adjusted according to economic fluctuations for controlling carbon emissions. In general, when the building is of a different structural form, made of different items, or under different climate conditions, most studies on the building’s carbon emission mainly focus on three aspects. First, the definition of the carbon emission calculation method; second, the application of the calculation method; third, the emission reduction potential. These studies fail to explore the interaction between the building’s carbon emission and the existing carbon emission rights trading market. This article, based on the theories and methods of system dynamics, divided the materialized stage into six subsystems. Under the LCA theory, the carbon emission coefficient method is used with the aid of the system dynamics software Vensim, to analyze the carbon emissions during the building phase, and determine the main subsystems that affect carbon emissions. With the help of proprietary software, the amount of carbon emission at the materialization stage was analyzed and the subsystems that influenced the total carbon emissions the most were identified. Additionally, we compared and analyzed carbon emission amounts of all subsystems in common construction and in green construction. Furthermore, strategies and calculation methods involving step-wise increases in carbon prices in a bid to reduce carbon trading cost of construction companies and to lower carbon emission during construction, are discussed.

2. Calculation of Carbon Emissions at the Materialization Stage

2.1. Framework for Estimating Carbon Emissions

LCA refers to an assessment product, process, or activity [22]. It is a process covering the whole life cycle such as—raw material collection, production, transportation, sales, usage, reuse, maintenance, and final disposal [23,24]. LCA is widely used for calculation of carbon emission in energy research and the construction industry [25]. There are two main approaches to LCA—process-based LCA (bottom-up) and LCA (top-down) based on input–output analysis [26]. The former LCA involves a detailed understanding of construction information, such as material use and production efficiency. For this reason, this LCA can be adopted to analyze specific technologies that affect energy consumption during construction [27,28,29]. In this article, the life cycle assessment method is used to divide a series of states of a building in the materialization stage into different stages. According to GB/T24040-2008 Environmental Management—Life Cycle Assessment—Principles and Framework National Standard Understanding, the research can be divided into four stages [30]; shown in Figure 1.
The first stage involves determination of purpose and scope. The system boundary of the construction stage should be determined and relevant data in each link of a production process should be collected. The second stage entails inventory analysis—classification, compilation, and quantification should be conducted on input energy and resources, and output pollution of the targeted products during the whole life cycle. The second stage entails inventory analysis—classification, compilation, and quantification should be conducted on input energy and resources, and output pollution of the targeted products during the whole life cycle. The fourth stage summarizes the results. Data pertaining to the inventory analysis and environmental influence should be summarized and a qualitative carbon price should be determined.

2.2. Modeling CO2 Emission in Each Subsystem

CE refers to emissions of some of the most harmful greenhouse gases, mainly CO2, including CH4 and N2O. However, because each gas has a different potency, or “warming” effect on the atmosphere, a factor (CE factor) is applied to convert it to the carbon dioxide equivalent [31,32]. The CE factor refers to the generated amount of greenhouse gas accompanied by the consumption of unit mass material or energy. It is an important parameter representing the CE characteristics of a certain material or energy [33,34]. This article aims to compare the carbon emissions of different construction processes in the building materialization stage, so the measurement of carbon emissions ranges from the entry of building materials to the completion of construction. In this paper, according to the CECS 374:2014 Standard for Measuring, Accounting and Reporting of Carbon Emission from Buildings, the carbon emission factors of common energy are listed Table 1.
According to the construction processes and contents at the materialization stage, systematic analysis was adopted to classify the construction system into six subsystems—decoration engineering, structural engineering, on-site transport, foundation engineering, installation engineering, and construction site facilities. The CO2 emissions from each subsystem was studied, then synthesized into the CO2 emissions at the materialization stage (Figure 2).

2.3. Calculation of Carbon Emission at the Materialisation Stage

At the materialization stage, carbon emission units include transportation of construction materials, components, parts and equipment, operation of construction machines and tools, and the on-site office. At the materialized stage, measurements and calculations could be done according to regulations, as follows [34].
The fuel consumption for the transportation of materials, components, parts and equipment was calculated according to Formula (1).
D y s = i = 1 n G i Z G i × L i × Q s i
where Dys is the total fuel consumption for the transportation of materials, components, parts, and equipment (t); Gi represents the total consumption of materials, components, parts, and equipment of type i (t); ZGi is the average carrying capacity of the vehicle used to transport type i materials, components, parts, and equipment (t); Qsi is the unit fuel consumption of the vehicle used to transport type i materials, components, parts, and equipment (t/km); and Li is the distance of transportation of type i materials, components, parts, and equipment (km).
Power consumption associated with the operation of the construction machines and tools calculated by Formula (2)
D j d x = i = 1 n P d i × T d i × N i
where Djdx is the total power consumption of construction machines and tools (kW∙h); Pdi is the electric power of type i construction machines and tools (kW); Tdi is the operating hours of type i construction machines and tools (h); and Ni is the number of type i construction machines and tools (units).
Fuel consumption of the operation of the construction machines and tools was calculated by Formula (3).
D j x y = i = 1 n P y i × T y i × N i
where Djxy is the total fuel consumption of construction machines and tools (t); Pyi is the average fuel consumption of each type i construction machines and tools per shift (t/shift); and Tyi is the number (shifts) of type i construction machines and tools under operation.
Water consumption associated with the operation of the construction machines and tools was calculated by Formula (4).
D j x s = i = 1 n P s i × T s i × N i
where Djxs is the total water consumption of construction machines and tools (t); Psi is the average water consumption of each type i construction machines and tools per shift (t/shift); and Tsi is the number (shifts) of type i construction machines and tools (time).
Power consumption on the work site of the construction was calculated by Formula (5).
D b g d = i = 1 n P d i × T d i × N i
where Dbgd is the total power consumption of on-site office work (kW h); Pdi is the electric power of type i electric equipment for on-site office work (kW); and Tdi is the operating hours of type i electric equipment for on-site office work (h).
During the building construction stage, the total carbon emission from buildings was calculated by Formula (6).
E s g = i = 1 n D s g d i × E F d + i = 1 n D s g y i × E F y + i = 1 n D s g m i × E F m + i = 1 n D s g q i × E F q + i = 1 n D s g q t i × E F q t + i = 1 n D s g s h i × E F s h
where Esg is the carbon emission from buildings during building construction (tCO2); Dsgd is the power consumption of the unit processes during building construction (kW); EFd is the carbon emission factor of electricity [tCO2/(kW h)]; Dsgy is the fuel consumption of the unit processes during building construction (t); EFy is the carbon emission factor of fuel (tCO2/t); Dsgm is the coal consumption of the unit processes during building construction (t); EFm is the carbon emission factor of coal (tCO2/t); Dsgq is the water consumption of the unit progresses during building construction (t); EFq is the carbon emission factor of coal (tCO2/t); Dsgsh is the water consumption of the unit progresses during building construction (t); and EFsh is the water carbon emission factor (tCO2/t).

3. Overview: A Case Study

This study took a single teaching complex building in Wuhan as a case to calculate its carbon emission at the materialization stage. This project was located east of Huangjiahu Avenue, Jiangxia District, Wuhan, south of Wangjiaju; west of Dahualing Road, and north of Huyun Road. It included one building for the sales department and exhibition area, one independent shop, seven foreign-style houses, seven villas, four high-rise buildings, and supporting shops along the street. The total construction area was about 206,361 m2, with about 143,800 m2 of above-ground construction and 62,561 m2 of underground construction. Among them, A3 had a total construction area of about 74,496 m2, with an above-ground construction area of about 55,000 m2, the underground construction area of about 19,496 m2. A4 had a total construction area of about 131,865 m2, with an above-ground construction area of about 10,880 m2, and an underground construction area of about 43,065 m2. As shown in Figure 2, the main teaching building in A4 in this case was taken as the subject. The construction of the main teaching building is summarized in Table 2.

4. Discussion

4.1. Carbon Emissions during Construction

Quantity data for all subsystems come from the construction budget. Using the calculation (Section 2.3) mentioned above, the carbon emission of each subsystem was analyzed. With the help of Vensim (proprietary software), the carbon emissions of the six subsystems at the materialization stage were calculated. The results are shown in Table 3.

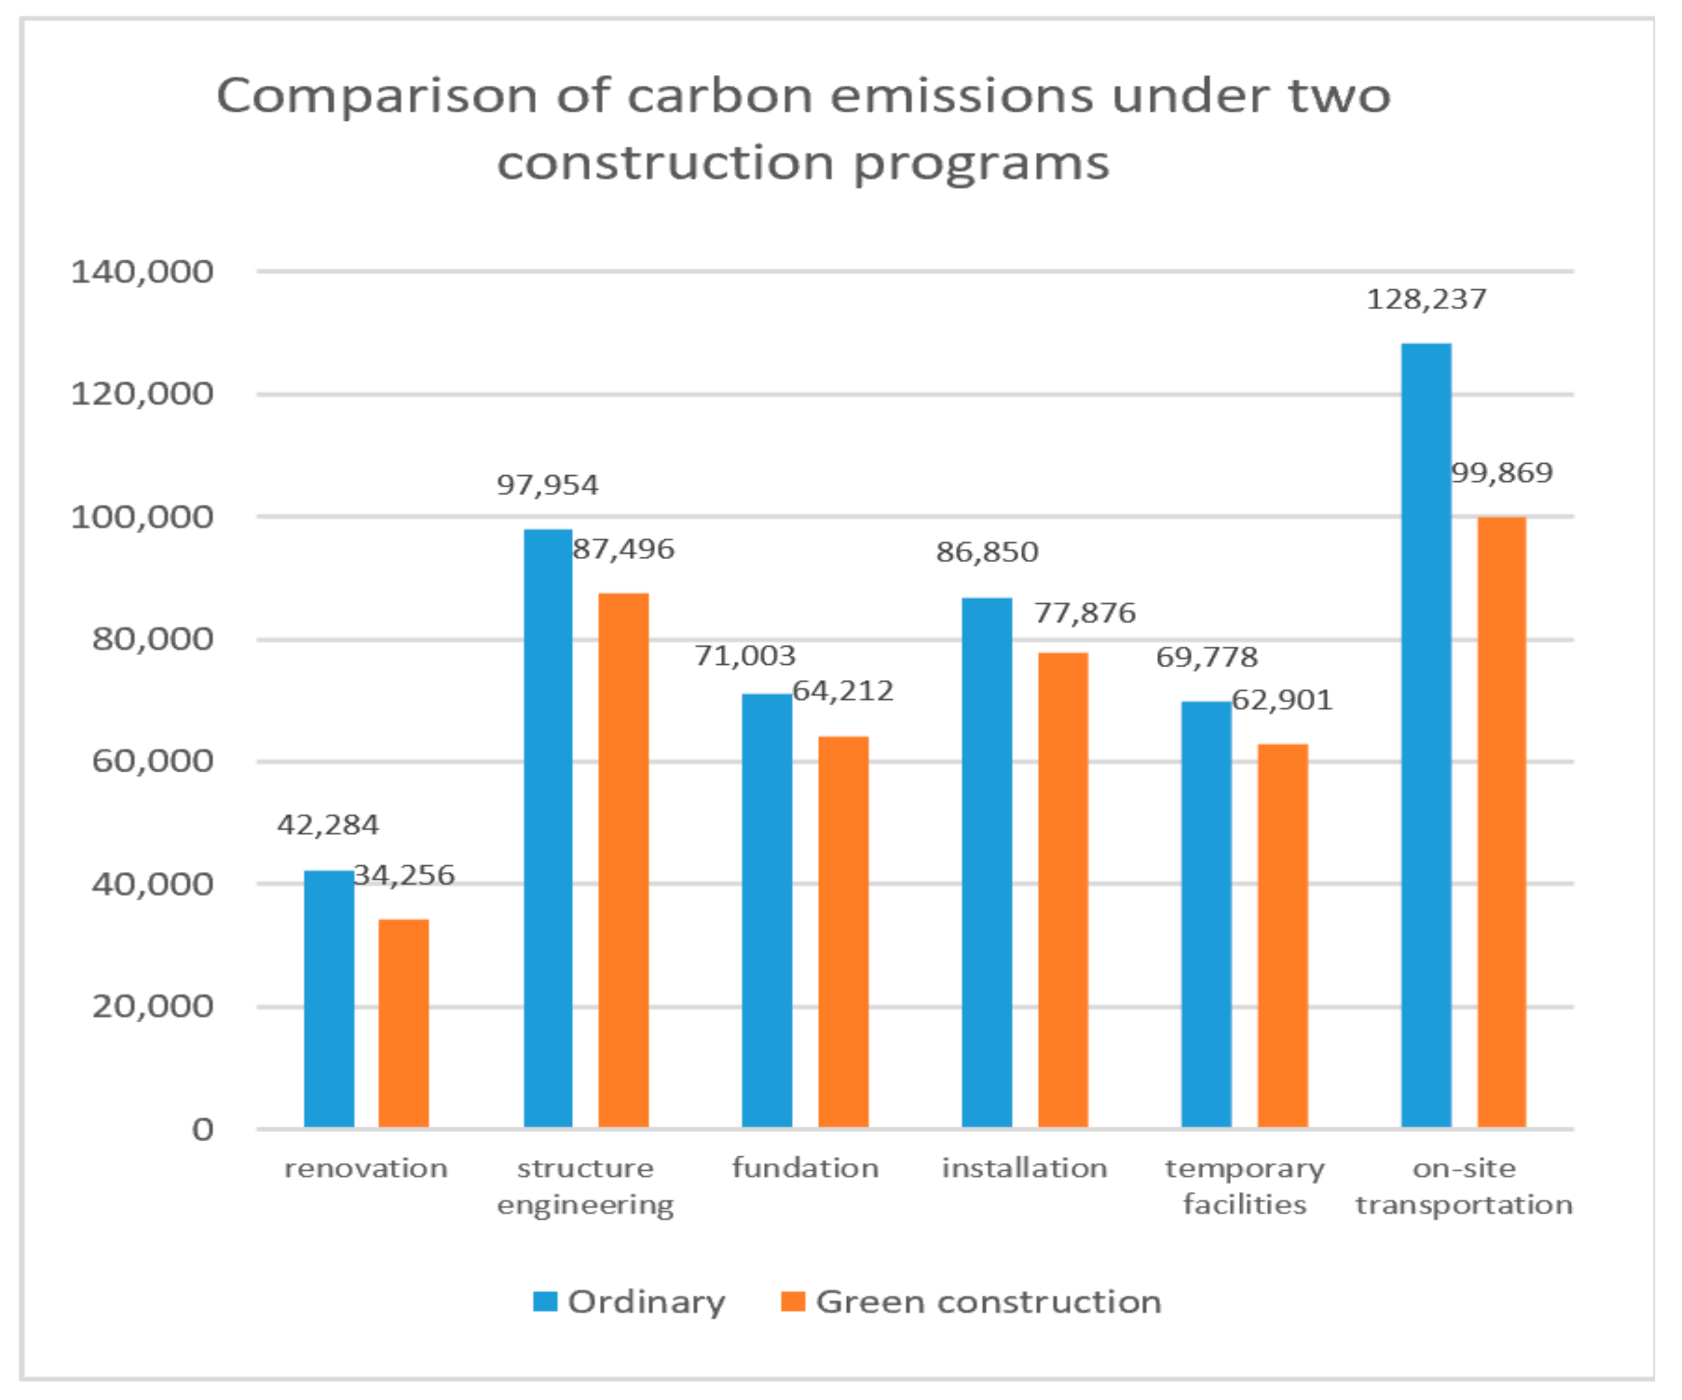
4.2. Effect of Green Construction on Building’s Carbon Emission

The building stage usually calls for a great amount of materials, energy, and water resources. Reducing resource consumption and increasing resources utilization is an effective method of carbon emission reduction. According to the “Green Construction Guidelines” [35] issued by the Ministry of Construction of the People’s Republic of China, the specific framework of green construction is shown in Figure 3:
For this project, major measures were taken for its green construction, as follows. First, some measures to reduce energy consumption during the construction caused by lighting and heating, during operation, were taken. These measures included reducing operation energy consumption of lighting by unleashing the energy conservation potential of lighting. Lighting energy consumption during construction could decrease by more than 5%, by replacing traditional lamps with new energy-saving LED and fluorescent lamps [36,37]. Second, renewable or clean energy was used in the project. Third, to reduce water consumption, it could install low-flow devices and appliances in water-using equipment and reuse rainfall or construction waste water, where possible. Fourth, by using green building materials, components of a building and its parts, the equipment transport efficiency could be increased. Fifth, secondary transport was conducted as little as possible to reduce the operational energy consumption of construction machines and tools in on-site transport as well as carbon emissions during construction [38]. Optimization such as that achieved in energy conservation and green construction could reduce carbon emissions at materialization. Optimization through carbon emission calculations and Vensim provided the carbon emissions of all subsystems (Table 4).

4.3. Analysis of Carbon Emission Differences under Different Construction Programs

Figure 4 shows the carbon emission proportion of each subsystem under common construction. During construction, on-site transport and structural engineering accounted for 26% and 20% of the total carbon emission, respectively. The huge consumption of fuel, materials, and water in on-site transport and structural engineering meant that the carbon emissions from on-site transport and structural engineering accounted for almost half of the total carbon emissions.
The green construction mentioned in Section 4.2 shows that power consumption can be reduced by a wide use of energy-saving lamps and the enhancement of indoor lighting [39]. Secondary transport, large tower cranes, and other handling machines should be used as little as possible for on-site transport. In structural engineering, the carbon emissions of steel reinforcement and concrete accounted for the vast majority of the total emissions. Most of these carbon emissions resulted from the use of steel processing machines, and concrete mixing and pumping machines. Therefore, emission reduction could be achieved by implementing better on-site management, processing and utilizing materials in an efficient manner, and avoiding unnecessary energy waste. For example, as shown in Figure 5, carbon emission of on-site transport among all subsystems under green construction techniques was the largest, accounting for about 23% of the total emissions.
Figure 6 shows that green construction did better than common construction in terms of emission reduction form subsystems. To clarify the differences between carbon emissions of subsystems under these two construction programs, carbon emission differences per unit area of all subsystems were calculated (Table 5). As shown in Table 5, among all subsystems under the green construction protocols, on-site transport saw the largest reduction in carbon emissions, followed by structural engineering (foundation engineering had the smallest reduction).

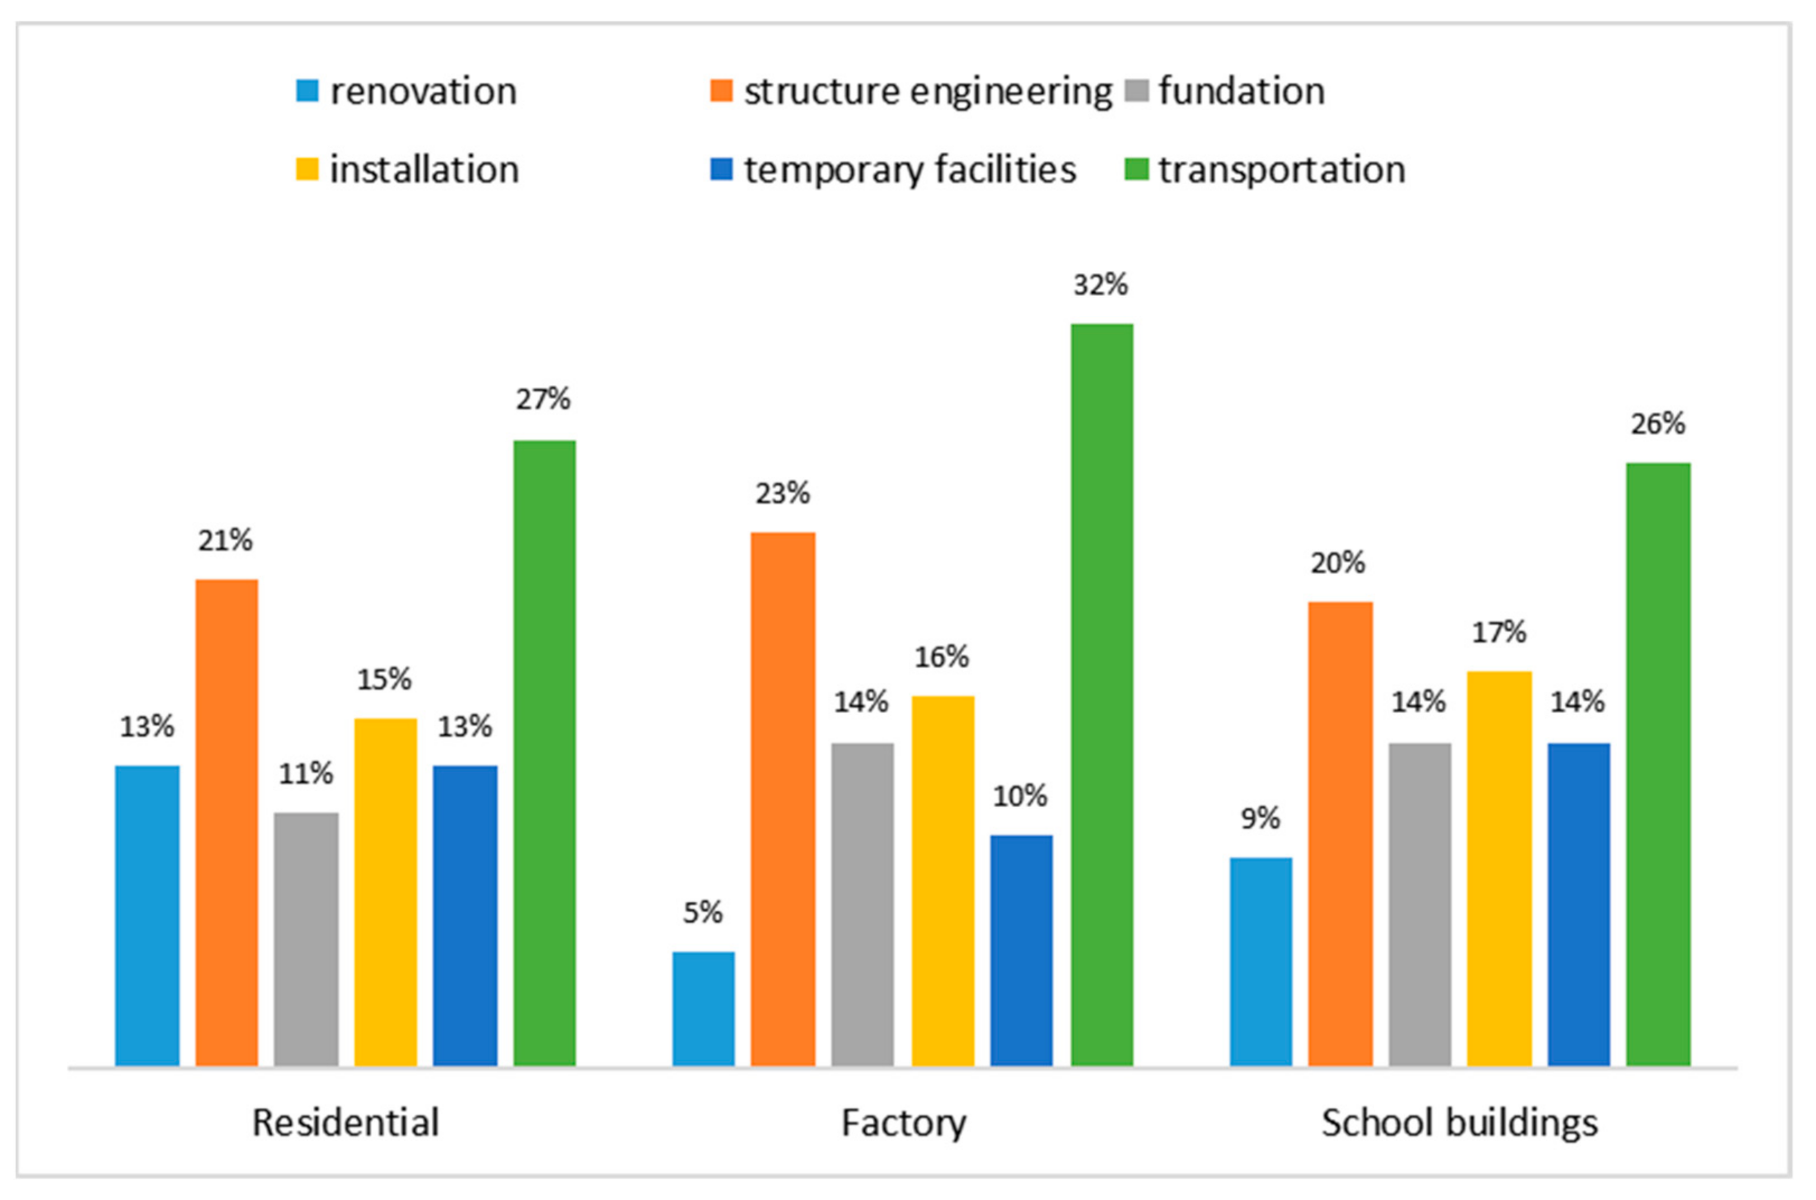
4.4. Effect of Transportation Engineering Based on Different Buildings on Carbon Emissions

There are certain differences in the carbon emission composition of different building types during the materialization stage. Compared with residential buildings, schools have larger bays, while factories are better. Therefore, in terms of steel reinforcement engineering, buildings with large bays are cut-off by steel bars. Energy consumption is reduced to a certain extent. In addition, the height of teaching buildings is generally around 6 floors, and most residential buildings are high-rise buildings, so the carbon emissions generated by vertical transportation engineering are not the same; and the construction environment is not the same. The impact of carbon emissions during the construction phase cannot be ignored. Therefore, the study counts different types of buildings in the central region such as Jiangxi, Hunan, Hubei, and other places, to compare and determine the proportion of carbon emissions from on-site transportation in the entire construction process to prove the feasibility of the study. A bar chart (Figure 7) shows the carbon emission proportions of all subsystems during construction.
As shown in Figure 7, proportions of carbon emissions from some subsystems in different items of buildings are different. However, proportions of carbon emissions from transportation engineering remain the largest despite different items of buildings, so energy reduction in transportation works play a significant and considerable role in carbon emission reduction during the whole construction process. Therefore, the key to solving urgent problems lies in guiding construction companies to start carbon emission reduction from transportation engineering perspectives.

5. Discussion and Conclusions

5.1. Effect of Green Construction Based on Subsystems on Carbon Trading Prices

In national construction and social progress, it is inevitable to bring a lot of pollution to the environment, and greenhouse gas emissions are one of them. In order to alleviate global warming, it is necessary to make corresponding policies, such as the use of laws to limit greenhouse gas emissions, so there is a trading market for carbon emission. The trading market for carbon emission rights regards carbon emission rights as commodities and promotes emission reduction through economic means. The establishment of a carbon emission rights market in China is in its infancy, so setting reasonable carbon trading prices would boost the implementation of energy conservation and emission reduction policies [40]. During construction and under the carbon trading mechanism, energy reduction potential of subsystems should be considered and should also offer targeted carbon emission prices and encourage enterprises to adopt green construction technologies.
Taking this project (a teaching building) as an example, the methods to realize the aforementioned goals were discussed.
First, carbon emission differences between common construction and green construction were calculated. The carbon emission difference for each subsystem was divided by the carbon emission difference of the whole project during construction. Percentages of carbon emission difference from all subsystems were then calculated, as shown in Formula (7).
θ i = P i L i / D
In Formula (7), θi is the percentage of a subsystem’s carbon emission difference of the total carbon emissions difference under two different construction programs. Pi is the carbon emission from common construction; Li is the carbon emission from green construction, and D is the sum of carbon emission difference between common construction and green construction (Figure 6).
As shown in Figure 8, in this case, the carbon emission difference between common construction and green construction per unit area accounted for 41% of the carbon emission difference of on-site transport. While the carbon emission differences of other projects occupied a relatively small proportion, of about 10% to 15%, therefore, under the building’s carbon trading mechanism, enterprises could be guided to lay their emphasis of emission reduction on on-site transport works with the largest emission reduction potential afforded by increasing carbon trading prices of on-site transport. Meanwhile, carbon trading prices of other projects were decreased to balance the price hike for on-site transport. On the basis of another report [41], we proposed a step-wise coefficient of increasing carbon price for each subsystem:
f i = β × B i c + 100 % c = 1 n 100 %
where fi is the step-wise coefficient of increasing carbon price for price adjustment in type-i subsystem; β is the coefficient of adjustment in total price; B is the ratio of carbon emission differences per unit area of type i subsystem; and n is the number of subsystems.
The value of β (coefficient of adjustment in total price terms) is related to the construction company’s expected benefit brought by emission reduction—β varies from 0 to 1 / ( c min B i ) , in which min B i represents the minimum ratio of carbon emission differences per unit area of type i subsystem.
By adjusting carbon trading prices of all subsystems in accordance with Formula (8), the total carbon trading price remains unchanged. Meanwhile, subsystems with a huge potential for emission reduction offer a higher carbon price, stimulating enterprises to prioritize these projects for energy conservation and emission reduction. This would lower the construction company’s trading cost and realize its goal of reducing total carbon emission during construction.
For example, in this program, the construction company expected a halving of carbon emission rights trading, as shown in the following formula:
β ( 41 % 1 6 ) + 100 % × 41 % = 50 %
Then, we found that β = 0.9 and the price adjustment coefficient was found by using Formula (8). The results are shown in Table 6.
The results showed that carbon trading price of on-site transport increased to 121.9% of the original price while carbon prices of other subsystems decreased to 94 to 98.5% of the original price. Therefore, to improve their economic benefits accruing therefrom, construction companies should emphasize transportation emissions reductions.
To conclude, this policy of gradient prices could guide construction companies to adopt high-efficiency technologies for emission reduction. This would further fulfil the target of carbon emission reduction in buildings, at a national level, and deliver the social benefits brought by emission reduction.

5.2. Conclusions

The construction industry was always a key industry for energy conservation and emission reduction, mainly because buildings generate a large amount of greenhouse gases during the materialization stage, and these gases can be controlled by improving the construction process. Green construction not only reduces carbon emissions, but also improves the problems of dust, noise pollution, and light pollution. Based on the LCA framework, the research used system dynamics to divide the materialization stage into six subsystems, and calculates the corresponding carbon emissions of each subsystem under ordinary construction and green construction. The results showed that during the materialization stage of the building, on-site transport generated the most carbon emissions and the carbon emissions reduced by green construction were also the greatest. Therefore, in the subsystem, the focus of energy conservation and emission reduction was placed on the transportation project, improving the efficiency of energy saving and emission reduction of construction enterprises, to a large extent. A carbon price gradient formula was proposed to increase the carbon trading price in the on-site transport, and guide the main force of emission reduction to on-site transport. Under a building-type of carbon trading mechanism, it would be better for resource allocation and market control to increase carbon trading prices of on-site transport, implementing step-wise increases in carbon price in all subsystems and guiding construction companies towards technological adjustment and green construction. It should be noted that the relevant government should implement green construction into actual projects, so as to truly achieve the goal of emission reduction, and carbon emission rights trading is only a means to promote emission reduction. This research can be used as a reference for relevant government in the formulation of relevant carbon emission trading systems. This study only focused on the materialization stage of a building, however, the operation and demolition stage also generate a considerable amount of carbon emission. In future, more studies need to focus on the other stages throughout the life cycle of a building.

Author Contributions

S.Z. operated the thermal conductivity tests and analyzed the data. Z.G. wrote this manuscript. Y.D. and J.D. finished the model. J.L. and J.F. supervised the study and contributed to the manuscript writing. All authors discussed the results. All authors have read and agreed to the published version of the manuscript.

Funding

This work was supported by Natural Science Foundation of China (Grant nos. 51662008 and 51968022), and a Key R & D Project of Jiangxi Province (Grant no. 20171BBG70078).

Institutional Review Board Statement

Ethical review and approval were waived for this study because the institutions of the authors who participated in data collection do not require IRB review and approval.

Conflicts of Interest

The authors declare no conflict of interest.

References

  1. UNFCCC. Adoption of the Paris Agreement; United Nations Office at Geneva: Geneva, Switzerland, 2015. [Google Scholar]
  2. Working Group I. The IPCC 6th Assessment Report; 1-4 IPCC: Stockholm, Sweeden, 2018. [Google Scholar]
  3. Xie, R.; Zhao, G.; Zhu, B.; Lai, M. Regional Transfer of Haze Pollutants Embodied in China’s Foreign Trade and Factors Affecting it: A GERIO-based Empirical Analysis. Emerg. Mark. Financ. Trade 2016, 52, 1335–1347. [Google Scholar] [CrossRef]
  4. Ma, X.M.; Cai, Y. Report on China’s Low-Carbon Finance Development; Peking University Press: Beijing, China, 2014; pp. 6–11. (In Chinese)
  5. Jin, F.J.; Ma, L.; Xu, D. Environmental stress and optimized path of industrial development in the Yellow River Basin. Res. Sci. 2020, 42, 127–136. [Google Scholar] [CrossRef]
  6. Tong, Y.; Yin, Y.; Qian, L.; An, J.L. Analysis of the Characteristics of Hazy Phenomena in Nanjing Area. China Environ. Sci. 2011, 27, 584–588. [Google Scholar]
  7. Zhou, S.; Ding, Y.; Wang, Z.P.; Dong, J.L.; She, A.M.; Wei, Y.Q.; Li, R.G. Weathering of roofing insulation materials under multi-field coupling conditions. Materials 2019, 12, 3348. [Google Scholar] [CrossRef] [PubMed] [Green Version]
  8. Huo, T.; Ren, H.; Zhang, X.; Cai, W.; Feng, W.; Zhou, N.; Wang, X. China’s energy consumption in the building sector: A Statistical Yearbook-Energy Balance Sheet based splitting method. J. Clean. Prod. 2018, 185, 665–679. [Google Scholar] [CrossRef]
  9. Zhang, Z.H.; Wu, X. A Building Environmental Impact Assessment System Based on LCA. Urban Environ. Urban Ecol. 2004, 9, 27–29. (In Chinese) [Google Scholar]
  10. Zhang, D.Y.; Zhang, L.X. Research Progress on Carbon Source Emission Estimation Methods. Inn. Mong. For. Sci. 2005, 1, 20–23. (In Chinese) [Google Scholar]
  11. Li, B.; Li, Y.X.; Wu, B.; Fu, F.F. Research on Carbon Emission Measurement Model of Construction. J. Inf. Technol. Civ. Eng. 2011, 2, 5–10. (In Chinese) [Google Scholar]
  12. Yu, P.; Chen, X.Q.; Ma, L.Y. Review on Studies of Life Cycle Carbon Emission from Residential Buildings. Build. Sci. 2011, 27, 9–12. (In Chinese) [Google Scholar]
  13. Zhang, Z.H.; Shang, C.J.; Qian, K. Evaluation of Carbon Emission in Building’s Life Cycle. Constr. Econ. 2010, 2, 44–46. (In Chinese) [Google Scholar]
  14. Ximenes, F.A.; Grant, T. Quantifying the Greenhouse Benefits of the Use of Wood Products in Two Popular House Designs in Sydney, Australia. Int. J. Life Cycle Assess. 2013, 18, 891–908. [Google Scholar] [CrossRef]
  15. Wang, J.J.; Zhao, W.; Wang, S.L. Study on Calculation Methods of Carbon Emissions of Buildings during the Construction. Build. Sci. 2014, 2, 8–12. (In Chinese) [Google Scholar]
  16. Zhang, X.; Shen, L.; Zhang, L. Life Cycle Assessment of the Air Emissions during Building Construction Process: A Case Study in Hong Kong. Renew. Sustain. Energy Rev. 2013, 17, 160–169. [Google Scholar] [CrossRef]
  17. Gong, X.Z.; Nie, Z.R.; Wang, Z.H.; Cui, S.; Gao, F.; Zuo, T. Life Cycle Energy Consumption and Carbon Dioxide Emission of Residential Building Designs in Beijing: A Comparative Study. J. Ind. Ecol. 2012, 16, 576–587. [Google Scholar] [CrossRef]
  18. Available online: www.tanpaifang.com (accessed on 8 January 2021).
  19. Gao, Y.; Liu, X.J. Identify and the Value of Green Building Carbon Emissions Based on Cost-effectiveness. J. Xi’an Univ. Archit. Technol. 2016, 48, 755–759. [Google Scholar]
  20. Zhao, R.; Zhou, X.; Min, X.F. Game Theoretical Analysis on Purchase of Carbon labelled Product Based on System Dynamics. J. Syst. Sci. 2021, 29, 111–114. [Google Scholar]
  21. Haites, E. Carbon Taxes and Greenhouse Gas Emissions Trading Systems: What have we learned? Clim. Policy 2018, 18, 955–966. [Google Scholar] [CrossRef] [Green Version]
  22. Peuportier, B.; Thiers, S.; Guiavarch, A. Eco-design of buildings using thermal simulation and life cycle assessment. J. Clean. Prod. 2013, 39, 73–78. [Google Scholar] [CrossRef] [Green Version]
  23. Yang, Z.; Da, Y.; Shan, H.; Guo, S. Modelling of Energy Consumption and Carbon Emission from the Building Construction Sector in China, A Process-based LCA Approach. Energy Policy 2019, 134, 1–9. [Google Scholar]
  24. Lin, L.; Jiang, Y.; Yan, D.; Peng, C. Analysis of Energy Consumption in Building Construction and CO2 Emission. Energy China 2015, 37, 7–14. [Google Scholar]
  25. Sartori, I.; Hestnes, A. Energy use in the life cycle of conventional and low energy buildings: A review article. Energy Build. 2007, 39, 249–257. [Google Scholar] [CrossRef]
  26. Monahan, J.; Powell, J.C. An Embodied Carbon and Energy Analysis of Modern Methods of Construction in Housing: A Case Study Using a Life Cycle Assessment Framework. Energy Build. 2011, 43, 179–188. [Google Scholar] [CrossRef]
  27. Säynäjoki, A.; Heinonen, J.; Junnila, S.; Horvath, A. Can life-cycle assessment produce reliable policy guidelines in the building sector? Environ. Res. Lett. 2017, 12, 013001. [Google Scholar] [CrossRef] [Green Version]
  28. Su, X.; Zhang, X. A Detailed Analysis of the Embodied Energy and Carbon Emissions of Steel-construction Residential Buildings in China. Energy Build. 2016, 119, 323–330. [Google Scholar] [CrossRef]
  29. Buyle, M.; Braet, J.; Audenaert, A. Life Cycle Assessment in the Construction Sector: A Review. Renew. Sustain. Energy Rev. 2013, 26, 379–388. [Google Scholar] [CrossRef]
  30. China National Institute of Standardization. GB/T 24040-2008; Environmental Management—Life Cycle Assessment—Principles and Framework; Standard Press of China: Beijing, China, 2008. (In Chinese)
  31. Yildiz, I.; Caliskan, H. Energetic and exergetic carbon dioxide equivalents and prices of the energy sources for buildings in Turkey. Environ. Prog. Sustain. Energy 2018, 37, 912–925. [Google Scholar] [CrossRef]
  32. De Wolf, C.; Pomponi, F.; Moncaster, A. Measuring embodied carbon dioxide equivalent of buildings: A review and critique of current industry practice. Energy Build. 2017, 140, 68–80. [Google Scholar] [CrossRef]
  33. Gao, Y.; Li, Z.D.; Zhang, H.; Yu, B.; Wang, J.Y. A carbon emission analysis model for prefabricated construction based on LCA. J. Eng. Manag. 2018, 32, 30–34. (In Chinese) [Google Scholar]
  34. Ni, J.Q.; Heber, A.J.; Diehl, C.A.; Lim, T.T. Se-structures and environment: Ammonia, hydrogen sulphide and carbon dioxide release from pig manure in under-floor deep pits. J. Agric. Eng. Res. 2000, 77, 53–66. [Google Scholar] [CrossRef]
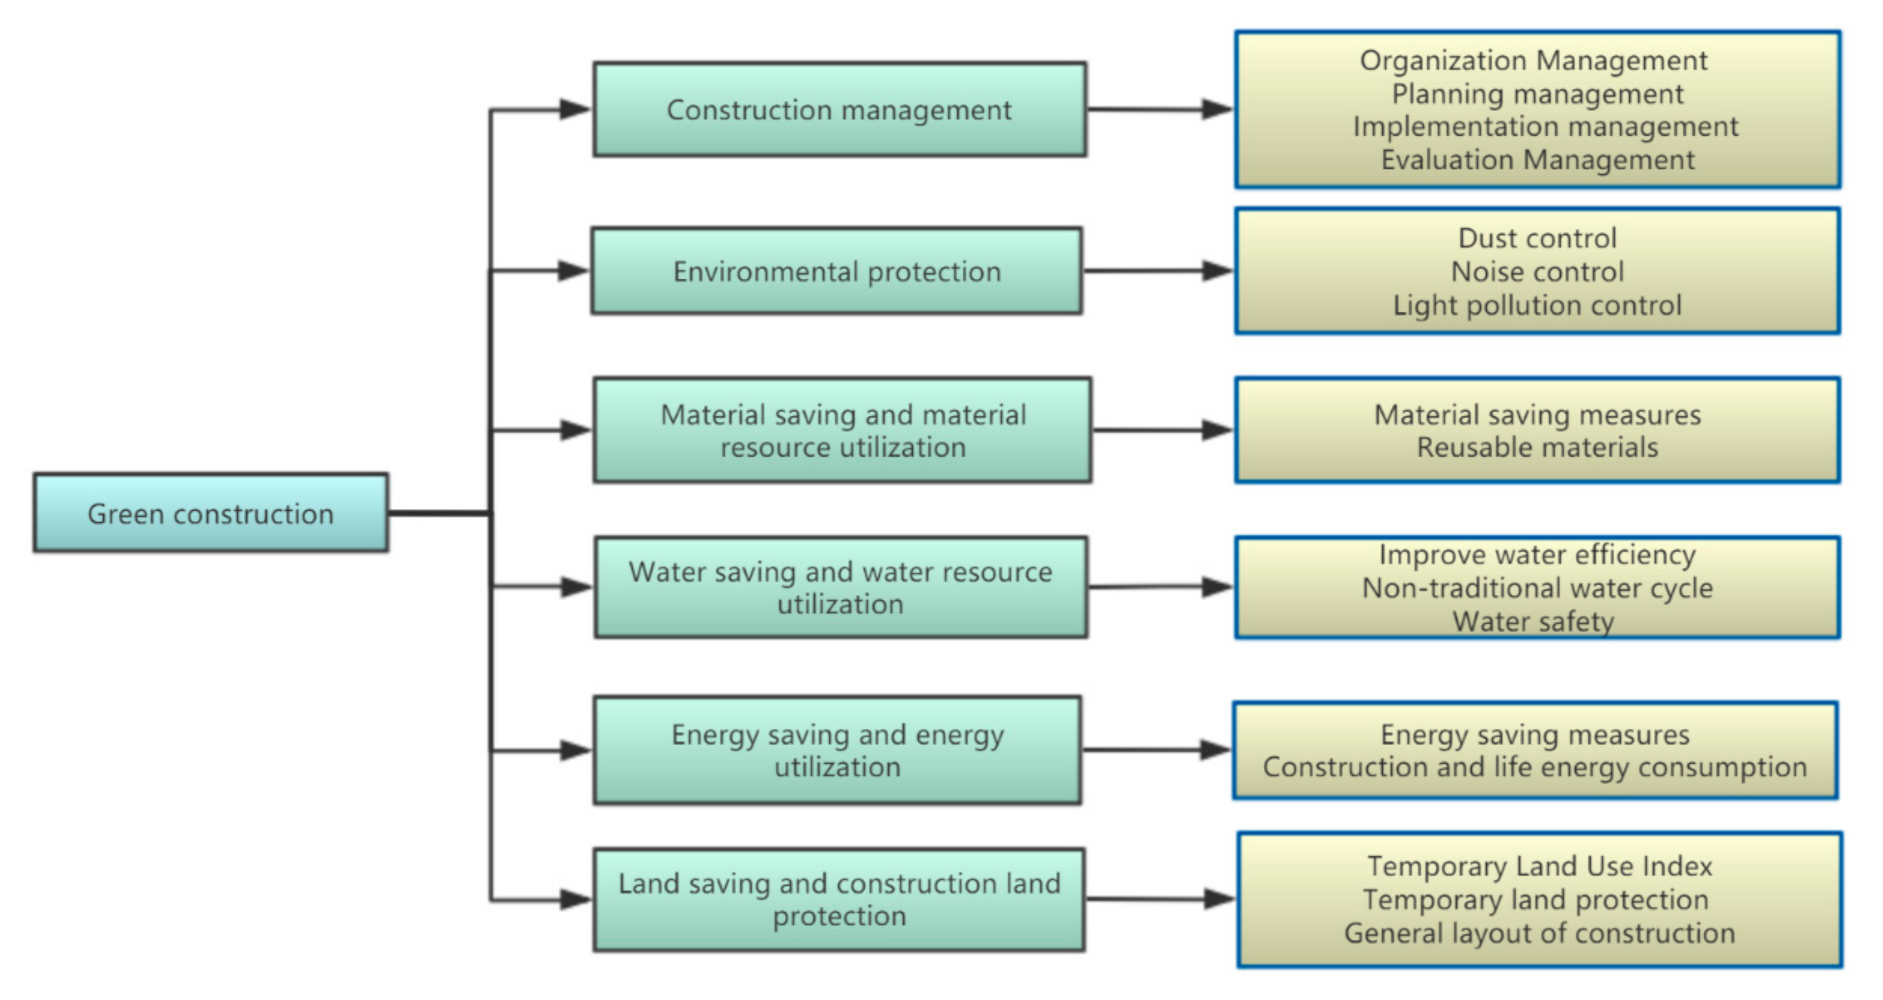
  35. Guidelines for Green Construction; Construction Quality 223; Ministry of Construction of the People’s Republic of China: Beijing, China, 2007. (In Chinese)
  36. Junnila, S.; Horvath, A.; Guggemos, A.A. Life-cycle assessment of office buildings in Europe and the United States. J. Infrastruct. Syst. 2006, 12, 10–17. [Google Scholar] [CrossRef]
  37. Wang, L. Study on Application of Green Energy-saving Construction Technology in Building Construction. Energy Conserv. Environ. Prot. 2018, 31, 43–44. (In Chinese) [Google Scholar]
  38. Thormark, C. Environmental Analysis of a Building with Reused Building Materials. Int. J. Low. Energy Sust. Build. 2000, 1, 1–18. [Google Scholar]
  39. Venkatarama Reddy, B.V.; Jagadish, K.S. Embodied Energy of Common and Alternative Building Materials and Technologies. Energy Build. 2003, 35, 129–137. [Google Scholar] [CrossRef]
  40. Chen, X.L.; Liu, X.B. Research on Carbon Emission Regulation Policy of Building Sector Based on Carbon Tax /Subsidy: Taking EU’s Building Sector Carbon Emission Policy for Example. Urban Dev. Stud. 2013, 10, 21–27. (In Chinese) [Google Scholar]
  41. Hu, R.; Chen, L.; Zhu, J.L. Complexity of Airlines’ Dynamic Price Competition with Carbon Emission Trading. J. Transp. Syst. Eng. Inf. Technol. 2018, 18, 6–12. (In Chinese) [Google Scholar]
Figure 1. Framework for project-specific estimation of carbon emissions based on life cycle assessment.
Sustainability 13 00642 g001
Figure 2. Analysis of CO2 emissions at materialization.
Sustainability 13 00642 g002
Figure 3. Green construction frame diagram.
Sustainability 13 00642 g003
Figure 4. CO2 emissions from sub-projects under common construction.
Sustainability 13 00642 g004
Figure 5. CO2 emissions in green construction.
Sustainability 13 00642 g005
Figure 6. Comparison of carbon emissions under two construction programs (unit—kgCO2eq).
Sustainability 13 00642 g006
Figure 7. Percentages of carbon emissions from construction of various subsystems.
Sustainability 13 00642 g007
Figure 8. Difference in carbon emissions per unit area.
Sustainability 13 00642 g008
Table 1. Carbon emission factors.
EnergyEnergyCarbon Emission FactorEnergyEnergyCarbon Emission Factor
CoalSmokeless coal98.3 kg CO2/GJFuelMotor gasoline69.3 kg CO2/GJ
Coking coal94.6 kg CO2/GJKerosene71.5 kg CO2/GJ
Lignite101 kg CO2/GJDiesel74.1 kg CO2/GJ
Charcoal107 kg CO2/GJFuel oil77.4 kg CO2/GJ
PowerRegional powergrid in North China1.246 kg CO2/(kW∙h)GasNatural gas56.1 kg CO2/GJ
Regional powergrid in Central China0.801 kg CO2/(kW∙h)Coal gas44.4 kg CO2/GJ
Regional powergrid in South China0.714 kg CO2/(kW∙h)
Table 2. Overview of the main building construction.
ProjectContent
Construction functionsTeaching buildings; residential houses; office buildings; recreation facility
Construction characteristicsWith large-scale single floor, diversified functional areas and a U-shaped plan
Construction area m28133
Number of floors6
Floor height m3.9
Construction height m25.6
Fire protectionSecond class
StructureFrame
Table 3. Comprehensive CO2 emission of subsystems (unit—kg CO2eq).
Primary ClassificationSecondary ClassificationCarbon Emission Of Each Sub-ItemTotal Carbon Emission
Decoration engineeringInstallation of doors and windows249942,284
Installation of curtain walls2942
Refined decoration of roof2015
Refined interior decoration34,617
Insulation and waterproof211
Structural engineeringReinforcement work54,18997,954
Shuttering work1367
Concrete work37,582
Masonry work4471
Scaffolding work346
On-site transportEnergy consumption of transport machines and water128,237128,237
Foundation engineeringLevelled ground68571,033
Earthwork excavation and pile foundation construction39,373
Foundation pit support18,623
Drainage construction12,322
Installation engineeringHydropower system53,29686,850
HVAC33,423
Elevator installation131
Construction site facilitiesInstallation and demolition of temporary housing515669,778
Office33,630
Living area27,473
On-site lighting3519
Table 4. Comprehensive CO2 emission of subsystems after optimization (unit—kgCO2eq).
Primary ClassificationSecondary ClassificationCarbon Emission of Each Sub-ItemTotal Carbon Emission
Decoration engineeringInstallation of doors and windows246334,256
Installation of curtain wall2673
Refined decoration of roof198
Refined interior decoration28,711
Insulation and waterproof211
Structural engineeringReinforcement work49,32287,496
Shuttering work1367
Concrete work32,561
Masonry work4121
Scaffolding work125
On-site transportEnergy consumption of transport machines and water99,86999,869
Foundation engineeringSite levelling59664,212
Earthwork excavation and pile foundation construction34,512
Foundation pit support17,863
Drainage construction11,241
Installation engineeringHydropower system46,23177,876
HVAC31,521
Elevator installation124
Construction site facilitiesInstallation and demolition temporary housing421362,901
Office31,254
Living area24,571
On-site lighting2863
Table 5. The difference between common construction and green construction in carbon emission of subsystems (unit—kg CO2eq).
Primary ClassificationCarbon Emission DifferenceCarbon Emission Difference Per Unit Area
Decoration engineering80280.987
structural engineering10,4581.286
On-site transport89741.103
Foundation engineering68770.846
Installation engineering28,3683.488
Construction site facilities67910.835
Table 6. Coefficient of step-wise increases in carbon price in each subsystem.
Primary ClassificationCoefficient of Increasing Carbon Price (%)
On-site transport121.9
Foundation engineering94
Decoration engineering94.9
Structural engineering98.5
Installation engineering96.7
Construction site facilities94
Publisher’s Note: MDPI stays neutral with regard to jurisdictional claims in published maps and institutional affiliations.

