Abstract
To address the issue of global warming, there is a trend towards low-carbon economies in world economic development. China’s rapid economic growth and high carbon energy structure contribute to its large carbon emissions. To achieve sustainable development, China must transform its industrial structure to conserve energy, reduce emissions, and adapt to climate change. This study measured the carbon entropy and carbon emission efficiency of 25 industries in the Beijing-Tianjin-Hebei region from 2000 to 2015 by building carbon entropy models and total factor industrial carbon emission efficiency evaluation models. The study showed that: (a) Priority development industries in the Beijing-Tianjin-Hebei region were expanding, the regional competitiveness of the moderate development industry was improving, and the proportion of restricted development industries had dropped significantly; (b) the spatial distribution of the three types of industries presented a pattern of concentric rings, with priority industries at the core, surrounded by moderate, then by restricted development industries; (c) the status of medium- and high-efficiency industries had improved, while the status of low-efficiency industries had decreased. Spatially, high- and low-efficiency industries were becoming concentrated, and medium-efficiency industries were becoming dispersed; (d) considering carbon entropy and carbon emission efficiency, the path of industrial structure transformation and upgrading and layout optimization in Beijing-Tianjin-Hebei region was proposed.
1. Introduction
Global climate change and the frequent occurrence of climate disasters are becoming major issues for humanity. Low-carbon economies have become a trend in world economic development to reduce greenhouse gas emissions. China’s rapid economic growth and the high degree of carbonization of its energy structure are responsible for its very high carbon emissions. These increased from 1.47 billion tons in 1980 to 10.4 billion tons in 2013, accounting for 29% of total global emissions. Fossil fuels, principally coal, are the main source of China’s energy production, accounting for about 90% of the total energy consumed. Industry is the largest consumer of energy by sector in China, and it is also the main source of CO2 emissions. In 2007, President Hu Jintao made it clear at the APEC meeting that China should develop a low-carbon economy. At the Copenhagen Climate Change Conference 2009, the Chinese government pledged to cut CO2 emissions per unit of GDP by 40–45% by 2020 [1], compared with 2005 levels, and to incorporate that as a binding target into medium- and long-term planning for national economic and social development. During the 13th Five-Year Plan period, China will focus on “innovation, coordination and greenness” in an effort to achieve green and low-carbon economic development. In the context of global climate change, achieving sustained economic development while reducing fossil fuel consumption and carbon emissions has become a choice that China must make to conserve energy, reduce emissions, and adapt to climate change.
Research on carbon emissions from industry has mainly focused on the following aspects: First, industrial carbon emissions have been quantified, using field measurement, modeling, material balance, and emission coefficient estimation methods. The macro models commonly used include MARKAL, ERM-AIM, Logistic, and system dynamics models, which are mostly applied in research on energy consumption and carbon emissions at a national level [2]. The emission coefficient method is one of the most widely used methods at present, but its use is accompanied by some uncertainty as the emission coefficient is influenced by factors such as technology and the production process. Another possible approach is using the carbon footprint. Second, analysis has been carried out into the characteristics of carbon emissions from different industries that are considered to be large CO2 emitters, including ferrous metal smelting and rolling processing; electricity, gas and water production and supply; petroleum processing and coking; metal smelting and rolling processing; and chemical raw materials and chemical products manufacturing. Researchers have also studied the characteristics, changes, and regional comparisons of CO2 emissions in industries such as chemicals, steel, cement, power, and textiles [3,4,5,6]. Third, research on carbon emissions from industries at different scales has been undertaken. This research analyzed the driving factors and regional differences in carbon emissions in China—mainly at the national or inter-provincial level—with a focus on total emissions [7,8]. Fourth, studies have looked at the factors influencing carbon emissions from industry and the performance of industry generally, including the level of economic development, the industrial structure, the energy structure, energy prices, the technological level, population size, urbanization, and environmental regulation [9,10,11,12]. The main research methods are factor decomposition, index decomposition, and input–output methods. Factor decomposition methods include the IPAT model and the STIRPAT model; index decomposition methods include the Laspeyres index, the simple average Divisia (SAD), and the adaptive weighting Divisia (AWD) methods [13,14,15].
On the research of the relationship between carbon emissions and industrial structure spatial layout, domestic and foreign scholars have constructed various index systems and evaluation models to evaluate the development status of low-carbon industries and put forward their development strategies, so as to achieve mutual benefit and win–win situation between industrial development and ecological protection. For example, Schipper, Murtishaw, and Khrushch used an adaptive weight decomposition method to analyze energy intensity and energy structure [16]; Lewis used gray correlation method to analyze the relationship between industrial structure change and energy consumption and carbon emissions [17]; Wang used stochastic frontier method to measure TFCP and CMP of 39 industrial sectors in Beijing-Tianjin-Hebei region [18]; Zhang estimated the future carbon emission and carbon intensity of 37 industrial sectors in Beijing Tianjin Hebei Urban Agglomeration, and decomposed the carbon emission reduction targets of their industries [19]; Ke, Shi, Cao Z, and others selected cement industry, a typical energy dependent industry in China, to explore its emission reduction potential and industrial structure transformation direction [20,21,22].
The existing research on industrial carbon emissions has been relatively systematic, but there are still some deficiencies, including: (1) Relatively few studies that associate carbon emissions with the transformation of the industrial structure and the spatial optimization of industries, or that use empirical data; (2) in terms of research data and methods, there is no systematic and in-depth analysis of the evolutionary characteristics of, trends in, and correlations between long-time series and urban scale from an industry and spatial perspective; and (3) in terms of the geographical coverage of research, there are few studies on city clusters, which are the main geographic units where China’s current social and economic activity is concentrated, and even fewer studies on the Beijing-Tianjin-Hebei city cluster where energy-intensive industries are concentrated and there are serious ecological and environmental problems.
The evolution of regional industrial structure and spatial layout is the result of location selection of production enterprises. In the existing studies on regional leading industry selection and spatial layout, environmental externality index is rarely considered as a key factor. Focusing on how to achieve low-carbon and green development, in this paper, we first constructed a carbon entropy model along industrial and regional dimensions. Next, based on a two-stage super-efficiency DAE model, we constructed a quantitative model to comprehensively assess the carbon efficiency of different industries in various regions under a production framework that considered economic, energy and labor inputs, and economic and pollution outputs. Our aim was to measure the carbon entropy and carbon efficiency of 25 industries in the Beijing-Tianjin-Hebei region from 2000 to 2015. Then, we analyzed the evolutionary characteristics of the industrial structure and the distribution of industries in the Beijing-Tianjin-Hebei region, and proposed a path for transforming and upgrading the industrial structure and optimizing the spatial layout. The theoretical analysis framework is shown in Figure 1.
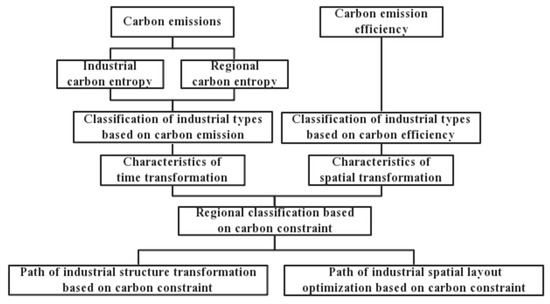
Figure 1.
Theoretical analysis framework of industrial structure transformation and layout optimization under carbon emission constraints.
2. Materials and Methods
2.1. Method for Calculating Carbon Emissions
The energy consumption of industries and industrial production at the urban level in the Beijing-Tianjin-Hebei region is not fully known, but electrical energy consumption is a major source of carbon emissions in China [23]. Therefore, we selected this secondary energy source—industrial electricity—to calculate the industrial carbon emissions, based on the average CO2 emissions factors for regional power grids in China published by the Department of Climate Change of the National Development and Reform Commission of the People’s Republic of China.
The power grids were divided into northeastern, northern, eastern, central, northwestern, and southern regional grids, based on their current distribution in China. This paper used the average CO2 emissions factor of all the regional power grids in China and of the northern power grid region to calculate the industrial CO2 emissions of China and the Beijing-Tianjin-Hebei region, respectively. According to the CO2 emissions factor and industrial power consumption, the formula for calculating carbon emissions from industry was as follows:
where Ci is carbon dioxide emissions from industry i; EFgrid,i is the regional average CO2 emissions factor; and Ei is the power consumption of industry i.
2.2. Industrial Carbon Entropy and Regional Carbon Entropy Model
Location entropy is the main measure of the status and role of the factors or industries of a given region to the region above it in the spatial hierarchy (for example, the Beijing-Tianjin-Hebei region is above any city in the region, and the whole country is above the Beijing-Tianjin-Hebei region). By constructing an industrial carbon entropy and regional carbon entropy calculation model, the evolutionary characteristics of the industrial structure and the spatial distribution of industries under carbon emission constraints can be identified [24].
2.2.1. Industrial Carbon Entropy
Industrial carbon entropy mainly refers to the ratio of the economic value produced by a specific industry in a given region per unit of carbon emissions to the economic value produced by industry as a whole in the given region per unit of carbon emissions. It reflects the carbon economic benefits of the specific industry compared with the overall carbon economic benefits of the given region. The formula for calculating it is as follows:
where ICQ is the industrial carbon entropy of the specific industry, which reflects the low-carbon economic development level of the specific industry; ni is the gross output of industry i in the given region; ci is the carbon emission from industry i in the given region; n0 is the gross output of all industries in the given region; c0 is the total carbon emission from industry in the given region. An ICQ > 1 indicates that the economic benefits generated by industry i in the given region per unit of carbon emissions are higher than the overall level in the given region. The greater the value of ICQ, the less the development of industry i in the given region is subject to carbon emission constraints and the higher the level of low-carbon development. An ICQ < 1 indicates that the economic benefits generated by industry i in the given region per unit of carbon emissions are lower than the overall level in the given region. The smaller the value of ICQ, the more the development of industry i in the given region is subject to carbon emission constraints and the lower the level of low-carbon development.
2.2.2. Regional Carbon Entropy
Regional carbon entropy represents the ratio of the economic benefits generated by a specific industry in a given region per unit of carbon emissions to the economic benefits generated by the corresponding industry in the region above it in the spatial hierarchy per unit of carbon emissions. It reflects the low-carbon economic level of the specific industry in the given region compared with the corresponding industry in the region above it in the spatial hierarchy.
where RCQ is the regional carbon entropy of industry i, which reflects the low-carbon development level of industry i; ni is the gross output of industry i in the given region; ci is the carbon emission from industry i in the given region; N0 is gross output of industry i in the region above it in the spatial hierarchy; C0 is the total carbon emission from industry i in the region above it in the spatial hierarchy. An RCQ > 1 indicates that the low-carbon development level of industry i in the given region is higher than in the region above it in the spatial hierarchy. The greater the value of RCQ, the less industry i in the given region is subject to carbon emission constraints compared with the region above it in the spatial hierarchy. An RCQ < 1 indicates that the carbon emission reduction efficiency of industry i in the given region is lower than in the region above it in the spatial hierarchy. The smaller the value of RCQ, the more industry i in the given region is subject to carbon emission constraints compared with the region above it in the spatial hierarchy.
2.3. Models to Measure the Carbon Efficiency of Industry
2.3.1. Super-Efficiency Data Envelopment Analysis (DEA) Model
When evaluating the efficiency of decision-making units (DMUs), traditional DEA models cannot further distinguish between multiple efficient DMUs whose efficiency scores are all 1. To solve this problem, based on the SBM model, Tone (2002) further defined the SuperSBM model. The super-efficiency DEA model can further compare DMUs whose efficiency scores are all 1 on the frontier of data envelopment in the same observation period, to measure the overall efficiency of DMUs more accurately. Under variable returns to scale, the planning formula of the output-oriented DEA model is as follows:
where constraint J≠0 indicates that the evaluated DMU is not in the reference set consisting of other DMUs; ρ’ is the super-efficiency score of the evaluated DMU; x is the input variable; y is the output variable; s is the number of input variables; n is the number of DMUs; λ is the combination ratio in efficient DMUs; both and are slack variables.
2.3.2. Two-Stage SuperSBM Model
As with the radial super-efficiency model, under the variable return to scale assumption, the input-oriented super efficiency model has no feasible solution. A necessary and sufficient condition for the output-oriented super-efficiency model to have no feasible solution is that is not feasible, and a sufficient (though not necessary) condition is x0 < xj, (j≠0). The sufficient condition for the super-efficiency model to have no feasible solution shows that under constraint eλ = 1, when one output value of the evaluated DMU is greater than that of other DMUs, constraint in the output-oriented super-efficiency model is not feasible. As a result, the model has no feasible solution. To make the output-oriented super-efficiency model have a feasible solution [18], we adopted the following two-stage solution [25].
First stage: The minimum input value of the evaluated DMU was increased to reach the convex production possibility set area consisting of other DMUs—that is:
Second stage: The optimal solution of the first stage was taken as a constant term and included in the above model to solve the output-oriented super-efficiency model.
When the optimal solution of the output-oriented super-efficiency model in the first stage is , the second stage model is equivalent to the traditional output-oriented super-efficiency model (4), and then a feasible solution can be found for the evaluated DMU under the traditional output-oriented super-efficiency model. That is to say, the two-stage super-efficiency model maintains compatibility with the traditional super-efficiency model; if there is a feasible solution for the evaluated DMU under the traditional output-oriented super-efficiency model, the two-stage super-efficiency model will produce the same result; otherwise, if there is no feasible solution, the two-stage super-efficiency model will produce the nearest feasible solution.
2.3.3. Carbon Efficiency Model
If the DEA does not lead to a best-practice production frontier, the input excess or output shortfall of carbon emissions can be obtained according to Formula (4), and the optimal carbon emissions can be obtained. Therefore, the total factor carbon efficiency is defined as:
where i is the i-th DMU, t is time, TFCE (total factor carbon efficiency) is carbon efficiency under the total factor framework; TCO (target carbon output) is the target amount of carbon emissions, i.e., the optimal amount of carbon emissions generated to achieve a certain amount of economic output with existing production technology; ACO (actual carbon output) is the actual amount of carbon emissions generated by the DMU.
2.4. System of Indicators to Measure the Carbon Efficiency of Industry
After reviewing the findings of previous studies [26,27,28,29], we considered that the key to improving the carbon efficiency of industry was to increase economic output as much as possible with less input of resources and economic factors while reducing the emission of pollutants. Based on this, the input indicators in the SuperSBM model were divided into economic, labor, and energy inputs, and the output indicators were divided into expected and unexpected outputs to construct a comprehensive system of indicators to evaluate the carbon efficiency of industry.
Based on the characteristics of China’s economic development and the availability of data, the economic input was represented by the capital stock of industry (sum of the paid-in capital and fixed asset depreciation of industry in the current year); the labor input was represented by the total number of people employed in industry in the current year [30]; and the energy input was represented by industrial power consumption [31]. The expected output was the value added by industry; and the unexpected output was CO2 emissions from industry. The system of indicators to evaluate the resource and environmental efficiency of industry is shown in Table 1.

Table 1.
Evaluation index system of environmental efficiency of industrial resources.
2.5. Overview of the Study Region and Data Sources
2.5.1. Study Region
The Beijing-Tianjin-Hebei region is located in the northeast coast of China (Figure 2), it is one of the three engines of China’s economic growth and is an important manufacturing base where energy-intensive and high-pollution industries such as metallurgy, chemicals, iron and steel, automobile manufacturing, and machinery manufacturing are concentrated. In 2012, the total energy consumption of the Beijing-Tianjin-Hebei region was 456 million tons of standard coal, accounting for 12.6% of national energy consumption. In 2013, the carbon emissions of the Beijing-Tianjin-Hebei region accounted for about one-fifth of the total national emissions, and its carbon intensity was higher than the national average. Energy consumption and greenhouse gas emissions in the Beijing-Tianjin-Hebei region underlie regional climate anomalies, environmental degradation, and the frequent occurrence of haze. In April 2015, the Politburo of the CPC Central Committee adopted the Outline of the Plan for the Coordinated Development of the Beijing-Tianjin-Hebei Region. This emphasizes that the integration of environmental protection is a starting point for the coordinated development of the Beijing-Tianjin-Hebei region. With the acceleration of the process of integration of environmental protection, provinces and cities in the region will inevitably deepen their cooperation in industrial carbon emission reduction. Therefore, to actively explore the development modes of the low-carbon economy, green economy, and circular economy, and to combine low-carbon construction with the transformation of the mode of industrial development, the only path to the integrated development of Beijing, Tianjin, and Hebei lies in transforming and upgrading industries, and optimizing their spatial distribution.
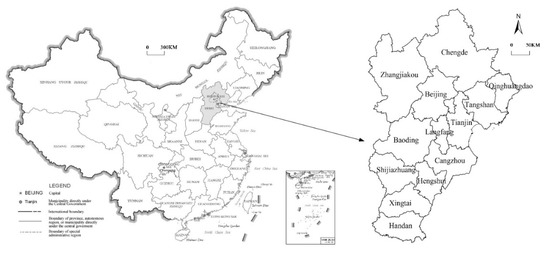
Figure 2.
Map of Beijing-Tianjin-Hebei region.
2.5.2. Data Sources
The socio-economic data and energy consumption data used in this paper were mainly from the Statistical Yearbooks for Beijing, Tianjin, and Hebei Province (Statistics Bureau of the People’s Republic of China 2001, 2006, 2011, 2016), and the statistical or economic yearbooks of 11 cities in Hebei Province for 2001, 2006, 2011, and 2016, as well as the China Industry Statistical Yearbooks (Statistics Bureau of the People’s Republic of China 2001, 2006, 2011, 2016).These yearbooks contain relevant data for 2000, 2005, 2010, and 2015. Based on the Yearbook list, excluding industries without data, 25 industrial sectors were chosen as the research object.
3. Results
According to Formula (1), the carbon emissions of industrial industries in Beijing Tianjin Hebei region in 2000, 2005, 2010, and 2015 are calculated, as shown in Table 2. Based on the data of carbon emissions, this paper makes further analysis from two dimensions of carbon entropy and carbon efficiency.
Table 2.
Carbon emissions of industrial industries in Beijing-Tianjin-Hebei region from 2000 to 2015 (Kg).
3.1. Evolutionary Characteristics of the Structure and Distribution of Industries Based on Carbon Entropy
3.1.1. Changes in Industrial Structure
The industrial carbon entropy (ICQ) and regional carbon entropy (RCQ) of the 25 industries in the Beijing-Tianjin-Hebei region were calculated using data for 2000, 2005, 2010, and 2015, with the whole country as the region hierarchically above the Beijing-Tianjin-Hebei region. According to the size of ICQ and RCQ, the 25 industries in the Beijing-Tianjin-Hebei region were divided into three types: Priority development, moderate development, and restricted development industries. Industries with ICQ and RCQ > 1 were priority development industries, and the low-carbon competitiveness of these industries was higher than both the Beijing-Tianjin-Hebei region as a whole and similar industries in China. Industries with ICQ > 1 and RCQ < 1 or ICQ < 1 and RCQ > 1 were moderate development industries, and the low-carbon development level of these industries was higher than the Beijing-Tianjin-Hebei region as a whole or similar industries in China. Industries with ICQ and RCQ < 1 were restricted development industries, and the low-carbon development level of these industries was lower than both the Beijing-Tianjin-Hebei region as a whole and similar industries in China (Table 3).
Table 3.
Industrial industry classification of Beijing-Tianjin-Hebei based on industrial carbon entropy(ICQ) and regional carbon entropy(RCQ).
In terms of industry dimensions, the ratio between the output of these three types of industries was 0:59.06:40.94 in 2000, 0:57.88:42.12 in 2005, 0:58.76:41.24 in 2010, and 9.38:54.23:36.39 in 2015. The proportion of the output of priority development industries changed from 0 to 9.38%, indicating that these industries in the Beijing-Tianjin-Hebei region were gradually developing. The proportion of the output of moderate development industries fluctuated between 54% and 60%, and the industrial carbon entropy and regional carbon entropy of these industries changed from 3.09 and 0.08 in 2000 to 2.35 and 0.10 in 2015, respectively. This indicated that their low-carbon competitiveness was significant but has been gradually decreasing in the Beijing-Tianjin-Hebei region, and was insignificant but has been gradually decreasing compared with the rest of China. The proportion of the output of restricted development industries increased from 2000 to 2005, but has decreased significantly by 19.05% since then. Their industrial carbon entropy and regional carbon entropy changed from 0.51 and 0.06 to 0.50 and 0.09, respectively. Their low-carbon competitiveness followed the same trend as moderate development industries.
According to their degree of intensiveness, the industries were divided into resource-, labor-, capital-, and technology-intensive. In 2015, the priority development industries consisted of nonferrous metal smelting and rolling processing, and instruments and cultural and office machinery manufacturing, and were dominated by capital- and technology-intensive industries. Moderate development industries included 17 industries in 2000 and 14 industries in 2015. The ratio between resources, labor, capital, and technology changed from 0.00:35.88:8.40:55.72 in 2000 to 0.00:31.36:8.16:60.48 in 2015; the proportion of labor- and capital-intensive industries decreased, while the proportion of technology-intensive industries increased, indicating that technology-intensive industries have gradually evolved into the backbone of this category. Restricted development industries included eight industries in 2000 and nine industries in 2015. The ratio between the resources, labor, capital, and technology factors changed from 15.67:18.55:20.70:45.07 to 28.42:18.95:2.20:50.43. The proportion of capital-intensive industries declined rapidly, while the proportion of resource- and technology-intensive industries rose sharply, and gradually become the backbone of restricted development industries.
3.1.2. Spatial Distribution of Industrial Types
In terms of spatial distribution (Figure 3), the priority development industries were mainly concentrated in the southeast of the Beijing-Tianjin-Hebei region. In 2000, they were distributed in Langfang, Qinhuangdao, Chengde, Tianjin, and Cangzhou, with a relatively scattered spatial pattern. In 2005, they were mainly located in Langfang and Shijiazhuang, with a small number in Zhangjiakou and Chengde, showing that their concentration had strengthened. In 2010, they were mainly distributed in Langfang, with a few in Tianjin and Zhangjiakou, indicating that their regional distribution had evolved from a multi-core pattern to a single-core pattern, and their concentration had further increased. By 2015, Langfang remained the center and a contiguous Priority Development Zone had spread to neighboring cities, dominated by Tianjin, Cangzhou, Hengshui, Shijiazhuang, and Zhangjiakou. From 2000 to 2015, the spatial distribution of moderate development industries and restricted development industries did not change significantly. Moderate development industries were mainly distributed in Beijing, Tianjin, Cangzhou, Hengshui, Shijiazhuang, and Baoding. Baoding and Cangzhou are in the south of the Beijing-Tianjin-Hebei region. In addition to undertaking the industrial transfer of textiles, clothing, and building materials in Beijing, they are also important modern manufacturing development areas containing automobiles and parts, new energy and energy equipment, fine chemicals, new materials, biological medicines, and other industries. Restricted development industries were mainly distributed in the peripheral cities of Beijing-Tianjin-Hebei, including Zhangjiakou, Chengde, Qinhuangdao, Tangshan, Handan, Xingtai, and Shijiazhuang. Tangshan and Qinhuangdao are important ports for the Beijing-Tianjin-Hebei region, and petrochemical, heavy equipment manufacturing, steel, building materials, and other industries were clustered here. Handan, Xingtai, and Shijiazhuang are located in the southwest of Beijing-Tianjin-Hebei. They were mainly engaged in industries such as textile and clothing, coal-based chemicals, food processing, equipment manufacturing, steel, and building materials. Zhangjiakou and Chengde are located in the north of Beijing-Tianjin-Hebei, with a cluster of steel, metal smelting, papermaking, chemical, building material, and other industries.
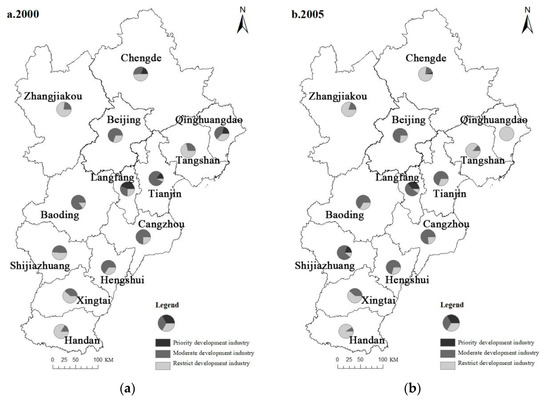
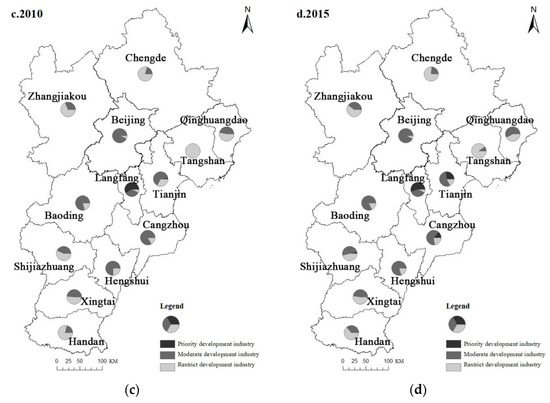
Figure 3.
Beijing-Tianjin-Hebei industrial spatial pattern based on carbon entropy in 2000 (a), 2005 (b), 2010 (c), 2015 (d).
On the whole, the spatial distribution of the three types of industries formed a pattern of concentric rings in the Beijing-Tianjin-Hebei region, with the priority development industries at the core, surrounded by moderate development industries and then restricted development industries. The formation of this spatial pattern, on the one hand, is related to the gradual clarification of the capital’s functional orientation and the gradual movement of resource-intensive and pollution-intensive industries to the peripheral areas; on the other hand, it is also the driving force of production factors under the background of globalization and localization.
3.2. Evolutionary Characteristics of the Structure and Distribution of Industries Based on Carbon Efficiency
3.2.1. Status of Industries
From 2000 to 2015, the average carbon efficiency of the Beijing-Tianjin-Hebei region changed from 0.6741 to 0.7288, showing an overall upward trend (Table 4). Among the 25 industries selected for this study, the carbon efficiency of 12 industries increased, namely textile, clothing, and other fiber products, paper and paper products, reproduction of recording media in printing, chemical raw materials and chemical products, pharmaceuticals, non-metallic mineral products, ferrous metal smelting and rolling processing, metal products, transportation equipment, instruments and cultural and office machinery manufacturing, and electricity, gas, and water production and supply, with the carbon efficiency of ferrous metal smelting and rolling processing increasing by 0.9629. Most of these 12 industries were identified as needing structural adjustment and optimization in the national economic and social development plans for Hebei, Beijing, and Tianjin during the 12th Five Year Plan, such as light and textile industry, and metallurgy. Under the constraints of the overall strategic requirements of the government’s Five Year Plan and the regional energy conservation and emission reduction development work plan, these industries have improved their carbon emission efficiency effectively by strictly controlling total expansion, optimizing the structure, and improving the level of technology and equipment. The carbon efficiency of 11 industries decreased, namely food processing, food manufacturing, beverage manufacturing, leather, fur and down products, wood processing and bamboo rattan palm grass products, petroleum processing and coking, rubber and plastic products, general machinery manufacturing, special equipment manufacturing, electrical machinery and equipment manufacturing, and computer, communication, and other electronic equipment manufacturing, with the carbon efficiency of food manufacturing decreasing the most, from 0.7707 in 2000 to 0.1097 in 2015. There were many small and medium-sized enterprises in the food processing and manufacturing industry, beverage manufacturing industry, leather, fur, and down products industry, and other industries. Their pollution emissions were large and most had not been controlled, resulting in a reduction of carbon emission efficiency. Oil and rubber are traditional pollution-intensive industries, and their carbon emission efficiency is reduced during rapid development. The carbon efficiency of furniture manufacturing and nonferrous metal smelting and rolling processing remained unchanged at 1.
Table 4.
Carbon efficiency of industrial industry in Beijing-Tianjin-Hebei region from 2000 to 2015.
According to the carbon efficiency calculations, these 25 industries were divided into three categories: High-efficiency industries, whose carbon efficiency was > 1; medium-efficiency industries, whose carbon efficiency was between 0.5–1; and low-efficiency industries, whose carbon efficiency was between 0–0.5. The number of high-efficiency industries increased from 2 in 2000 to 3 in 2015, and the proportion of their output value in the total output value of Beijing-Tianjin-Hebei region increased from 1.88% in 2000 to 6.02% in 2015. The number of medium-efficiency industries decreased from 16 to 14, but the proportion of their output remained basically unchanged, 59.27% in 2000 and 59.22% in 2015. The number of low-efficiency industries increased from 7 to 8, but their proportion of industrial output value decreased from 38.85% to 34.76%. Generally speaking, the number of medium and high-efficiency industries in the Beijing-Tianjin-Hebei region improved, while the number of low-efficiency industries declined.
Compared with the research results of Yan Y and other scholars, the power, gas and water production and supply industry, non-metallic mineral products industry and other industries belong to high carbon emission industries, and their technology research and development and improvement capabilities are at a low level, resulting in low carbon emission efficiency [32,33].
3.2.2. Spatial Layout of Industries
As can be seen from Figure 4, high-efficiency industries were mainly distributed in Tianjin and Shijiazhuang in 2000. With the rapid development of regional industries from 2005 to 2010, the spatial distribution expanded to include Beijing, Tianjin, and Shijiazhuang. By 2015, along with the industrial increment control and industrial transfer in Beijing during the 12th Five Year Plan period, the industrial expansion slowed, and high-efficiency industries were concentrated in Tianjin and Shijiazhuang again. Although there was no change in distribution compared with 2000, the output of high-efficiency industries in Tianjin and Shijiazhuang as a percentage of the total output of such industries in the Beijing-Tianjin-Hebei region changed from 24.64% and 43.90% to 60.44% and 22.32% respectively, indicating that high-efficiency industries were increasingly concentrated in Tianjin and Shijiazhuang, forming two clusters in the Beijing-Tianjin-Hebei region. In 2000, medium-efficiency industries were concentrated in Beijing and Tianjin, which accounted for 42.74% and 34.33% of total output, respectively. Since then, the agglomeration trend has begun to weaken. In 2005, medium-efficiency industries were mainly distributed in Beijing, Tianjin, and Tangshan; in 2010, they were mainly distributed in Beijing, Tianjin, Handan, Shijiazhuang, and Baoding; in 2015, they were mainly distributed in Beijing, Tianjin, Tangshan, and Shijiazhuang, which accounted for 18.87%, 29.57%, 12.09%, and 8.27% of total output, respectively. During the research period, low-efficiency industries were gradually concentrated. In 2000, they were distributed in Beijing, Tianjin, and Tangshan. In 2005, they began to shift to Shijiazhuang and by in 2015, they were concentrated in Beijing, Tianjin, and Shijiazhuang, which accounted for 24.55%, 25.01%, and 12.60% of total output, respectively.
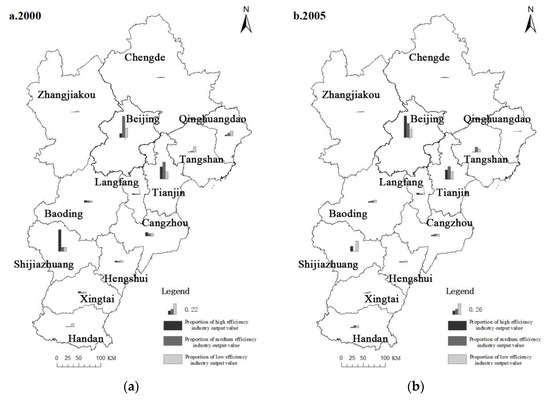
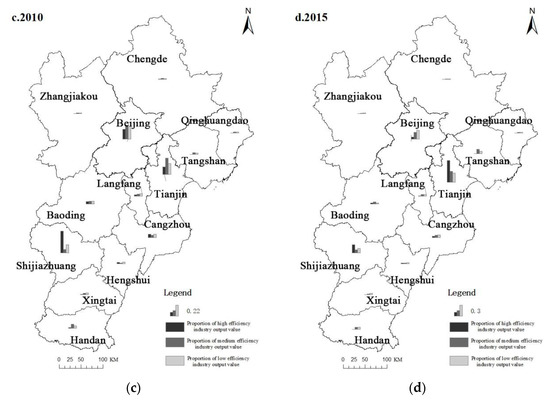
Figure 4.
Beijing-Tianjin-Hebei industrial spatial pattern based on carbon efficiency in 2000 (a), 2005 (b), 2010 (c), 2015 (d).
4. Discussion
4.1. Optimization and Regulation Strategy for Industrial Structure Transformation
According to the data for 2015 and by integrating the industry classification along the two dimensions of carbon entropy and carbon efficiency, the 25 industries in the Beijing-Tianjin-Hebei region were divided into eight categories, namely high- and medium-efficiency industries whose development should be prioritized; high-, medium-, and low-efficiency industries whose development should be moderate; and high-, medium-, and low-efficiency industries whose development should be restricted.
Based on the regional industrial development foundation, combined with the national economic and social development planning during the 13th Five Year Plan and the industrial development planning of Hebei, Beijing, and Tianjin, the following measures and pathways for the development of different types of industrial industries are proposed.
4.1.1. High-Efficiency Industries Whose Development Should Be Prioritized
This category only included instruments and cultural and office machinery manufacturing. Its output accounted for 3.54% of the total value, its carbon emissions accounted for 0.10% of the total, and its carbon density was 0.01 t/100 million Yuan. The industrial carbon entropy and regional carbon entropy were 36.48 and 1.01, and the carbon efficiency was 2.22. Industries in this category had advantages in that both their carbon entropy and carbon efficiency were high, but they derived no significant advantages from their regional carbon entropy. Therefore, we should strengthen technological innovation and policy innovation to improve their low-carbon competitiveness among similar industries in China.
4.1.2. Medium-Efficiency Industries Whose Development Should Be Prioritized
This category only included nonferrous metal smelting and rolling. Its output accounted for 5.84%, its carbon emissions accounted for 1.26%, and its carbon density was 0.05 t/100 million Yuan. The industrial carbon entropy and regional carbon entropy were 4.62 and 1.52, respectively, and the carbon efficiency was 1. The carbon entropy and carbon efficiency of industries in this category were lower than high-efficiency industries whose development should be prioritized but higher than industries in other categories; their carbon intensity was low, and their low-carbon competitiveness was better than similar industries in the Beijing-Tianjin-Hebei region and in China. Therefore, we should strengthen green technology innovation and improve carbon efficiency to transform them into high-efficiency industries as soon as possible.
4.1.3. High-Efficiency Industries Whose Development Should Be Moderate
This category only included leather, fur, and down products. Its output accounted for 2.04%, its carbon emissions accounted for 0.22%, and its carbon density was 0.03 t/100 million Yuan. The industrial carbon entropy and regional carbon entropy were 9.12 and 0.27, and the carbon efficiency was 1.05. Although industries in this category had a competitive advantage in terms of carbon emissions in the Beijing-Tianjin-Hebei region, and their carbon efficiency was high, compared with similar industries in other regions of China, their low-carbon competitiveness was weak. Therefore, we should increase investment in technology, change the traditional development mode dominated by labor-intensive industries, and vigorously develop technology-intensive industries to enhance their regional competitive advantage.
4.1.4. Medium-Efficiency Industries Whose Development Should Be Moderate
This category included eight industries, namely textile, reproduction of recording media in printing, pharmaceutical manufacturing, metal products, special equipment manufacturing, transportation equipment manufacturing, electrical machinery and equipment manufacturing, and computer, communication, and other electronics equipment manufacturing. Their output accounted for 36.55%, their carbon emissions accounted for 16.05%, and their carbon density was 0.11 t/100 million Yuan. The average industrial carbon entropy and regional carbon entropy was 2.27 and 0.09, and the average carbon efficiency was 0.77. Industries in this category are similar to high-efficiency industries whose development should be moderate. They do not have any regional competitive advantages, and their carbon efficiency is low. Therefore, “greenness” and “innovation” should be regarded as the key to their transformation and development.
4.1.5. Low-Efficiency Industries Whose Development Should Be Moderate
This category included five industries, namely food processing, food manufacturing, beverage manufacturing, petroleum processing and coking, and general machinery manufacturing. Their output accounted for 15.64%, their carbon emissions accounted for 7.34%, and their carbon density was 0.11 t/100 million Yuan. The average industrial carbon entropy and regional carbon entropy were 2.49 and 0.09, respectively, and the average carbon efficiency was 0.35. At present, industries in this category are mainly labor-intensive and capital-intensive. As a result, their regional competitive advantage is weak, and their carbon efficiency is low. Therefore, we should increase investment in technology and advance the structural adjustment of these industries to make them more technologically intense, and to improve their low-carbon competitiveness and carbon efficiency.
4.1.6. High-Efficiency Industries Whose Development Should Be Restricted
This category only included wood processing and bamboo rattan palm grass products. Its output accounted for 0.44%, its carbon emissions accounted for 2.16%, and its carbon density was 1.21 t/100 million Yuan. The industrial carbon entropy and regional carbon entropy were 0.20 and 0.01, and the carbon efficiency was 1.01. The carbon intensity of industries in this category was the highest among all industries, and their industrial and regional low-carbon competitiveness was low. Therefore, we should examine the entire production chain, strengthen low-carbon technology and introduce process innovation, reduce carbon emissions, improve the low-carbon economic development capacity, and transform these industries into high industrial and high regional carbon entropy industries, while maintaining high carbon efficiency.
4.1.7. Medium-Efficiency Industries Whose Development Should Be Restricted
This category included five industries, namely clothing and other fiber products manufacturing, furniture manufacturing, paper and paper products, rubber and plastic products, and ferrous metal smelting and rolling processing. Their output accounted for 16.83%, their carbon emissions accounted for 39.48%, and their carbon density was 0.57 t/100 million Yuan. The average industrial carbon entropy and regional carbon entropy were 0.64 and 0.06, and the average carbon efficiency was 0.86. Industries in this category were the main source of carbon emissions in the Beijing-Tianjin-Hebei region. Their carbon emissions were the highest among the eight categories, and their carbon intensity was also high. Therefore, we should strictly control the scale of their development, strengthen the introduction and use of cleaner production technologies, improve the energy structure, increase energy efficiency, and enhance their low-carbon development capacity.
4.1.8. Low-Efficiency Industries Whose Development Should Be Restricted
This category included three industries, namely chemical raw materials and chemical products manufacturing, non-metallic mineral products, and electricity, gas, and water production and supply. Their output accounted for 19.12%, their carbon emissions accounted for 33.39%, and their carbon density was 0.43 t/100 million Yuan. The average industrial carbon entropy and regional carbon entropy were 0.57 and 0.12 respectively, and the average carbon efficiency was 0.25. Industries in this category were among the main sources of carbon emissions in the Beijing-Tianjin-Hebei region. They were second only to the medium-efficiency industries whose development should be restricted in terms of carbon emissions and, therefore, the development of these industries should be similar. We should control the scale of their development, actively control carbon emissions, strengthen the control of energy consumption, and increase the use of green production technologies.
4.2. Optimization and Regulation Path of the Industrial Spatial Layout
According to the averages of the output of priority development industries and moderate development industries in various cities in the Beijing-Tianjin-Hebei region as a percentage of the output of the corresponding industries in the Beijing-Tianjin-Hebei region in 2015, and based on 1.25 times and 0.75 times the average, respectively, the Beijing-Tianjin-Hebei region was divided into three categories, namely areas whose development should be prioritized, areas whose development should be moderate, and areas whose development should be restricted. In addition, based on the average of the output of high-efficiency industries in various cities as a percentage of the output of the corresponding industries in the Beijing-Tianjin-Hebei region, the Beijing-Tianjin-Hebei region was divided into high-efficiency areas and lo- efficiency areas. In summary, the region covered by this study was divided into five categories, as follows.
4.2.1. High-Efficiency Areas Whose Development Should Be Prioritized
This category included Tianjin. In 2015, its area was 11,917 km2, its population was 10.269 million, and its total industrial output was 2505.821 billion Yuan, accounting for 5.55%, 10.48%, and 29.85% of the Beijing-Tianjin-Hebei region, respectively. The output of industries whose development should be prioritized and of moderate- and high-efficiency industries in the area as a percentage of the output of corresponding industries in the Beijing-Tianjin-Hebei region was 39.81% and 60.44%, respectively. Their carbon emissions accounted for 18.78%, and their carbon density was 0.15 t/100 million Yuan, indicating that the degree of industrialization of the area was high, its industrial and regional advantages derived from carbon economic benefits were significant, and its carbon efficiency was high. We should continue to speed up the development of high-efficiency industries and enhance their low-carbon development capacity; for nonferrous metal smelting and rolling processing, leather, fur, and down products, and other industries with low efficiency or low carbon entropy, we should focus on technological transformation and upgrades.
4.2.2. High-Efficiency Areas Whose Development Should Be Moderate
This category included Shijiazhuang. In 2015, its area was 13,056 km2, its population was 10.072 million, and its total industrial output was 891.550 billion Yuan, accounting for 6.08%, 10.92%, and 10.62% of the Beijing-Tianjin-Hebei region, respectively. The output of industries whose development should be prioritized and moderate- and high-efficiency industries in the area as a percentage of the output of corresponding industries in the Beijing-Tianjin-Hebei region was 9.30% and 22.32%, respectively. Their carbon emissions accounted for 11.22%, and their carbon density was 0.25 t/100 million Yuan, indicating that the level of development of these industries was lower than in high-efficiency areas whose development should be prioritized, but their efficiency was high, and they had a strong regional advantage in industry and the low-carbon economy. Therefore, for areas in this category, we should attach importance to low-carbon technology innovation for industries and enhance their low-carbon competitiveness.
4.2.3. Low-Efficiency Areas Whose Development Should Be Prioritized
This category included Beijing. In 2015, its area was 16,411 km2, its population was 13.452 million, and its total industrial output was 1683.066 billion Yuan, accounting for 7.64%, 13.73%, and 20.05% of the Beijing-Tianjin-Hebei region, respectively. The output of industries whose development should be prioritized and moderate- and high-efficiency industries in the area as a percentage of the output of corresponding industries in the Beijing-Tianjin-Hebei region was 21.46% and 5.62%, respectively. Their carbon emissions accounted for 10.44%, and their carbon density was 0.13 t/100 million Yuan, indicating that the area was second only to high-efficiency areas whose development should be prioritized in terms of0 the output of industries whose development should be prioritized and moderate among the five categories. This gave the area an advantage in this regard, but the carbon efficiency of industries in the area was low. Therefore, we should control low-efficiency industries, strengthen technological transformation, and focus on controlling the transformation and transfer of low-efficiency industries such as petroleum processing and coking, and chemical raw materials and chemical products manufacturing.
4.2.4. Low-Efficiency Areas Whose Development Should Be Moderate
This category included Cangzhou and Baoding. In 2015, their combined area was 36,220 km2, their combined population was 18.995 million, and their combined industrial output was 949.533 billion Yuan, accounting for 16.86%, 19.39%, and 11.31% of the Beijing-Tianjin-Hebei region, respectively. The output of industries whose development should be prioritized and moderate- and high-efficiency industries in these areas as a percentage of the output of corresponding industries in the Beijing-Tianjin-Hebei region was 12.39% and 6.38%, respectively. Their carbon emissions accounted for 8.02%, and their carbon density was 0.35 t/100 million Yuan, indicating that industries whose development should be prioritized and moderate in these areas were underdeveloped and inefficient. Therefore, to solve the problem of inefficient use of resources, we should vigorously advance the low-carbon transformation of industries, accelerate the development of high-efficiency industries whose development should be prioritized, and promote the optimization and upgrading of the industrial structure in these areas.
4.2.5. Low-Efficiency Areas Whose Development Should Be Restricted
More cities fell under this category, including Chengde, Xingtai, Qinhuangdao, Handan, Zhangjiakou, Langfang, Hengshui, and Tangshan. In 2015, their combined area was 137,259 km2, their combined population was 44.552 million, and their combined industrial output was 2.36583 trillion Yuan, accounting for 63.88%, 45.48%, and 28.18% of the Beijing-Tianjin-Hebei region, respectively. The output of industries whose development should be prioritized and moderate- and high-efficiency industries in these areas as a percentage of the output of corresponding industries in the Beijing-Tianjin-Hebei region was 17.04% and 5.24%, respectively. Their carbon emissions accounted for 51.54%, and their carbon intensity was 3.35 t/100 million Yuan, the highest among the five categories, indicating that industries whose development should be prioritized and moderate in these areas were underdeveloped and inefficient and were a major contributor to carbon emissions in the Beijing-Tianjin-Hebei region. These areas were economically underdeveloped and technologically backward. We should make priority development industry the focus of regional development to upgrade the industrial structure; and strengthen the popularity and application of cleaner production and technology to enhance the low-carbon economic competitiveness of industries. In particular, Qinhuangdao and Tangshan, which belong to the Hebei Coastal Economic Zone, should pay more attention to ecological protection when industries are transferred from elsewhere and when building nationally important new industrial bases.
5. Conclusions
In this paper, we constructed an industrial carbon entropy and regional carbon entropy model based on electricity and carbon emission data by industry for the Beijing-Tianjin-Hebei region from 2000 to 2015. Next, we built a model to evaluate the carbon efficiency of industries under a total factor framework based on the two-stage SuperSBM model to calculate the carbon efficiency of industries in the study region. We then analyzed the evolutionary characteristics of the industrial structure of and the distribution of industries in the Beijing-Tianjin-Hebei region along the two dimensions of carbon entropy and carbon efficiency and discussed the path toward their optimization. The results show that:
According to calculations made using the industrial carbon entropy and regional carbon entropy model, industries in the Beijing-Tianjin-Hebei region were divided into three categories: Priority, moderate, and restricted. The results showed that priority development industries in the Beijing-Tianjin-Hebei region were gradually developing; the regional competitiveness of moderate development industry was gradually improving, and technology-intensive industries had seen an increase in their output as a percentage of the output of such industries and had gradually evolved into the backbone of such industries. Restricted development industries had seen a significant decrease in their output and were dominated by resource- and technology-intensive industries.
In terms of spatial distribution, the three types of industries formed a concentric pattern in the Beijing-Tianjin-Hebei region with priority development industries at the core, surrounded by moderate development industries, while restricted development industries were on the periphery. A cluster of priority development industries had been formed with Langfang as the core.
From 2000 to 2015, the status of medium and high-efficiency industries in the Beijing-Tianjin-Hebei region improved, while the status of low-efficiency industries declined. In terms of spatial distribution, high- and low-efficiency industries had gradually become concentrated, while medium-efficiency industries had gradually dispersed.
There was a significant correlation between carbon entropy and carbon efficiency. Carbon efficiency is the basis for the formation of carbon entropy, and carbon entropy is a manifestation of the comparative advantage of carbon efficiency in the industry and region. Based on the results of carbon entropy and carbon efficiency analysis, and from an industry perspective, industries in the Beijing-Tianjin-Hebei region were divided into eight categories, namely high- and medium-efficiency industries whose development should be prioritized; high-, medium-, and low-efficiency industries whose development should be moderate; and high-, medium-, and low-efficiency industries whose development should be restricted. From a regional perspective, the Beijing-Tianjin-Hebei region was divided into five categories, namely high-efficiency areas whose development should be prioritized or should be moderate; and low-efficiency areas whose development should be prioritized, should be moderate, or should be restricted. On this basis, we proposed an industrial structure optimization strategy and layout reorganization optimization path in the Beijing-Tianjin-Hebei region along the two dimensions of industry and region.
Based on the principle of location entropy, this paper constructs the conceptual models of industrial carbon entropy and regional carbon entropy, and constructs a research framework for the analysis and optimization of regional industrial structure and layout characteristics from the perspective of carbon emission constraints, and takes Beijing-Tianjin-Hebei region as an example. However, due to China’s top-down energy statistics model, the lack of continuous urban scale industrial and energy consumption data, it is unable to accurately calculate the energy consumption and carbon emissions of various industrial industries at the city scale [34]. Therefore, this paper uses the secondary energy industrial electricity consumption to study the carbon emission and efficiency of various industrial industries in Beijing-Tianjin-Hebei region. Despite the above limitations, this study can provide a reference for the green transformation and spatial layout optimization of industrial structure in China’s urban intensive areas.
In addition, carbon emissions are related to many factors. Based on the comparative advantages of regional and industrial carbon emissions, this paper studies the industrial structure transformation and layout optimization. In further studies, we suggest to analyze the impact intensity, influence size and change characteristics of industrial structure, industrial agglomeration, industrial park construction, industrial technology level, and other factors on carbon emissions, so as to better understand the relationship between carbon emissions and industrial structure and spatial distribution characteristics, deepen the theoretical understanding between them, and deepen the theoretical understanding between them, to provide a theoretical basis for the research on industrial structure and spatial layout optimization based on carbon emission constraints.
Author Contributions
All the authors have contributed in the writing of this article. Y.C. conducted the data analysis and the drafting of the article. X.L. administered this research and did the editorial work on this paper. D.W. did the final check. All authors have read and agreed to the published version of the manuscript.
Funding
This research was funded by the General Program of National Natural Science Foundation of China (project number: 42071148) and the Youth Program of the Humanities and Social Science Research of the Chinese Ministry of Education (project number: 16YJC790056).
Data Availability Statement
3rd Party Data. Restrictions apply to the availability of these data. Data was obtained from [China National Knowledge Infrastructure,CNKI] and are available [https://data.cnki.net/] with the permission of [China National Knowledge Infrastructure,CNKI].
Conflicts of Interest
The authors declare no conflict of interest.
References
- Li, L.; Lei, Y.; Wu, S.; He, C.; Chen, J.; Yan, D. Impacts of City Size Change and Industrial Structure Change on CO2 Emissions in Chinese Cities. J. Clean. Prod. 2018, 195, 831–838. [Google Scholar] [CrossRef]
- Zhou, P.; Ang, B.W.; Han, J.Y. Total Factor Carbon Emission Performance: A Malmquist Index Analysis. Energy Econ. 2010, 32, 194–201. [Google Scholar] [CrossRef]
- Yu, B.; Li, X.; Qiao, Y.; Shi, L. Low-carbon Transition of Iron and Steel Industry in China: Carbon Intensity, Economic Growth and Policy Intervention. J. Environ. Sci. 2015, 28, 137–147. [Google Scholar] [CrossRef]
- Rootzen, J.; Johnsson, F. CO2 Emissions Abatement in the Nordic Carbon-intensive Industry–An End-game in Sight? Energy 2015, 80, 715–730. [Google Scholar] [CrossRef]
- Lin, B.; Moubarak, M. Decomposition Analysis: Change of Carbon Dioxide Emissions in the Chinese Textile Industry. Renew. Sustain. Energy Rev. 2013, 26, 389–396. [Google Scholar] [CrossRef]
- Elliott, R.J.; Shanshan, W.U. Industrial Activity and the Environment in China: An Industry-Level Analysis. China Econ. Rev. 2008, 19, 393–408. [Google Scholar]
- He, X.G.; Zhang, Y.H. Influence Factors and Environmental Kuznets Curve Relink Effect of Chinese Industry’s Carbon Dioxide Emission—Empirical Research Based on STIRPAT Model with Industrial Dynamic Panel Data. China Ind. Econ. 2012, 1, 26–35. (In Chinese) [Google Scholar]
- Deng, J.X.; Liu, X.; Wang, Z. Characteristics Analysis and Factor Decomposition Based on the Regional Difference Changes in China’s CO2 Emission. J. Nat. Resour. 2014, 29, 189–200. (In Chinese) [Google Scholar]
- Yuan, C.W.; Zhang, S.; Jiao, P.; Wu, D.Y. Temporal and Spatial Variation and Influencing Factors Research on Total Factor Efficiency forTransportation Carbon Emissions in China. Resour. Sci. 2017, 39, 687–697. (In Chinese) [Google Scholar]
- Xie, Z.X.; Qin, Y.C.; Shen, W.; Rong, P.J. Efficiency and Impact Factors of Low Carbon Economic Development in China. Econ. Geogr. 2017, 13, 88–93. (In Chinese) [Google Scholar]
- Zhang, X.H.; Wang, Z.R. Analysis of Influence Factors of Carbon Emission in China’s Industrial Department. J. Ind. Technol. Econ. 2013, 5, 123–129. (In Chinese) [Google Scholar]
- Pang, R.Z.; Li, P.; Lu, Y.G. Study on “New-type” Industrialization Growth Performance and Its Factors during the Transitional Period—Based on “New-type” Industrialization Total Factor Productivity. China Ind. Econ. 2011, 4, 64–73. (In Chinese) [Google Scholar]
- Yan, X.; Fang, Y.P. CO2 Emissions and Mitigation Potential of the Chinese Manufacturing Industry. J. Clean. Prod. 2015, 103, 759–773. [Google Scholar] [CrossRef]
- Ouyang, X.; Lin, B. An Analysis of the Driving Forces of Energy-related Carbon Dioxide Emissions in China’s Industrial Sector. Renew. Sustain. Energy Rev. 2015, 45, 838–849. [Google Scholar] [CrossRef]
- Faye, D. Reducing CO2 Emissions: A Comparative Input-Output Study for Germany and the UK; Proops, J.L.R., Faber M. Wagenhals, G., Eds.; Springer: Berlin, Germany, 1992. [Google Scholar]
- Schipper, L.; Murtishaw, S.; Khrushch, M. Carbon Emissions from Manufacturing Energy Use in 13 IEA Countries: Long-term Trends through 1995. Energy Policy 2001, 29, 667–688. [Google Scholar] [CrossRef]
- Lin, S.J.; Lu, I.J.; Lewis, C. Grey Relation Performance Correlations among Economics, Energy Use and Carbon Dioxide Emission in Taiwan—ScienceDirect. Energy Policy 2007, 35, 1948–1955. [Google Scholar] [CrossRef]
- Chao, W.; Jin, Z.; Yu, B.; Xi, C.; Fan, Z. Measuring Carbon Emission Performance of Industrial Sectors in the Beijing-Tianjin-Hebei Region, China: A Stochastic Frontier Approach. Sci. Total Environ. 2019, 685, 786–794. [Google Scholar]
- Zhang, Y.; Wang, Y.; Hou, X. Carbon Mitigation for Industrial Sectors in the Jing-Jin-Ji Urban Agglomeration, China. Sustainability 2019, 11, 6383. [Google Scholar] [CrossRef]
- Ke, J.; Zheng, N.; Fridley, D.; Price, L.; Zhou, N. Potential Energy Savings and CO2 Emissions Reduction of China’s Cement Industry. Energy Policy 2012, 45, 739–751. [Google Scholar] [CrossRef]
- Shi, Y.; Chen, L.; Liu, Z.; Yan, J.; Hu, J. Analysis on the Carbon Emission Reduction Potential in the Cement Industry in Terms of Technology Diffusion and Structural Adjustment: A Case Study of Chongqing. Energy Procedia 2012, 16, 121–130. [Google Scholar] [CrossRef]
- Cao, Z.; Shen, L.; Liu, L.; Zhong, S.; Liu, G. A Bottom-up Analysis of CO2 Emission Intensity of Chinese Cement Industry. Resour. Sci. 2017, 39, 2344–2357. [Google Scholar]
- Wang, Y.; Gu, S.P. Analysis of Electricity Carbon Footprint and Its Ecological Stress in China from 2006 to 2015. Acta Sci. Circumst. 2018, 38, 4873–4878. (In Chinese) [Google Scholar]
- Liu, H.; Liu, Y.; Xu, X. Optimization of Industrial Structure and Layout in Chengdu-Chongqing Economic Zone Based on Environmental Efficiency Evaluation. Resour. Environ. Yangtze Basin 2012, 9, 1058–1066. (In Chinese) [Google Scholar]
- Cook, W.D.; Liang, L.; Zha, Y.; Zhu, J. A Modified Wuper-efficiency DEA Model for Infeasibility. J. Oper. Res. Soc. 2017, 60, 276–281. [Google Scholar] [CrossRef]
- Feng, D.; li, J. Research of the Carbon Dioxide Emission Efficiency and Reduction Potential of Cities in the Beijing-Tianjin-Hebei Region. Resour. Sci. 2017, 5, 978–986. (In Chinese) [Google Scholar]
- Wang, Z.F.; Du, Y.Y. Spatial-temporal Differences and Influencing Factors of Carbon Emission Efficiency in Hunan Province Based on SBM-DEA Model. Sci. Geogr. Sin. 2019, 39, 797–806. (In Chinese) [Google Scholar]
- Jiang, S.R.; Tan, X.; Shi, L.; Ma, Z. Industrial Air Pollution Emission Efficiency in Beijing-Tianjin-Hebei and Its Surrounding Areas-based on Three Stage DEA Model. J. Arid Land Resour. Environ. 2019. [Google Scholar] [CrossRef]
- Yuan, K.H.; Mei, Y.; Chen, Y.R.; Lan, M.T. Temporal and Spatial Evolution and Influencing Mechanism of Construction Land Intensive Utilization on Carbon Emissions Efficiency in China. Resour. Sci. 2017. (In Chinese) [Google Scholar] [CrossRef]
- Zhu, C.G.; Zhang, C.M.; Qiu, F.D.; Yuan, H.; Ma, X.D. Transformation of Industrial Structure and Layout Optimization based on Low-Carbon Economy in Xuzhou Metropolitan Area. Econ. Geogr. 2017, 37, 126–135. (In Chinese) [Google Scholar]
- Guo, T.Y.; Xu, Y.; Wang, Z.Q. The Analyses of Metropolitan Efficiencies and Their Changes in China Based on DEA and Malmquist Index Models. Acta Geogr. Sin. 2009, 64, 408–416. (In Chinese) [Google Scholar]
- Yan, Y.F. Carbon Footprint’s Trends, Space, Industrial Distribution in Beijing-Tianjin-Hebei Region. Res. Econ. Manag. 2016, 37, 75–81. (In Chinese) [Google Scholar]
- Sun, L.W.; Han, Y.; Du, J. Influencing Factors of Carbon Footprint of High Energy Consumption Industry in Beijing-Tianjin-Hebei: Based on De Bruyn Model. Technol. Econ. 2019, 38, 86–92. (In Chinese) [Google Scholar]
- Wang, S.; Huang, Y.; Zhou, Y. Spatial Spillover Effect and Driving Forces of Carbon Emission Intensity at The City Level in China. J. Geogr. Sci. 2019, 29, 231–252. [Google Scholar] [CrossRef]


Publisher’s Note: MDPI stays neutral with regard to jurisdictional claims in published maps and institutional affiliations. |
© 2021 by the authors. Licensee MDPI, Basel, Switzerland. This article is an open access article distributed under the terms and conditions of the Creative Commons Attribution (CC BY) license (http://creativecommons.org/licenses/by/4.0/).