Article

Key Factors of Rural Households’ Willingness to Pay for Cleaner Heating in Hebi: A Case Study in Northern China

1
School of Management, Hefei University of Technology, Hefei 230009, China
2
Center for Climate Change and Environmental Policy, Chinese Academy of Environmental Planning, Beijing 100012, China
*
Authors to whom correspondence should be addressed.
Sustainability 2021, 13(2), 633; https://doi.org/10.3390/su13020633
Submission received: 25 November 2020 / Revised: 6 January 2021 / Accepted: 8 January 2021 / Published: 11 January 2021

Abstract

:
As coal-fired heating in winter in rural areas of northern China exacerbates air pollution, promoting cleaner heating transition is of significance for environmental sustainability. However, this is difficult as intentions and actions of rural households are deficient. This case study in northern China aims to estimate rural households’ willingness to pay (WTP) for facilities and energy for cleaner heating and explore its key factors. The survey-based analysis found that the total annual WTP for cleaner heating (sum of the WTP for heating facilities and energy per year) varied from RMB 250 to RMB 6800 (RMB 100 ≈ USD 15 in 2018), with a quite low average and a huge difference. The variation of the WTP can be attributed to economic and demographic features and environmental attitudes of households. Improvement of household income and environmental concern will enhance the WTP for cleaner heating, but a high vacancy rate and aging population in rural areas will generally inhibit it. Based on this study, some policy suggestions were proposed to promote cleaner heating transition in rural households; specifically, more attention should be paid to the poor and aged households.

1. Introduction

China’s primary energy structure and industrial structure have resulted in severe air pollution in northern China over the past decade [1]. Among all of the factors, energy consumption for indoor heating is a crucial element of the air quality deterioration in northern China in winter [2], as most of the heat is provided by burning coal directly or indirectly. In 2017, the heating area based on burning coal in northern China still accounted for 83% of the total heating area, while the heating from natural gas, electricity, geothermal energy, biomass energy, and solar energy accounted for only 17%. The annual consumption of coal for heating reached 400 million tons, half of which was consumed mainly in rural areas without decontamination [3]. The large-scale coal-based heating intensified the pollutant emissions in northern China. This caused persistent hazy weather in winter, which has threatened the health of the residents [4,5]. In order to resolve the air pollution issue, the Chinese central government issued the “Cleaner Heating Plan for Northern China in Winter (2017–2021)” in 2017 and gave a full definition of cleaner heating [3]; that is, cleaner heating requires the use of natural gas, electricity, geothermal, biomass, solar energy, industrial waste heat, clean coal (ultra-low emissions), nuclear energy, or other forms of energy that is efficiently used in the energy systems in order to achieve lower emissions and lower energy consumption from heating. Therefore, promoting cleaner energy use instead of coal burning is the key target of cleaner heating transition. Several ambitious targets were set in the plan, and one was that the cleaner heating rate in the northern rural China regions will reach 70% in 2021. Some researchers have proved that a cleaner heating transition will dramatically affect the energy structure and benefit the air quality [6,7]. However, it is difficult to change the energy consumption pattern in rural areas in a short time due to the building, economic, and social characteristics of rural households [8,9]. A huge amount of public investment and subsidies are required [10]. A comprehensive understanding of the public’s attitudes and willingness to pay (WTP) for cleaner heating (compared to coal-fired heating) can be a good guide for those developing the related policies and investments. Specifically, consumers’ different WTP, as well as its key factors, are important matters to consider when determining appropriate subsidy policies.
WTP is the maximum amount that an individual would pay to obtain certain goods or avoid certain undesirable goods, and it includes the implied rate of evaluation of future goods; thus, assessing the WTP is one of the few methods available to economists studying non-market goods [11,12]. Given the growing public interest in public goods with environmental attributes that are truly relevant to their own interests, many researchers worldwide have investigated the public’s WTP and influencing factors from different research perspectives, for example, the WTP for renewable energy [13], “sponge city” to manage the risk of flooding [14], and domestic waste management [15].
WTP estimation based on questionnaires represents a valuable approach in the field of public responsibility for energy conservation [16,17], emission reduction [18], and climate change mitigation [19]. Since the conditional valuation method can evaluate the monetary value of environmental goods without market prices, many researchers have taken this approach to investigate the public’s WTP for mitigating air pollution and improved air quality [20,21] as well as its health benefits [22]. The WTP model compensates for the lack of real market conditions by building scenarios that ask individuals whether they would pay for specific public goods that are aligned with their consumer preferences [23]. Moreover, this approach allows individuals to take all the factors into account that are important to them (e.g., income level, socioeconomic characteristics, economic losses [24], and cost of non-market goods) when making decisions. Researchers found that residents’ demographic characteristics [25], awareness, psychological factors to environmental pollution [26,27], and fiscal subsidy [28] may significantly affect their WTP for green energy or environment protection. Although some researchers have paid attention to rural households’ willingness to choose clean energy [10] in northern China, the lack of WTP estimation make it difficult to measure payment potential for cleaner heating transition and form a proper benchmark of fiscal subsidy. Moreover, WTP may vary in households due to various factors, which requires diversified incentive or subsidy policies accordingly. In this study, Hebi area in Henan Province was selected as a case study area to obtain survey data by visiting rural households. The survey data were used to assess rural households’ attitude for policies and explore distribution and influencing factors of WTP for cleaner heating.
This study will contribute a novel method to estimate rural households’ WTP for cleaner heating, in which households’ previous payments and potential WTP are both included. Most of the existing research work has focused on the WTP of consumers who have not conducted relevant activities; thus, the estimated WTP is entirely based on the potential payment intention. However, some rural households have already chosen to purchase and use facilities for cleaner heating before the survey, which means a part of the entire WTP has already been transformed into real payments. Therefore, the remaining WTP and previous payments need to be distinguished and integrated. In this study, the two components are summed up as the total WTP for heating facilities. The second contribution is from the investigated factors of the WTP. Besides traditional factors, such as income, living area, and education, household floating population and age structure are involved in this study. As young people migrate from rural areas to cities to study or work, subsequent changes in rural demographic features will possibly affect the patterns and preferences of household consumption. We will construct some indicators to indicating population outflow and aging of household to examine their relationships with WTP. The third contribution is the exploration in relationship between WTP and residents’ requirement for subsidy policy. The use of electricity or renewable energies for heating is more expensive than burning coal for heating [29]. Subsidies and effective alternative incentives will help to cover their extra expenditures for public benefits [30]. This study, which reveals the relationship between WTP and residents’ requirement for subsidy, will provide significant references for adjustment of subsidy policies for cleaner heating.
The rest of this paper is organized as follows. The second part concerns materials and methods. The third part presents the study results and discussion. Finally, the last part provides conclusions and limitations.

2. Materials and Methods
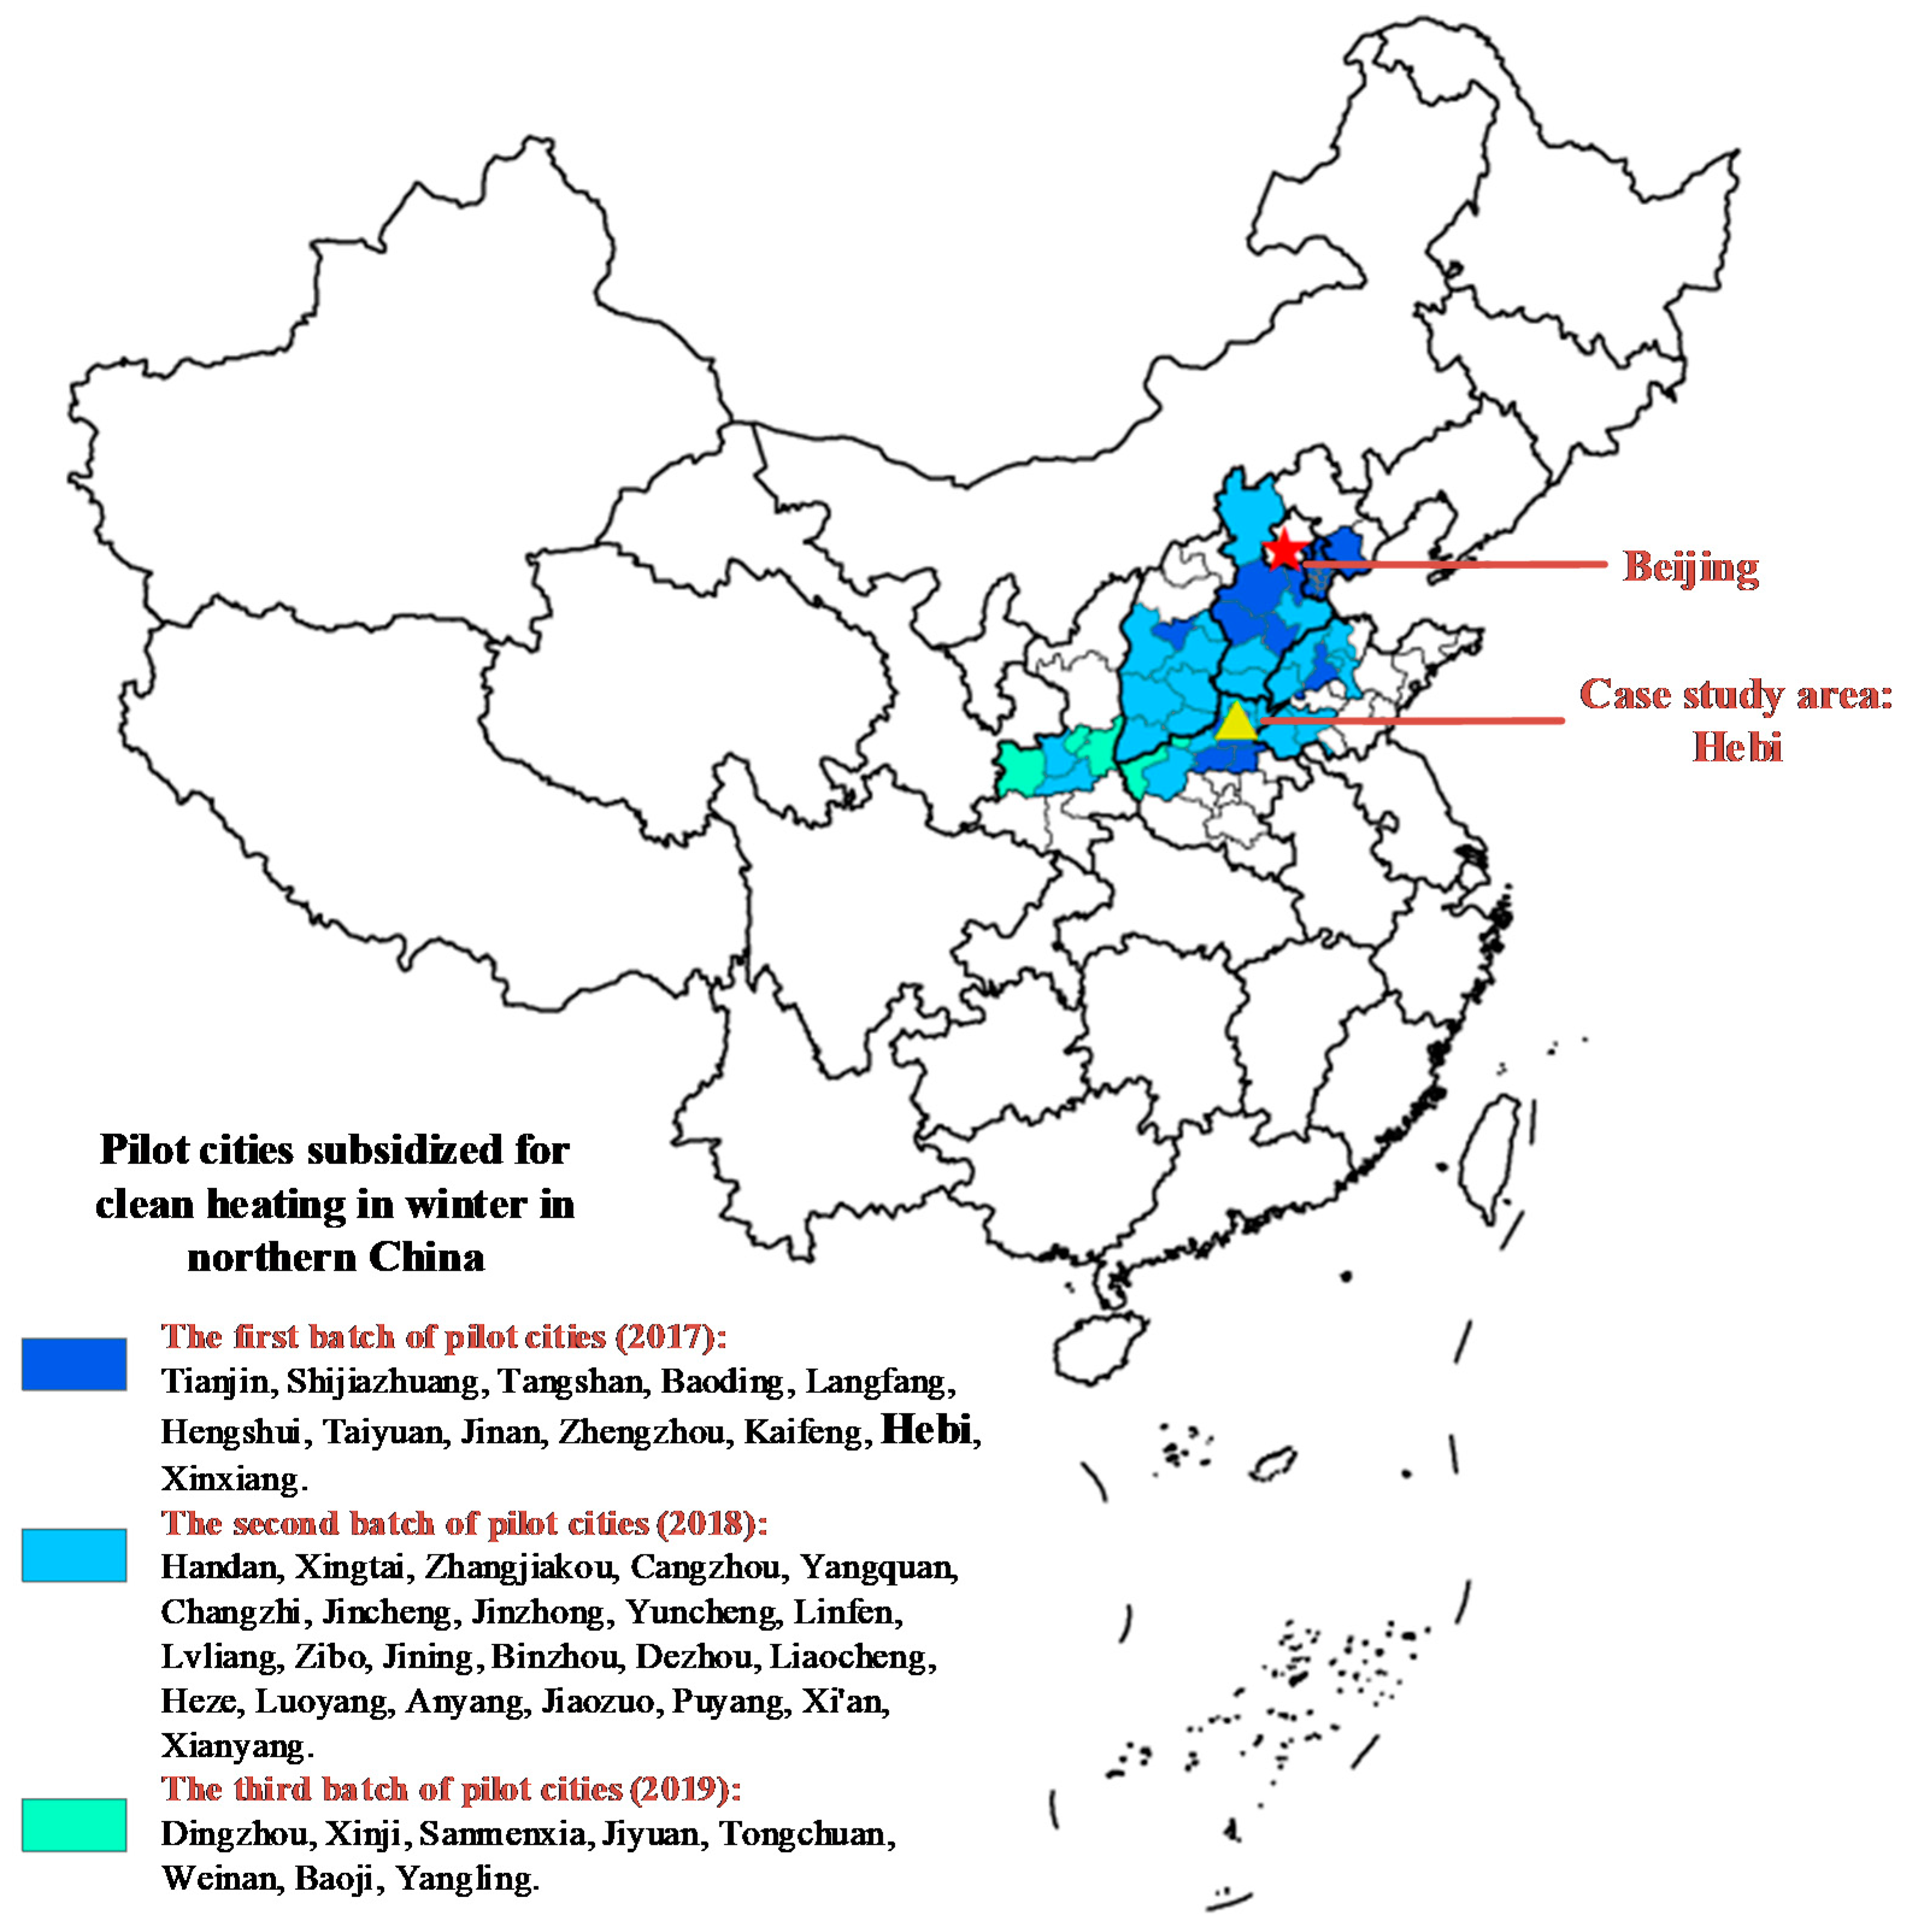
2.1. Study Area

In 2017, 12 cities in northern China were selected as pilot cities that would be subsidized for cleaner heating in winter. In 2018 and 2019, 23 cities and 8 cities were added to the list, respectively (Figure 1). Central and local governments subsidized these cities to promote cleaner heating [31]. After a period of promotion, the effects of cleaner heating policies can to be investigated. This study selects Hebi area as a case study area, which belongs to the first group of pilot cities, to identify rural households’ WTP for cleaner heating and its key factors.

2.2. Estimation of Households’ WTP for Cleaner Heating

WTP is widely used in demand analysis and the economic effect evaluation of public goods such as a good environment and fresh air. The conception of WTP in this study is how much each household is willing to pay for facilities and energy for cleaner heating per year. The energy includes electricity, gas, centralized heating, and distributed solar and biomass energy. The value of households’ WTP is estimated based on a questionnaire survey.
In addition, we propose a variable of fWTP as the WTP for cleaner heating facilities, including payment for existing facilities and the WTP for extra facilities for cleaner heating in the following 12 months. In contrast to other studies, where WTP is a concept that is only related to future expenditure, we include the payment for existing facilities. This part is considered because some households had already purchased some before the investigation, which might possibly affect their WTP for extra facilities. Another variable is the WTP for cleaner energy per year on average (eWTP), which is essential cost for cleaner heating. The total WTP (tWTP) is estimated within a year, which is defined as the WTP for facilities and energy for cleaner heating for one year. We assume that facilities can be used for 10 years on average, based on previous investigations; thus, fWTP can be simply apportioned to each year, and the tWTP of each household for cleaner heating is estimated as follows:
tWTP = fWTP / 10 + eWTP

2.3. Econometric Model

In order to analyze the relationship between WTP variables and possible influencing factors, factors including residential features, demographic features, environmental attitudes, and policy responses are taken into consideration in this study, based on previous studies [32,33]. Accordingly, the following econometric function will be studied as the basic model:
W T P i = β 0 + β 1 C + β 2 D + β 3 E + β 4 P + ε
W T P i is a set of explained variables and i is the code of the variable, C represents a set of variables about economic condition, D represents a set of variables about demographic features, E represents a set of variables about environmental attitude, P represents a set of variables about policy response, and ɛ represents the random error term. Nine models are constructed with different explained variables since they have different and significant meanings. Model 1 to Model 3 aim to identify the significant determinants of tWTP, tWTP per unit area, and tWTP per capita, respectively. Model 4 to Model 6 aim to identify the significant determinants of fWTP, fWTP per unit area, and fWTP per capita, respectively. Model 7 to Model 9 aim to identify the significant determinants of eWTP, eWTP per unit area, and eWTP per capita, respectively. Furthermore, we will use the natural logarithm of initial values of explained variables as new explained variables, if the initial values do not fit the normal distribution. Then, the basic model will be changed into:
ln ( W T P i ) = β 0 + β 1 C + β 2 D + β 3 E + β 4 P + ε

2.4. Questionnaire Survey

All of the explained and explanatory variables are defined and described in Table 1. The economic condition includes living area (Area) and household income (Income). The annual household income variable is not a continuous value; instead, it is an ordinal variable based on respondents’ selection on different income levels, which is coded from 1 to 5, representing five income levels. The demographic features include family size (Fsize), weighted proportion of residents living at home (Phome), proportion of children in the household (Pchild), proportion of the aged in the household (Paged), and the education level of the household decision-maker (Edu). The environmental attitude includes the expectation for indoor cleanliness (Ecle) and expectation for good air quality (Equa), which indicate the attitudes to the indoor environment and outside air quality, respectively. Policy response includes the level of support for cleaner heating policies (Appro) and subsidy request (Resub). Subsidy request presents the minimum request for a subsidy to purchase extra facilities for cleaner heating. The higher the Resub is, the more the household expects to receive from the government.
A survey was conducted at the end of November 2018 in Hebi, which was when the heating period had almost started. All the survey responses were collected in indoor face-to-face interviews by at least two trained investigators, most of whom were master’s candidates from top-ranking Chinese universities. Before the survey, the investigators explained the features of cleaner heating and clarified the differences between traditional heating and cleaner heating.
The first part of the survey ascertained basic information, such as the gender, age, educational background, household size, and household members’ characteristics, as well as household heating forms, building area, and heating area, among others. Furthermore, for each resident, the period when they stayed at home in the heating period (a total of 121 days, from November 1st through February 28th of the following year) was recorded in detail to calculate the number of permanent residents in each household. The second part collated energy information; that is, the energy type used by the rural households, energy consumption, and energy prices. The third part recorded the intention and policy feedback information, which included the WTP for facilities and energy, and the attitudes and suggestions related to cleaner heating. Finally, a total of 1030 households from 136 villages were randomly surveyed. A total of 707 questionnaires were confirmed to be valid for this study, which accounted for about 2% of the total rural households in the administrative region of Hebi. The sample demographics are presented in Table 2.
As some respondents failed to clarify the actual cost and WTP of heating facilities, we obtained the types and power of heating facilities based on several questions instead of asking WTP directly. We estimated household fWTP based on different types and prices of heating facilities, which were obtained from our questionnaire and market inquiries (shown in Table 3). Household eWTP was estimated based on the options for energy expenditure for cleaner heating, which is the median value of a numerical range.

3. Results and Discussion

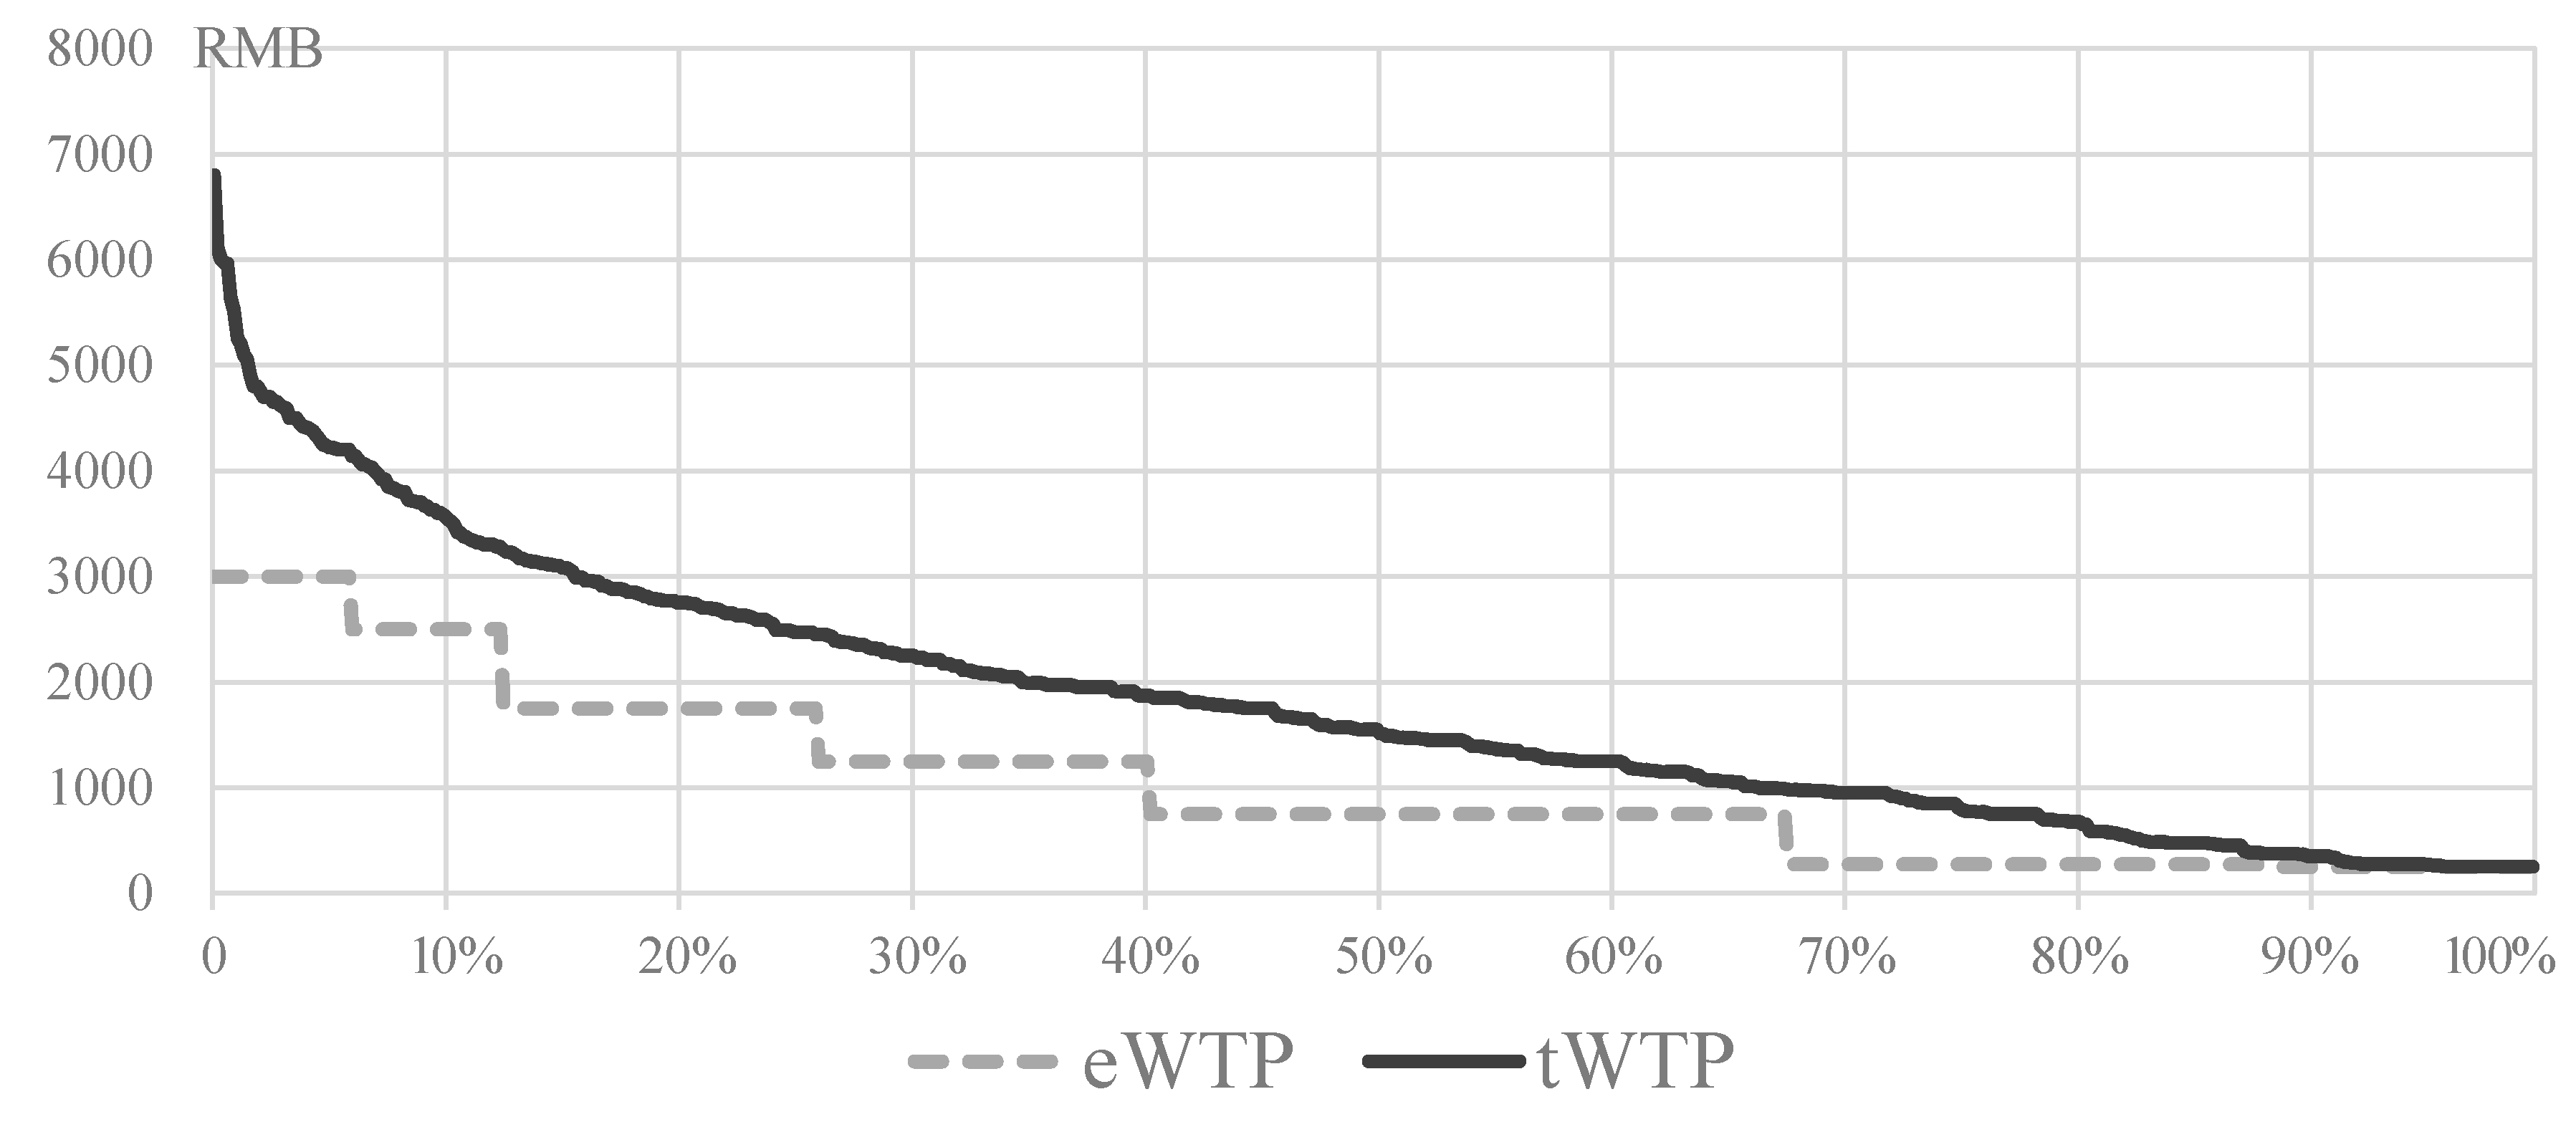
3.1. Distribution of Households’ WTP

According to the survey data, approximately 76% of households had bought at least one facility for cleaner heating before the survey. On the other hand, about three quarters of households showed a willingness to buy facilities for cleaner heating in the next 12 months. All of the households were willing to pay for cleaner energy. The tWTP, with its components, of each household was estimated. The distribution of households’ tWTP and eWTP are shown in Figure 2. With a wide distribution, the households’ tWTP is from RMB 250 to RMB 6800, with an average of RMB 1778 and median of RMB 1550. Only 1.4% of households’ tWTP exceeds RMB 5000, while 80% of households’ tWTP is below RMB 2750. The eWTP account for 59% of the tWTP by average. eWTP has a lower limit of RMB 250 and upper limit of RMB 3000 for a heating period. Compared with the annual energy expenditure for household heating in the USA (USD 720) [34], the average eWTP in the rural areas of Hebi is RMB 1049 (USD 157), which is roughly 22% of the average in the USA. In summary, the WTP for cleaner heating is relatively low in most rural families, and there is huge disparity in household WTP for cleaner heating. The reasons for this difference should be investigated, and based on this, a diversified incentive system and multiple subsidy standards should be established.

3.2. Factors Influencing Households’ WTP

As the initial value of tWTP, eWTP, and fWTP do not accord with the normal distribution, we chose Equation (3) as the basic model. Table 4 shows the descriptive statistics of all variables used in this analysis. For simplicity and brevity, abbreviations are used to denote these factors.
The correlation matrix of explanatory variables is demonstrated in Table 5. It can be concluded from the matrix that the correlation relationships of many factors are significant. However, all of the correlation coefficients are less than 0.5, indicating that there will be weak multicollinearity in multiple regression models.
The multiple regression was performed using SPSS 20.0, and the results are given in Table 6. All models proved to be statistically significant (p value < 0.001). The variance inflation factor (or VIF) of each explanatory variable in each model is lower than 1.711, which indicates the multicollinearity of explanatory variables in the models are weak. The results of t-text show that some explanatory variables are significant in the models. The estimated coefficients of Area in all models are negative and low, with high significance, which means the effects are negative but limited. Income has statistically significant positive effects on households’ tWTP and eWTP, as the coefficients in Model 1–3 and 7–9 are positive and significant, but its effect on fWTP is not significant. In terms of demographic features, Fsize has statistically significant positive effects on household WTP but negative effects on WTP per capita. Phome has significant positive effects on tWTP and eWTP, the reason of which may be that the heating area can be dynamically adjusted according to the number of residents. Pchild and Paged have significant negative effects on the tWTP and eWTP. In term of environmental attitude, Ecle has significant positive effects on all explained variables, but the effects of Equa cannot be proved. Moreover, the estimated coefficients of Appro and Resub are negative, indicating that the two factors negatively correlated to tWTP, fWTP, and eWTP. In other words, households with stronger supportive attitudes to cleaner heating policies and fiscal subsidy show less WTP for facilities and energy.
For independent variables, the value of regression coefficients not only indicates the direction of effects, but also reflects the influence degree. For positive related variables, Phome is the most important factor that determine the value of tWTP and eWTP, since it has the highest regression coefficient value. Income is next, as its regression coefficient is lower. On the contrary, Fsize and Ecle are significant but not important due to their low regression coefficients. For negatively related variables, Pchild and Paged are the first and second important factors to reduce tWTP and eWTP, which means demographic features determine the WTP for cleaner heating to a great extent. Appro and Resub are less important, while Area is negligible, according to the value of their regression coefficients.
By comparing significant independent variables in different models, it can be found that Income and Phome can positively affect tWTP and eWTP, with no impact on fWTP, while Pchild and Paged can negatively affect tWTP and eWTP, with no impact on fWTP. Thus, it can be inferred that the driving mechanism of fWTP is different from that of eWTP to a great extent. Therefore, the study is very significant for policy making, as it is designed to assess of fWTP and eWTP separately based on the questionnaire, and establish different regression models for individual variables.

3.3. Effects of Factors

3.3.1. The Effects of Economic Condition

The living area and annual income of households can be expressed as an economic condition. According to the survey, the average living area of the sample households is 163.3 m2 (36.7 m2 of living area per capita), but the average heating area of households is only 82.3 m2, which is equal to 50.4% of the living area. Rural households’ have flexible heating demands, which is why the variable Area has only a small effect on WTP variables. The coefficients and significance of variable Income indicate that increasing Income will have significant positive effects on households’ tWTP and eWTP, which is in accordance with previous studies [8]. Compared with traditional heating methods in rural areas, such as burning coal in stoves and braziers, cleaner heating requires more investments in infrastructure, equipment, and cleaner energy [35]; the economic condition is a key factor that limits households’ WTP. Furthermore, since Income affects eWTP significantly rather than fWTP, it can be inferred that the demand for heating facilities is rigid, while the demand for heating energy is elastic. Many rural households can afford simple heating facilities (price < RMB 500), while others can afford high-power facilities such as air conditioners (price > RMB 1500), but some of them cannot afford the electric power for heating. Overall, they are willing to buy facilities for cleaner heating, but they want to save electricity to save money when using the facilities, especially in low-income households. The average income of rural residents is still low in most rural areas of northern China. The average annual income of a rural resident in Henan province was RMB 13,831 in 2018, which was only 43.4% of that of a local urban resident. Therefore, public investment and fiscal subsidies are necessary to promote cleaner heating adoption in rural areas.

3.3.2. The Effects of Demographic Features

The coefficients and significance of variables Paged and Pchild indicate that a family with more aged members or that contains children have lower tWTP and eWTP. This is partly attributed to the economic pressure of supporting the elderly or raising children. Another reason is that the aged family members feel that it is difficult to change their heating habits and have no intention of promoting cleaner heating.
More permanent residents in a household will result in a higher tWTP. The high proportion of the floating population will lead to a high house vacancy rate and a low utilization rate of heating facilities. Therefore, not only the family size, but also the proportion of permanent residents significantly affects the tWTP and eWTP. These findings are of significance against the background that many rural adults move from rural areas to cities to seek better employment, and most of them live in large cities within a distance of 200–1000 km from their initial home in rural areas. According to a governmental report [36], about 16.5% of rural residents in central China leave their hometown to cities to get employed, while some of their children move to cities to get educated. The rural migrants who are engaged in work or education in cities spend only part of their time at home, particularly during the holidays of the Spring Festival (often in January and February in winter). On the one hand, an increasing demand for cleaner heating need more investment in infrastructure and facilities; on the other hand, a high vacancy rate of houses will decrease the demand for heating energy and the use efficiency of infrastructure and facilities. As the demand for cleaner heating facilities and energy will be affected by demographic features significantly, they should be a major consideration when developing policies, strategies, and standards of cleaner heating.

3.3.3. The Effects of Environmental Attitude

The environmental attitude of consumers plays a crucial role in green consumption behaviors [37]. In our survey, more than 80% of the respondents expressed a strong preference for indoor cleaning. The regression results indicate that the effects of Ecle on WTP are positive and significant. However, the effects of Equa on WTP are not significant, although 44% of the respondents have expectations for air quality improvement. According to a national survey, public environmental concern increased with increasing economic and social development [38]. Since the expectations for air quality improvement have not transformed into willingness to pay and act, much work is needed to connect environmental concern and actions.

3.3.4. The Effects of Fiscal Subsidies

Since the cost of facilities is a huge obstacle to the adoption of cleaner heating in rural areas [39], government investment and fiscal subsidies can reduce users’ burden and promote adoption of cleaner heating. Fiscal subsidies have stimulated intentions and the associated WTP for cleaner heating in some rural households, according to our survey. However, the estimated coefficients of Resub are negative and significant in all models, which means the more a household expects external support for cleaner heating, the lower WTP they show. The first reason may be that the variables of Resub and WTP are affected by Income simultaneously; that is, lower Income leads to higher Resub and lower WTP. The second reason may be that the respondents who requires more subsidy will pay less for cleaner heating by themselves. The results indicate that it is difficult to enhance the WTP of some poor households by subsidies for cleaner heating facilities. The poorest households will not change the conventional heating methods unless the cost of cleaner heating is fully borne by the government. In order to guarantee cleaner heating in these households, one way is to raise subsidy or even supply heating facilities to them directly; another way is to provide tiered subsidies according to electricity consumption, or a certain amount of free electricity for the poorest households.

3.4. Discussion

The transition of space heating in winter from burning bulk coal to electricity, natural gas, and other cleaner energies in rural areas has been strongly encouraged by the Chinese government, which is a kind of pro-environmental behavior and produces less pollution. Our study aims to evaluate the WTP of rural household for pro-environmental behavior and identify its key factors. The first finding of this study is that the WTP for cleaner energy is relatively low in most rural families, which might result in underconsumption of electricity and natural gas. Given the relatively high penetration of cleaner heating facilities in rural households, it is not the availability but the affordability of cleaner energy that has greater influence on household consumption behavior. Local governments need to shift the focus of subsidies from heating facilities to cleaner energy, since the WTP for the latter is still quite low. The relatively high cost of energy is one of the biggest obstacles to rural household cleaner heating. Reducing the cost of electricity by setting winter heating electricity pricing or providing a particular amount for free may be good choices. Moreover, as huge difference exists in household eWTP due to economic conditions, poor households should receive enough attention. Precise and differentiated subsidy policies are needed. It is necessary to establish multiple subsidy standards based on the income and number of elderly individuals in a household. Subsidies should potentially be given to disadvantaged groups, including poor households, households of disabled people, and households with the aged whose adult offspring have moved out.
The second finding is the discovery that increase of floating population could reduce the WTP for cleaner energy, but has no effect on WTP for heating facilities. It proves that household demographic features can determine rural households’ WTP for cleaner heating besides economic condition. For example, some households live in big houses but have very low heating demand, because some family members live in other houses. Moreover, rural households show an entirely different demand for cleaner energy at ordinary times and during the Spring Festival holiday due to having different numbers of family members at home. We found that a lot of households have purchased or planned to purchase heating facilities but rarely use them at ordinary times. In other words, facilities for cleaner heating are enough or even surplus in some households. To design a fair subsidy system, permanent residents of a household should be considered, while floating population should be excluded or partly considered.
The third finding is that the requirement for cleaner heating subsidy is negatively correlated with the WTP, which provides unique policy implications for cleaner heating transition. In order to meet the different demand to a certain extent, the governments should use the diversified rather than uniform standard of subsidy to increase assistance to the weak group among the rural households. However, continuous subsidy policy will lead to policy dependence and lack of consumption initiative; some households will wait for more subsidy for cleaner heating instead of raising the income on their own. It is crucial to establish an information feedback mechanism so as to achieve dynamic adjustment of subsidy policies.
Furthermore, respondents’ attitude to improving air quality is not related to WTP for cleaner heating in this study, indicating that people give little priority to environmental values when determining heating method and energy. However, residents’ willingness to improve the indoor environment has contributed to raise the WTP. Therefore, it is essential to improve residents’ environmental concern, not only for indoor environment, but also for public environments, to enhance the WTP for cleaner heating. Local governments or organizations can implement more propaganda activities in communities and schools, to popularize knowledge about environmental effects of different heating methods and the harm of air pollution.

4. Conclusions and Limitations

Our results indicate that most of the rural households show a certain amount of WTP for cleaner heating, some of which have already purchased facilities for cleaner heating and changed their consumption behaviors. However, the average household WTP for cleaner heating is quite low, especially for energy. The estimated total WTP varies from RMB 250 to RMB 6800, and is less than RMB 2000 on average. The WTP for cleaner energy is relatively low, equivalent to 22% of the average energy expenditure for household heating in the United States. The WTP for cleaner heating shows a huge difference in households due to household income, demographic features, and policy response. For a specific rural household, a higher income, a higher proportion of permanent residents, more people of working age, and a higher expectation for indoor cleanliness promotes the WTP for cleaner heating, while the proportion of aged family members and children reduces it. Therefore, improving household income and environmental concern will enhance the WTP for cleaner heating in the long term. A high vacancy rate and aging population in rural areas should be seriously treated, as they will inhibit the household purchasing power and become a big obstacle to popularize the pro-environmental behavior.
Several limitations of this study should be considered. First, some important factors of WTP may have been excluded, such as mean temperature in winter, landform of settlement, building structure, and profession of residents. Second, the interactions between factors for the WTP for cleaner heating were not discussed although these may affect the WTP. Third, the sample survey was confined to the Hebi area, a typical region; thus, the results were not diversified enough. If the data were from all parts of northern China, more results and further implications could be obtained. The limitations of this study need to be improved in future research. Studies can be extended by integrating more variables related to the WTP and discussing regional differences of the WTP in the whole of China.

Author Contributions

Conceptualization, F.L. and B.C.; methodology, W.X. and F.L.; software, C.C.; validation, W.X., F.L. and B.C.; formal analysis, C.C. and F.L.; investigation, F.L., L.C., P.W., L.P., and B.C.; resources, B.C., R.Y. and L.C.; data curation, B.C.; writing—original draft preparation, W.X. and C.C.; writing—review and editing, W.X. and F.L.; visualization, C.C.; supervision, F.L.; project administration, F.L. and R.Y.; funding acquisition, R.Y. and B.C. All authors have read and agreed to the published version of the manuscript.

Funding

This research was funded by the National Natural Science Foundation of China (71704045).

Institutional Review Board Statement

Not applicable.

Informed Consent Statement

Informed consent was obtained from all subjects involved in the study.

Data Availability Statement

The data presented in this study are available on request from the corresponding author. The data are not publicly available due to personal privacy preservation.

Acknowledgments

We thank the investigation team in the field survey in Hebi area. Useful suggestions from anonymous reviewers were incorporated into the manuscript.

Conflicts of Interest

The authors declare no conflict of interest.

References

  1. Zhang, X.; Jin, Y.; Dai, H.; Xie, Y.; Zhang, S. Health and economic benefits of cleaner residential heating in the Beijing–Tianjin–Hebei region in China. Energy Policy 2019, 127, 165–178. [Google Scholar] [CrossRef]
  2. Li, H.; You, S.; Zhang, H.; Zheng, W.; Lee, W.; Ye, T.; Zou, L. Analyzing the impact of heating emissions on air quality index based on principal component regression. J. Clean. Prod. 2018, 171, 1577–1592. [Google Scholar] [CrossRef]
  3. NDRCC. Cleaner Heating Plan for Northern China in Winter (2017–2021); National Development and Reform Commission of China: Beijing, China, 2017. Available online: https://www.ndrc.gov.cn/xxgk/zcfb/tz/201712/t20171220_962623.html (accessed on 5 June 2020).
  4. Zhou, M.; He, G.; Fan, M.; Wang, Z.; Liu, Y.; Ma, J.; Ma, Z.; Liu, J.; Liu, Y.; Wang, L.; et al. Smog episodes fine particulate pollution and mortality in China. Environ. Res. 2015, 136, 396–404. [Google Scholar] [CrossRef] [PubMed]
  5. Fan, M.; He, G.; Zhou, M. The winter choke: Coal-Fired heating air pollution and mortality in China. J. Health Econ. 2020, 71, 102316. [Google Scholar] [CrossRef] [Green Version]
  6. Tao, S.; Ru, M.Y.; Du, W.; Zhu, X.; Zhong, Q.R.; Li, B.G.; Shen, G.F.; Pan, X.L.; Meng, W.J.; Chen, Y.L.; et al. Quantifying the rural residential energy transition in China from 1992 to 2012 through a representative national survey. Nat. Energy 2018, 3, 567–573. [Google Scholar] [CrossRef]
  7. Shen, G.; Ru, M.; Du, W.; Zhu, X.; Zhong, Q.; Chen, Y.; Shen, H.; Yun, X.; Meng, W.; Liu, J.; et al. Impacts of air pollutants from rural Chinese households under the rapid residential energy transition. Nat. Commun. 2019, 10, 3405. [Google Scholar] [CrossRef] [Green Version]
  8. Zou, B.; Luo, B. Rural household energy consumption characteristics and determinants in China. Energy 2019, 182, 814–823. [Google Scholar] [CrossRef]
  9. Wang, R.; Jiang, Z. Energy consumption in China’s rural areas: A study based on the village energy survey. J. Clean. Prod. 2017, 143, 452–461. [Google Scholar] [CrossRef]
  10. Yan, Y.; Jiao, W.; Wang, K.; Huang, Y.; Chen, J.; Han, Q. Coal-to-gas heating compensation standard and willingness to make clean energy choices in typical rural areas of northern China. Energy Policy 2020, 145, 111698. [Google Scholar] [CrossRef]
  11. Cummings, R.G.; Brookshire, D.S.; Shulze, W.D. Valuing Environmental Goods: An Assessment of the Contingent Valuation Method Rowman and Allenheld New Jersey. Econ. Geogr. 1986, 63, 358–359. [Google Scholar] [CrossRef]
  12. Katz, K.; Sterner, T. The value of clean air: Consumers’ willingness to pay for a reduction in gasoline vapours at filling stations. Energy Stud. Rev. 1990, 2, 39–47. [Google Scholar] [CrossRef]
  13. Irfan, M.; Zhao, Z.; Li, H. The influence of consumers’ intention factors on willingness to pay for renewable energy: A structural equation modeling approach. Environ. Sci. Pollut. Res. 2020, 27, 21747–21761. [Google Scholar] [CrossRef] [PubMed]
  14. Wang, Y.; Sun, M.; Song, B. Public perceptions of and willingness to pay for sponge city initiatives in China. Resour. Conserv. Recycl. 2017, 122, 11–20. [Google Scholar] [CrossRef]
  15. Han, Z.; Zeng, D.; Li, Q.; Cheng, C.; Shi, G.; Mou, Z. Public willingness to pay and participate in domestic waste management in rural areas of China. Resour. Conserv. Recycl. 2019, 140, 166–174. [Google Scholar] [CrossRef]
  16. Jia, J.J.; Wu, H.Q.; Nie, H.G.; Fan, Y. Modeling the willingness to pay for energy efficient residence in urban residential sector in China. Energy Policy 2019, 135, 111003. [Google Scholar] [CrossRef]
  17. Wang, X.; Li, W.; Song, J.; Duan, H.; Fang, K.; Diao, W. Urban consumers’ willingness to pay for higher-level energy-saving appliances: Focusing on a less developed region. Resour. Conserv. Recycl. 2020, 157, 104760. [Google Scholar] [CrossRef]
  18. Sun, C.; Yuan, X.; Yao, X. Social acceptance towards the air pollution in China: Evidence from public’s willingness to pay for smog mitigation. Energy Policy 2016, 92, 313–324. [Google Scholar] [CrossRef]
  19. Yang, J.; Zou, L.; Lin, T.; Wu, Y.; Wang, H. Public willingness to pay for CO2 mitigation and the determinants under climate change: A case study of Suzhou China. J. Environ. Manag. 2014, 146, 1–8. [Google Scholar] [CrossRef]
  20. Bazrbachi, A.; Sidique, S.F.; Shamsudin, M.N.; Radam, A.; Kaffashi, S.; Adam, S.U. Willingness to pay to improve air quality: A study of private vehicle owners in Klang Valley.; Malaysia. J. Clean. Prod. 2017, 148, 73–83. [Google Scholar] [CrossRef]
  21. Wang, Y.; Sun, M.; Yang, X.; Yuan, X. Public awareness and willingness to pay for tackling smog pollution in China: A case study. J. Clean. Prod. 2016, 112, 1627–1634. [Google Scholar] [CrossRef]
  22. Wang, K.; Wu, J.; Wang, R.; Yang, Y.; Chen, R.; Maddock, J.E.; Lu, Y. Analysis of residents’ willingness to pay to reduce air pollution to improve children’s health in community and hospital settings in Shanghai China. Sci. Total Environ. 2015, 533, 283–289. [Google Scholar] [CrossRef] [PubMed]
  23. Bishop, R.C.; Mitchell, R.C.; Carson, R.T. Using Surveys to Value Public Goods: The Contingent Valuation Method. Am. J. Agric. Econ. 1990, 72, 249–250. [Google Scholar] [CrossRef]
  24. Wu, X.; Guo, J.; Wei, G. Economic losses and willingness to pay for haze: The data analysis based on 1123 residential families in Jiangsu province China. Environ. Sci. Pollut. Res. 2020, 27, 17864–17877. [Google Scholar] [CrossRef] [PubMed]
  25. Wang, Z.; Li, C.; Cui, C.; Liu, H.; Cai, B. Cleaner heating choices in northern rural China: Household factors and the dual substitution policy. J. Environ. Manag. 2019, 249, 10943. [Google Scholar] [CrossRef]
  26. Zhou, Y.; Chen, H.; Xu, S.; Wu, L. How cognitive bias and information disclosure affect the willingness of urban residents to pay for green power? J. Clean. Prod. 2018, 189, 552–562. [Google Scholar] [CrossRef]
  27. Liu, R.; Ding, Z.; Jiang, X.; Sun, J.; Jiang, Y.; Qiang, W. How does experience impact the adoption willingness of battery electric vehicles? The role of psychological factors. Environ. Sci. Pollut. Res. 2020, 27, 25230–25247. [Google Scholar] [CrossRef]
  28. Gong, Y.; Cai, B.; Sun, Y. Perceived fiscal subsidy predicts rural residential acceptance of clean heating: Evidence from an indoor-survey in a pilot city in China. Energy Policy 2020, 144, 111687. [Google Scholar] [CrossRef]
  29. Liu, H.; Mauzerall, D. Costs of clean heating in China: Evidence from rural households in the Beijing-Tianjin-Hebei region. Energy Econ. 2020, 90, 104844. [Google Scholar] [CrossRef]
  30. Ma, S.C.; Xu, J.H.; Fan, Y. Willingness to pay and preferences for alternative incentives to EV purchase subsidies: An empirical study in China. Energy Econ. 2019, 81, 197–215. [Google Scholar] [CrossRef]
  31. Hebi Municipal Government. Implementation Plan of Clean Heating in Winter in the Pilot City Hebi; Hebi Municipal Government: Hebi, China, 2017. Available online: https://www.hebi.gov.cn/zghb/436404/436461/436468/968620/1872282/index.html (accessed on 5 June 2020).
  32. Karytsas, S.; Polyzou, O.; Karytsas, C. Factors affecting willingness to adopt and willingness to pay for a residential hybrid system that provides heating/cooling and domestic hot water. Rene. Energy 2019, 142, 591–603. [Google Scholar] [CrossRef]
  33. Carter, E.; Yan, L.; Fu, Y.; Robinson, B.; Kelly, F.; Elliott, P.; Wu, Y.; Zhao, L.; Ezzati, M.; Yang, X.; et al. Household transitions to clean energy in a multiprovincial cohort study in China. Nat. Sustain. 2020, 3, 42–50. [Google Scholar] [CrossRef]
  34. Lange, I.; Moro, M.; Traynor, L. Green hypocrisy? Environmental attitudes and residential space heating expenditure. Ecol. Econ. 2014, 107, 76–83. [Google Scholar] [CrossRef] [Green Version]
  35. Zhao, X.; Sun, H.; Chen, B.; Xia, X.; Li, P. China’s rural human settlements: Qualitative evaluation quantitative analysis and policy implications. Ecol. Indic. 2019, 105, 398–405. [Google Scholar] [CrossRef]
  36. Reseach Group in Zhejiang University. China Rural Household Panel Survey Report; Zhejiang University Press: Hangzhou, China, 2019. [Google Scholar]
  37. Laroche, M.; Bergeron, J.; Barbaro-Forleo, G. Targeting consumers who are willing to pay more for environmentally friendly products. J. Consum. Marking 2001, 18, 503–520. [Google Scholar] [CrossRef] [Green Version]
  38. National Ministry of Environmental Protection of China. A National Survey Report on Public Environmental Behaviours; China Environmental Press: Beijing, China, 2020. [Google Scholar]
  39. Su, D.; Zhou, W.; Gu, Y.; Wu, B. Individual motivations underlying the adoption of cleaner residential heating technologies: Evidence from Nanjing China. J. Clean. Prod. 2019, 224, 142–150. [Google Scholar] [CrossRef]
Figure 1. Locations of pilot cities and case study area.
Sustainability 13 00633 g001
Figure 2. Distribution of households’ eWTP and tWTP.
Sustainability 13 00633 g002
Table 1. Definitions of variables.
Abbreviation of VariablesTypeDefinition and Description
Explained variables
tWTP1NumericalAnnual WTP for cleaner heating
tWTP2NumericalAnnual WTP for cleaner heating per unit area
tWTP3NumericalAnnual WTP for cleaner heating per capita
eWTP1NumericalAnnual WTP for cleaner energy
eWTP2NumericalAnnual WTP for cleaner energy per unit area
eWTP3NumericalAnnual WTP for cleaner energy per capita
fWTP1NumericalWTP for cleaner heating facilities
fWTP2NumericalWTP for cleaner heating facilities per unit area
fWTP3NumericalWTP for cleaner heating facilities per capita
Explanatory variables
RAreaNumericalThe area of living space in the house (m2)
IncomeOrdinal1–5, higher score means higher income
DFsizeNumericalThe number of household members
PhomeNumerical0–100%, higher value means higher living rate
PchildNumerical0–100%, higher value means higher raising rate
PagedNumerical0–100%, higher value means higher aging rate
EduOrdinal1–5, higher score means higher level of education
EEcleOrdinal1–5, higher score means higher expectation for indoor cleanliness
EquaOrdinal1–5, higher score means higher expectation for good air quality
PApproOrdinal1–5, higher score means higher level of support for cleaner heating policies
ResubOrdinal1–5, higher score means higher request for subsidy
Table 2. Sample demographics (n = 707).
FrequencyPercentage (%)
Gender
Male34048.1
Female36751.9
Age
20–408111.5
40–6041859.1
>6020829.4
Education level
Primary school and below25936.6
Junior high school29742.0
High school/Technical secondary school11916.8
University/Junior college 324.5
Household annual income (RMB, RMB 100 ≈ USD 15 in 2018)
10–30 k29541.7
30–50 k22732.1
50–100 k13218.7
100–200 k517.2
>200 k20.3
Table 3. Average cost of heating facilities.
Heating FacilitiesAverage Price (RMB)
Air conditioner or heat pump machine2500
Centralized heating by burning natural gas2000 (Pipeline)
Distributed heating by burning natural gas8000 (Boiler) + 2000 (Pipeline)
Simple stove by burning natural gas400
Solar cooker1500
Simple air heater200
Electric blanket100
Electric radiator200
Stove by burning biomass fuels2000
Table 4. Explanations and description of variables.
AbbreviationTypeMeanStd. dev.MinMax
Ln(tWTP1)Numerical7.200.825.58.8
Ln(tWTP2)Numerical2.250.80−1.15.5
Ln(tWTP3)Numerical5.820.803.57.8
Ln(fWTP1)Numerical8.022.003.010.5
Ln(fWTP2)Numerical3.081.91−2.96.9
Ln(fWTP3)Numerical6.651.921.09.4
Ln(eWTP1)Numerical6.620.845.58.0
Ln(eWTP2)Numerical1.680.88−1.55.0
Ln(eWTP3)Numerical5.240.853.37.3
AreaNumerical163.5105.851225
IncomeOrdinal
FsizeNumerical4.45 1.94 1 12
PhomeNumerical0.82 0.20 2
PchildNumerical0.12 0.15 0 0.6
PagedNumerical0.24 0.32 0 1
EduOrdinal
EcleOrdinal
EquaOrdinal
ApproOrdinal
ResubOrdinal
Table 5. Correlation matrix of explanatory variables.
IncomeAreaFsizePhomePchildPagedEduEcleEquaAppro
Area0.335 ***
Fsize0.416 ***0.27 ***
Phome−0.065 *−0.024−0.184 ***
Pchild0.217 ***0.0510.471 ***0.119 ***
Paged−0.323 ***−0.193 ***−0.372 ***0.214 ***−0.292 ***
Edu0.0480.0360.0380.0110.032−0.014
Ecle0.417 ***0.352 ***0.27 ***−0.0050.071 *−0.212 ***0.016
Equa0.118 ***0.154 ***0.034−0.015−0.005−0.132 ***0.030.21 ***
Appro−0.206 ***−0.157 ***−0.132 ***−0.045−0.0260.152 ***−0.032−0.251 ***−0.127 ***
Resub−0.296 ***−0.261 ***−0.186 ***0.042−0.0450.232 ***−0.011−0.307 ***−0.21 ***0.394 ***
*, **, and *** denote significance levels of 10%, 5%, and 1%, respectively.
Table 6. Regression results.
Model 1Model 2Model 3Model 4Model 5Model 6Model 7Model 8Model 9
Ln(tWTP1)Ln(tWTP2)Ln(tWTP3)Ln(fWTP1)Ln(fWTP2)Ln(fWTP3)Ln(eWTP1)Ln(eWTP2)Ln(eWTP3)
Constant6.934 ***
(0.136)
2.768 ***
(0.149)
6.524 ***
(0.139)
9.631 ***
(0.330)
5.465 ***
(0.338)
9.230 ***
(0.333)
5.897 ***
(0.198)
1.731 ***
(0.208)
5.472 ***
(0.200)
Area−0.001 **
(0.000)
−0.005 ***
(0.000)
−0.001 ***
(0.000)
−0.001 *
(0.000)
−0.005 ***
(0.000)
−0.001 *
(0.000)
−0.001 **
(0.000)
−0.005 ***
(0.000)
−0.001 ***
(0.000)
Income0.152 ***
(0.023)
0.137 ***
(0.025)
0.160 ***
(0.023)
−0.010
(0.055)
−0.025
(0.057)
0.005
(0.056)
0.261 ***
(0.033)
0.246 ***
(0.035)
0.267 ***
(0.033)
Fsize0.032 **
(0.012)
0.017
(0.013)
−0.207 ***
(0.012)
0.058 **
(0.029)
0.044
(0.030)
−0.181 ***
(0.029)
0.039 **
(0.017)
0.024
(0.018)
−0.196 ***
(0.017)
Phome0.336 **
(0.096)
0.430 ***
(0.108)
0.425 ***
(0.100)
−0.089
(0.239)
−0.001
(0.245)
−0.001
(0.241)
0.562 ***
(0.143)
0.653 ***
(0.150)
0.653 ***
(0.144)
Pchild−0.336 *
(0.14)
−0.388 *
(0.155)
−0.354 **
(0.144)
−0.320
(0.341)
−0.378
(0.350)
−0.334
(0.344)
−0.649 ***
(0.204)
−0.693 ***
(0.215)
−0.665 ***
(0.206)
Paged−0.237 ***
(0.064)
−0.187 ***
(0.071)
−0.067
(0.023)
−0.208
(0.156)
−0.141
(0.160)
−0.042
(0.158)
−0.272 ***
(0.094)
−0.212 **
(0.098)
−0.102
(0.095)
Edu0.031
(0.021)
0.027
(0.023)
−0.029
(0.022)
−0.004
(0.051)
−0.009
(0.052)
−0.009
(0.052)
0.052 *
(0.031)
0.048
(0.032)
0.047
(0.031)
Ecle0.021 ***
(0.001)
0.019 ***
(0.001)
0.021 ***
(0.001)
0.052 ***
(0.003)
0.050 ***
(0.003)
0.051 ***
(0.003)
0.009 ***
(0.002)
0.007 ***
(0.002)
0.008 ***
(0.002)
Equa0.44
(0.24)
0.007
(0.026)
0.041 *
(0.024)
−0.001
(0.058)
−0.039
(0.059)
−0.005
(0.058)
0.041
(0.035)
0.005
(0.036)
0.039
(0.035)
Appro−0.193 ***
(0.023)
−0.189 ***
(0.025)
−0.181 ***
(0.023)
−1.067 ***
(0.056)
−1.063 ***
(0.057)
−1.054 ***
(0.056)
−0.082 **
(0.033)
−0.081 **
(0.035)
−0.068 **
(0.034)
Resub−0.17 ***
(0.019)
−0.162 ***
(0.021)
−0.175 ***
(0.020)
−0.285 ***
(0.047)
−0.278 ***
(0.048)
−0.291 ***
(0.047)
−0.130 ***
(0.028)
−0.122 ***
(0.029)
−0.135 ***
(0.028)
F132.31490.741114.061135.276108.072116.04733.54134.27735.279
Adjusted R20.6720.5840.6390.6770.6260.6430.3370.3420.349
N707707707707707707707707707
*, **, and *** denote significance levels of 10%, 5%, and 1%, respectively, and the number in parentheses is the standard error of the coefficients.
Publisher’s Note: MDPI stays neutral with regard to jurisdictional claims in published maps and institutional affiliations.

