GIS-Based Expert Knowledge for Landslide Susceptibility Mapping (LSM): Case of Mostaganem Coast District, West of Algeria

 ,
, 
 ,
,  ,
,
Abstract
1. Introduction
2. Materials and Methods
2.1. Study Area
2.2. Landslide Inventory Map
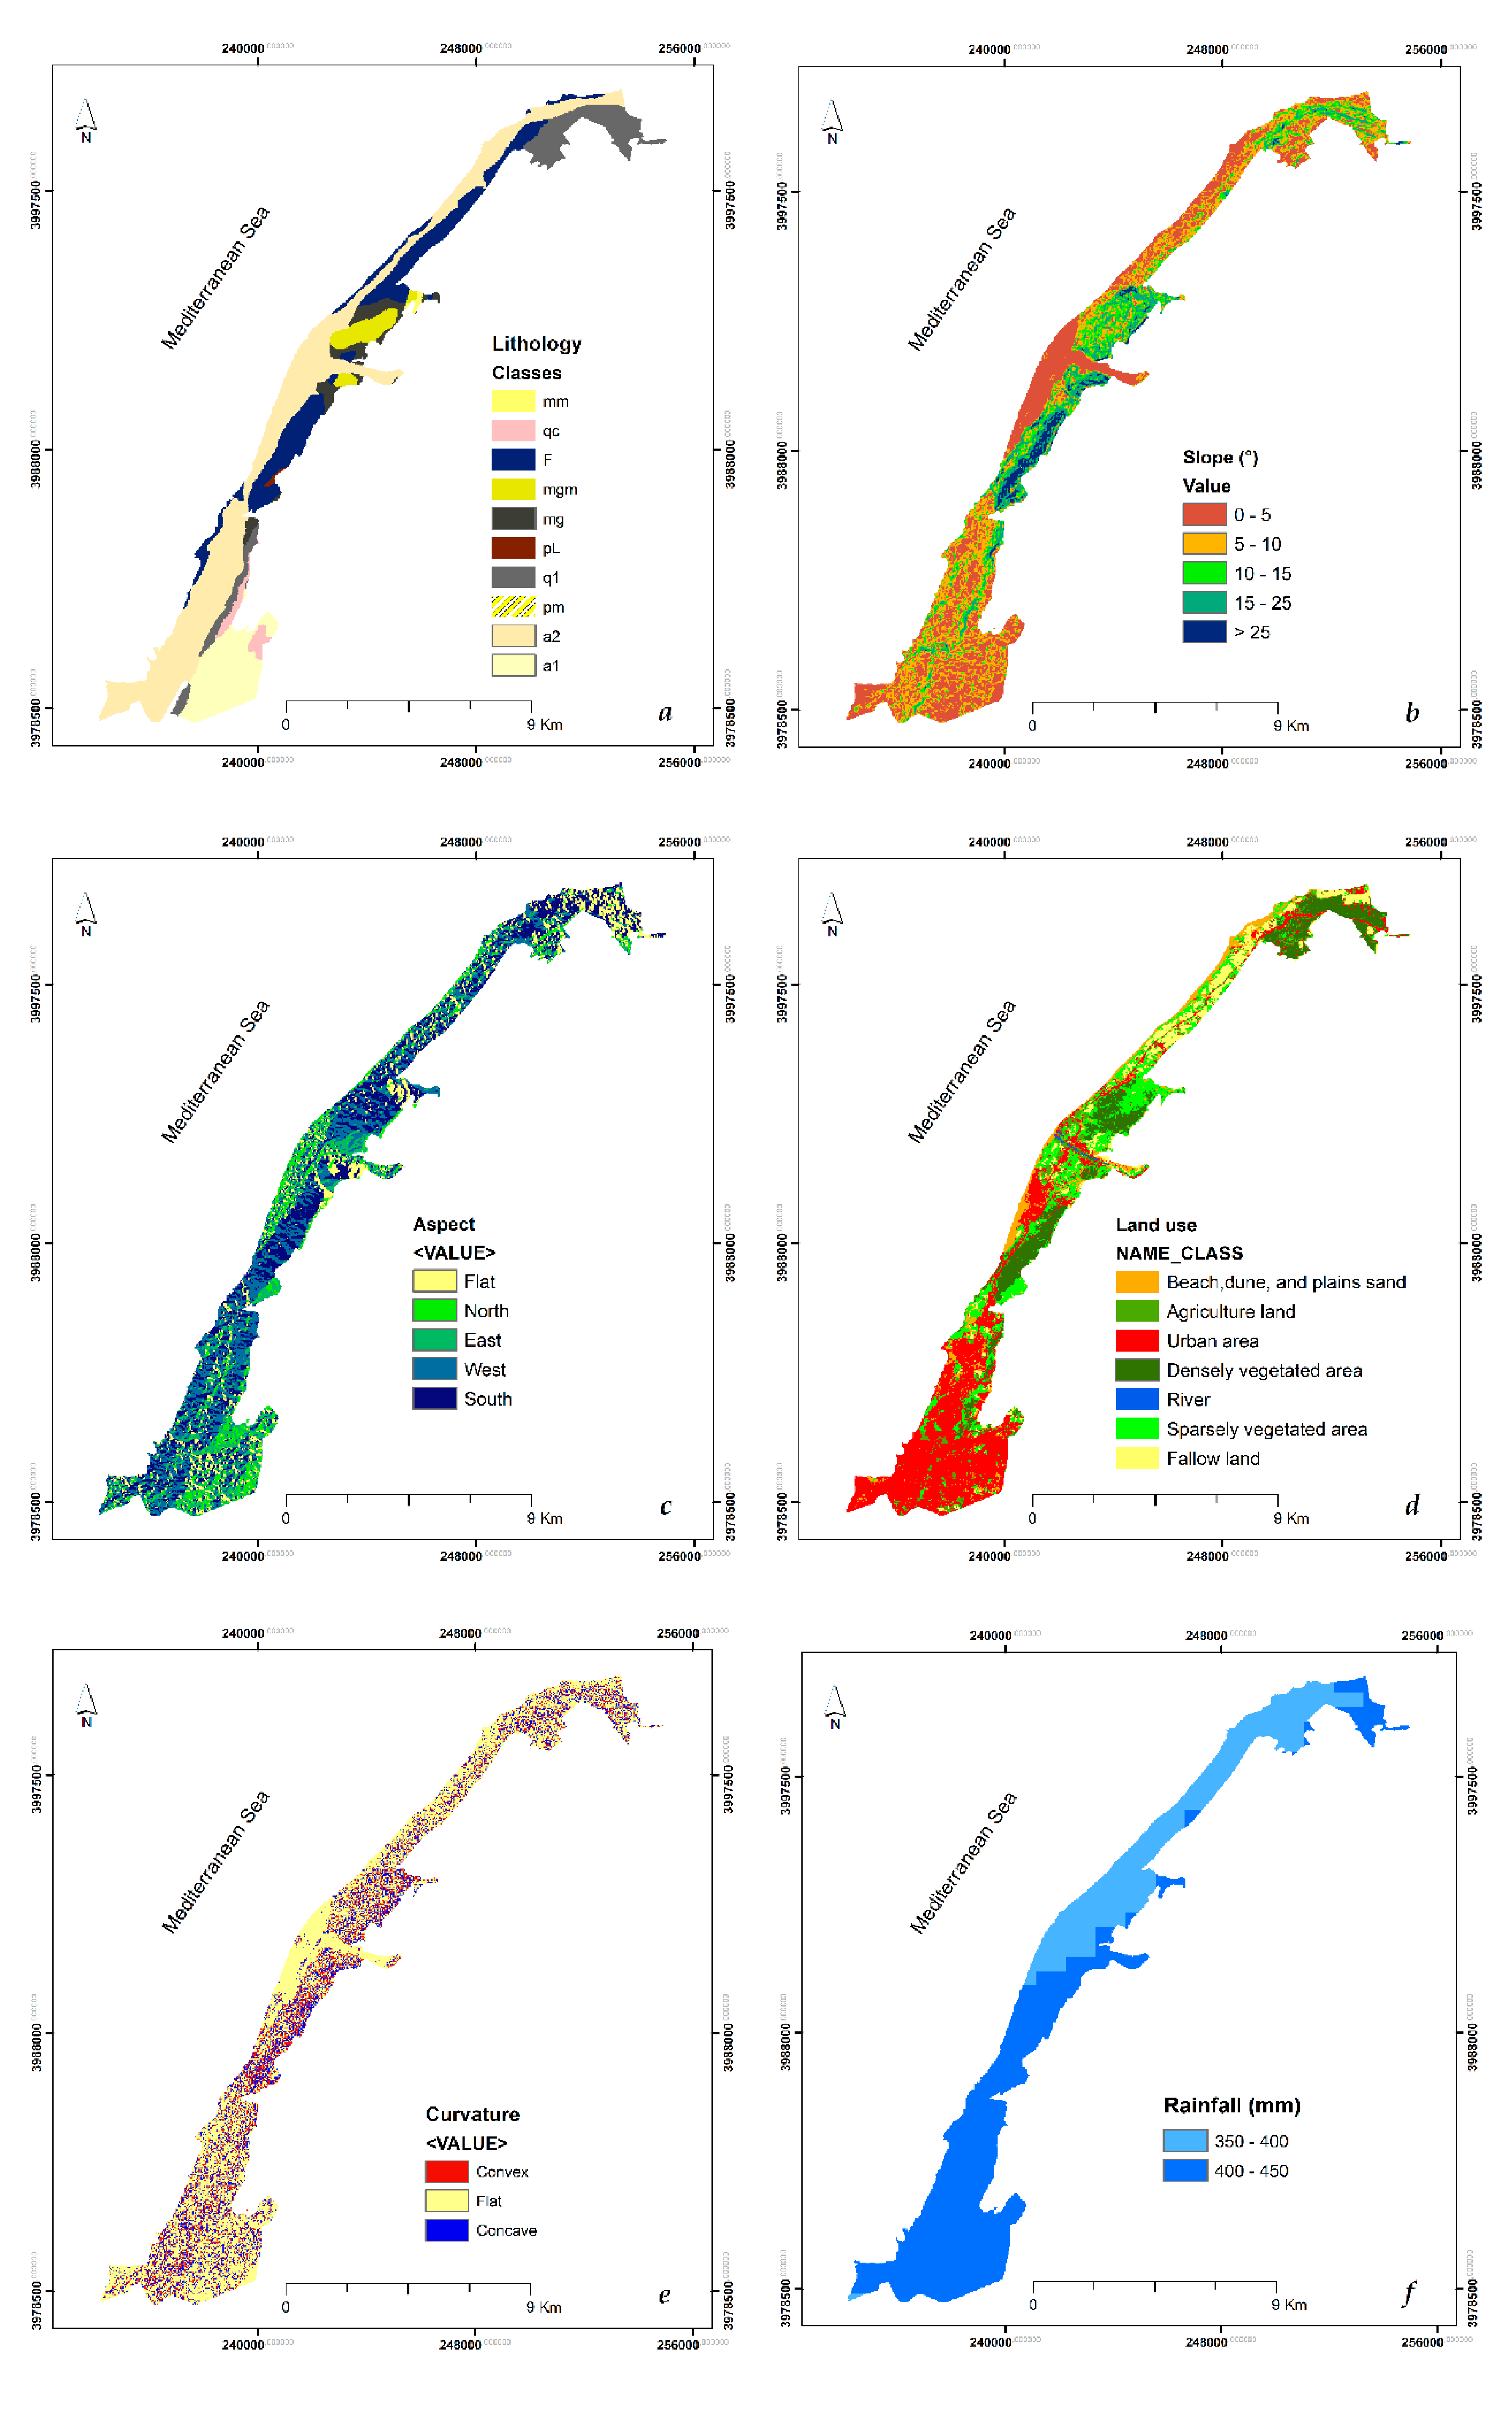
2.3. Description of Parameters
2.3.1. Lithology
2.3.2. Slope
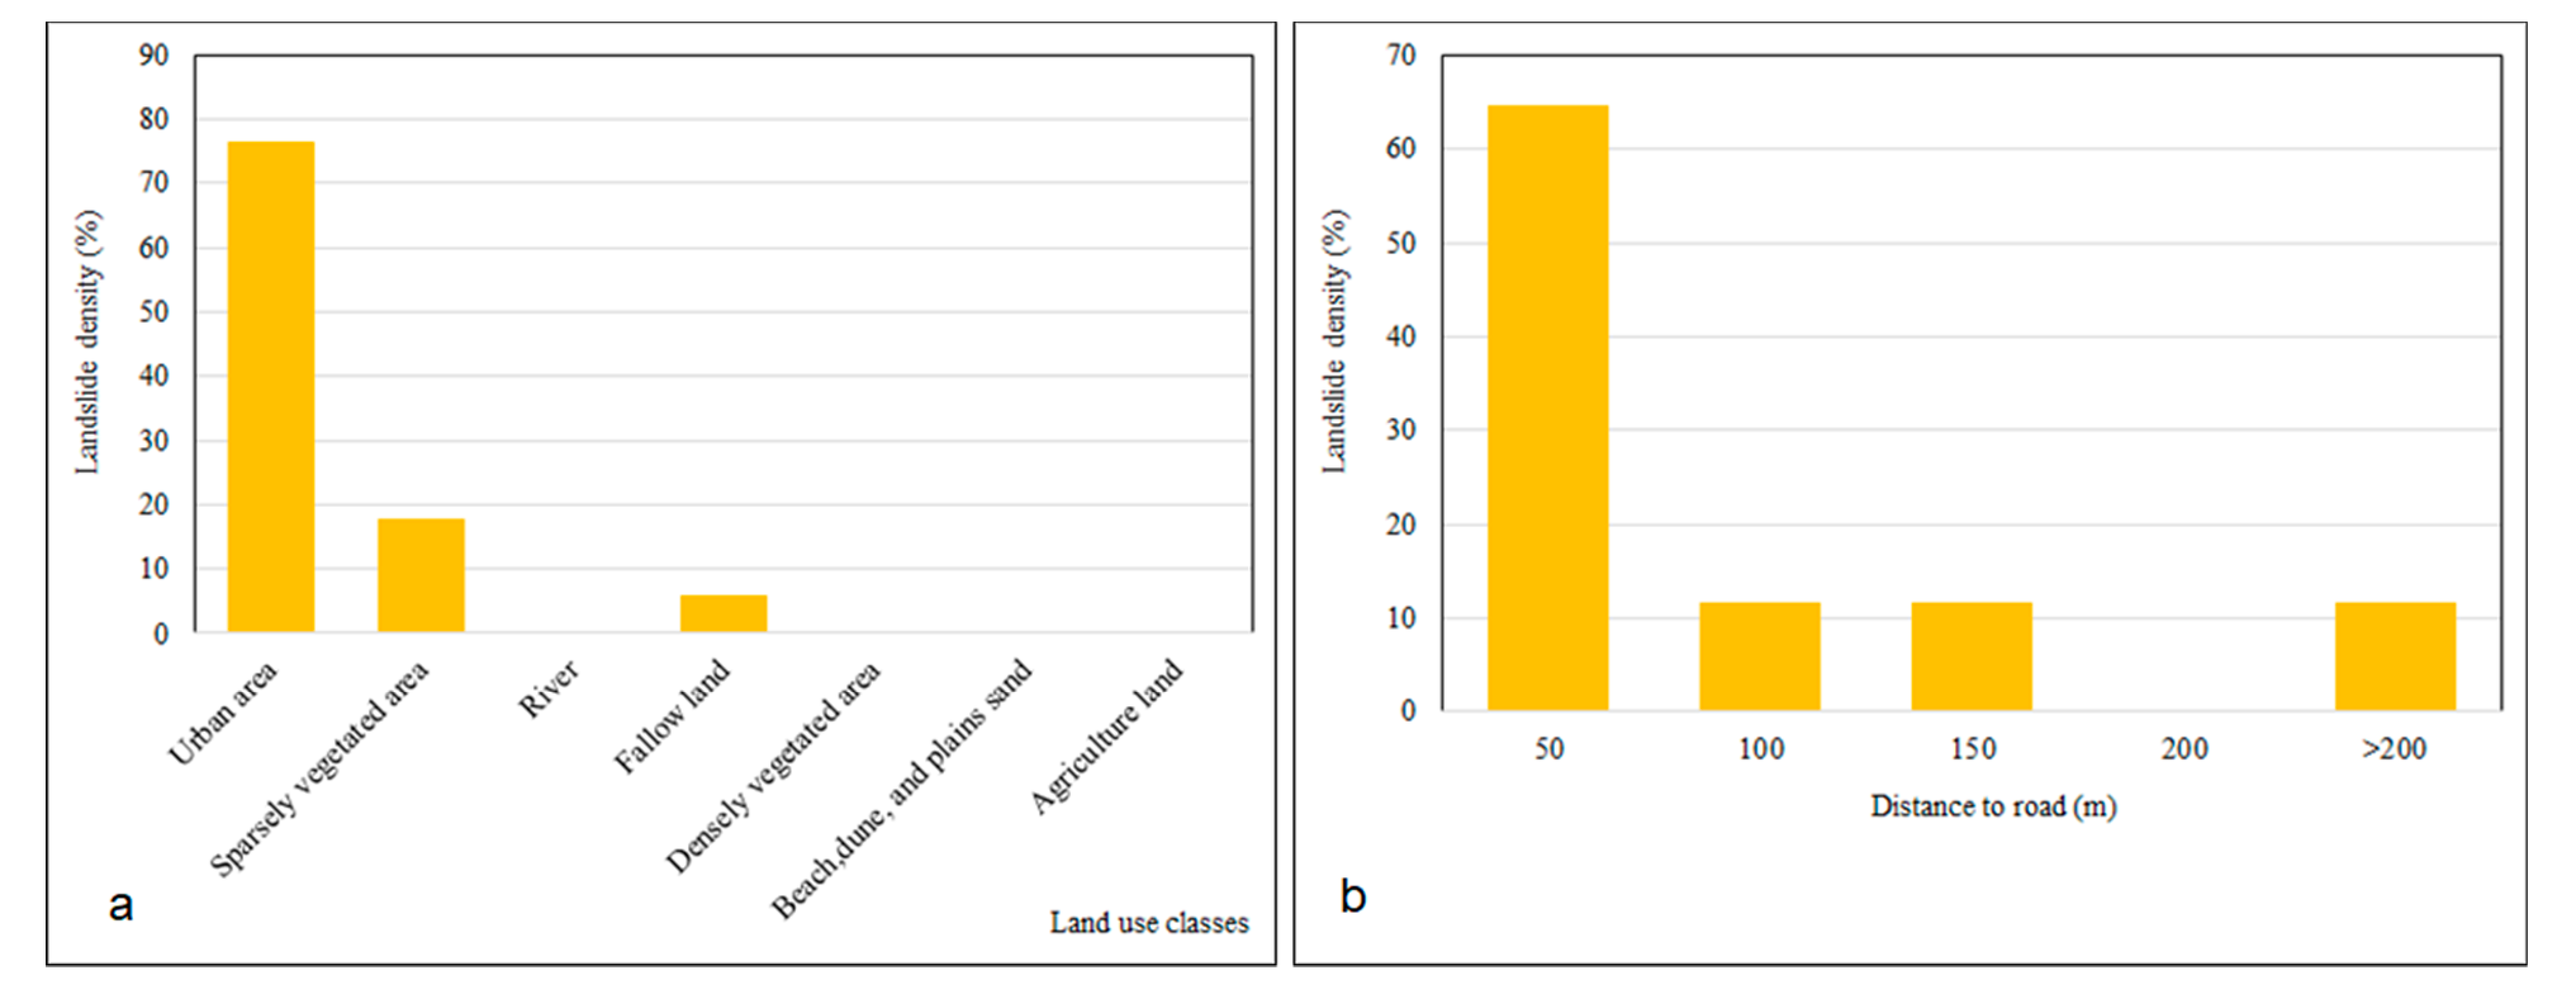
2.3.3. Land Use
2.3.4. Slope Aspect
2.3.5. Plane Curvature
2.3.6. Rainfall
2.3.7. Distance to Stream
2.3.8. Distance to Roads
2.3.9. Distance to Fault
2.4. Landslide Susceptibility Analysis
2.4.1. Knowledge-Driven Approach
2.4.2. Analytical Hierarchy Process (AHP)
2.4.3. Weighted Overlay Method (WOM)
2.4.4. Normalization
3. Results
3.1. Knowledge-Driven Approach
3.2. Analytical Hierarchy Process Weights
3.3. Landslide Susceptibility Analysis
3.4. Validation of Landslide Susceptibility Maps
- The landslide event is located in the same susceptibility class (Figure 5), the result is outstanding, and the choice of the model was correct.
- The landslide event is located in two different susceptibility classes (degree), and two hypotheses could be considered:
- -
- If the difference between the classes of the two predictive maps is one (1), the choice of the model is accepted.
- -
- If the difference is higher than one (>1), the model should be revised.
4. Conclusions
Author Contributions
Funding
Institutional Review Board Statement
Informed Consent Statement
Data Availability Statement
Acknowledgments
Conflicts of Interest
References
- Amod, D.S.; Takaaki, A.; Masamu, A. Landslide hazard mapping and its evaluation using GIS: An investigation of sampling schemes for a grid-cell based quantitative method. Photogramm. Eng. Remote Sens. 2000, 66, 981–989. [Google Scholar]
- Galli, M.; Ardizzone, F.; Cardinali, M.; Guzzetti, F.; Reichenbach, P. Comparing landslide inventory maps. Geomorphology 2008, 94, 268–289. [Google Scholar] [CrossRef]
- Shanmugam, G.; Wang, Y. The landslide problem. J. Palaeogeogr. 2015, 4, 109–166. [Google Scholar] [CrossRef]
- Rahamana, S.A.; Aruchamy, S.; Jegankumar, R. Geospatial Approach on Landslide Hazard Zonation Mapping Using Multicriteria Decision Analysis: A Study on Coonoor and Ooty, Part of Kallar Watershed, The Nilgiris, Tamil Nadu. ISPRS Int. Arch. Photogramm. Remote Sens. Spat. Inf. Sci. 2014, 1417–1422. [Google Scholar] [CrossRef]
- Pham, B.T.; Shirzadi, A.; Shahabi, H.; Omidvar, E.; Singh, S.K.; Sahana, M.; Asl, D.T.; Ahmad, B.B.; Quoc, N.K.; Lee, S. Landslide Susceptibility Assessment by Novel Hybrid Machine Learning Algorithms. Sustainability 2019, 11, 4386. [Google Scholar] [CrossRef]
- Calcaterra, D.; Parise, M. Landslide types and their relationships with weathering in a Calabrian basin, southern Italy. Bull. Int. Assoc. Eng. Geol. 2005, 64, 193–207. [Google Scholar] [CrossRef]
- Froude, M.J.; Petley, D.N. Global fatal landslide occurrence from 2004 to 2016. Nat. Hazards Earth Syst. Sci. 2018, 18, 2161–2181. [Google Scholar] [CrossRef]
- Ali, S.; Biermanns, P.; Haider, R.; Reicherter, K. Landslide susceptibility mapping by using a geographic information system (GIS) along the China–Pakistan Economic Corridor (Karakoram Highway), Pakistan. Nat. Hazards Earth Syst. Sci. 2019, 19, 999–1022. [Google Scholar] [CrossRef]
- Hidalgo, C.; Vega, J.A.; Obando, M.P. Effect of the Rainfall Infiltration Processes on the Landslide Hazard Assessment of Unsaturated Soils in Tropical Mountainous Regions. In Engineering and Mathematical Topics in Rainfall; IntechOpen: London, UK, 2018. [Google Scholar]
- Prakash, N.; Manconi, A.; Loew, S. Mapping Landslides on EO Data: Performance of Deep Learning Models vs. Traditional Machine Learning Models. Remote Sens. 2020, 12, 346. [Google Scholar] [CrossRef]
- Wang, Q.; Wang, D.; Huang, Y.; Wang, Z.; Zhang, L.; Guo, Q.; Chen, W.; Chen, W.; Sang, M. Landslide Susceptibility Mapping Based on Selected Optimal Combination of Landslide Predisposing Factors in a Large Catchment. Sustainability 2015, 7, 16653–16669. [Google Scholar] [CrossRef]
- Machane, D.; Bouhadad, Y.; Cheikhlounis, G.; Chatelain, J.L.; Oubaiche, E.H.; Abbès, K.; Guillier, B.; Bensalem, R. Examples of geomorphologic and geological hazards in Algeria. Nat. Hazards 2008, 45, 295–308. [Google Scholar] [CrossRef]
- Djerbal, L. Analyse des Mécanismes de déFormation et de la Rupture Progressive du Versant Instable d’Ain El Hammam. Ph.D. Thesis, Université Mouloud Mammeri de Tizi-Ouzou, Tizi-Ouzou, Algeria, 2013. [Google Scholar]
- Guzzetti, F.; Carrara, A.; Cardinali, M.; Reichenbach, P. Landslide hazard evaluation: A review of current techniques and their application in a multi-scale study, Central Italy. Geomorphology 1999, 31, 181–216. [Google Scholar] [CrossRef]
- Hadmoko, D.S.; Lavigne, F.; Sartohadi, J.; Hadi, P.; Winaryo, P. Landslide hazard and risk assessment and their application in risk management and landuse planning in eastern flank of Menoreh Mountains, Yogyakarta Province, Indonesia. Nat. Hazards 2010, 54, 623–642. [Google Scholar] [CrossRef]
- Hadji, R.; Achour, Y.; Hamed, Y. Using GIS and RS for Slope Movement Susceptibility Mapping: Comparing AHP, LI and LR Methods for the Oued Mellah Basin, NE Algeria. In Collaboration and Integration in Construction, Engineering, Management and Technology; Springer: Berlin/Heidelberg, Germany, 2018; pp. 1853–1856. [Google Scholar]
- Pourghasemi, H.R.; Pradhan, B.; Gokceoglu, C. Application of fuzzy logic and analytical hierarchy process (AHP) to landslide susceptibility mapping at Haraz watershed, Iran. Nat. Hazards 2012, 63, 965–996. [Google Scholar] [CrossRef]
- Soeters, R.; Van Westen, C.J. Slope instability recognition, analysis and zonation. Landslides Investig. Mitig. 1996, 247, 129–177. [Google Scholar]
- Aleotti, P.; Baldelli, P.; Polloni, G. Landsliding and Flooding Event Triggered by Heavy Rains in the Tanaro Basin (Italy). 1996. Available online: http://www.interpraevent.at/palm-cms/upload_files/Publikationen/Tagungsbeitraege/1996_1_435.pdf (accessed on 11 January 2021).
- Ayalew, L.; Yamagishi, H. The application of GIS-based logistic regression for landslide susceptibility mapping in the Kakuda-Yahiko Mountains, Central Japan. Geomorphology 2005, 65, 15–31. [Google Scholar] [CrossRef]
- Pardeshi, S.D.; Autade, S.E.; Pardeshi, S.S. Landslide hazard assessment: Recent trends and techniques. SpringerPlus 2013, 2. [Google Scholar] [CrossRef]
- Mahalingam, R.; Olsen, M.J.; O’Banion, M.S. Evaluation of landslide susceptibility mapping techniques using lidar-derived conditioning factors (Oregon case study). Geomat. Nat. Hazards Risk 2016, 7, 1884–1907. [Google Scholar] [CrossRef]
- Lee, S. Landslide susceptibility mapping using an artificial neural network in the Gangneung area, Korea. Int. J. Remote Sens. 2007, 28, 4763–4783. [Google Scholar] [CrossRef]
- Thiery, Y.; Terrier, M. Évaluation de l’aléa glissements de terrain: État de l’art et perspectives pour la cartographie réglementaire en France. Revue Française Géotechnique 2019, 156. [Google Scholar] [CrossRef]
- Saadatkhah, N.; Kassim, A.; Lee, L.M. Qualitative and quantitative landslide susceptibility assessments in Hulu Kelang area Malaysia. Electron. J. Geotech. Eng. 2014, 19, 545–563. [Google Scholar]
- Mandaglio, M.C.; Gioffrè, D.; Pitasi, A.; Moraci, N. Qualitative Landslide Susceptibility Assessment in Small Areas. Procedia Eng. 2016, 158, 440–445. [Google Scholar] [CrossRef][Green Version]
- Van Westen, C.J.; Rengers, N.; Soeters, R. Use of Geomorphological Information in Indirect Landslide Susceptibility Assessment. Nat. Hazards 2003, 30, 399–419. [Google Scholar] [CrossRef]
- Gupta, S.K.; Shukla, D.P.; Thakur, M. Selection of weightages for causative factors used in preparation of landslide susceptibility zonation (LSZ). Geomat. Nat. Hazards Risk 2018, 9, 471–487. [Google Scholar] [CrossRef]
- Saaty, T.L. The Analytic Hierarchy Process; McGraw-Hill: New York, NY, USA, 1980. [Google Scholar]
- Vakhshoori, V.; Pourghasemi, H.R.; Zare, M.; Blaschke, T. Landslide Susceptibility Mapping Using GIS-Based Data Mining Algorithms. Water 2019, 11, 2292. [Google Scholar] [CrossRef]
- Zhou, G.; Esaki, T.; Mitani, Y.; Xie, M.; Mori, J. Spatial probabilistic modeling of slope failure using an integrated GIS Monte Carlo simulation approach. Eng. Geol. 2003, 68, 373–386. [Google Scholar] [CrossRef]
- Van Westen, C.J.; Rengers, N.; Terlien, M.T.J.; Soeters, R. Prediction of the occurrence of slope instability phenomenal through GIS-based hazard zonation. Acta Diabetol. 1997, 86, 404–414. [Google Scholar] [CrossRef]
- Lee, S.; Min, K. Statistical analysis of landslide susceptibility at Yongin, Korea. Environ. Earth Sci. 2001, 40, 1095–1113. [Google Scholar] [CrossRef]
- Yesilnacar, E.; Topal, T. Landslide susceptibility mapping: A comparison of logistic regression and neural networks methods in a medium scale study, Hendek region (Turkey). Eng. Geol. 2005, 79, 251–266. [Google Scholar] [CrossRef]
- Nefeslioglu, H.A.; Gokceoglu, C.; Sonmez, H. An assessment on the use of logistic regression and artificial neural networks with different sampling strategies for the preparation of landslide susceptibility maps. Eng. Geol. 2008, 97, 171–191. [Google Scholar] [CrossRef]
- Choi, J.; Oh, H.J.; Lee, H.J.; Lee, C.; Lee, S. Combining landslide susceptibility maps obtained from frequency ratio, logistic regression, and artificial neural network models using ASTER images and GIS. Eng. Geol. 2012, 124, 12–23. [Google Scholar] [CrossRef]
- Pradhan, B.; Lee, S. Landslide susceptibility assessment and factor effect analysis: Backpropagation artificial neural networks and their comparison with frequency ratio and bivariate logistic regression modelling. Environ. Model. Softw. 2010, 25, 747–759. [Google Scholar] [CrossRef]
- Yalcin, A.; Reis, S.; Aydinoglu, A.; Yomralioglu, T. A GIS-based comparative study of frequency ratio, analytical hierarchy process, bivariate statistics and logistics regression methods for landslide susceptibility mapping in Trabzon, NE Turkey. Catena 2011, 85, 274–287. [Google Scholar] [CrossRef]
- Vakhshoori, V.; Zare, M. Landslide susceptibility mapping by comparing weight of evidence, fuzzy logic, and frequency ratio methods. Geomat. Nat. Hazards Risk 2016, 7, 1731–1752. [Google Scholar] [CrossRef]
- Bourenane, H.; Bouhadad, Y.; Guettouche, M.S.; Braham, M. GIS-based landslide susceptibility zonation using bivariate statistical and expert approaches in the city of Constantine (Northeast Algeria). Bull. Int. Assoc. Eng. Geol. 2014, 74, 337–355. [Google Scholar] [CrossRef]
- Dahoua, L.; Yakovitch, S.; Hadji, R.H. GIS-based technic for roadside-slope stability assessment: A bivariate approach for A1 East-west highway, North Algeria. Min. Sci. 2017, 24. [Google Scholar] [CrossRef]
- Achour, Y.; Boumezbeur, A.; Hadji, R.; Chouabbi, A.; Cavaleiro, V.; Bendaoud, E.A. Landslide susceptibility mapping using analytic hierarchy process and information value methods along a highway road section in Constantine, Algeria. Arab. J. Geosci. 2017, 10, 194. [Google Scholar] [CrossRef]
- Manchar, N.; Benabbas, C.; Hadji, R.; Bouaicha, F.; Grecu, F. Landslide Susceptibility Assessment in Constantine Region (NE Algeria) By Means of Statistical Models. Stud. Geotech. Mech. 2018, 40, 208–219. [Google Scholar] [CrossRef]
- Roukh, Z.E.A.; Abdelmansour, N. Landslide susceptibility mapping using information value and frequency ratio for the Arzew sector (North-Western of Algeria). Bull. Miner. Res. Explor. 2018, 1–10. [Google Scholar] [CrossRef]
- Senouci, R.; Taibi, N.E. Impact of the Urbanization on Coastal Dune: Case of Kharrouba, West of Algeria. J. Sediment. Environ. 2019, 4, 90–98. [Google Scholar] [CrossRef]
- Bourenane, H.; Guettouche, M.S.; Bouhadad, Y.; Braham, M. Landslide hazard mapping in the Constantine city, Northeast Algeria using frequency ratio, weighting factor, logistic regression, weights of evidence, and analytical hierarchy process methods. Arab. J. Geosci. 2016, 9, 1–24. [Google Scholar] [CrossRef]
- Agence Nationale d’Aménagement de Territoire. Plan d’Aménagement Côtier; Rapport; ANAT: Kouba, Algérie, 2005. [Google Scholar]
- Taibi, N.E. Conflict between Coastal Tourism Development and Sustainability: Case of Mostaganem, Western Algeria. Eur. J. Sustain. Dev. 2016, 5, 13–24. [Google Scholar] [CrossRef]
- Godbani, T. Environnement et Littoralisation de l’Ouest Algérien. Ph.D. Thesis, Université d’Oran 2, Oran, Algeria, 2009. [Google Scholar]
- Caïd, N.; Chachoua, M.; Berrichi, F. Analyse spatiale diachronique de l’occupation du vignoble algérien depuis 60 ans: Cas de la wilaya de Mostaganem. Physio-Géo Géographie Physique Environ. 2019, 13, 53–74. [Google Scholar] [CrossRef]
- Megherbi, W. L’ensablement, Un Risque Négligé en Zone Tellienne Littorale Cas de la Région Mostaganem. Master’s Thesis, Université d’Oran 2, Oran, Algeria, 2015. [Google Scholar]
- Zaoui, M. Système D’information Géographique et Méthodologie Multicritère pour le Choix de Sites de Retenues Collinaires: Application pour la Wilaya de Mostaganem, Algérie. Ph.D. Thesis, Université de Mostaganem, Mostaganem, Algeria, 2015. [Google Scholar]
- Senouci, M.; Trache, A.E.H. Etude de la Vulnérabilité aux Changement Climatiques de la Wilaya de Mostaganem; Deutsche Gesellschaft für Internationale Zusammenarbeit (GIZ) GmbH: Ageria, Algeria, 2014. [Google Scholar]
- Del Ventisette, C.; Righini, G.; Moretti, S.; Casagli, N. Multitemporal landslides inventory map updating using spaceborne SAR analysis. Int. J. Appl. Earth Obs. Geoinf. 2014, 30, 238–246. [Google Scholar] [CrossRef]
- Moosavi, V.; Talebi, A.; Shirmohammadi, B. Producing a landslide inventory map using pixel-based and object-oriented approaches optimized by Taguchi method. Geomorphology 2014, 204, 646–656. [Google Scholar] [CrossRef]
- Guzzetti, F.; Reichenbach, P.; Cardinali, M.; Galli, M.; Ardizzone, F. Probabilistic landslide hazard assessment at the basin scale. Geomorphology 2005, 72, 272–299. [Google Scholar] [CrossRef]
- Van Westen, C.J.; Van Asch, T.W.J.; Soeters, R. Landslide hazard and risk zonation—Why is it still so difficult? Bull. Eng. Geol. Environ. 2006, 65, 167–184. [Google Scholar] [CrossRef]
- Guri, P.K.; Ray, P.K.C.; Patel, R.C. Spatial prediction of landslide susceptibility in parts of Garhwal Himalaya, India, using the weight of evidence modelling. Environ. Monit. Assess. 2015, 187, 1–25. [Google Scholar] [CrossRef]
- Cardinali, M.; Reichenbach, P.; Guzzetti, F.; Ardizzone, F.; Antonini, G.; Galli, M.; Cacciano, M.; Castellani, M.; Salvati, P. A geomorphological approach to the estimation of landslide hazards and risks in Umbria, Central Italy. Nat. Hazards Earth Syst. Sci. 2002, 2, 57–72. [Google Scholar] [CrossRef]
- Igwe, O. The geotechnical characteristics of landslides on the sedimentary and metamorphic terrains of South-East Nigeria, West Africa. Geoenviron. Disasters 2015, 2, 1. [Google Scholar] [CrossRef]
- Kouli, M.; Loupasakis, C.; Soupios, P.; Vallianatos, F. Landslide hazard zonation in high risk areas of Rethymno Prefecture, Crete Island, Greece. Nat. Hazards 2009, 52, 599–621. [Google Scholar] [CrossRef]
- Awawdeh, M.; Elmughrabi, M.A.; Atallah, M.Y. Landslide susceptibility mapping using GIS and weighted overlay method: A case study from North Jordan. Environ. Earth Sci. 2018, 77, 732. [Google Scholar] [CrossRef]
- Pham, B.T.; Bui, D.T.; Dholakia, M.; Prakash, I.; Pham, H.V.; Mehmood, K.; Le, H.Q. A novel ensemble classifier of rotation forest and Naïve Bayer for landslide susceptibility assessment at the Luc Yen district, Yen Bai Province (Viet Nam) using GIS. Geomat. Nat. Hazards Risk 2016, 8, 649–671. [Google Scholar] [CrossRef]
- Gokceoglu, M.E.C. Assessment of landslide susceptibility for a landslide-prone area (north of Yenice, NW Turkey) by fuzzy approach. Environ. Geol. 2002, 41, 720–730. [Google Scholar] [CrossRef]
- Glade, T. Landslide occurrence as a response to land use change: A review of evidence from New Zealand. Catena 2003, 51, 297–314. [Google Scholar] [CrossRef]
- Hong, H.; Pradhan, B.; Bui, D.T.; Xu, C.; Youssef, A.M.; Pourghasemi, H.R. Comparison of four kernel functions used in support vector machines for landslide susceptibility mapping: A case study at Suichuan area (China). Geomat. Nat. Hazards Risk 2017, 8, 544–569. [Google Scholar] [CrossRef]
- Perera, E.N.C.; Jayawardana, D.T.; Jayasinghe, P.; Bandara, R.M.S.; Alahakoon, N. Direct impacts of landslides on socio-economic systems: A case study from Aranayake, Sri Lanka. Geoenviron. Disasters 2018, 5, 11. [Google Scholar] [CrossRef]
- Saha, A.K.; Gupta, R.P.; Arora, M.K. GIS-based Landslide Hazard Zonation in the Bhagirathi (Ganga) Valley, Himalayas. Int. J. Remote Sens. 2002, 23, 357–369. [Google Scholar] [CrossRef]
- Teodoro, A.C.; Pais-Barbosa, J.; Gonçalves, H.; Veloso-Gomes, F.; Taveira-Pinto, F. Identification of beach hydromorphological patterns/forms through image classification techniques applied to remotely sensed data. Int. J. Remote Sens. 2011, 32, 7399–7422. [Google Scholar] [CrossRef]
- Kayastha, P.; Dhital, M.; De Smedt, F. Application of the analytical hierarchy process (AHP) for landslide susceptibility mapping: A case study from the Tinau watershed, west Nepal. Comput. Geosci. 2013, 52, 398–408. [Google Scholar] [CrossRef]
- Roşian, G.; Csaba, H.; Kinga-Olga, R.; Boţan, C.N.; Gavrilă, I.G. Assessing landslide vulnerability using bivariate statistical analysis and the frequency ratio model. Case study: Transylvanian Plain (Romania). Z. Geomorphol. 2016, 60, 359–371. [Google Scholar] [CrossRef]
- Sifa, S.F.; Mahmud, T.; Tarin, M.A.; Haque, D.M.E. Event-based landslide susceptibility mapping using weights of evidence (WoE) and modified frequency ratio (MFR) model: A case study of Rangamati district in Bangladesh. Geol. Ecol. Landsc. 2019, 1–14. [Google Scholar] [CrossRef]
- Wilson, J.P.; Gallant, J.C. Terrain Analysis: Principles and Applications; John Wiley & Sons: Hoboken, NJ, USA, 2000. [Google Scholar]
- Zhu, A.X.; Wang, R.; Qiao, J.; Qin, C.Z.; Chen, Y.; Liu, J.; Du, F.; Lin, Y.; Zhu, T. An expert knowledge-based approach to landslide susceptibility mapping using GIS and fuzzy logic. Geomorphology 2014, 214, 128–138. [Google Scholar] [CrossRef]
- Bălteanu, D.; Chendeş, V.; Sima, M.; Enciu, P. A country-wide spatial assessment of landslide susceptibility in Romania. Geomorphology 2010, 124, 102–112. [Google Scholar] [CrossRef]
- Anis, Z.; Wissem, G.; Vali, V.; Smida, H.; Essghaier, G.M. GIS-based landslide susceptibility mapping using bivariate statistical methods in North-western Tunisia. Open Geosci. 2019, 11, 708–726. [Google Scholar] [CrossRef]
- Mousavi, S.Z.; Kavian, A.; Soleimani, K.; Mousavi, S.R.; Shirzadi, A. GIS-based spatial prediction of landslide susceptibility using logistic regression model. Geomatics Nat. Hazards Risk 2011, 2, 33–50. [Google Scholar] [CrossRef]
- Wang, F.; Xu, P.; Wang, C.M.; Wang, N.; Jiang, N. Application of a GIS-Based Slope Unit Method for Landslide Susceptibility Mapping along the Longzi River, Southeastern Tibetan Plateau, China. ISPRS Int. J. GeoInformation 2017, 6, 172. [Google Scholar] [CrossRef]
- Baiche, A.; Mohamed, H.S.; Ablaoui, H. Surexploitation des ressources en eau de l’aquifere du plateau de Mostaganem. LARHYSS J.l 2015, 22, 153–165. [Google Scholar]
- Saibi, H. Etude Hydrogéologique du Plateau de Mostaganem (Nord-ouest Algérien): Géologie, Géophysique, Climatologie, Hydrodynamisme, Hydrochimie et Vulnérabilité des Eaux Souterraines à la Pollution par la Méthode DRASTIC; Éditions Universitaires Européennes: Saarbrücken, Germany, 2010. [Google Scholar]
- Chen, C.Y.; Huang, W.L. Land use change and landslide characteristics analysis for community-based disaster mitigation. Environ. Monit. Assess. 2012, 185, 4125–4139. [Google Scholar] [CrossRef]
- Arca, D.; Kutoglu, S.H.; Becek, K. Landslide susceptibility mapping in an area of underground mining using the multicriteria decision analysis method. Environ. Monit. Assess. 2018, 190, 1–14. [Google Scholar] [CrossRef]
- Ghosh, S.; Das, R.; Goswami, B. Developing GIS-based techniques for application of knowledge and data-driven methods of landslide susceptibility mapping. Indian J. Geosci. 2013, 67, 249–272. [Google Scholar]
- Kaur, H.; Gupta, S.; Parkash, S.; Thapa, R. Knowledge-driven method: A tool for landslide susceptibility zonation (LSZ). Geol. Ecol. Landscapes 2018, 1–15. [Google Scholar] [CrossRef]
- Rabehi, W.; Guerfi, M.; Mahi, H. Cartographie de la Vulnérabilité des Communes de la Baie d’Alger. Approche Socio-économique et Physique de la côte. Mediterranee. 2018. Available online: https://journals.openedition.org/mediterranee/8625 (accessed on 11 January 2021).
- Michael, E.A.; Samanta, S. Landslide vulnerability mapping (LVM) using weighted linear combination (WLC) model through remote sensing and GIS techniques. Model. Earth Syst. Environ. 2016, 2, 1–15. [Google Scholar] [CrossRef]
- Shit, P.K.; Bhunia, G.S.; Maiti, R. Potential landslide susceptibility mapping using weighted overlay model (WOM). Model. Earth Syst. Environ. 2016, 2, 1–10. [Google Scholar] [CrossRef]
- Ahmed, M.F.; Rogers, J.D.; Ismail, E.H. A regional level preliminary landslide susceptibility study of the upper Indus river basin. Eur. J. Remote Sens. 2014, 47, 343–373. [Google Scholar] [CrossRef]
- Basharat, M.; Shah, H.R.; Hameed, N. Landslide susceptibility mapping using GIS and weighted overlay method: A case study from NW Himalayas, Pakistan. Arab. J. Geosci. 2016, 9, 1–19. [Google Scholar] [CrossRef]
- Zadeh, L.A. Information and control. Fuzzy Sets 1965, 8, 338–353. [Google Scholar]
- Zimmermann, H.J. Fuzzy set theory. Wiley Interdiscip. Rev. Comput. Stat. 2010, 2, 317–332. [Google Scholar] [CrossRef]
- Carranza, E.J.M.; Hale, M. Geologically Constrained Fuzzy Mapping of Gold Mineralization Potential, Baguio District, Philippines. Nat. Resour. Res. 2001, 10, 125–136. [Google Scholar] [CrossRef]
- Ilanloo, M. A comparative study of fuzzy logic approach for landslide susceptibility mapping using GIS: An experience of Karaj dam basin in Iran. Procedia Soc. Behav. Sci. 2011, 19, 668–676. [Google Scholar] [CrossRef]
- Feizizadeh, B.; Roodposhti, M.S.; Jankowski, P.; Blaschke, T. A GIS-based extended fuzzy multi-criteria evaluation for landslide susceptibility mapping. Comput. Geosci. 2014, 73, 208–221. [Google Scholar] [CrossRef] [PubMed]
- Mijani, N.; Samani, N.N. Comparison of Fuzzy-based Models in Landslide Hazard Mapping. ISPRS Int. Arch. Photogramm. Remote Sens. Spat. Inf. Sci. 2017, 407–416. [Google Scholar] [CrossRef]
- Mokarram, M.; Zarei, A.R. Landslide Susceptibility Mapping Using Fuzzy-AHP. Geotech. Geol. Eng. 2018, 36, 3931–3943. [Google Scholar] [CrossRef]
- Miles, S.B.; Keefer, D.K. Comprehensive Areal Model of Earthquake-Induced Landslides: Technical Specification and User Guide; Open File Report; USGS: Reston, VA, USA, 2007. [Google Scholar]
- Akgun, A.; Kıncal, C.; Pradhan, B. Application of remote sensing data and GIS for landslide risk assessment as an environmental threat to Izmir city (west Turkey). Environ. Monit. Assess. 2012, 184, 5453–5470. [Google Scholar] [CrossRef]
- Karsli, F.; Atasoy, M.; Yalcin, A.; Reis, S.; Demir, O.; Gokceoglu, C. Effects of land-use changes on landslides in a landslide-prone area (Ardesen, Rize, NE Turkey). Environ. Monit. Assess. 2008, 156, 241–255. [Google Scholar] [CrossRef]
- Vakhshoori, V.; Zare, M. Is the ROC curve a reliable tool to compare the validity of landslide susceptibility maps? Geomat. Nat. Hazards Risk 2018, 9, 249–266. [Google Scholar] [CrossRef]
- Lin, L.; Lin, Q.; Wang, Y. Landslide susceptibility mapping on a global scale using the method of logistic regression. Nat. Hazards Earth Syst. Sci. 2017, 17, 1411–1424. [Google Scholar] [CrossRef]


| Authors | Study Area | Parameters | Techniques | |
|---|---|---|---|---|
| East of Algeria | Bourenane et al., 2014 [40] | City of Constantine | Slope gradient, slope aspect, lithology, precipitation, distance to stream, land use, distance to road, distance to faults | Geomorphological analysis & SI |
| Achour et al., 2017 [42] | Highway section/Constantine province | Lithology, distance to faults, slope gradient, slope aspect, distance from streams, land use, cohesion, internal friction | AHP & IV | |
| Manchar et al., 2018 [43] | Constantine city | Lithology, slope gradient, slope aspect, elevation, distance to lineaments, distance to stream, rainfall, NDVI | IV, WoE & FR | |
| Hadji et al., 2018 [16] | Oued Mellah Basin | Lithology, faults, slope, elevation, aspect, streams, roads and precipitation | AHP, LI & LR | |
| West of Algeria | Roukh and Abdelmansour (2018) [44] | Arzew Sector | Slope angle, slope exposure, lithology, distance to streams, land use, distance to road, altitude, | IV & FR |
| Current study | Mostaganem coast district | Lithology, slope, land use, slope aspect, plan curvature, rainfall, distance to streams, distance to roads and distance to fault | Knowledge driven approach and AHP combined to WOM |
| Intensity of Factors | Degree of Intensity | Explanation |
|---|---|---|
| 1 | Equal importance | The two parameters contribute to the same objective |
| 3 | Moderate Importance | The experience or judgment slightly favours one parameter over another |
| 5 | Strong importance | A parameter is favoured strongly over another |
| 7 | Very strong importance | A parameter is favoured very strongly over another, and it shows in practice |
| 9 | Extreme importance | The evidence of favouring one parameter over another is of the highest degree possible to affirm |
| 2, 4, 6, 8 | Intermediate value between two adjacent judgments | Used to represent the comprises between the preference scores 1, 3, 5, 7 and 9 |
| Reciprocals | Opposites | Used for inverse comparisons |
| n | 2 | 3 | 4 | 5 | 6 | 7 | 8 | 9 | 10 |
|---|---|---|---|---|---|---|---|---|---|
| RI | 0 | 0.58 | 0.9 | 1.12 | 1.24 | 1.32 | 1.41 | 1.45 | 1.51 |
| Knowledge Driven Approach | AHP Method | ||||
|---|---|---|---|---|---|
| Parameter | Classes | Rating | Weight | Rating | Weight |
| Lithology | |||||
| a1 | 5 | 5 | 0.260 | 0.280 | |
| a2 | 5 | 0.290 | |||
| F | 4 | 0.120 | |||
| mm | 3 | 0.090 | |||
| pm | 3 | 0.100 | |||
| mg | 2 | 0.030 | |||
| mgm | 2 | 0.030 | |||
| qc | 2 | 0.030 | |||
| pL | 1 | 0.024 | |||
| q1 | 2 | 0.026 | |||
| Slope (°) | |||||
| 0–5 | 1 | 4 | 0.073 | 0.164 | |
| 05–10 | 2 | 0.110 | |||
| 10–15 | 3 | 0.161 | |||
| 15–25 | 4 | 0.259 | |||
| >25 | 5 | 0.395 | |||
| Land cover | |||||
| Sparsely vegetated area | 5 | 3 | 0.368 | 0.154 | |
| Built-up area | 4 | 0.319 | |||
| Beach, Dune and sand plains | 3 | 0.097 | |||
| Fallow land | 3 | 0.098 | |||
| Agriculture land | 2 | 0.046 | |||
| Forest | 2 | 0.045 | |||
| River | 1 | 0.033 | |||
| Aspect | |||||
| Flat | 1 | 3 | 0.062 | 0.111 | |
| North | 2 | 0.114 | |||
| East | 3 | 0.171 | |||
| South | 4 | 0.146 | |||
| West | 5 | 0.504 | |||
| Curvature plane | |||||
| Concave | 5 | 2 | 0.619 | 0.086 | |
| Flat | 1 | 0.096 | |||
| Convex | 3 | 0.284 | |||
| Rainfall (mm) | |||||
| 350–400 | 2 | 2 | 0.250 | 0.057 | |
| 400–450 | 3 | 0.750 | |||
| Distance to stream (m) | |||||
| 50 | 5 | 2 | 0.552 | 0.077 | |
| 100 | 4 | 0.189 | |||
| 150 | 3 | 0.137 | |||
| 200 | 2 | 0.077 | |||
| >200 | 1 | 0.041 | |||
| Distance to road (m) | |||||
| 50 | 5 | 2 | 0.537 | 0.043 | |
| 100 | 4 | 0.202 | |||
| 150 | 3 | 0.129 | |||
| 200 | 2 | 0.081 | |||
| >200 | 1 | 0.052 | |||
| Distance to fault (m) | |||||
| 100 | 5 | 1 | 0.480 | 0.028 | |
| 200 | 4 | 0.229 | |||
| 300 | 3 | 0.161 | |||
| 400 | 2 | 0.089 | |||
| >400 | 1 | 0.041 | |||
| Consistency Ratio (CR) = 0.088 | |||||
| Susceptibility Classes | Knowledge Driven Approach | AHP Method | ||
|---|---|---|---|---|
| Area (km2) | L.D (%) | Area (km2) | L. D (%) | |
| Very low | 3.823 | 0 | 4.05 | 0 |
| Low | 11.484 | 5.882 | 10.63 | 11.765 |
| Moderate | 16.329 | 11.765 | 15.84 | 11.765 |
| High | 13.294 | 35.294 | 16.197 | 23.529 |
| Very high | 6.834 | 47.059 | 5.047 | 52.941 |
| Landslide Susceptibility Classes | Numerical Scale |
|---|---|
| Very low | 1 |
| Low | 2 |
| Moderate | 3 |
| High | 4 |
| Very high | 5 |
| Landslide Events | Knowledge Driven Approach | AHP_WOM Method | Diff M1/M2 |
|---|---|---|---|
| 1 | |||
| 2 | |||
| 3 | |||
| 4 | |||
| 5 | |||
| 6 | |||
| 7 | |||
| 8 | |||
| 9 | |||
| 10 | |||
| 11 | |||
| 12 | |||
| 13 | |||
| 14 | |||
| 15 | |||
| 16 | |||
| 17 | |||
 | |||
Publisher’s Note: MDPI stays neutral with regard to jurisdictional claims in published maps and institutional affiliations. |
© 2021 by the authors. Licensee MDPI, Basel, Switzerland. This article is an open access article distributed under the terms and conditions of the Creative Commons Attribution (CC BY) license (http://creativecommons.org/licenses/by/4.0/).
Share and Cite
Senouci, R.; Taibi, N.-E.; Teodoro, A.C.; Duarte, L.; Mansour, H.; Yahia Meddah, R. GIS-Based Expert Knowledge for Landslide Susceptibility Mapping (LSM): Case of Mostaganem Coast District, West of Algeria. Sustainability 2021, 13, 630. https://doi.org/10.3390/su13020630
Senouci R, Taibi N-E, Teodoro AC, Duarte L, Mansour H, Yahia Meddah R. GIS-Based Expert Knowledge for Landslide Susceptibility Mapping (LSM): Case of Mostaganem Coast District, West of Algeria. Sustainability. 2021; 13(2):630. https://doi.org/10.3390/su13020630
Chicago/Turabian StyleSenouci, Rachida, Nasr-Eddine Taibi, Ana Cláudia Teodoro, Lia Duarte, Hamidi Mansour, and Rabia Yahia Meddah. 2021. "GIS-Based Expert Knowledge for Landslide Susceptibility Mapping (LSM): Case of Mostaganem Coast District, West of Algeria" Sustainability 13, no. 2: 630. https://doi.org/10.3390/su13020630
APA StyleSenouci, R., Taibi, N.-E., Teodoro, A. C., Duarte, L., Mansour, H., & Yahia Meddah, R. (2021). GIS-Based Expert Knowledge for Landslide Susceptibility Mapping (LSM): Case of Mostaganem Coast District, West of Algeria. Sustainability, 13(2), 630. https://doi.org/10.3390/su13020630