Abstract
In this study, we aim to carry out a coupling analysis of the thermal landscape and environmental carrying capacity of urban expansion in Beijing over the past 35 years to provide scientific grounding for city planning. The paper proposes a conceptual framework and develops an integrated quantitative approach to the coupling analysis between urban expansion, the urban ecological environment, and the urban landscape, including the Urban Eco-Environment Carrying Capacity Index (ECI), Landscape Spatial Structure Index, Landscape Thermal Index (LTI), and Transitional Landscape Index (TLI, Markov Chain Model). Urban expansion has been essentially dominated by policy adjustments and has been further influenced by socioeconomic development, which has contributed to four outbreaks of urban sprawl in Beijing. Urban expansion is an essential factor affecting ecological environment change. The Olympic Games in 2008 was the turning point for the urban landscape. The rate of urban expansion and improvement of the ecological landscape all changed significantly around the year 2008. The urban thermal distribution pattern coincided well with the featured landscape patches, representing an obvious reflection of the difference between urban green spaces and construction, while high-temperature areas were abundant in the urban center. Urban expansion has a positive effect on the ecological environment and landscape pattern when it is fully matured and well planned. It is expected that, by 2025, the ecological environment of Beijing will be significantly improved, and the proportion of high-temperature areas will decrease.
1. Introduction
Urbanization plays an essential role in socio-economic development and is characterized by aggregation of the urban population, economic activities, and urban land [1,2,3,4]. For example, China’s urban city population increased rapidly from 19.39% in 1980 to 60.60% in 2017, and the area of urban land has also expanded greatly from 6720 km2 in 1980 to 56,075 km2 in 2018, with an average growth rate of 6.27% [5]. While urban cities have enriched people’s lives, many environmental problems have emerged, hindering the sustainable development of cities due to various issues; i.e., a degraded urban environment, the intensified urban heat island effect, and a fragmented landscape [6,7,8,9,10,11]. A great deal of research has been carried out to investigate urban expansion, urban landscapes, and urban environment quality [12,13]. This has shown that urban expansion has affected the status and functions of the biological processes of the urban eco-system; i.e., animal populations and behaviors at different spatiotemporal scales [14,15,16,17,18,19]. Pollutants of environmental quality, including air, water, and soil, have altered the natural processes of the biogeochemical cycle in the urban ecosystem [17,20]. Meanwhile, it has been shown that urban energy flow has contributed significantly to the metabolism of dynamic changes in urban ecosystem functioning, ecological and economic benefits, and regulation methods [21,22].
Urban landscape patches, including various buildings or built-up areas, sharply change the properties of the underlying surface, in addition to the thermodynamic properties and hydrological conditions [23,24,25,26,27]. The urban landscape is an artificial ecosystem built by human beings in the process of transforming and adapting to the natural environment and is also a complex system of nature, the economy, and society [28,29]. Human activities strongly affect the natural conditions, hydrological conditions, meteorological characteristics, surface structure, flora, and fauna of the urban landscape [30,31,32,33]. The characteristics of the urban landscape reflect the level of socio-economic development, as well as historical and cultural characteristics [34,35]. In urban landscapes, the structure of the main ingredients is artificial and modified as a basic pattern of the landscape. The structural components, mosaic, and distribution pattern of urban landscapes are typically embedded together to form a specific landscape pattern [36]. The ecological processes of the urban landscape are mainly coordinated and maintained by the human input or output of energy and materials of different properties. With the development of the social economy, as well as changes in political and cultural factors, the urban landscape changes very quickly, especially within the marginal belt of the urban landscape [37]. Due to the high dependence of the urban landscape system on human regulation, the natural ecological processes of the city are greatly simplified and separated, in addition to the continuity and integrity of urban functions being very fragile. It is easy for declines in urban functions to occur; in particular, declines in urban ecology and the overall sustainability and amenity of the city [38,39,40]. The diversity, simplicity, and complexity of urban landscapes are highly correlated. The natural characteristics in the urban ecological process improve urban ecological connectivity [41].
Spatial pattern analysis is used to study the relationship between the composition characteristics of landscape structure and spatial configuration [42,43]. Quantitative analyses of landscape patterns have emphasized the need to extract and analyze the necessary variables, describing and measuring landscape patterns in a specific way. In addition, the characteristics and regularity of landscape patterns must be clarified to further understand the general significance of the laws under these conditions, and to provide necessary information for the optimization of landscape patterns and landscape management [44,45]. Landscape pattern studies have mainly involved assessing the scale of the landscape pattern on ecological processes [46], as well as the relationship between scale and the landscape pattern index when determining how to select the suitable index to describe the current landscape pattern and ecological processes and how to choose appropriate parameters to predict landscape patterns [47,48,49]. Other studies have emphasized landscape model simulations, such as geographical models, population, and dynamic ecosystem models, which are quantitative methods of landscape pattern and ecological process analysis [15]. Further, spatial statistics combined with remote sensing and geographic information systems have been developed to analyze the changing processes of landscape patterns, in addition to spatial and temporal changes in landscapes [50,51].
The purpose of this study is to establish a relationship between urban expansion and ecological processes to uncover the internal mechanism of landscape structures. Therefore, we focused our investigation on ensuring the sustainable development of cities in order to meet the needs of urban development, while maintaining and improving the heterogeneity of urban landscapes. This paper studied the spatial–temporal pattern of urban expansion in Beijing from 1984 to 2018 by analyzing how urban expansion affected the eco-environment and urban landscape. Changes in the eco-environment carrying capacity were obtained through the Analytic Hierarchy Process (AHP). Spatiotemporal changes were analyzed by using the Markov Chain Model, urban expansion index, thermal landscape index, and resource–environment–ecology carrying capacity index, which was combined with Geographic Information System (GIS) and remote sensing (RS) approaches based on a multi-source dataset, including climate observation data, remote sensing data, and socio-economic data.
2. Materials and Methods
2.1. Data Source and Preprocessing
Multi-source datasets were collected and trimmed to carry out this investigation (Figure 1). These datasets included statistical socio-economic data, climate and ecological observation data, and remote sensing data. Social-economic data, such as demography, industry, and civil infrastructure, were used to calculate the urban expansion index. These datasets, including natural resources, environmental quality, and ecosystems, were used to calculate the resource–environment–ecology carrying capacity index. These datasets were from the Beijing Statistical Yearbook and China City Statistical Yearbook (1984–2018). Satellite datasets, including the Normalized Difference Vegetation Index (NDVI) and LUCC (Landsat, resolution of 30 m) and surface temperature (MODIS Aqua, resolution of 1 km, 8 Days), were used to detect land use cover changes, urban built-up areas, the quantity of infrastructure construction, and the temperature in the urban area.
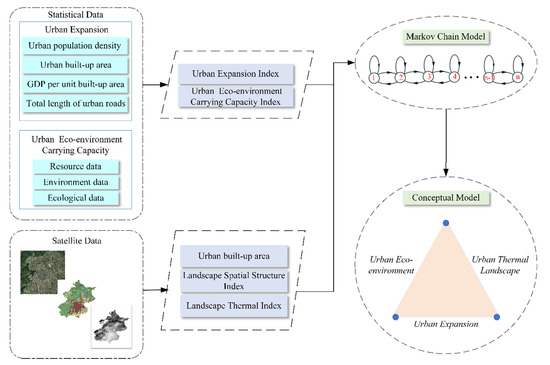
Figure 1.
Schematic flowchart of research methodology.
2.2. Quantitative Evaluation Indices
Urban expansion is a process of social development and change characterized by the concentration of population from rural areas to cities, the upgrading of regions from rural areas to cities [16]. Based on the data statistical analysis results and related previous studies, four factor stratums (population size, geographic space, economic capacity, and infrastructure construction) were selected to reflect the urban expansion (Table 1). LUCC data were used to identify the urban boundaries of built-up area.

Table 1.
Components of urban expansion indices.
With regard to the Landscape Spatial Structure Index, urban landscape patterns and patch sizes were dynamically changed along with the rapid urbanization [16]. These changes made the urban landscape present “highly fragmented” features, and many landscape units and patches were separated artificially. To reflect the landscape heterogeneity in Beijing, the diversity index and evenness index were chosen. Equation (1) shows that the diversity reflected the changes in the number of landscape elements and the proportion of each landscape element, and evenness described the distribution uniformity of different landscape types in the landscape:
where D represents the diversity index, N represents the total number of landscape types, Pi represents the percentage of each landscape type in the area (including arable land, wood land, grass land, water area, development land, and unused land), and E represents the evenness index.
The Landscape Thermal Index (LTI) was used to describe the spatial–temporal differentiation of the urban thermal landscape in this study. The landscape type proportion (PLAND) represented the area proportion of each grade of surface thermal landscape, and the Landscape Shape Index (LSI) measured the degree of shape complexity. Before calculating the indexes of the urban thermal landscape, geometric correction and resampling were processed for the original MODIS surface temperature product. Pixel gray values (DN) were converted into the actual surface temperature values (TR) according to Equation (2). After calculating the actual surface temperature value (TR), the surface temperature was divided into five thermal landscape grades (Table 2) by using the mean-standard deviation.
Table 2.
The classification criteria of land surface temperature.
With regard to the Urban Eco-Environment Carrying Capacity Index (ECI), the eco-environment carrying capacity is defined as the number of people, other living organisms, or crops that a region can support without environmental degradation [52]. This reflects the ability of the ecosystem to withstand external interference and self-regulation. Referring to the PSR model, this paper constructed the time-series curve of the cumulative effect, which was caused by resource–environment–ecological pressure. As shown in Equation (3),
where Q represents the resource–environmental–ecological pressure accumulation index of Beijing at time t1, which is the result obtained by calculating the weight of selected negative indicators. Q (t) represents the resource–environmental–ecological pressure index at time t.
Then, we constructed the eco-environment capacity index, as shown in Equation (4) and Table 3.
where Xij is the standardized value of the index j of the subsystem i, ωij is the weight of the index j of subsystem i, and ωi is the weight of subsystem i. The Analytic Hierarchy Process (AHP), proposed by Saaty in 1977 [53,54], is a subjective weighting method used to determine the weight of the index. Based on the matrix, the weight can be calculated by the relative importance given by individual judgements [55]. Utilizing the method of the Analytic Hierarchy Process (AHP), the hierarchical substructure model was established, and the judgment matrix was constructed.
Table 3.
The index system of eco-environment carrying capacity in Beijing.
The Transitional Landscape Index (TLI, Markov Chain Model) was developed to predict the future state of a system according to the probability of a transition between states [56,57]. It was used to investigate the trend prediction of Beijing’s urbanization–eco-environment–landscape index:
The matrix P(k) is called the probability transfer matrix, k and k + 1 represent different time states, x1 means Beijing urban expansion (growth) index, x2 is ECI, x3 describes cumulative effects of stress index and x4 stands for the Thermal Landscape Index.
3. Environmental Setting
In the past 35 years, from 1984–2018, the urban space expansion of Beijing has been characterized by a fast speed and wide range. The built-up area of the city has increased from 366 km2 in 1984 to 1469 km2 in 2018, corresponding to a fourfold expansion. Urban construction land has occupied ecological land and reflected the development trend of spatial agglomeration. The population size increased from 9.65 million in 1984 to 21.54 million in 2018, with an average annual growth rate of 2.39%, and urban population density has risen sharply from 574 people per square kilometer to 1313 people per square kilometer. Besides this, the city GDP of Beijing increased from 21.66 billion yuan in 1984 to 3032 billion yuan in 2018 [58]. Rapid economic growth significantly increased urban energy consumption and anthropogenic heat emissions, and the excessive consumption of water resources by economic development has led to a decrease in ecological land and the deterioration of the ecological environment. Population growth, urbanization, economic growth, and the rapid expansion of construction land have had a significant negative impact on the ecological environment of Beijing [59], causing problems such as the heat island effect, water pollution, air pollution, and the fluctuation of ecological carrying capacity.
4. Results
4.1. Urban Expansion during the Past Four Decades, 1984–2018
Rapid urban expansion has been observed over the past four decades in Beijing, and the outbreaks of urban expansion can be divided into four stages. These include the first low-speed development stage throughout of 1980s (Stage I), the first high-speed development stage in the late 1990s (Stage II), the second high-speed development stage from 2001 to 2008 (Stage III), and the second low-speed development from 2009 to the present (Stage IV). Figure 2 shows that urban expansion significantly increased and that there was a significant difference in the different temporal stages.
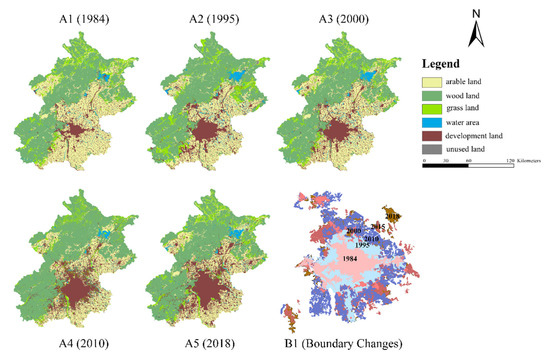
Figure 2.
Map of urban expansion and land use change of Beijing (1984–2018). (A1–A5): Land use change of Beijing during 1984–2018; (B1): The process of urban expansion from 1984 to 2018.
Stage I. Urban expansion in central urban areas at a low expansion speed (1984–1995): In this stage, due to the implementation of the reform and opening-up economic policy, Beijing entered into its first large-scale sub-low-speed expansion period. Developed from the pattern of the ancient capital, Beijing’s congenital condition of urban development was the pattern of a single center. The annual increase in the urban built-up area was 10.09 km2/a (km2 per year). Since China issued a very strict farmland protection policy to slow down the rate of real estate development, the urban space expansion did not reach a very high speed.
Stage II. Urban expansion in central urban areas at high speed (1996 to 2000): In this stage, the annual increase in urban built-up area was 58.4 km2/a. The rapid increase in population and the fast development of the urban economy in this period promoted the expansion of urban industrial land. Furthermore, because of the reform of the housing system in Beijing in 1998, the real estate industry developed considerably. The residential areas quickly occupied the land left by the relocation of factories, and the land scale of the whole city expanded rapidly.
Stage III. Urban expansion in both central and suburban at high speed (2001 to 2008): Influenced by the global economic integration, Beijing Urban Master Planning, and the construction of venues for the 2008 Olympic Games, Beijing entered into the fastest expansion stage in its history, with the annual growth rate of urban built-up area reaching 75.85 km2/a. The expansion pattern was mostly low-density growth. With the improvement of urban infrastructure, the construction of a large number of Olympic facilities greatly improved the central area of Beijing, such as the traffic access degree. The traffic routes around the real estate developed rapidly as well, making the “circle” of city space continue to spread and presenting a ring-like expansion pattern. Meanwhile, the gaps between the urban enclaves were quickly filled.
Stage IV. Urban expansion in suburban areas at low speed (2009 to 2018): In this stage, the annual increase area of urban built-up area was 13.22 km2/a. According to the “two axes, two belts and multiple centers” spatial layout of Beijing’s new master planning, the urbanization reached a mature stage: the urban expansion speed of Beijing gradually slowed down, and the pattern of the urban expansion presented the characteristics of multi-center development. As a milestone, Beijing’s urban expansion entered a new stage after the 2008 Beijing Olympic Games. The cultural economy, low-carbon economy, and headquarters economy, including the capitalist economy, were all greatly improved. Large-scale real estate construction projects started along the rail transit lines, and urban space expanded mainly in suburban areas.
The above analysis clearly shows that the outbreaks of urban expansion in Beijing can be divided into four stages, which were essentially dominated by policy adjustments, and further influenced by socioeconomic development. The Olympic Games in 2008 was a turning point, and the rate of urban expansion and improvement of ecological landscape all changed significantly around the year of 2008. From 1984 to 2018, the urban expansion rate in Beijing experienced a “slow-acceleration–fast-deceleration–low-steady” model, and the spatial pattern presented a conversion from a central area to suburb area. Policy adjustments and mega-events, such as the Olympic Games, farmland protection policy, and Beijing urban master planning, dominated these changes.
4.2. Urban Thermal Landscape Dynamics in the Process of Urban Expansion
The urban thermal landscape reveals the dynamics process of urban expansion, and the change of the thermal landscape is presented in Figure 3. The proportions of the thermal landscape area of each grade all showed different trends at the boundary of 2010, which coincided with the turning point of urban expansion and eco-environmental changes. The high-temperature area increased obviously from 2000 to 2010 and then decreased from 2010 to 2018. The spatial distribution of the urban thermal landscape was noticeable. Figure 3 indicates that the high-temperature area presented a distinct trend of continuous development at night, especially in the interlaced transition zone between plain and mountain areas in the southwestern district. The high-temperature area was mainly concentrated within the sixth ring road of Beijing. The secondary high-temperature area and the medium temperature area were inlaid in the periphery of the high-temperature area. The distribution of the high-temperature area was highly consistent with the urban built-up area and showed a similar change trend.
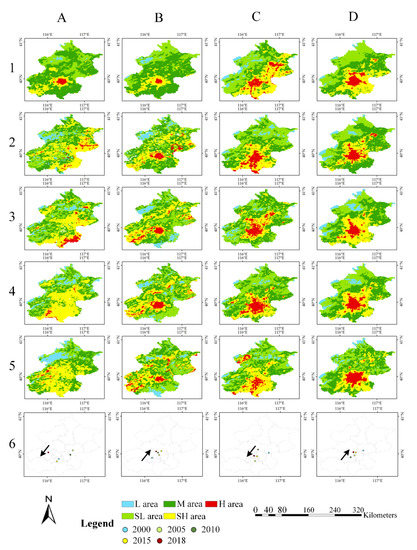
Figure 3.
Spatial distribution of urban thermal landscape in Beijing during 2000–2018. A–D: Winter (February, when the monthly average temperature is the lowest) daytime, winter night, summer (August, when the monthly average temperature is the highest) daytime, summer night; 1–5: urban thermal landscape map in 2000, 2005, 2010, 2015, and 2018; 6: barycenter trajectories of high-temperature land area in different seasons; L, SL, M, SH, and H represent low temperature, secondary low temperature, medium temperature, secondary high temperature, and high temperature, respectively.
The barycenter of the urban thermal landscape presented significant spatial differences (Figure 3). The barycenter in the high-temperature area was mainly concentrated in the “capital function-core areas” and “urban expansion areas” such as Dongcheng District, Xicheng District, Haidian District, and Chaoyang District. The centers in high-temperature areas showed a trend of migration to the urban center in winter. This trend indicated that high-temperature patches in the periphery of the city decreased, and the patches in the central city increased. During the heating period in Beijing, the concentration of pollutants in the atmosphere increased due to the human-made heat in the central urban area, so the city’s atmospheric adverse radiation increased rapidly. During the daytime, the concentration degree of the barycenter in the high-temperature area was higher than that during the night, and the distribution uniformity was reduced since the daytime high-temperature area was influenced by human activity factors to a more considerable extent. From 2000 to 2018, the high-temperature center area in daytime gradually moved to the southwest, and the migration trajectory was observed in line with the direction of urban expansion.
The urban thermal landscape morphological characteristics were different between day and night. The LSI of the day was much higher than that of the night, which indicated that the daytime patches of the thermal landscape were affected by human activities and had more complex shapes (Figure 4). The LSI of the high-temperature area was the smallest, showing the most regular landscape patch shape. The shape of the high-temperature area tended to correspond to regular clumps rather than dispersed areas, which was consistent with the characteristics of the spatial and temporal distribution (Figure 4).
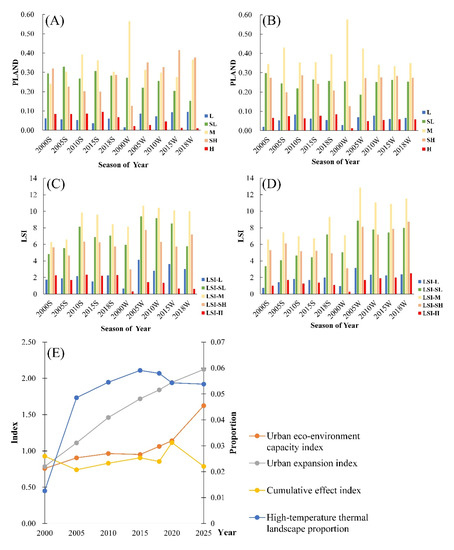
Figure 4.
Urbanization impacts on environment quality, thermal landscape, and eco- environment carrying capacity of Beijing during 2000–2018. (A): landscape type proportion (PLAND) of daytime thermal landscape; (B): PLAND of night thermal landscape; (C): Landscape Shape Index (LSI) of daytime thermal landscape; (D): LSI of night thermal landscape; (E): estimation of four indices by the Markov Chain Model.
The characteristics of the spatial distribution, barycenter trajectory and shape index of high-temperature areas indicate that the urban thermal landscape of the city underwent significant changes, which coincided with the trend of urban expansion and the urban eco-environment. These characteristics all showed an obvious change around the year of the turning point of urban expansion.
It can be summarized that the urban thermal distribution pattern coincided well with featured landscape patches, which is an obvious reflection of the difference between urban green areas and construction, while high temperature was extensively present in urban centers. The suburban ecological landscape and urban thermal landscape both reflected the characteristics of the urban landscape. The ecological landscape diversity and evenness was increased during the period 1984–1995. The ecological land increased significantly because of the Reinforcement of One Million Original Afforestation Projects and green space construction. The growth of both construction areas and the ecological land caused an increase in urban land use types, and various types of land were distributed evenly in the whole Beijing area. Nevertheless, from 1996 to 2018, the spatial structure of Beijing’s ecological landscape underwent a sharp decline in terms of both diversity and evenness. This phenomenon was mainly caused by the simplification of land use types, such as the rapid increase in urban construction land, which led to a relative decrease in other land types.
4.3. Coupling Analysis of Urbanization, Thermal Landscape and Environment Carrying Capacity
The environmental carrying capacity clearly illustrates that the relationship between urbanization, the thermal landscape, and environment quality, and the environmental carrying capacity of Beijing fluctuated dramatically during the urban expansion period. The spatial pattern of ECI in Beijing showed a prominent environmental gradient (Figure 5). From the urban central area to the suburbs, ECI presented a growing trend, and the regions with better ecological environment concentrated in the mountainous area in the northwest of Beijing had the highest ECI compared with other districts, while Xicheng and Dongcheng, located in the central area, presented the worst eco-environment. From 1984 to 2000, the urban environmental carrying capacity declined rapidly, which was closely related to the deterioration of urban air quality and the water environment. Since 2000, the environmental carrying capacity has presented a continuous growth as the Beijing government intensified efforts aimed at environmental governance and paid increased attention to improving air quality. From 2005 to 2008, due to hosting the 2008 Beijing Olympic Games, the government attached great importance to improving the urban environment. The environmental carrying capacity significantly increased. Moreover, since 2008, because the government has issued drastic protection measures and related policies to improve the urban environment, the environmental carrying capacity of Beijing has maintained a stable growth.
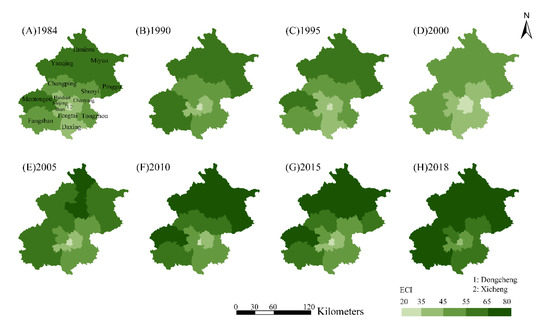
Figure 5.
The spatial distribution of the Urban Eco-Environment Carrying Capacity Index (ECI) for 16 districts in Beijing.
The fluctuation range of the ecological carrying capacity of Beijing was extensive, but the general trend was similar to that of the environmental carrying capacity. It is worth noting that, in the period of urban expansion stages II and III, the ecological carrying capacity showed a sharp decline. The effect of urban expansion on urban ecology was similar to the Kuznets curve. In the early stage, urban ecology may have been negatively affected. However, when expansion reached the turning point, mature urban expansion improved the urban ecology in turn. After the turning point, the ecological carrying capacity started increasing rapidly.
Equation (6) shows that the cumulative effect curve of Beijing’s resource–environment–ecological pressure experienced a turning point in 2008. Furthermore, the expression function of the cumulative effect can be described as follows:
where t represents the time variable, taking 1984 as the initial year, Q represents the pressure accumulation index, and R2 is the confidence interval. According to the characteristics of the fitting function, the cumulative effect of resource–environment–ecological pressure can be divided into two different stages (1984–2008, 2008–2018). As an important turning point, the government paid much more attention to the ecological environment, adopting a series of measures such as the intensive use of land, efficient use of resources, the controlled emission of waste gas and pollutants, the restricted development of heavy industry and strengthened environmental protection in 2008.
After setting resource-oriented, environment-oriented, and ecology-oriented scenarios, the general trends can be seen to be very similar in the three scenarios. From 1984 to 1988, the eco-environment of Beijing showed a slightly decreased tendency, and the average annual decline was 1.09%. With the continuous growth of the population and the rapid development of an extensive economy in the early stage of reform and opening-up, the eco-environment was damaged, and resource consumption was aggravated. From 1989 to 1999, the ECI of Beijing fluctuated dramatically with alternating growth and decline. However, the overall trend was basically flat. On the one hand, Beijing had entered the rapid expansion period, with a rapid decrease in ecological land in the central area, the increase in resource consumption, and the aggravation of environmental pollution. On the other hand, the government raised awareness of ecological and environmental protection and issued relevant environmental conservation strategies, which made the curve appear potentially antagonistic and to show jagged fluctuations. From 1999 to 2008, with the improvement of the ecological environment in Beijing, the capacity index showed a trend of rapid growth, with the average annual increase in ECI reaching 4.84%. The Beijing government took a series of measures to vigorously promote the protection and construction of the ecological environment for the 2008 Olympic Games, which effectively stopped the degradation of the ecological environment, slowed the deterioration trend and turned the curve to a rising direction. From 2009–2018, the ECI curve of Beijing was in a stable, rising stage, and the average annual increase in ECI was 1.10%. The government attached great importance to ecological–environmental protection, actively built a resource-conserving and environmentally friendly society, promoted ecological civilization and the harmony between humans and nature, strengthened energy conservation decisions, and implemented a series of policies and measures to promote energy conservation and emissions reduction. Energy conservation and emissions reduction work made positive progress and played an essential role in improving the ecological environment.
Moreover, the variation trend of the high-temperature area was closely related to the urban ECI. From 2000 to 2010, urban ECI decreased rapidly with increasing high-temperature areas. The average annual increase in high-temperature areas was 2.63%. From 2010 to 2018, urban ECI showed an upward trend, while the high-temperature area gradually decreased, and the average annual decline was 1.80%. The trend indicated that the important components of the ecological environment of the urban green rate, urban water area, and anthropogenic greenhouse gas emissions all had a visible impact on the thermal landscape.
Based on the Markov Chain Model, we utilized the urban expansion index (UCI), urban ECI, resource–environment–ecological pressure accumulation index and the PLAND of high-temperature thermal landscape area (PHLAND) in 2000 as the initial state matrix (i.e., X (0) = (0.78, 0.76, 0.93, 0.013). The average transition probability matrix of each index was calculated from each index (every five years from 2000 to 2015). The matrices were used to predict the four indexes during the period 2020–2025 (Figure 4). The state matrixes in 2020 are X (5) = (1.94, 1.14, 1.12, 0.054) and the state matrixes in 2025 are X (6) = (2.12, 1.62, 0.79, 0.053). The annual growth rate of the urban expansion index drops from 8% from 2000 to 2005 to 1.6% from 2020 to 2025. The results showed that in 2020 and 2025, the increase in the urban expansion in Beijing would be gentle since its pressure index and the ratio of high-temperature thermal landscape areas are gradually decreasing, and the index of the ecological environment carrying capacity is rising rapidly. It is noticed that the turning points of the curves did not appear at the same stage of urban expansion (Figure 6): the turning point of the UCI–ECI curve (X–Y plane) appeared in 1999 at stage II of urban expansion, while the turning point of the UCI–PHLAND curve (X–Z plane) appeared in 2015 at stage IV of urban expansion; much later than the UCI–ECI curve.
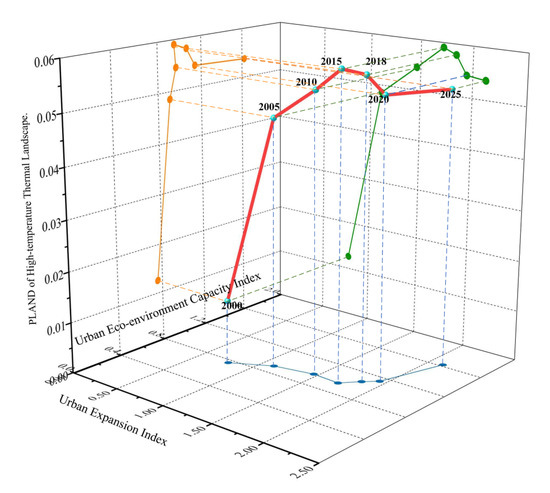
Figure 6.
The conceptual diagram of the relationship between the Urban Expansion Index, Urban Eco-Environment Capacity Index and PLAND of the high-temperature thermal landscape. The X-axis represents the Urban Expansion Index, the Y-axis represents the Urban Eco-Environment Capacity Index, and the Z-axis represents the PLAND of the high-temperature thermal landscape.
The curve indicates that at the beginning stage of urban expansion, ECI decreased and PHLAND increased, with both showing a negative trend in terms of ecology and the environment. However, at a certain urban expansion stage, ECI increased and PHLAND decreased gradually due to several policies, including thoughtful planning for urban development and measures to control water and air pollution and limit motor vehicle growth and wholesale deindustrialization. These policies successfully controlled urban disorderly expansion and protected the urban eco-environment with positive results. The urban expansion pattern of Beijing changed from a disordered and rapid development to consistent and slow-steady growth. In the mature stage of urbanization, the ecological land increased reasonably, and the resources were more efficiently used, the air and water pollutant levels were reduced, and urban expansion and economic development brought about a positive ecological environment effect. Meanwhile, the green space in the built-up area increased, and the greenhouse gas emissions decreased, which improved the urban thermal landscape pattern and reduced the proportion of high-temperature areas. It is expected that by 2025, the ecological environment of Beijing will be significantly improved, and the proportion of the high-temperature area will decrease.
It can be concluded that urban expansion has a positive effect on the ecological environment and thermal landscape pattern when it is fully matured and well planned. Although ecological carrying capacity fluctuated extensively, it coincided with the change patterns of environmental carrying capacity, and the effect of urban expansion on urban ecology was similar to the Kuznets curve.
5. Conclusions and Discussion
This study used a conceptual framework and integrated quantitative approaches, including UCI, ECI, LTI and the Markov Chain Model, to carry out a thorough analysis of the thermal landscape, eco-environment and urban expansion in Beijing during the past 35 years.
Urban expansion was essentially dominated by policy adjustments and further influenced by socioeconomic development, which contributed to four outbreaks of urban development in Beijing. Urban expansion is an essential factor affecting ecological–environmental change. The Olympic Games in 2008 was a turning point for the urban landscape. The rate of urban expansion and improvement of the ecological landscape changed significantly around this year. Due to the hosting of the Olympic Games, the government adopted strict measures to improve the ecological environment and control disorderly urban expansion, which weakened the urban heat island effect and reduced the eco-environmental pressure. The process of urban expansion in Beijing can be divided into four stages: urban expansion in the central urban area at sub-low speed (1984–1995), urban expansion in the central urban area at high speed (1996–2001), urban expansion in the suburban-central area at high speed (2002–2008), and urban expansion in suburban areas at sub-low speed (2009–2018). Urban land expansion in other megacities in China, such as Shanghai, Shenzhen, and Guangzhou, has presented similar trends: the speed of urban expansion gradually decreased, and the expansion area transformed from the central urban area into suburban areas. From 1978 to 2015, Shanghai has experienced a process of changing urban expansion from high-speed to low-speed, and the expansion area has changed from the central urban area to the satellite cities around the city center [60,61]. In the case of Shenzhen—another megacity, located in the south of China—during the two decades from 1980 to 2010, marginal expansion around the central area was the main method of urban expansion. After 2010, it showed multicentric expansion and the speed of expansion gradually decreased [60,62,63]. The urban expansion trend of Guangzhou is highly consistent with that of Beijing. From 1979 to 2000, expansion mainly involved the radiation expansion of the central urban area. After 2000, it manifested as the expansion of the suburban area, and after 2010, the urban expansion became compact at a low speed [60,62,64]. It is estimated that from 2020 to 2025, the urban expansion rate in Beijing will continuously decline, and the expansion area will be mainly concentrated in the suburbs instead of the central urban area, which is consistent with previous research [65,66,67]. The government has already promulgated strict policies to achieve orderly urban expansion, such as stipulating that the permanent urban development boundary shall not exceed 20% of the whole urban area, the centralized construction area shall account for about 14% of the urban area in 2020, and that there should be complementary development between mountainous and plain areas. Urban expansion, the urban eco-environment, and urban landscape are closely linked. As urban expansion has developed, the impact of urban expansion on the eco-environment changed from negative to positive. The urban thermal landscape and ecological landscape have been highly consistent with the urban built-up area and urban ECI. The coupling analysis from the Markov Chain Model showed that these measures and policies had significant achievements, and the city gradually entered the stage of high-quality development.
Urban thermal distribution patterns coincided well with featured landscape patches, which is an obvious reflection of the difference between urban green space and construction, while high temperatures were extensively present in the urban center. Under the influence of urban expansion and the ecological environment, the high-temperature area ratio increased in the period of rapid urban expansion and then decreased in the stage at which urban expanded in suburban areas at sub-low speed. The spatial pattern change trend of the high-temperature area was consistent with the trend of urban expansion. The migration of the barycenter of high-temperature areas was manifested mainly as the continuous convergence of the central urban area.
Urban expansion has a positive effect on the ecological environment and landscape pattern when it is fully matured and well planned. It is expected that by 2025, the ecological environment of Beijing will be significantly improved, and the proportion of the high-temperature area will decrease. Changes in the ecological environment and resource–environment–ecological pressure have been significantly affected by urban expansion. In the period of slow expansion, the pressure index was low, the growing range of the index was small, and the ecological environment was generally maintained at a high level. The disorderly development in the period of rapid expansion drove a sharp rise in the pressure index and dramatic fluctuations in the ecological–environmental capacity index, while the ECI curve showed a declining trend. With the slowing down of the expansion speed and the introduction of related policies, the pressure index was gradually reduced, and the ecological environment was significantly improved.
However, further investigations should put an emphasis on improving the temporal resolution of thermal landscape data in order to reduce the step size of the Markov Model, which would be conducive to increasing the accuracy of the model prediction. In this paper, the Beijing Olympic Games in 2008 were shown to have a significant impact on urban expansion and urban ecological environment; this effect needs to be further elucidated in our future work.
Author Contributions
Conceptualization, Y.L. and H.Y.; methodology, H.Y.; validation, X.S. and J.Z.; formal analysis, H.Y.; investigation, X.S.; resources, H.Y.; data curation, Y.L. and D.M.; writing—original draft preparation, H.Y. and Y.L.; writing—review and editing, H.Y.; supervision, Y.L.; project administration, Y.L.; funding acquisition, Y.L. All authors have read and agreed to the published version of the manuscript.
Funding
This research was funded by National Natural Science Foundation of China, grant number 41771182.
Institutional Review Board Statement
Not applicable.
Informed Consent Statement
Not applicable.
Data Availability Statement
Publicly available datasets were analyzed in this study. These data can be found here: https://data.stats.gov.cn/english/; http://www.gscloud.cn/home.
Acknowledgments
This paper was funded by the Natural Science Foundation Projects “The Research on The Process and Influence Mechanism of Carbon Dioxide Emissions in Different Areas of Beijing Based on Flux Footprint” (Grant No. 41771182) and the National Earth System Science Data Center “High spatial and temporal resolution data of long-term positioning monitoring of urban ecology and human activities in Beijing”. We thank Dr Hongming He at East China Normal University for providing the invaluable suggestions of the paper structure. Finally, we thank the reviewers for their helpful comments.
Conflicts of Interest
The authors declare that they have no conflict of interest.
References
- Andreasen, M.H.; Agergaard, J.; Kiunsi, R.B.; Namangaya, A.H. Urban transformations, migration, and residential mobility patterns in African secondary cities. Geogr. Tidsskr. J. Geogr. 2017, 117, 93–104. [Google Scholar] [CrossRef]
- Chen, M.; Lu, D.; Zhang, H. Comprehensive evaluation, and the driving factors of China’s urbanization. Acta Geogr. Sin. 2009, 64, 387–398. (In Chinese) [Google Scholar]
- Bloom, D.; Canning, D.; Fink, G. Urbanization and the Wealth of Nations. Science 2008, 319, 772–775. [Google Scholar] [CrossRef]
- Kojima, R. Introdution: Population Migration and Urbanization in Developing Countries. Dev. Econ. 1996, 34, 349–369. [Google Scholar] [CrossRef] [PubMed]
- NBSC National Data. National Bureau of Statistics of China. 2018. Available online: http://www.stats.gov.cn/tjsj/ndsj/2018/indexeh.htm (accessed on 14 October 2020).
- Li, G.; Li, F. Urban sprawl in China: Differences and socioeconomic drivers. Sci. Total Environ. 2019, 673, 367–377. [Google Scholar] [CrossRef]
- Liu, J.; Shen, Z.; Chen, L. Assessing how spatial variations of land use pattern affect water quality across a typical urbanized watershed in Beijing, China. Landsc. Urban Plan. 2018, 176, 51–63. [Google Scholar] [CrossRef]
- Lovell, S.T.; Johnston, D.M. Creating multifunctional landscapes: How can the field of ecology inform the design of the landscape? Front. Ecol. Environ. 2009, 7, 212–220. [Google Scholar] [CrossRef]
- Termorshuizen, J.W.; Opdam, P.; Brink, A.V.D. Incorporating ecological sustainability into landscape planning. Landsc. Urban Plan. 2007, 79, 374–384. [Google Scholar] [CrossRef]
- Makhzoumi, J.M. Landscape ecology as a foundation for landscape architecture: Application in Malta. Landsc. Urban Plan. 2000, 50, 167–177. [Google Scholar] [CrossRef]
- Owen, T.W.; Carlson, T.N.; Gillies, R.R. An assessment of satellite remotely sensed land cover parameters in quantitatively describing the climatic effect of urbanization. Int. J. Remote Sens. 1998, 19, 1663–1681. [Google Scholar] [CrossRef]
- Sun, R.; Chen, A.; Li, F.; Wang, D.; Xu, Z.; Chen, L. Guidelines, and evaluation indicators of urban ecological landscape construction. Acta Ecol. Sin. 2013, 33, 2322–2329. (In Chinese) [Google Scholar]
- Chiesura, A. The role of urban parks for the sustainable city. Landsc. Urban Plan. 2004, 68, 129–138. [Google Scholar] [CrossRef]
- Khosla, R.; Bhardwaj, A. Urbanization in the time of climate change: Examining the response of Indian cities. Wiley Interdiscip. Rev. Clim. Chang. 2019, 10, e560. [Google Scholar] [CrossRef]
- Kerbler, B. Population ageing and urban space. Annales-Anali Istrske Mediter. Stud. Ser. Histor. Sociol. 2015, 25, 33–48. [Google Scholar]
- Grimm, N.B.; Faeth, S.H.; Golubiewski, N.E.; Redman, C.L.; Wu, J.; Bai, X.; Briggs, J.M. Global Change and the Ecology of Cities. Science 2008, 319, 756–760. [Google Scholar] [CrossRef] [PubMed]
- Foley, J.A.; de Fries, R.; Asner, G.P.; Barford, C.; Bonan, G.; Carpenter, S.R.; Chapin, F.S.; Coe, M.T.; Daily, G.C.; Gibbs, H.K.; et al. Global Consequences of Land Use. Science 2005, 309, 570–574. [Google Scholar] [CrossRef] [PubMed]
- Arnfield, A.J. Two decades of urban climate research: A review of turbulence, exchanges of energy and water, and the urban heat island. Int. J. Clim. 2003, 23, 1–26. [Google Scholar] [CrossRef]
- Vlahov, D. Urbanization, Urbanicity, and Health. J. Hered. 2002, 79, S1–S12. [Google Scholar] [CrossRef]
- Ndetto, E.L.; Matzarakis, A. Urban atmospheric environment and human biometeorological studies in Dar es Salaam, Tanzania. Air Qual. Atmos. Heal. 2014, 8, 175–191. [Google Scholar] [CrossRef]
- Maranghi, S.; Parisi, M.L.; Facchini, A.; Rubino, A.; Kordas, O.; Basosi, R. Integrating urban metabolism and life cycle assessment to analyse urban sustainability. Ecol. Indic. 2020, 112, 106074. [Google Scholar] [CrossRef]
- Newcombe, K.; Ambio, A.J. The metabolism of a city: The case of Hong Kong. Ambio 1978, 7, 3–15. [Google Scholar]
- Chen, Y.; Yu, S. Impacts of urban landscape patterns on urban thermal variations in Guangzhou, China. Int. J. Appl. Earth Obs. Geoinform. 2017, 54, 65–71. [Google Scholar] [CrossRef]
- Xu, S.; Li, F.; Zhang, L.; Zhou, L. Spatiotemporal changes of thermal environment landscape pattern in Changsha. Acta Ecol. Sin. 2015, 35, 3743–3754. (In Chinese) [Google Scholar]
- Zhu, S.; Zhang, G.; Liu, Y. Change of underlying surface pattern and its local thermal environment effect in Suzhou city. Sci. Geogr. Sin. 2012, 32, 859–865. (In Chinese) [Google Scholar]
- Liu, J.; Yang, Z. Dynamicss of temperature and humidity in underlaying surface of different landscape type in winter in Beijing city, China. Acta Ecol. Sin. 2009, 29, 3241–3252. (In Chinese) [Google Scholar]
- Li, W.; Ouyang, Z.; Wang, R.; Wang, X. Landscape pattern and their formation of urban ecosystems. Chin. J. Ecol. 2005, 24, 428–432. (In Chinese) [Google Scholar]
- Wang, R.; Li, F.; Hu, D.; Li, B.L. Understanding eco-complexity: Social-Economic-Natural Complex Ecosystem approach. Ecol. Complex. 2011, 8, 15–29. [Google Scholar] [CrossRef]
- Alberti, M. The Effects of Urban Patterns on Ecosystem Function. Int. Reg. Sci. Rev. 2005, 28, 168–192. [Google Scholar] [CrossRef]
- Wang, Y.; Zhan, Q.; Ouyang, W. Impact of Urban Climate Landscape Patterns on Land Surface Temperature in Wuhan, China. Sustainability 2017, 9, 1700. [Google Scholar] [CrossRef]
- Chen, L.; Sun, R.; Liu, H. Eco-environmental effects of urban landscape pattern changes: Progresses, problems, and perspectives. Acta Ecol. Sin. 2013, 33, 1042–1050. (in Chinese). [Google Scholar] [CrossRef]
- Tv, R.; Aithal, B.H.; Sanna, D.D. Insights to urban dynamics through landscape spatial pattern analysis. Int. J. Appl. Earth Obs. Geoinform. 2012, 18, 329–343. [Google Scholar] [CrossRef]
- Gergel, S.E.; Turner, M.G.; Miller, J.R.; Melack, J.M.; Stanley, E.H. Landscape indicators of human impacts to riverine systems. Aquat. Sci. 2002, 64, 118–128. [Google Scholar] [CrossRef]
- Liu, P.; Wu, C.; Chen, M.; Ye, X.; Peng, Y.; Li, S. A Spatiotemporal Analysis of the Effects of Urbanization’s Socio-Economic Factors on Landscape Patterns Considering Operational Scales. Sustainability 2020, 12, 2543. [Google Scholar] [CrossRef]
- Yao, Y. Essential Geography Landscapes and Ecological Culture in Nanjing. Acta Geogr. Sin. 2009, 64, 677–686. (In Chinese) [Google Scholar]
- Peng, J.; Wang, Y.; Jing, J.; Song, Z.; Han, D. Research on integrated regional planning of urban landscape functions: A case study in Shenzhen City. Acta Ecol. Sin. 2005, 25, 1714–1719. (In Chinese) [Google Scholar]
- López, E.; Verdinelli, G.B.; Mendoza, M.; Duhau, E. Predicting land-cover and land-use change in the urban fringe. Landsc. Urban Plan. 2001, 55, 271–285. [Google Scholar] [CrossRef]
- Bai, Y.; Deng, X.; Jiang, S.; Zhang, Q.; Wang, Z. Exploring the relationship between urbanization and urban eco-efficiency: Evidence from prefecture-level cities in China. J. Clean. Prod. 2018, 195, 1487–1496. [Google Scholar] [CrossRef]
- Wu, J.; Xiang, W.-N.; Zhao, J. Urban ecology in China: Historical developments and future directions. Landsc. Urban Plan. 2014, 125, 222–233. [Google Scholar] [CrossRef]
- Wu, P.; Tan, M. Challenges for sustainable urbanization: A case study of water shortage and water environment changes in Shandong, China. Proc. Environ. Sci. 2012, 13, 919–927. [Google Scholar] [CrossRef]
- la Point, S.; Balkenhol, N.; Hale, J.; Sadler, J.P.; van der Ree, R. Ecological connectivity research in urban areas. Funct. Ecol. 2015, 29, 868–878. [Google Scholar] [CrossRef]
- Yeh, C.-T.; Huang, S.-L. Investigating spatiotemporal patterns of landscape diversity in response to urbanization. Landsc. Urban Plan. 2009, 93, 151–162. [Google Scholar] [CrossRef]
- Luck, M.; Wu, J. A gradient analysis of urban landscape pattern: A case study from the Phoenix metropolitan region, Arizona, USA. Landsc. Ecol. 2002, 17, 327–339. [Google Scholar] [CrossRef]
- Hu, D.; Meng, Q.; Zhang, L.; Zhang, Y. Spatial quantitative analysis of the potential driving factors of land surface temperature in different “Centers” of polycentric cities: A case study in Tianjin, China. Sci. Total Environ. 2020, 706, 135244. [Google Scholar] [CrossRef] [PubMed]
- Yang, J.; Li, S.; Lu, H. Quantitative Influence of Land-Use Changes and Urban Expansion Intensity on Landscape Pattern in Qingdao, China: Implications for Urban Sustainability. Sustainability 2019, 11, 6174. [Google Scholar] [CrossRef]
- Guo, L.; Xia, B.; Liu, W.; Jiang, X. [Spatio-temporal change and gradient differentiation of landscape pattern in Guangzhou City during its urbanization]. Ying Yong Sheng Tai Xue Bao J. Appl. Ecol. 2006, 17, 1671–1676. [Google Scholar]
- Wang, Z. Evolving landscape-urbanization relationships in contemporary China. Landsc. Urban Plan. 2018, 171, 30–41. [Google Scholar] [CrossRef]
- Weng, Y.-C. Spatiotemporal changes of landscape pattern in response to urbanization. Landsc. Urban Plan. 2007, 81, 341–353. [Google Scholar] [CrossRef]
- Jaeger, J.A. Landscape division, splitting index, and effective mesh size: New measures of landscape fragmentation. Landsc. Ecol. 2000, 15, 115–130. [Google Scholar] [CrossRef]
- Yue, W.; Xu, L. Thermal environment effect of urban land use type and patterna case study of central area of Shanghai city. Sci. Geogr. Sin. 2007, 27, 243–248. (In Chinese) [Google Scholar]
- Chen, Y.; Shi, P.; Li, X.; He, C. Research on urban spatial thermal envnrionmental using remote sensing image -fractal measurement of thermal field structure and its change. Acta Geod. Cartogr. Sin. 2002, 31, 322–326. (In Chinese) [Google Scholar]
- del Monte-Luna, P.; Brook, B.W.; Zetina-Rejón, M.J.; Cruz-Escalona, V.H. The carrying capacity of ecosystems. Glob. Ecol. BioGeogr. 2004, 13, 485–495. [Google Scholar] [CrossRef]
- Saaty, T.L. A scaling method for priorities in hierarchical structures. J. Math. Psychol. 1977, 15, 234–281. [Google Scholar] [CrossRef]
- Saaty, T.L.; Vargas, L.G. Hierarchical analysis of behavior in competition: Prediction in chess. Syst. Res. Behav. Sci. 1980, 25, 180–191. [Google Scholar] [CrossRef]
- Wang, J.; Jing, Y.-Y.; Zhang, C.-F.; Zhao, J.-H. Review on multi-criteria decision analysis aid in sustainable energy decision-making. Renew. Sustain. Energy Rev. 2009, 13, 2263–2278. [Google Scholar] [CrossRef]
- Arsanjani, J.J.; Helbich, M.; Kainz, W.; Boloorani, A.D. Integration of logistic regression, Markov chain and cellular automata models to simulate urban expansion. Int. J. Appl. Earth Obs. Geoinform. 2013, 21, 265–275. [Google Scholar] [CrossRef]
- Muller, M.R.; Middleton, J. A markov model of land-use change dynamics in the niagara region, ontario, canada. Landsc. Ecol. 1994, 9, 151–157. [Google Scholar]
- NBSC National Data. National Bureau of Statistics of China. 2019. Available online: http://www.stats.gov.cn/tjsj/ndsj/2019/indexeh.htm (accessed on 14 October 2020).
- Wenhui, K.; Jiyuan, L.I.U.; Quanqin, S.; Chaoyang, S.U.N. Spatio-temporal patterns and driving forces of urban expansion in Beijing central city since 1932. Geo-Inf. Sci. 2009, 11, 428–435. (In Chinese) [Google Scholar]
- Fei, W.; Zhao, S. Urban land expansion in China’s six megacities from 1978 to 2015. Sci. Total Environ. 2019, 664, 60–71. [Google Scholar] [CrossRef]
- Fang, C.; Zhao, S. A comparative study of spatiotemporal patterns of urban expansion in six major cities of the Yangtze River Delta from 1980 to 2015. Ecosyst. Heal. Sustain. 2018, 4, 95–114. [Google Scholar] [CrossRef]
- Meng, L.; Sun, Y.; Zhao, S. Comparing the spatial and temporal dynamics of urban expansion in Guangzhou and Shenzhen from 1975 to 2015: A case study of pioneer cities in China’s rapid urbanization. Land Use Policy 2020, 97, 104753. [Google Scholar] [CrossRef]
- Xun, B.; Yu, D.; Wang, X.; Liu, Y.; Hao, R.; Sun, Y. Spatio-temporal dynamics of urban growth and its driving forces in Shenzhen City. Ecol. Sci. 2014, 33, 545–552. (In Chinese) [Google Scholar]
- Chen, X.; Xia, C.; Jiang, D.; Fu, J. Urban Expansion Space—Time Metric and Difference Analysis: A Case Study of Typical Cities of East, Middle and West Parts. Geomat. Spat. Inf. Technol. 2017, 8, 62–67. (In Chinese) [Google Scholar]
- Long, Y.; Han, H.; Lai, S. Implementation Evaluation of Urban Growth Boundaries: An Analytical Framework for China and a Case Study of Beijing. Urban Plan. Forum 2015, 1, 93–100. (In Chinese) [Google Scholar]
- Han, H.; Yang, C.; Song, J. Simulation and projection of land-use change in Beijing under 6different scenarios. Progr. Geogr. 2015, 34, 976–986. (In Chinese) [Google Scholar]
- Hu, Y.; Fu, L.; Li, Q. The Prediction of Beijing Urban Growth Boundary. J. Geo-Inf. Sci. 2017, 19, 486–492. (In Chinese) [Google Scholar]


Publisher’s Note: MDPI stays neutral with regard to jurisdictional claims in published maps and institutional affiliations. |
© 2021 by the authors. Licensee MDPI, Basel, Switzerland. This article is an open access article distributed under the terms and conditions of the Creative Commons Attribution (CC BY) license (http://creativecommons.org/licenses/by/4.0/).