Predicting Post-Fire Tree Mortality in a Temperate Pine Forest, Korea

 , ,
, , 
Abstract
1. Introduction
2. Materials and Methods
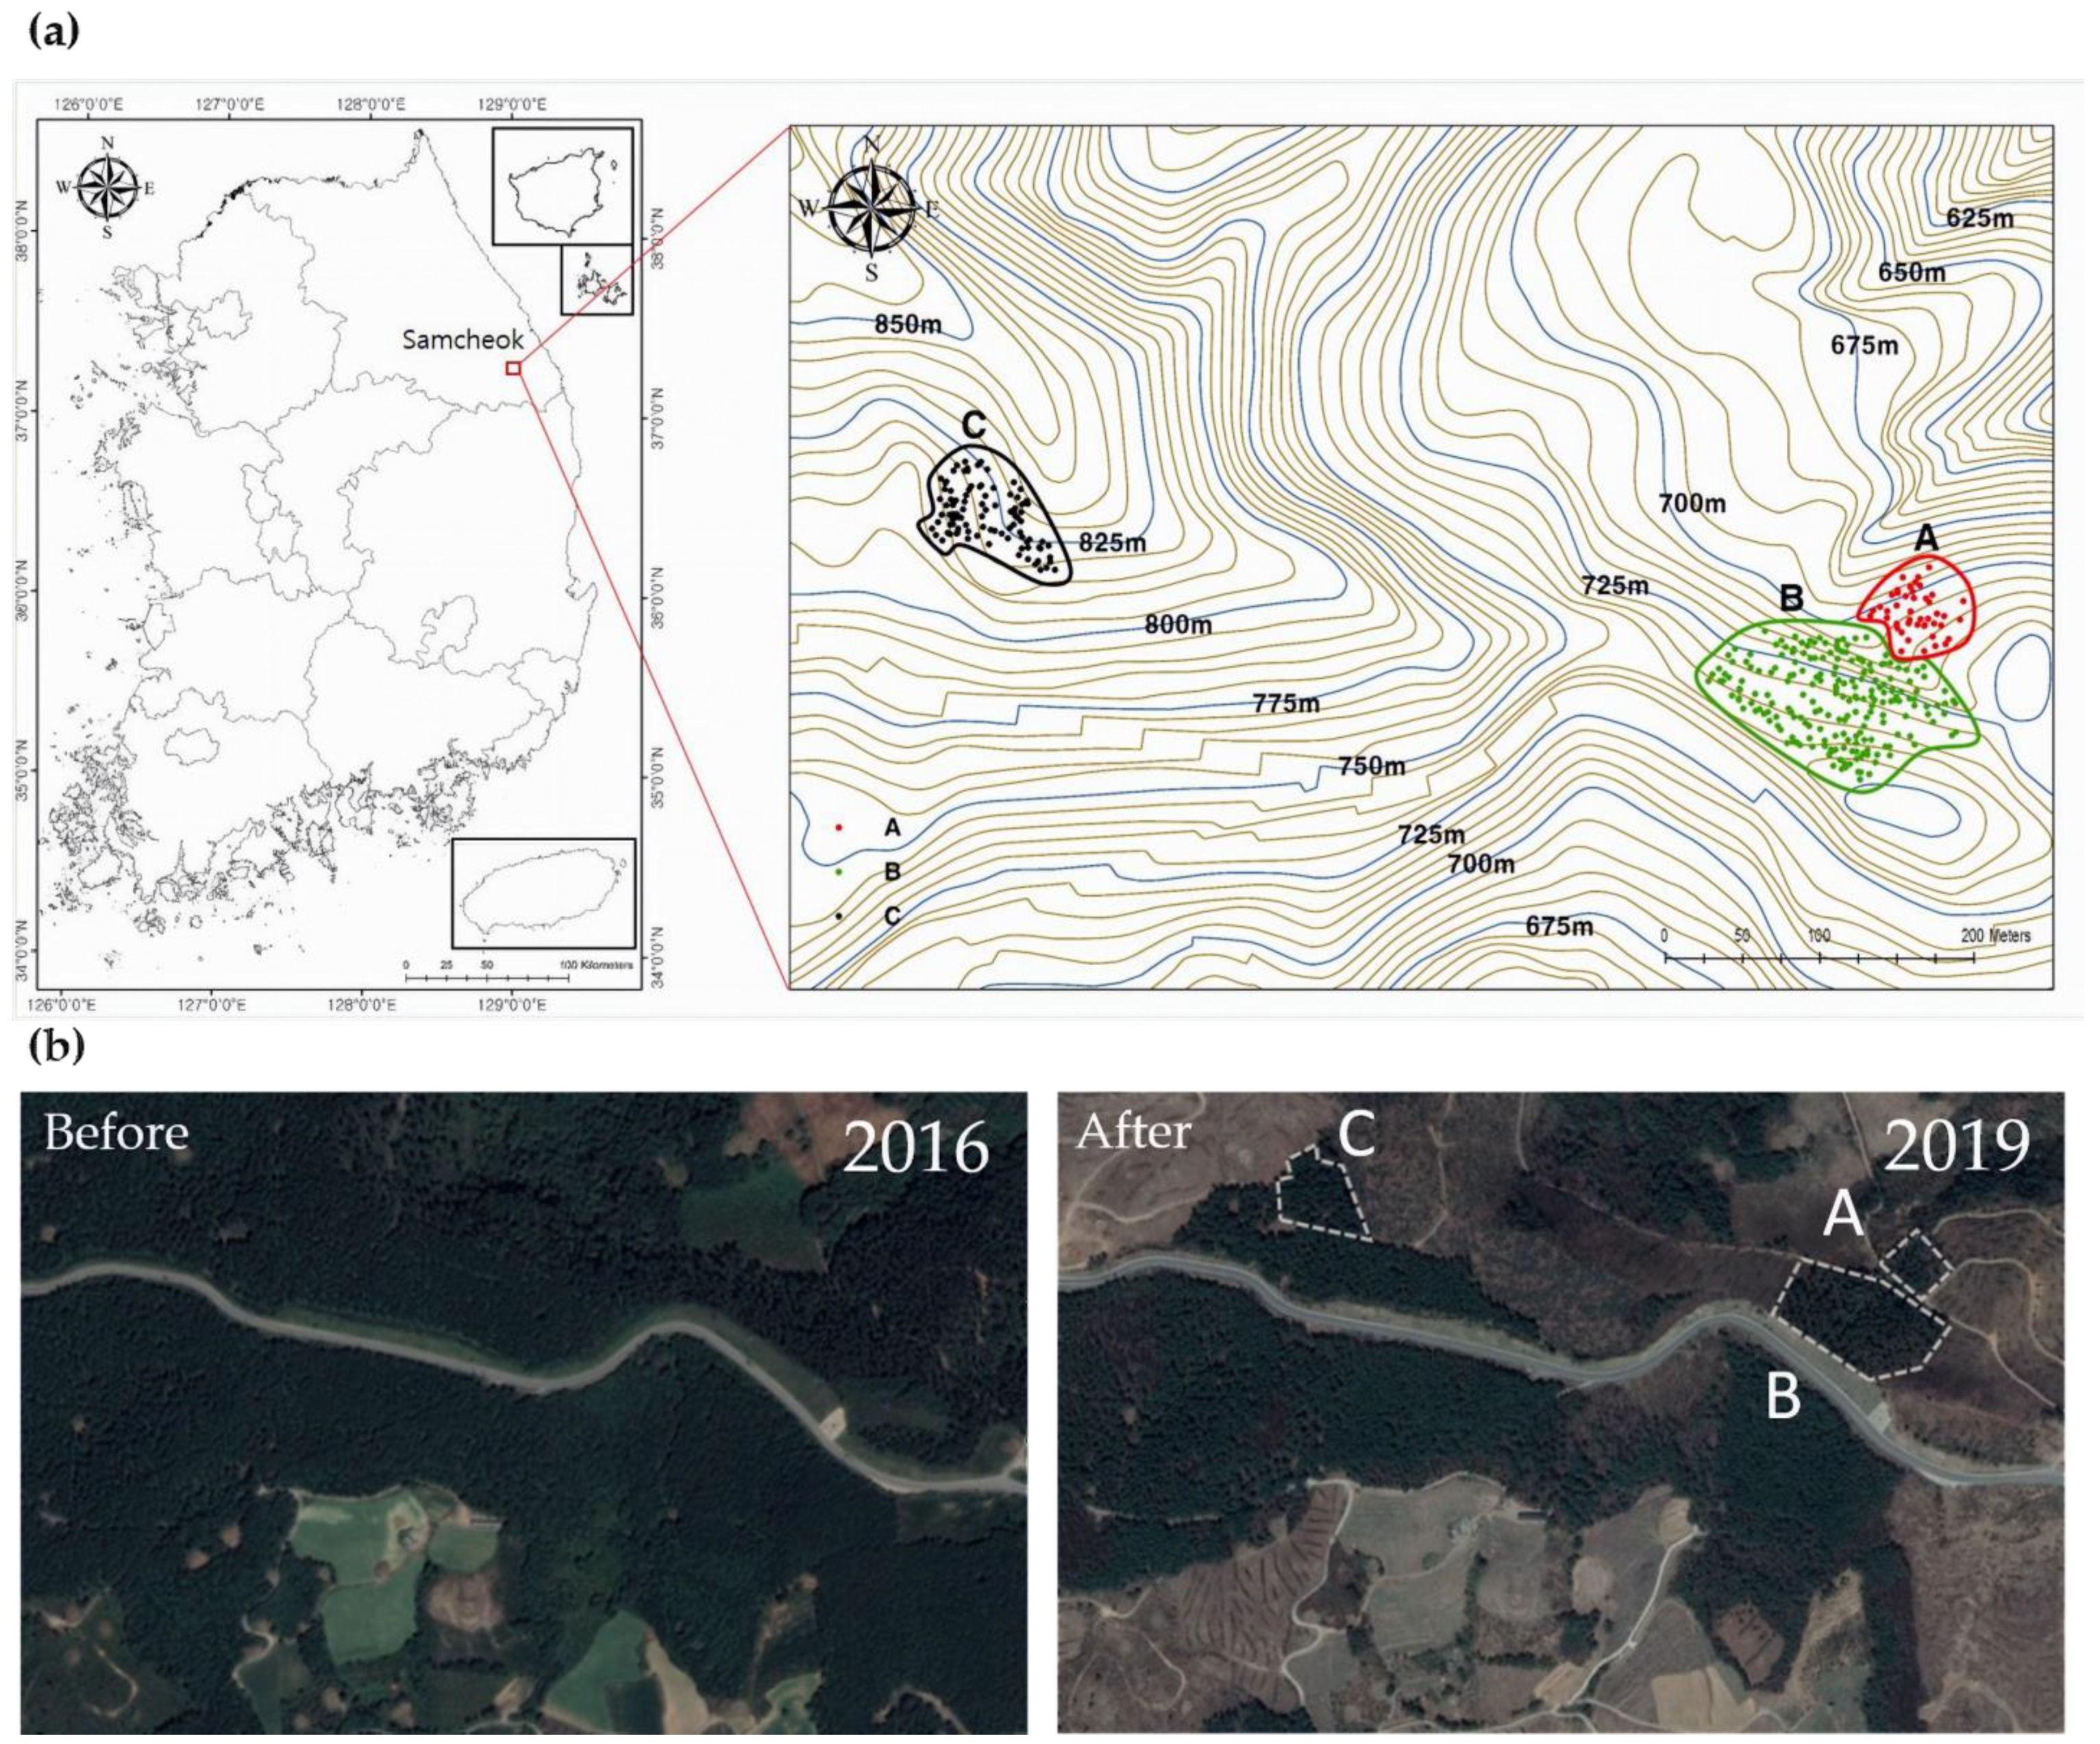
2.1. Study Area
2.2. Experimental Design and Sampling
2.3. Data Analysis
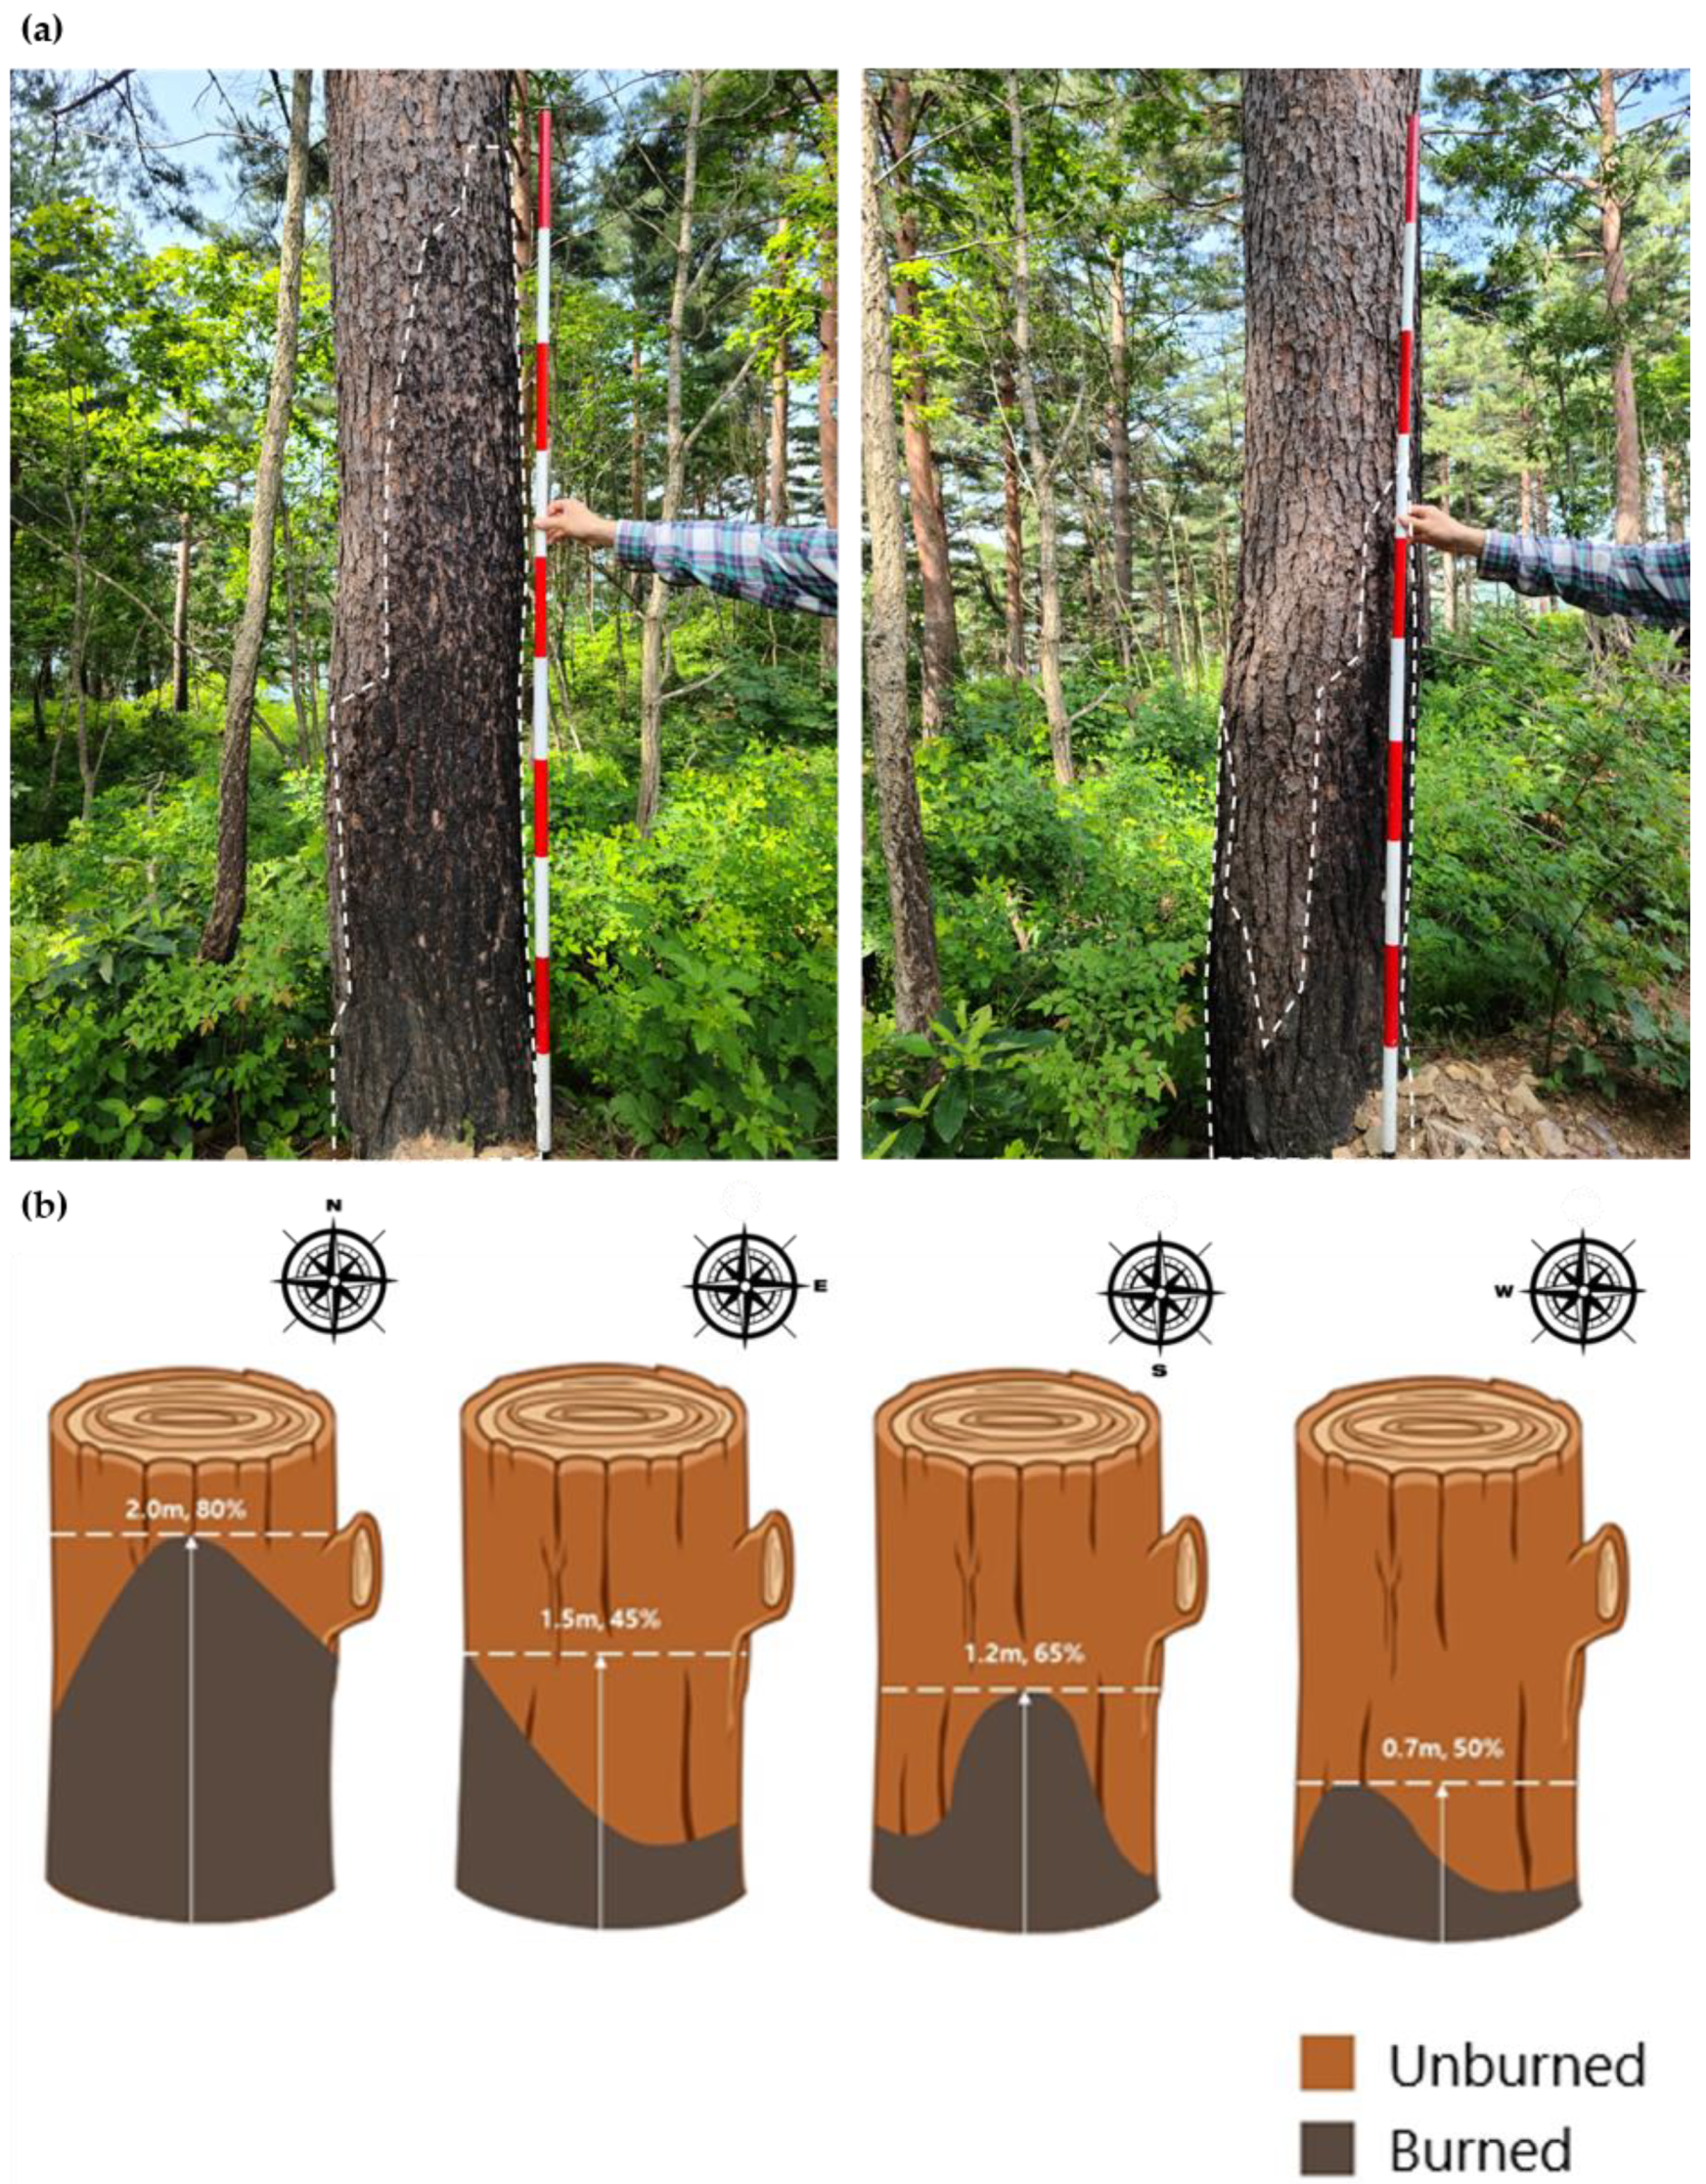
3. Results
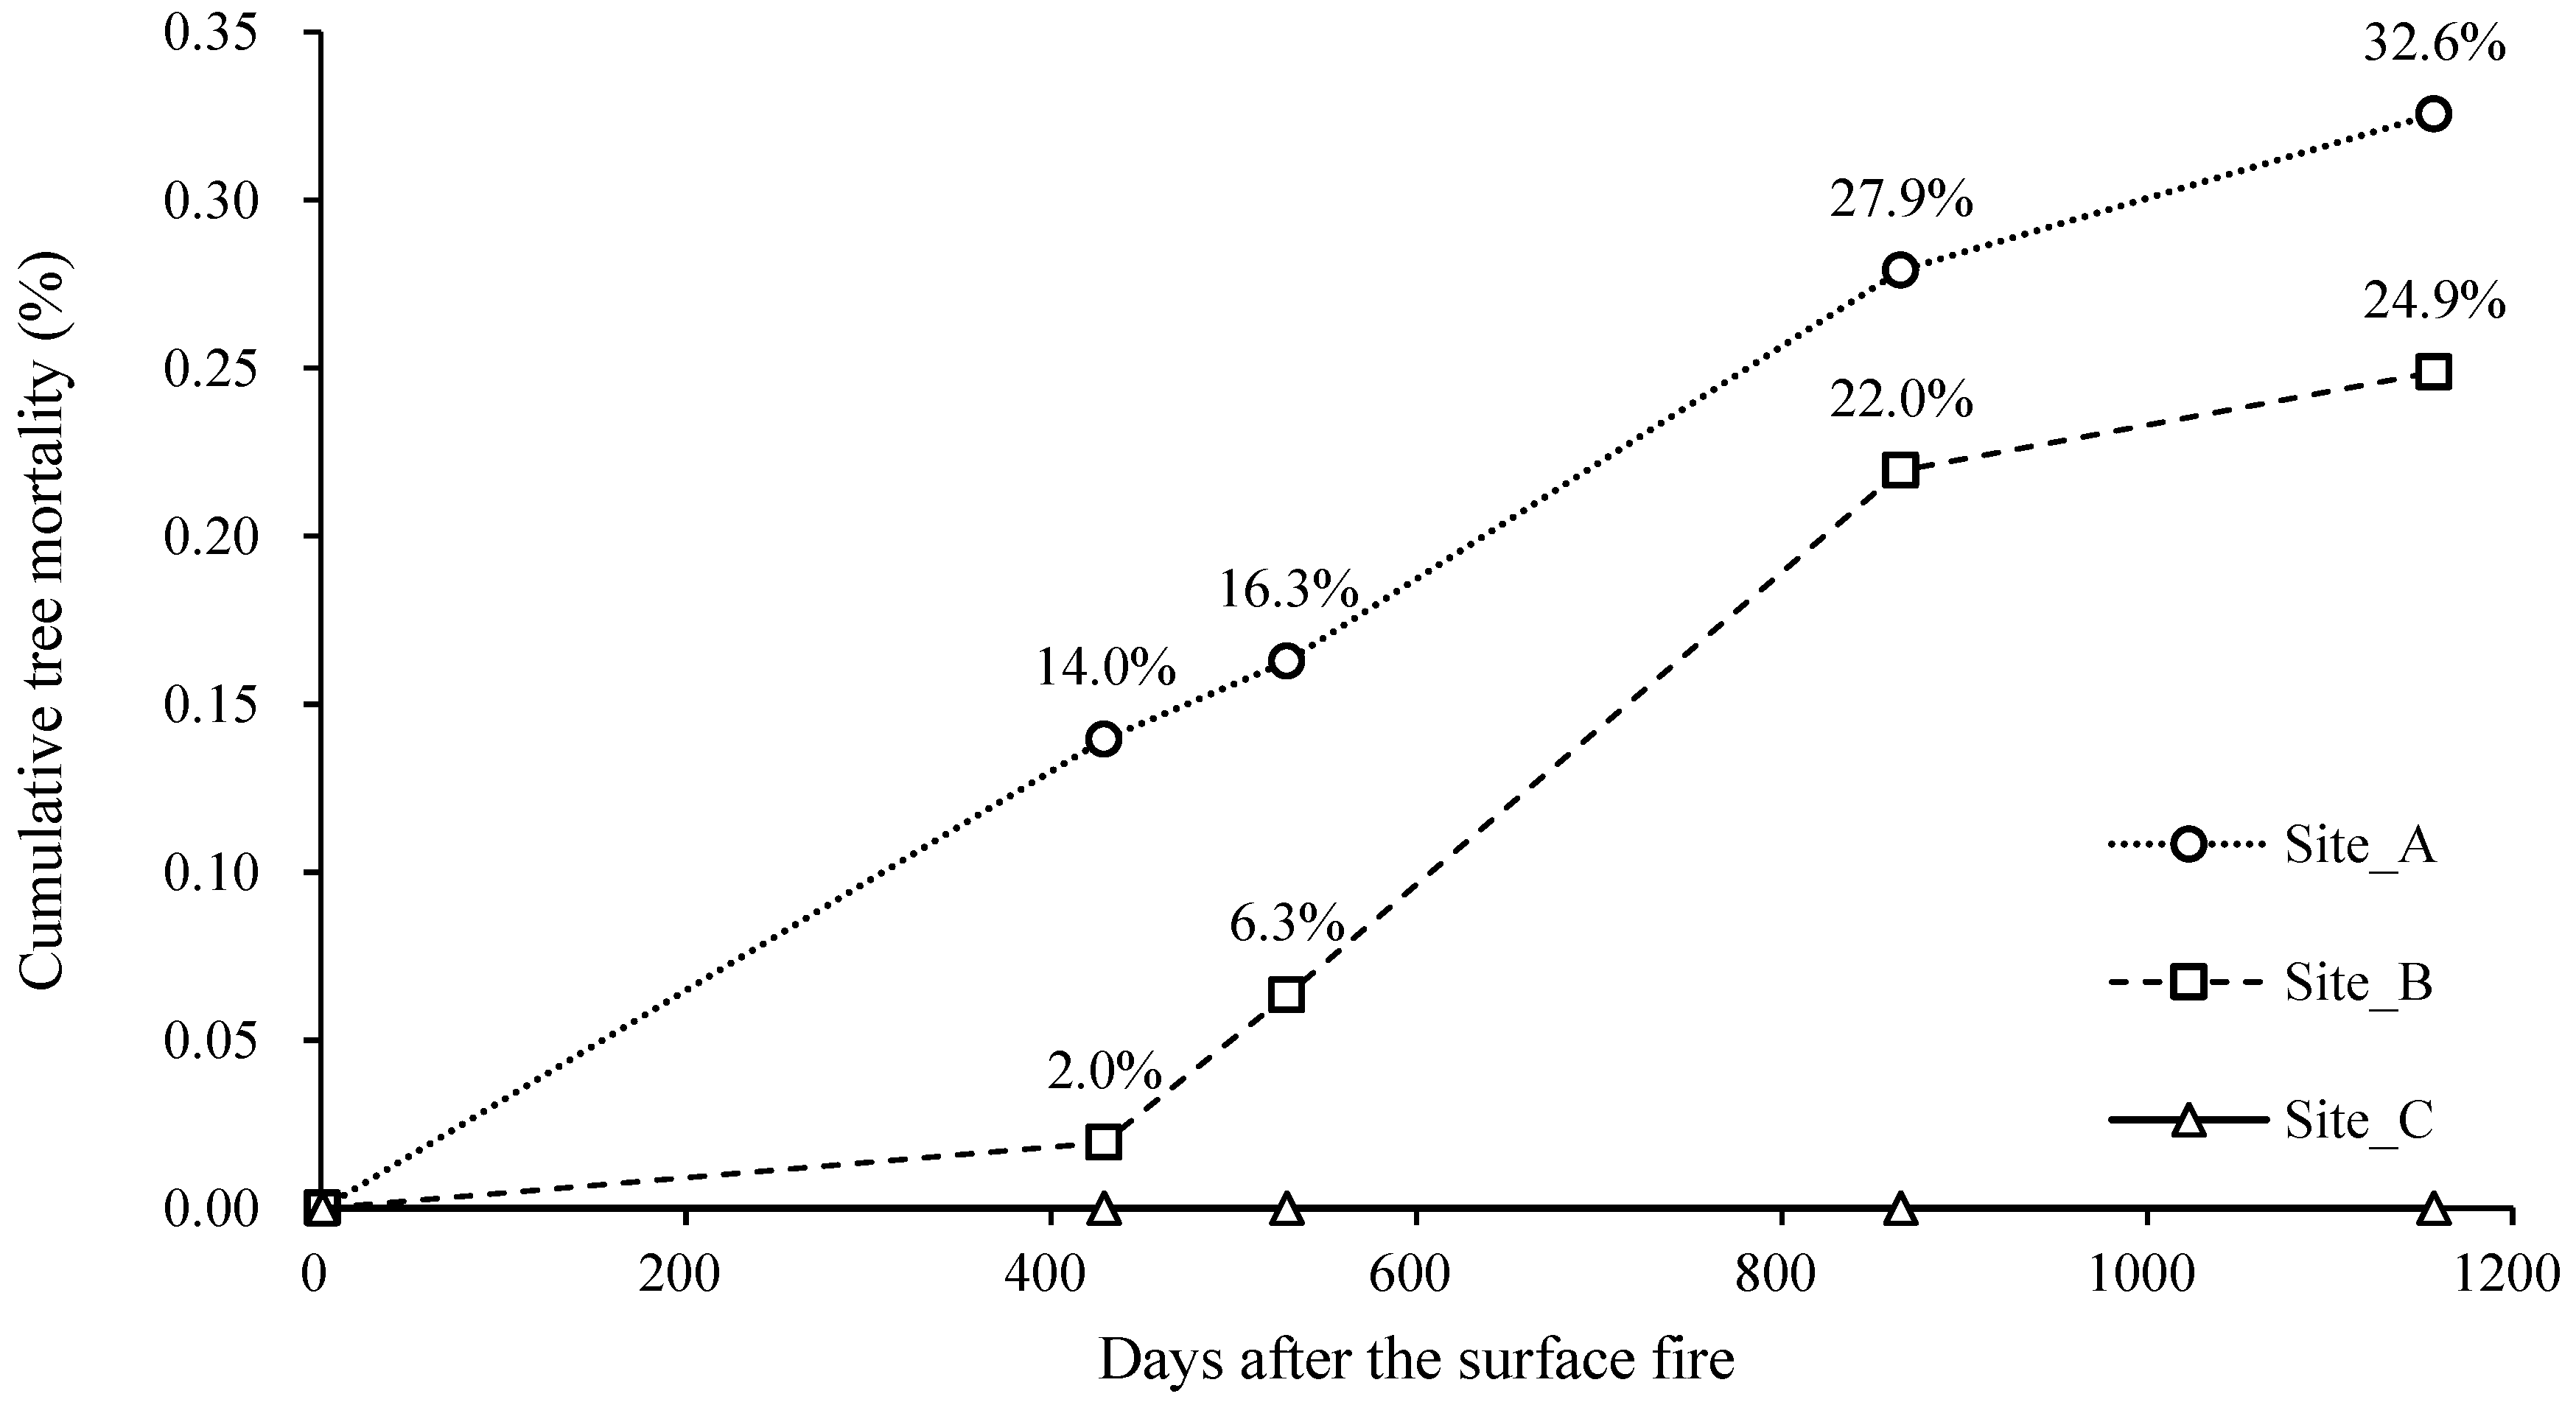
3.1. Tree Mortality
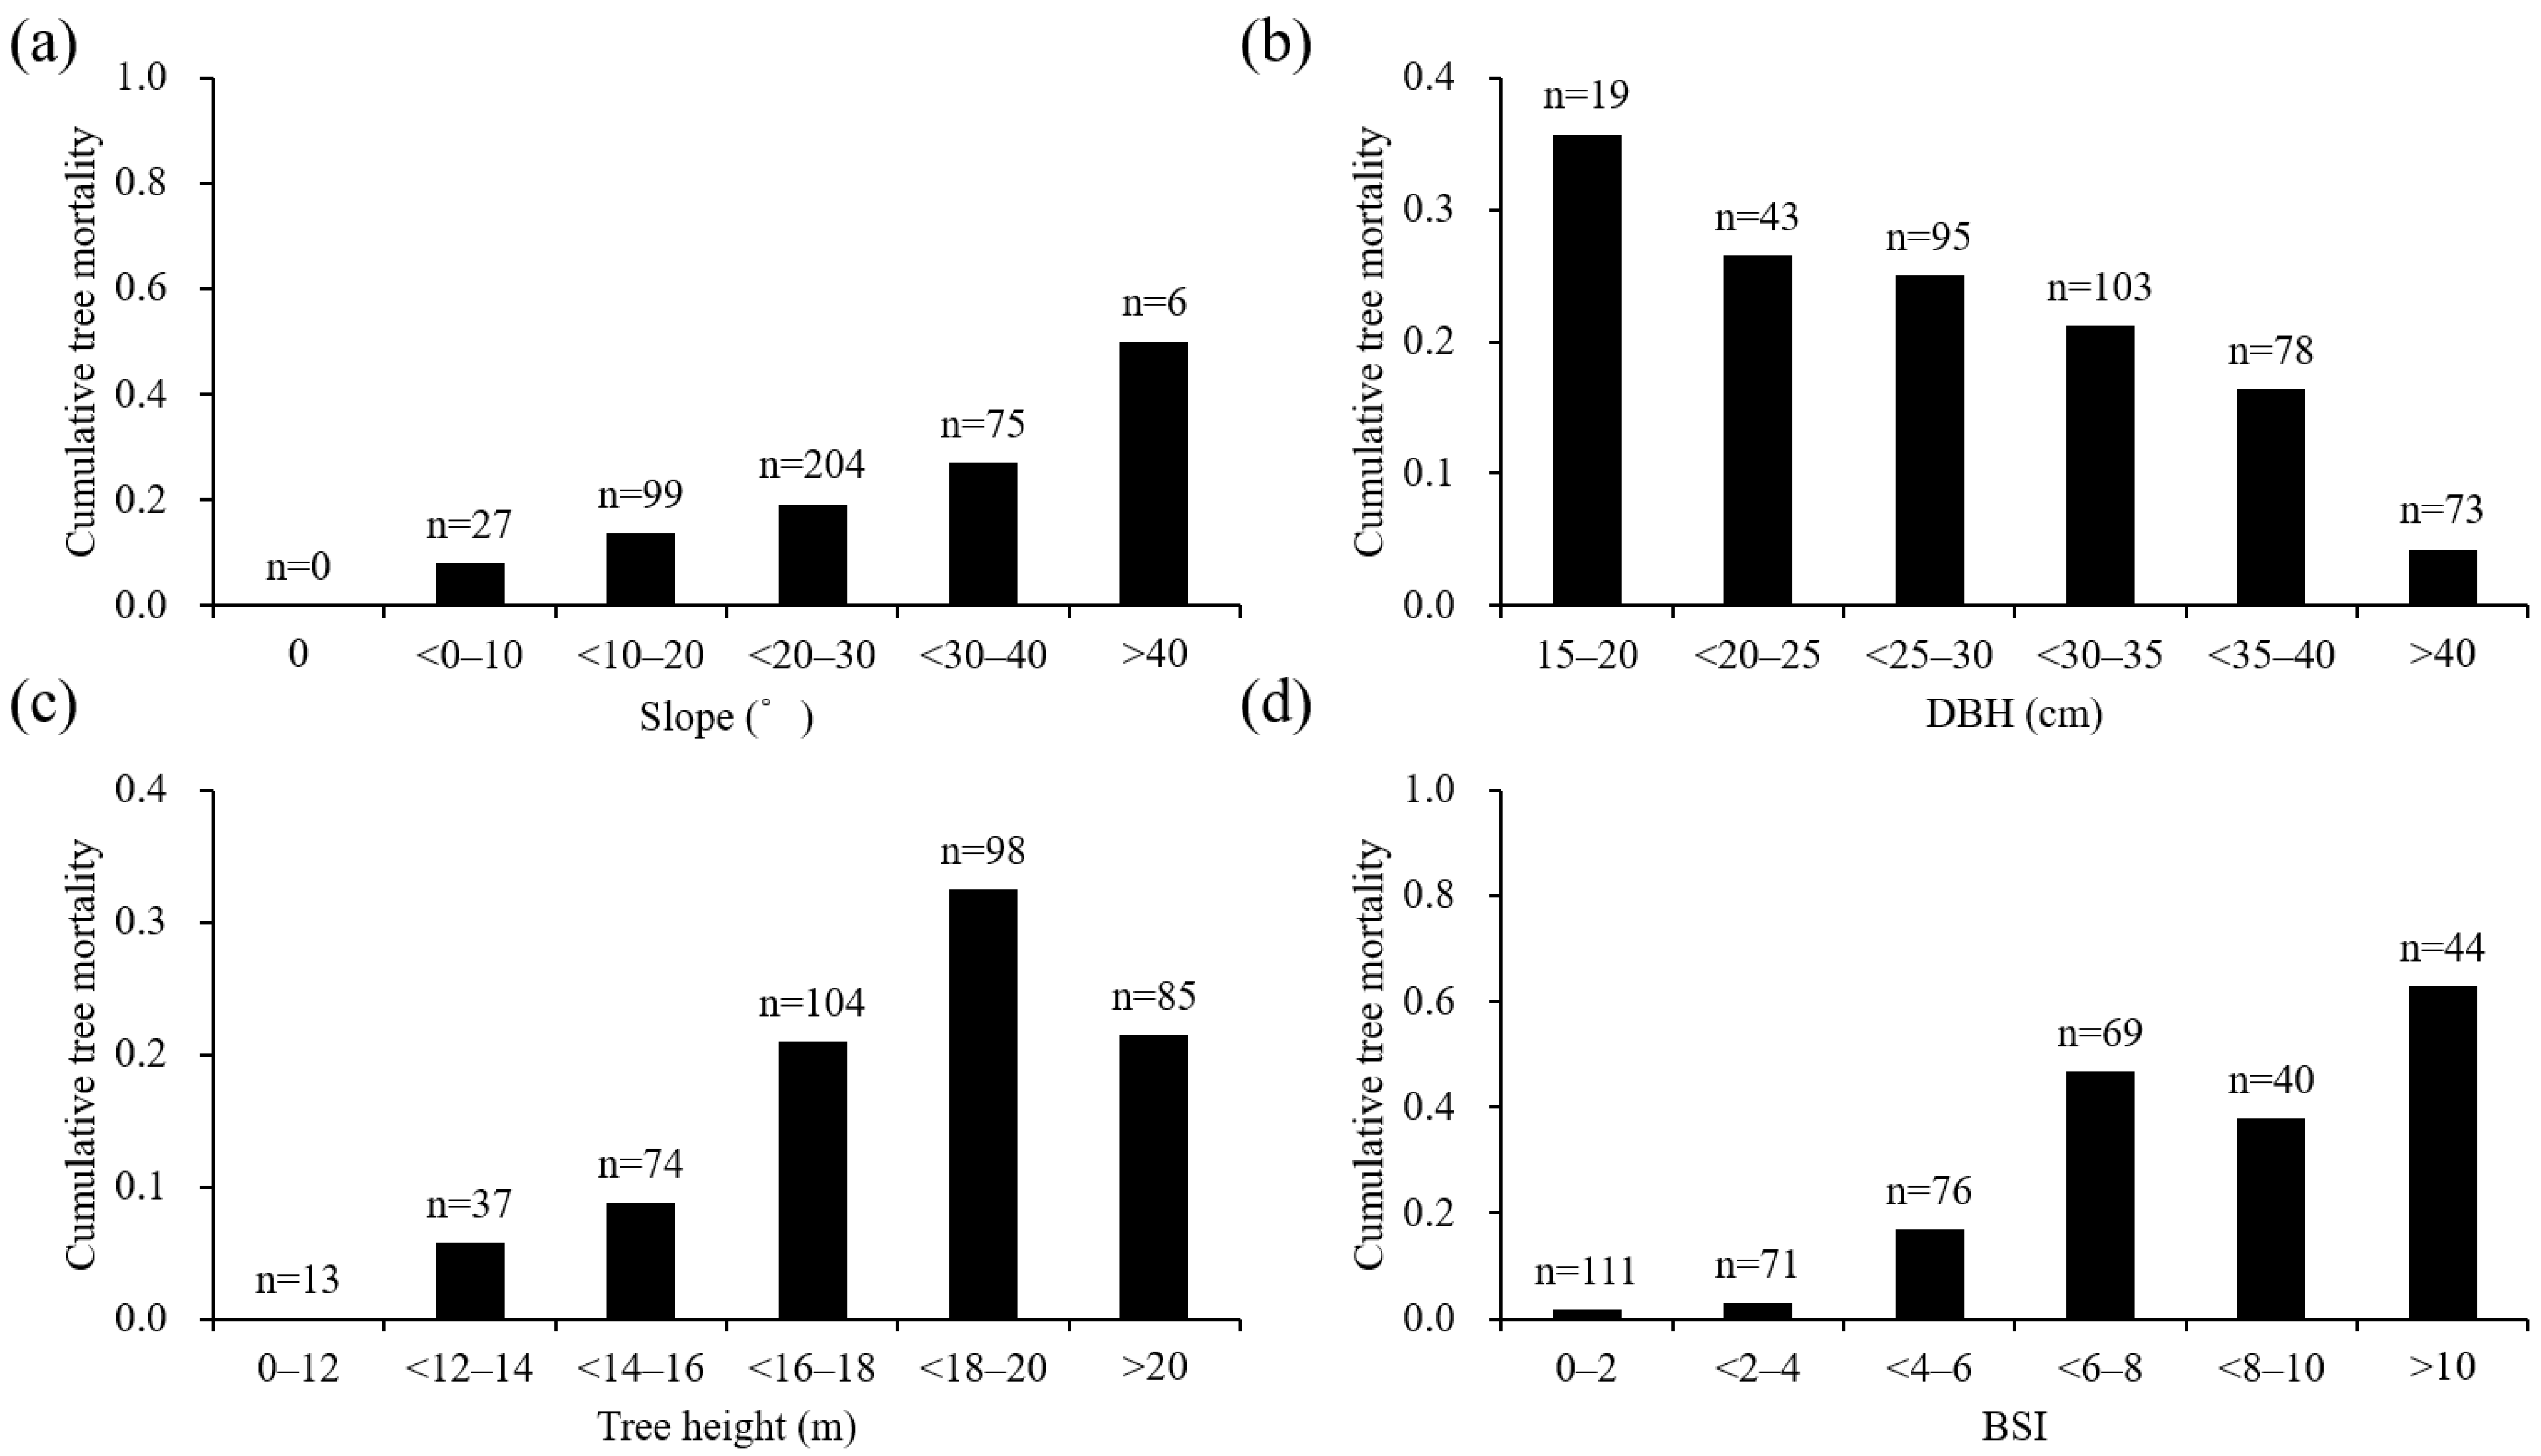
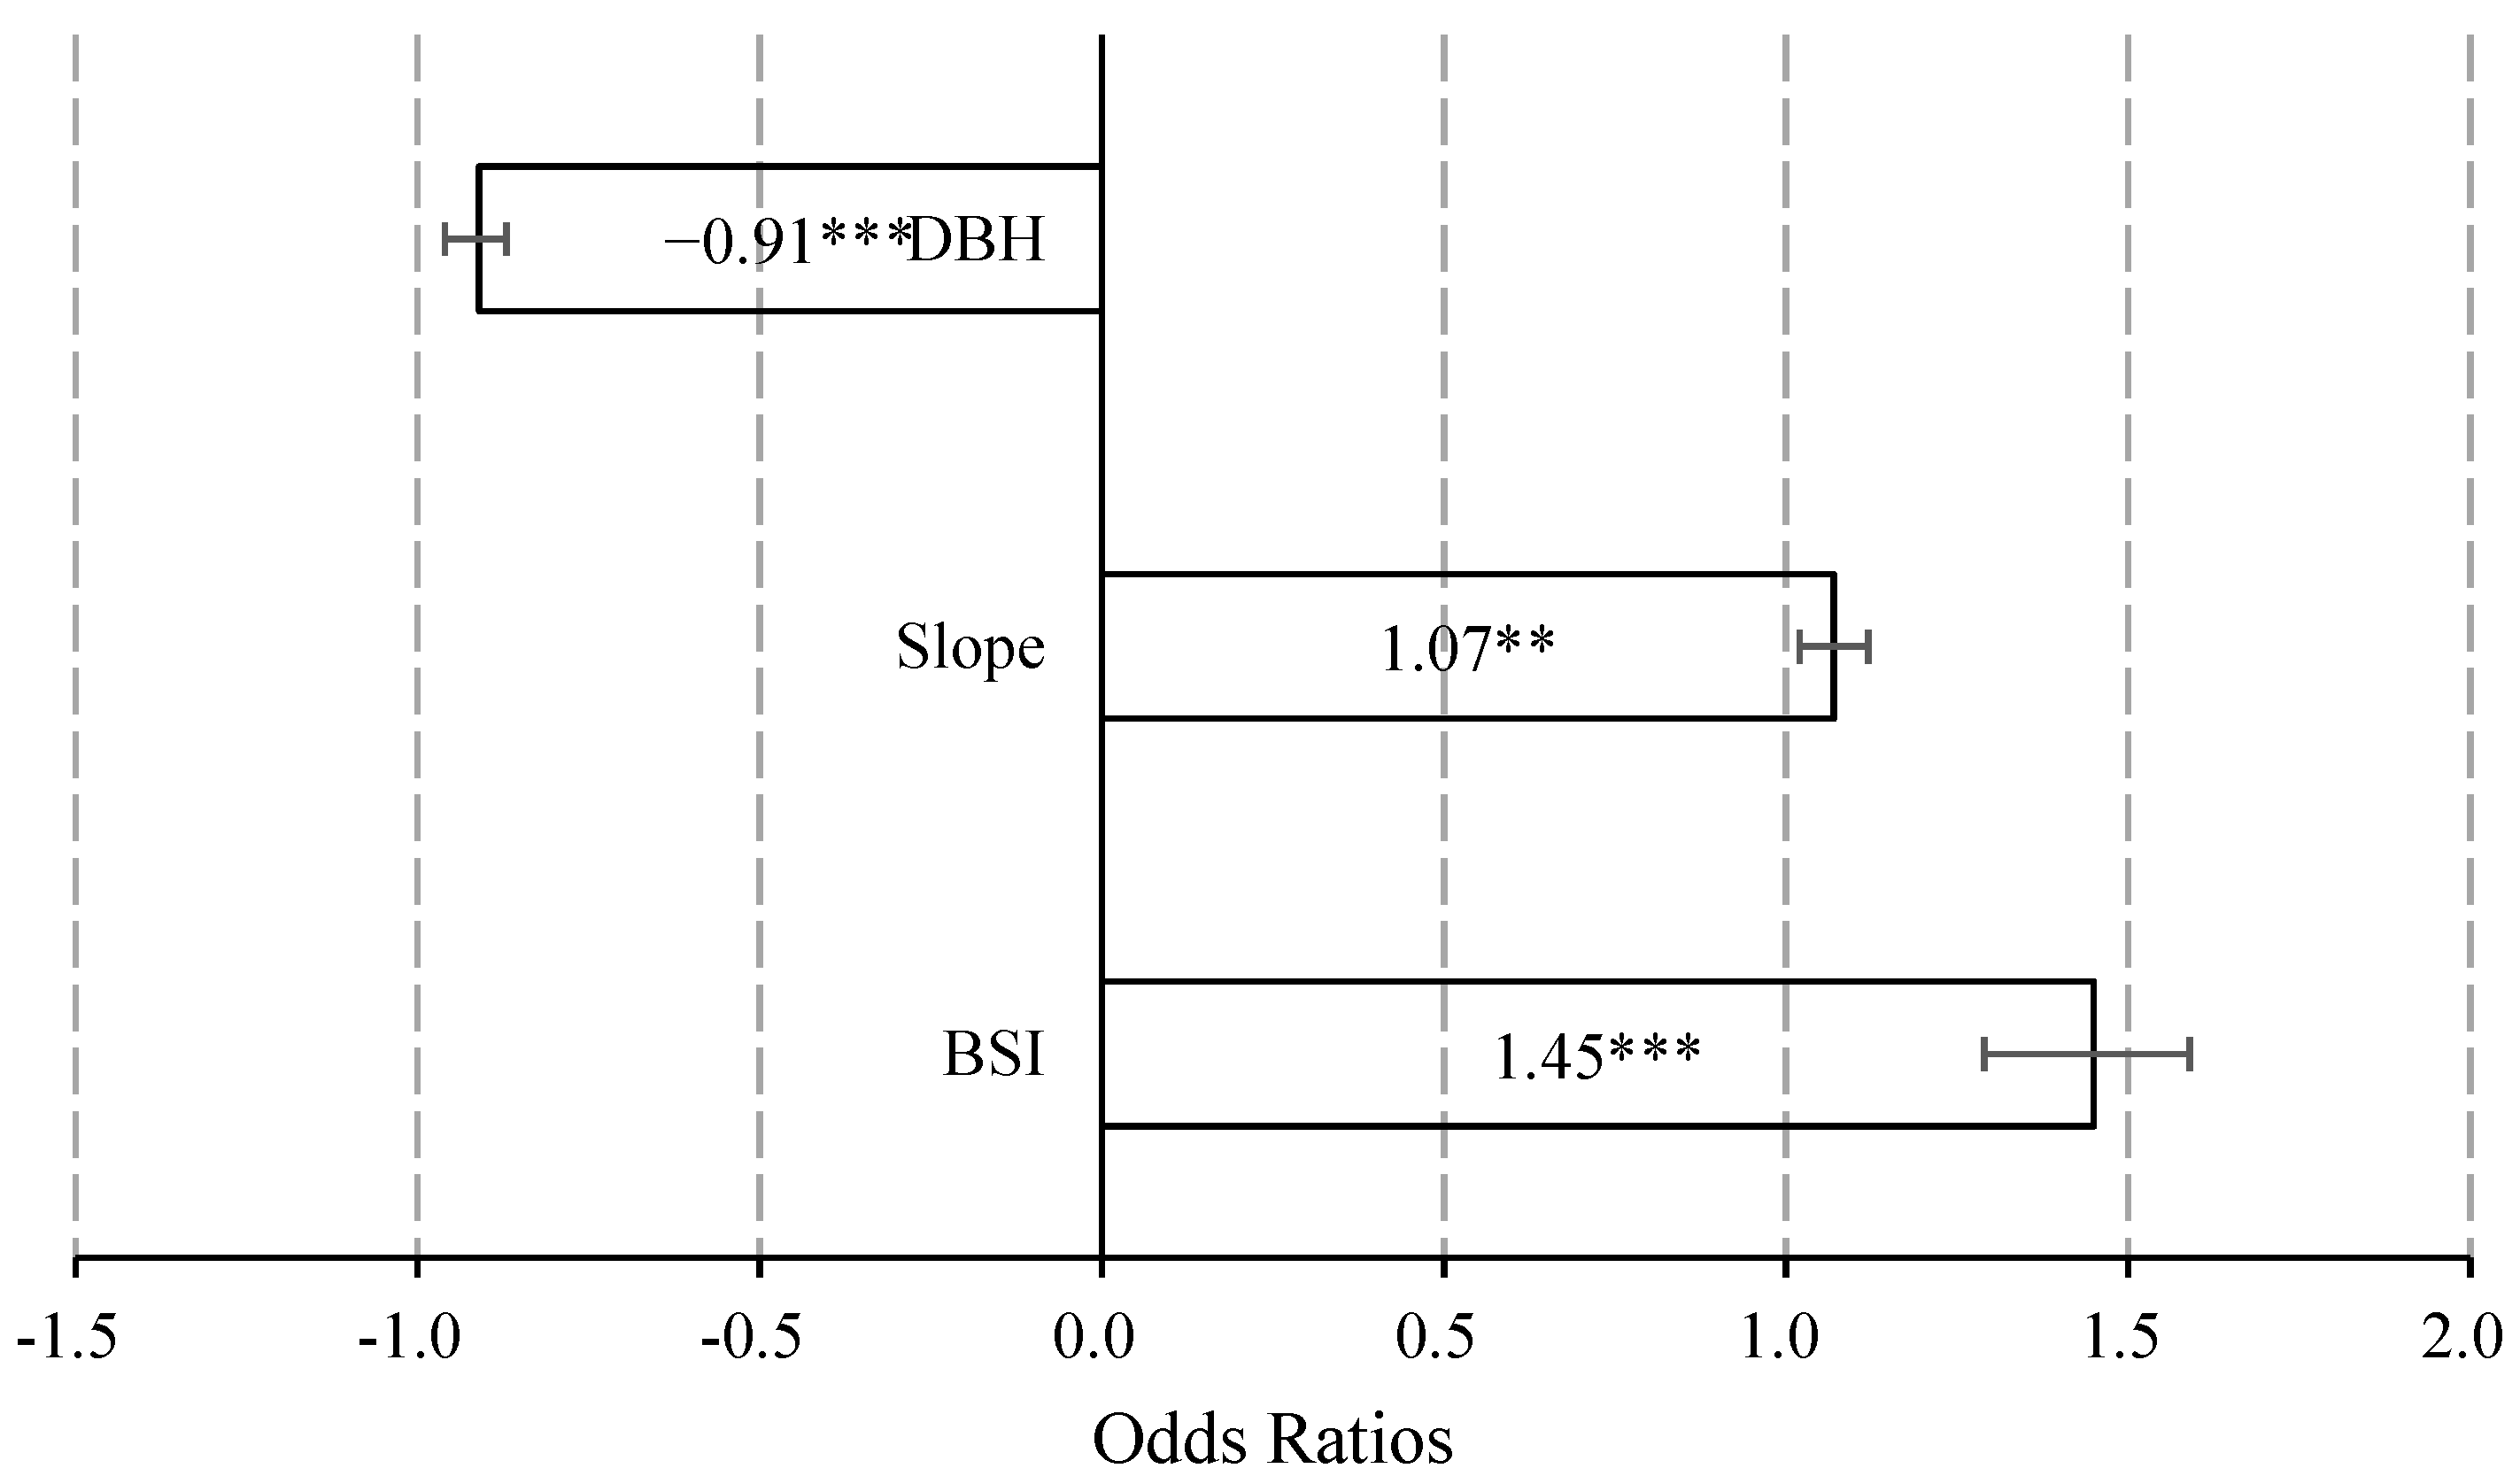
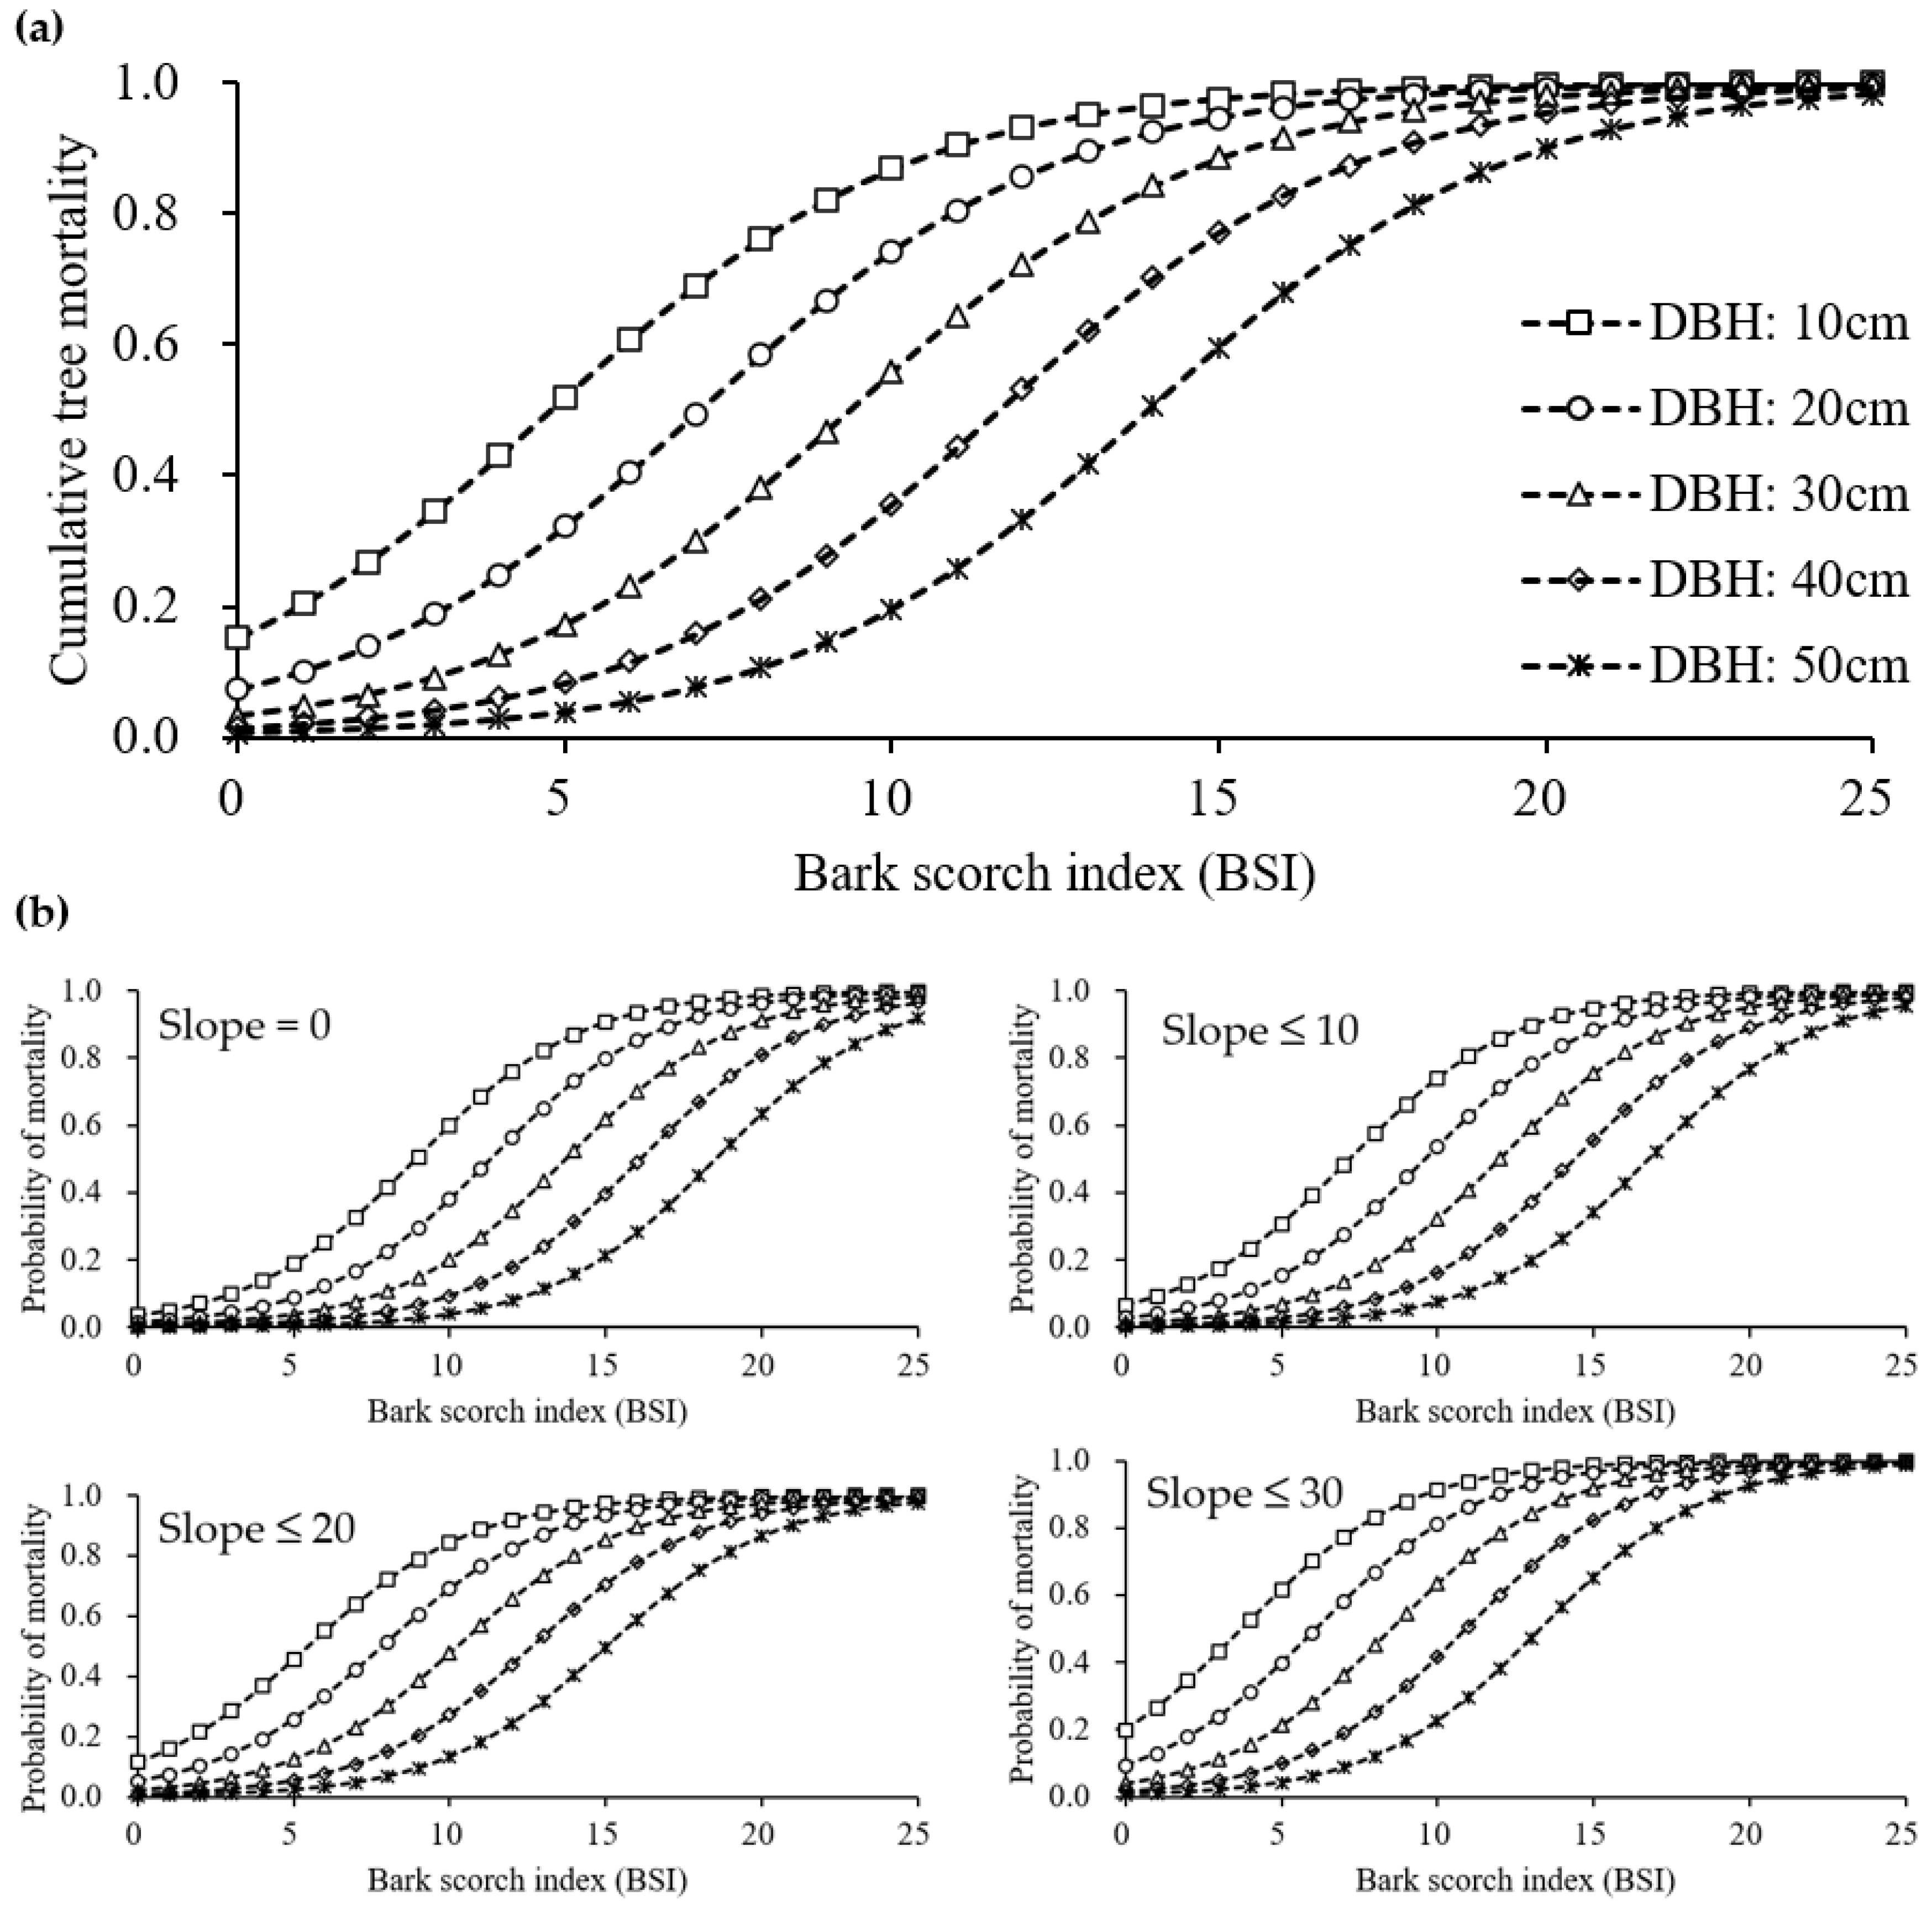
3.2. Factors Influencing the Probability of Mortality Following a Surface Fire
4. Discussion
4.1. Post-Fire Korean Red Pine Mortality Modeling
4.2. Potential Factors Influencing Post-Fire Tree Mortality
4.3. Issues Related to Our Experimental Design
5. Conclusions
Supplementary Materials
Author Contributions
Funding
Data Availability Statement
Acknowledgments
Conflicts of Interest
References
- Montoro Girona, M.; Navarro, L.; Morin, H. A Secret Hidden in the Sediments: Lepidoptera Scales. Front. Ecol. Evol. 2018, 6, 1–5. [Google Scholar] [CrossRef]
- Montoro Girona, M.; Morin, H.; Lussier, J.-M.; Ruel, J.-C. Post-cutting Mortality Following Experimental Silvicultural Treatments in Unmanaged Boreal Forest Stands. Front. For. Glob. Chang. 2019, 2, 4. [Google Scholar] [CrossRef]
- Bergeron, Y.; Gauthier, S.; Kafka, V.; Lefort, P.; Lesieur, D. Natural fire frequency for the eastern Canadian boreal forest: Consequences for sustainable forestry. Can. J. For. Res. 2001, 31, 384–391. [Google Scholar] [CrossRef]
- Martin, M.; Girona, M.M.; Morin, H. Driving factors of conifer regeneration dynamics in eastern Canadian boreal old-growth forests. PLoS ONE 2020, 15, e0230221. [Google Scholar] [CrossRef] [PubMed]
- Lavoie, J.; Girona, M.M.; Morin, H. Vulnerability of conifer regeneration to spruce budworm outbreaks in the Eastern Canadian boreal forest. Forests 2019, 10, 850. [Google Scholar] [CrossRef]
- Labrecque-Foy, J.P.; Morin, H.; Girona, M.M. Dynamics of territorial occupation by North American beavers in Canadian boreal forests: A novel dendroecological approach. Forests 2020, 11, 221. [Google Scholar] [CrossRef]
- Navarro, L.; Morin, H.; Bergeron, Y.; Girona, M.M. Changes in Spatiotemporal Patterns of 20th Century Spruce Budworm Outbreaks in Eastern Canadian Boreal Forests. Front. Plant Sci. 2018, 9, 1–15. [Google Scholar] [CrossRef]
- Seidl, R.; Thom, D.; Kautz, M.; Martin-Benito, D.; Peltoniemi, M.; Vacchiano, G.; Wild, J.; Ascoli, D.; Petr, M.; Honkaniemi, J.; et al. Forest disturbances under climate change. Nat. Clim. Chang. 2017, 7, 395–402. [Google Scholar] [CrossRef]
- Lucash, M.S.; Scheller, R.M.; Sturtevant, B.R.; Gustafson, E.J.; Kretchun, A.M.; Foster, J.R. More than the sum of its parts: How disturbance interactions shape forest dynamics under climate change. Ecosphere 2018, 9, e02293. [Google Scholar] [CrossRef]
- Westerling, A.L.; Hidalgo, H.G.; Cayan, D.R.; Swetnam, T.W. Warming and Earlier Spring Increase Western, U.S. Forest Wildfire Activity. Science 2006, 313, 940–943. [Google Scholar] [CrossRef]
- Bentz, B.J.; Rgnire, J.; Fettig, C.J.; Hansen, E.M.; Hayes, J.L.; Hicke, J.A.; Kelsey, R.G.; Negron, J.F.; Seybold, S.J. Climate change and bark beetles of the western United States and Canada: Direct and indirect effects. Bioscience 2010, 60, 602–613. [Google Scholar] [CrossRef]
- Wan, H.Y.; Rhodes, A.C.; St. Clair, S.B. Fire severity alters plant regeneration patterns and defense against herbivores in mixed aspen forests. Oikos 2014, 123, 1479–1488. [Google Scholar] [CrossRef]
- Fettig, C.J.; Reid, M.L.; Bentz, B.J.; Sevanto, S.; Spittlehouse, D.L.; Wang, T. Changing climates, changing forests: A western North American perspective. J. For. 2013, 111, 214–228. [Google Scholar] [CrossRef]
- Marques, S.; Marto, M.; Bushenkov, V.; McDill, M.; Borges, J.G. Addressing wildfire risk in forest management planning with multiple criteria decision making methods. Sustainability 2017, 9, 298. [Google Scholar] [CrossRef]
- Korea Forest Service. Statistical Yearbook of Forestry; Korea Forest Service: Daejeon, Korea, 2018. [Google Scholar]
- Lee, S.-Y.; An, S.-H. Comparative Analysis of Mortality in Species of Trees after Surface Forest Fire. J. Korean Soc. Hazard Mitig. 2009, 9, 39–43. [Google Scholar]
- Korea Forest Service. Forest Fire Statistical Yearbook 2019; Korea Forest Service: Daejeon, Korea, 2019. [Google Scholar]
- Korea Forest Service. Forestry Management Survey; Korea Forest Service: Daejeon, Korea, 2019. [Google Scholar]
- Stevens-Rumann, C.S.; Sieg, C.H.; Hunter, M.E. Ten years after wildfires: How does varying tree mortality impact fire hazard and forest resiliency? For. Ecol. Manag. 2012, 267, 199–208. [Google Scholar] [CrossRef]
- Hood, S.M.; Smith, S.L.; Cluck, D.R. Delayed Conifer Tree Mortality Following Fire in California; USDA Forest Service: Albany, CA, USA, 2007; Volume PSW-GTR-20. [Google Scholar]
- Haugaasen, T.; Barlow, J.; Peres, C.A. Surface wildfires in central Amazonia: Short-term impact on forest structure and carbon loss. For. Ecol. Manag. 2003, 179, 321–331. [Google Scholar] [CrossRef]
- Michaletz, S.T.; Johnson, E.A. A biophysical process model of tree mortality in surface fires. Can. J. For. Res. 2008, 38, 2013–2029. [Google Scholar] [CrossRef]
- Bär, A.; Michaletz, S.T.; Mayr, S. Fire effects on tree physiology. New Phytol. 2019, 223, 1728–1741. [Google Scholar] [CrossRef]
- Hood, S.M.; Smith, S.L.; Cluck, D.R. Predicting mortality for five California conifers following wildfire. For. Ecol. Manag. 2010, 260, 750–762. [Google Scholar] [CrossRef]
- Vega, J.; Jimenez, E.; Vega, D.; Ortiz, L.; Pérez, J.R. Pinus pinaster Ait. tree mortality following wildfire in Spain. For. Ecol. Manag. 2011, 261, 2232–2242. [Google Scholar] [CrossRef]
- Kim, S.; Axelsson, E.P.; Girona, M.M.; Senior, J.K. Continuous-cover forestry maintains soil fungal communities in Norway spruce dominated boreal forests. For. Ecol. Manag. 2021, 480, 118659. [Google Scholar] [CrossRef]
- Han, S.H.; Kim, J.H.; Kang, W.S.; Hwang, J.H.; Park, K.H.; Kim, C.B. Monitoring Soil Characteristics and Growth of Pinus densiflora Five Years after Restoration in the Baekdudaegan Ridge. Korean J. Environ. Ecol. 2019, 33, 453–461. [Google Scholar] [CrossRef]
- Biging, G.S.; Dobbertin, M. Evaluation of Competition Indices in Individual Tree Growth Models. For. Sci. 1995, 41, 360–377. [Google Scholar]
- Girona, M.M.; Morin, H.; Lussier, J.M.; Walsh, D. Radial growth response of black spruce stands ten years after experimental shelterwoods and seed-tree cuttings in boreal forest. Forests 2016, 7, 240. [Google Scholar] [CrossRef]
- Burnham, K.; Anderson, D. Model Selection and Multimodel Inference; Springer: New York, NY, USA, 2004. [Google Scholar]
- Hosmer, D.W.; Lemeshow, S. Applied Logistic Regression; Wiley: New York, NY, USA, 2000; ISBN 9780471722144. [Google Scholar]
- Graham, M.H. Confronting multicollinearity in ecological multiple regression. Ecology 2003, 84, 2809–2815. [Google Scholar] [CrossRef]
- Kalantar, B.; Pradhan, B.; Naghibi, S.A.; Motevalli, A.; Mansor, S. Assessment of the effects of training data selection on the landslide susceptibility mapping: A comparison between support vector machine (SVM), logistic regression (LR) and artificial neural networks (ANN). Geomat. Nat. Hazards Risk 2018, 9, 49–69. [Google Scholar] [CrossRef]
- Freeman, E.; Gretchen, M. PresenceAbsence: An R Package for Presence Absence Analysis. J. Stat. Softw. 2007, 23, 31. [Google Scholar]
- Rs. Team. Rstudio: Integrated Development for R; PBC: Boston, MA, USA, 2020; Available online: http://www.rstudio.com/ (accessed on 28 July 2020).
- Hood, S.M.; Cluck, D.R.; Smith, S.L.; Ryan, K.C. Using Bark Char Codes to Predict Post-fire Cambium Mortality. Fire Ecol. 2008, 4, 57–73. [Google Scholar] [CrossRef]
- Ryan, K.C.; Reinhardt, E.D. Predicting postfire mortality of seven western conifers. Can. J. For. Res. 1988, 18, 1291–1297. [Google Scholar] [CrossRef]
- Stephens, S.L.; Finney, M.A. Prescribed fire mortality of Sierra Nevada mixed conifer tree species: Effects of crown damage and forest floor combustion. For. Ecol. Manag. 2002, 162, 261–271. [Google Scholar] [CrossRef]
- Mutch, L.S.; Parsons, D.J. Mixed Conifer Forest Mortality and Establishment Before and After Prescribed Fire in Sequoia National Park, California. For. Sci. 1998, 44, 341–355. [Google Scholar]
- Kelley, D.I.; Harrison, S.P.; Prentice, I.C. Improved simulation of fire–vegetation interactions in the Land surface Processes and eXchanges dynamic global vegetation model (LPX-Mv1). Geosci. Model Dev. 2014, 7, 2411–2433. [Google Scholar] [CrossRef]
- Lydersen, J.; North, M. Topographic Variation in Structure of Mixed-Conifer Forests Under an Active-Fire Regime. Ecosystems 2012, 15, 1134–1146. [Google Scholar] [CrossRef]
- Lentile, L.B.; Smith, F.W.; Shepperd, W.D. Influence of topography and forest structure on patterns of mixed severity fire in ponderosa pine forests of the South Dakota Black Hills, USA. Int. J. Wildland Fire 2006, 15, 557–566. [Google Scholar] [CrossRef]
- Beaty, R.M.; Taylor, A.H. Spatial and Temporal Variation of Fire Regimes in a Mixed Conifer Forest Landscape, Southern Cascades, California, USA. J. Biogeogr. 2001, 28, 955–966. [Google Scholar] [CrossRef]
- Taylor, A.H.; Skinner, C.N. Spatial patterns and controls on historical fire regimes and forest structure in the Klamath Mountains. Ecol. Appl. 2003, 13, 704–719. [Google Scholar] [CrossRef]
- Scholl, A.E.; Taylor, A.H. Fire regimes, forest change, and self-organization in an old-growth mixed-conifer forest, Yosemite National Park, USA. Ecol. Appl. 2010, 20, 362–380. [Google Scholar] [CrossRef]
- Meyer, M.D.; North, M.P.; Gray, A.N.; Zald, H.S.J. Influence of soil thickness on stand characteristics in a Sierra Nevada mixed-conifer forest. Plant Soil 2007, 294, 113–123. [Google Scholar] [CrossRef]
- Abella, S.R.; Denton, C.W. Spatial variation in reference conditions: Historical tree density and pattern on a pinus ponderosa landscape. Can. J. For. Res. 2009, 39, 2391–2403. [Google Scholar] [CrossRef]
- Underwood, E.C.; Viers, J.H.; Quinn, J.F.; North, M. Using topography to meet wildlife and fuels treatment objectives in fire-suppressed landscapes. Environ. Manag. 2010, 46, 809–819. [Google Scholar] [CrossRef] [PubMed]
- Smirnova, E.; Bergeron, Y.; Brais, S.; Granström, A. Postfire root distribution of Scots pine in relation to fire behaviour. Can. J. For. Res. 2008, 38, 353–362. [Google Scholar] [CrossRef]
- Nesmith, J.C.B.; Das, A.J.; O’Hara, K.L.; van Mantgem, P.J. The influence of prefire tree growth and crown condition on postfire mortality of sugar pine following prescribed fire in Sequoia National Park. Can. J. For. Res. 2015, 45, 910–919. [Google Scholar] [CrossRef]
- Hood, S.M.; Varner, J.M.; Van Mantgem, P.; Cansler, C.A. Fire and tree death: Understanding and improving modeling of fire-induced tree mortality. Environ. Res. Lett. 2018, 13, 113004. [Google Scholar] [CrossRef]
- Kane, J.M.; Varner, J.M.; Metz, M.R.; van Mantgem, P.J. Characterizing interactions between fire and other disturbances and their impacts on tree mortality in western U.S. Forests. For. Ecol. Manag. 2017, 405, 188–199. [Google Scholar] [CrossRef]
- Ganio, L.M.; Progar, R.A. Mortality predictions of fire-injured large Douglas-fir and ponderosa pine in Oregon and Washington, USA. For. Ecol. Manag. 2017, 390, 47–67. [Google Scholar] [CrossRef]
- Rigolot, E. Predicting postfire mortality of Pinus halepensis Mill. and Pinus pinea L. Plant Ecol. 2004, 171, 139–151. [Google Scholar] [CrossRef]
- Sieg, C.H.; McMillin, J.D.; Fowler, J.F.; Allen, K.K.; Negron, J.F.; Wadleigh, L.L.; Anhold, J.A.; Gibson, K.E. Best predictors for postfire mortality of ponderosa pine trees in the Intermountain West. For. Sci. 2006, 52, 718–728. [Google Scholar]
- Thies, W.G.; Westlina, D.J.; Loewen, M.; Brenner, G. Prediction of delayed mortality of fire-damaged ponderosa pine following prescribed fires in eastern Oregon, USA. Int. J. Wildland Fire 2006, 15, 19–29. [Google Scholar] [CrossRef]
- Lutes, D.C. FOFEM User Guide; USDA Forest Service: Albany, CA, USA, 2020. [Google Scholar]
- Angers, V.A.; Gauthier, S.; Drapeau, P.; Jayen, K.; Bergeron, Y. Tree mortality and snag dynamics in North American boreal tree species after a wildfire: A long-term study. Int. J. Wildland Fire 2011, 20, 751–763. [Google Scholar] [CrossRef]
- Gangwon Province. Nature Environment (in Korean). 2018. Available online: http://www.provin.gangwon.kr/gw/portal/sub03_01 (accessed on 16 July 2020).
- Korea Meteorological Administration. Korean Climate: Gangwon-do. 2020. Available online: https://www.weather.go.kr/weather/climate/average_regional01.jsp (accessed on 16 July 2020).
- Hood, S.M.; Morgan, J. Post-fire Tree Mortality. In Encyclopedia of Wildfires Wildland-Urban Interface Fires; Springer: Berlin/Heidelberg, Germany, 2019; p. 10. [Google Scholar]


| Categories | Variables | Dead Trees | Live Trees | Site A | Site B | Site C |
|---|---|---|---|---|---|---|
| Topography | Elevation (m) | 734.4 (±15.7) ** | 769.6 (±86.0) ** | 726.3 (±6.1) b | 737.6 (±19) b | 849.5 (±5.6) a |
| Slope (°) | 26.3 (±7.8) * | 23.1 (±8.0) * | 21.2 (±8.9) b | 26.4 (±6.3) a | 19.0 (±8.2) b | |
| Aspect | N | NE | N | NE | SW | |
| Growth feature | DBH (cm) | 30.6 (±6.7) ** | 34.3 (±7.5) ** | 33.5 (±7.7) b | 32.1 (±6.8) b | 36.9 (±7.6) a |
| TH (m) | 18.9 (±2.4) ** | 17.3 (±3.2) ** | 22.0 (±1.6) a | 17.9 (±2.8) b | 15.3 (±1.9) c | |
| CH (m) | 11.5 (±2.4) ** | 9.5 (±5.3) ** | 13.7 (±2.3) a | 10.72 (±5.6) b | 6.7 (±1.5) c | |
| Bark injury | BSH (m) | 2.6 (±1.1) ** | 1.3 (±1.0) ** | 2.7 (±1.7) a | 1.7 (±0.9) b | 0.7 (±0.4) c |
| BSP (%) | 78.9 (±14.8) ** | 57.9 (±20.4) ** | 74.19 (±18.3) a | 65.6 (±20.1) b | 48.7 (±18.1) c | |
| BSI (ns) | 8.6 (±3.9) ** | 3.6 (±3.2) ** | 8.8 (±6.0) a | 5.0 (±3.0) b | 1.7 (±1.3) c |
| Category | Variable | Estimate | Std. Error | Z | p | AIC | ∆AIC | AUC | VIF |
|---|---|---|---|---|---|---|---|---|---|
| Topography | Elevation | −0.005 | 0.002 | −2.4 | 0.018 | 329.3 | 73.9 | 0.682 | 1.034 |
| Slope | 0.051 | 0.019 | 2.8 | 0.005 | 330.1 | 74.7 | 0.597 | 1.249 | |
| Growth feature | DBH | −0.07 | 0.02 | −3.5 | <0.001 | 325.2 | 69.8 | 0.641 | 1.426 |
| TH | 0.169 | 0.047 | 3.6 | <0.001 | 324.3 | 68.9 | 0.652 | 2.449 | |
| CH | 0.085 | 0.041 | 2.1 | 0.039 | 331.2 | 75.8 | 0.712 | 2.16 | |
| Bark injury | BSH | 1.086 | 0.155 | 7 | <0.001 | 268.3 | 12.9 | 0.838 | 1.214 |
| BSP | 21.263 | 2.997 | 7.1 | <0.001 | 270.5 | 15.1 | 0.808 | 1.145 | |
| BSI | 4.075 | 1.285 | 3.2 | <0.001 | 255.4 | 0 | 0.862 | ° |
| Model | X2 | Log-Likelihood | McFadden’s Pseudo R2 | AIC | ∆AIC | AUC |
|---|---|---|---|---|---|---|
| M1 | 5.32 | −115.72 | 0.31 | 245.45 | 5.49 | 0.87 |
| M2 | 11.52 | −159.82 | 0.04 | 325.64 | 85.7 | 0.673 |
| M3 | 12.7 ** | −122.28 | 0.27 | 252.56 | 12.6 | 0.864 |
| M4 | 31.62 *** | −150.94 | 0.09 | 309.88 | 69.9 | 0.733 |
| M5 | 7.02 | −119.78 | 0.28 | 249.56 | 9.6 | 0.867 |
| M6 | 7.27 | −115.98 | 0.31 | 239.96 | 0 | 0.87 |
| M7 | 7.24 | −119.84 | 0.28 | 245.68 | 5.7 | 0.867 |
| M8 | 16.16 ** | −122.64 | 0.27 | 251.28 | 11.3 | 0.862 |
| Variables | Model | Formula |
|---|---|---|
| All | M1 | −1.6278 + (−0.0014 × Elevation) + (0.0645 × Slope **) + (−0.0909 × DBH **) + (0.0201 × TH) + (−0.0010 × CH) + (0.3632 × BSI ***) |
| Topography | M2 | 0.7224 + (−0.0043 × Elevation *) + (0.0645 × Slope *) |
| M3 | −3.5282 * + (−0.0017 × Elevation) + (0.0536 × Slope *) + (0.3561 × BSI ***) | |
| Growth features | M4 | −2.3565 * + (−0.0882 × DBH ***) + (0.2063 × TH ***) + (0.0001 × CH) |
| M5 | −1.0877 + (−0.0861 × DBH **) + (0.0251 × TH) + (−0.0111 × CH) + (0.3546 × BSI ***) | |
| Optimal models | M6 | −2.4525 * + (0.0649 × Slope **) + (−0.0892 × DBH ***) + (0.3733 × BSI ***) |
| M7 | −0.9018 + (−0.0824 × DBH ***) + (0.3607 × BSI ***) | |
| M8 | −4.9233 *** + (0.0547 × Slope **) + (0.3621 × BSI ***) |
Publisher’s Note: MDPI stays neutral with regard to jurisdictional claims in published maps and institutional affiliations. |
© 2021 by the authors. Licensee MDPI, Basel, Switzerland. This article is an open access article distributed under the terms and conditions of the Creative Commons Attribution (CC BY) license (http://creativecommons.org/licenses/by/4.0/).
Share and Cite
Kwon, S.; Kim, S.; Kim, J.; Kang, W.; Park, K.-H.; Kim, C.-B.; Girona, M.M. Predicting Post-Fire Tree Mortality in a Temperate Pine Forest, Korea. Sustainability 2021, 13, 569. https://doi.org/10.3390/su13020569
Kwon S, Kim S, Kim J, Kang W, Park K-H, Kim C-B, Girona MM. Predicting Post-Fire Tree Mortality in a Temperate Pine Forest, Korea. Sustainability. 2021; 13(2):569. https://doi.org/10.3390/su13020569
Chicago/Turabian StyleKwon, Semyung, Sanghyun Kim, Jeonghwan Kim, Wonseok Kang, Ki-Hyung Park, Chan-Beom Kim, and Miguel M. Girona. 2021. "Predicting Post-Fire Tree Mortality in a Temperate Pine Forest, Korea" Sustainability 13, no. 2: 569. https://doi.org/10.3390/su13020569
APA StyleKwon, S., Kim, S., Kim, J., Kang, W., Park, K.-H., Kim, C.-B., & Girona, M. M. (2021). Predicting Post-Fire Tree Mortality in a Temperate Pine Forest, Korea. Sustainability, 13(2), 569. https://doi.org/10.3390/su13020569