Article

How Prior Knowledge Affects Visual Attention of Japanese Mimicry and Onomatopoeia and Learning Outcomes: Evidence from Virtual Reality Eye Tracking

1
School of Information and Design, Chang Jung Christian University, Tainan 711301, Taiwan
2
Department of Computer Science and Information Engineering, National Taichung University of Science and Technology, Taichung City 404348, Taiwan
3
Department of Digital Media Design, Chang Jung Christian University, Tainan 711301, Taiwan
*
Author to whom correspondence should be addressed.
Sustainability 2021, 13(19), 11058; https://doi.org/10.3390/su131911058
Submission received: 27 July 2021 / Revised: 24 September 2021 / Accepted: 26 September 2021 / Published: 6 October 2021
(This article belongs to the Special Issue Sustainable Educational Technology and E-learning)

Abstract

:
According to the United Nations Sustainable Development Goal (SDG) 4, “achieving inclusive and quality education for all”, foreign language learning has come to be seen as a process of integrating sustainable development into the socio-cultural aspects of education and learning. The aim of this study was to employ virtual reality (VR) eye tracker to examine how students with different levels of prior knowledge process visual behaviors for Japanese Mimicry and Onomatopoeia (MIO) while learning Japanese as a second foreign language. A total of 20 students studying at the Department of Applied Japanese at the university of Southern Taiwan were recruited. Based on the Japanese language proficiency test (JLPT) level, 20 participants were divided into high prior knowledge group (levels N1–N3) with 7 participants, and low prior knowledge group (level N4 or below) with 13 participants. The learning stimuli materials were created by Unreal Engine 4 (UE4) development tool to design a 3D virtual MIO paradise, including 5 theme amusement parks. Through a VR eye tracker, participants’ visual behaviors were tracked and recorded based on 24 different regions of interest (ROIs) (i.e., ROI1–ROI24). This was done to discuss the distribution of visual attention in terms of different ROIs of each theme amusement park based on four eye movement indicators, including latency of first fixation (LFF), duration of first fixation (DFF), total fixation durations (TFD), and fixation counts (FC). Each ROI of the two groups were then compared. In addition, a heat zone map was also generated to show the overall visual distribution of each group. After the experiment, based on the eye movement indicators and test scores in the pre-test and post-test phases, statistical analysis was used to examine and evaluate the differences in visual attention and learning outcomes. The results revealed that the gaze sequences of the two prior knowledge groups gazing at the ROIs in theme parks were different, except for the gaze sequence in the circus theme park. Different prior knowledge groups exhibited differences in visual attention in the ROIs fixated on in each amusement park. Additionally, in terms of TFD and FC of different groups in each amusement park, there was no significant difference except in ROI10, ROI16, and ROI18. Moreover, after receiving cognitive comprehension processes introduced in the VR-simulated MIO scenes, students from both groups achieved higher post-test scores compared with pre-test scores, and such differences had statistical significance. In conclusion, the implications of VR eye movement analysis on developing students’ competence related to learning Japanese and cross-cultural aspects, compatible with sustainable development, were presented.

1. Introduction

In 2015, the United Nations set forth 17 Sustainable Development Goals (SDGs) and Education for Sustainable Development (ESD) is recognized as a part of SDG No. 4 to empower learners to take informed decisions, accept responsibilities, and devise solutions to achieve environment integrity, economic viability, and social justice [1]. Based on the concept of integrating sustainable development into education, relevant studies have concentrated on two basic elements of quality education, i.e., educational content and learning environment. The former covers locally and globally critical topics regarding nature conservation, biodiversity, challenges faced by culturally diverse communities, etc. [2], and the latter encompasses ecological, economic, social, and cultural aspects to predict and solve social environmental problems which affect learners’ understanding of the modern, diverse world’s interests and needs [3]. However, few studies have paid attention to (foreign) language education for sustainable development in comparison to other learning-related issues. Language, as a tool which helps build human relationships via education, is an essential instrument when people face global challenges of sustainable development.
In addition to its role in traditional pedagogy, higher education institutions play a major role in the establishment and demonstration of ESD in which a foreign language competence is a key prerequisite for acquiring desired results for sustainable development in the 21st century. In response to the changes in the education environment in Taiwan and to the development of information education, students should be trained to master multiple languages in future curricula. Hence, besides English, it is also necessary to encourage students to learn a second foreign language to help them develop professional competence and enhance competitiveness. In recent years, Taiwan has witnessed a growing trend of internationalization and Japanese culture influence. According to the statistics of Japanese-Language Proficiency Test (JLPT), the number of global test takers was as high as 1.02 million in 2017, proving the increasing learning interest in Japanese.
In the light of the evaluation and certificate of Japanese language proficiency of non-native speakers, the JLPT has five levels: N1 (the most difficult), N2, N3, N4, and N5 (the easiest), and measures comprehensive Japanese-language communicative competence. The number of test takers in Taiwan has also set a record high with more than 86,000 test takers, ranking third among all countries other than Japan. Judging from the number of Japanese learners, when students face global competitions and challenges, learning Japanese as a second foreign language has become a prominent choice for the present and future generations in Taiwan.
Language is a fundamental expression of culture and a primary resource for social interaction. That is, language and culture are inseparable. To learn a language well, one must first understand the particular culture. In the context of Japanese culture, “Mimicry and Onomatopoeia, MIO” (the term “MIO” is quoted from [4]) is a form of Japanese expression acquired innately by the Japanese, frequently used in daily conversations and literary works by the Japanese people [5]. The abundant amount of “mimicry and onomatopoeia” (hereafter jointly referred to as “onomatopoeia”) makes Japanese expressions more vivid. In addition, onomatopoeia also plays a critical part in the text of news, advertisements, animations, and games. By definition, onomatopoeia (
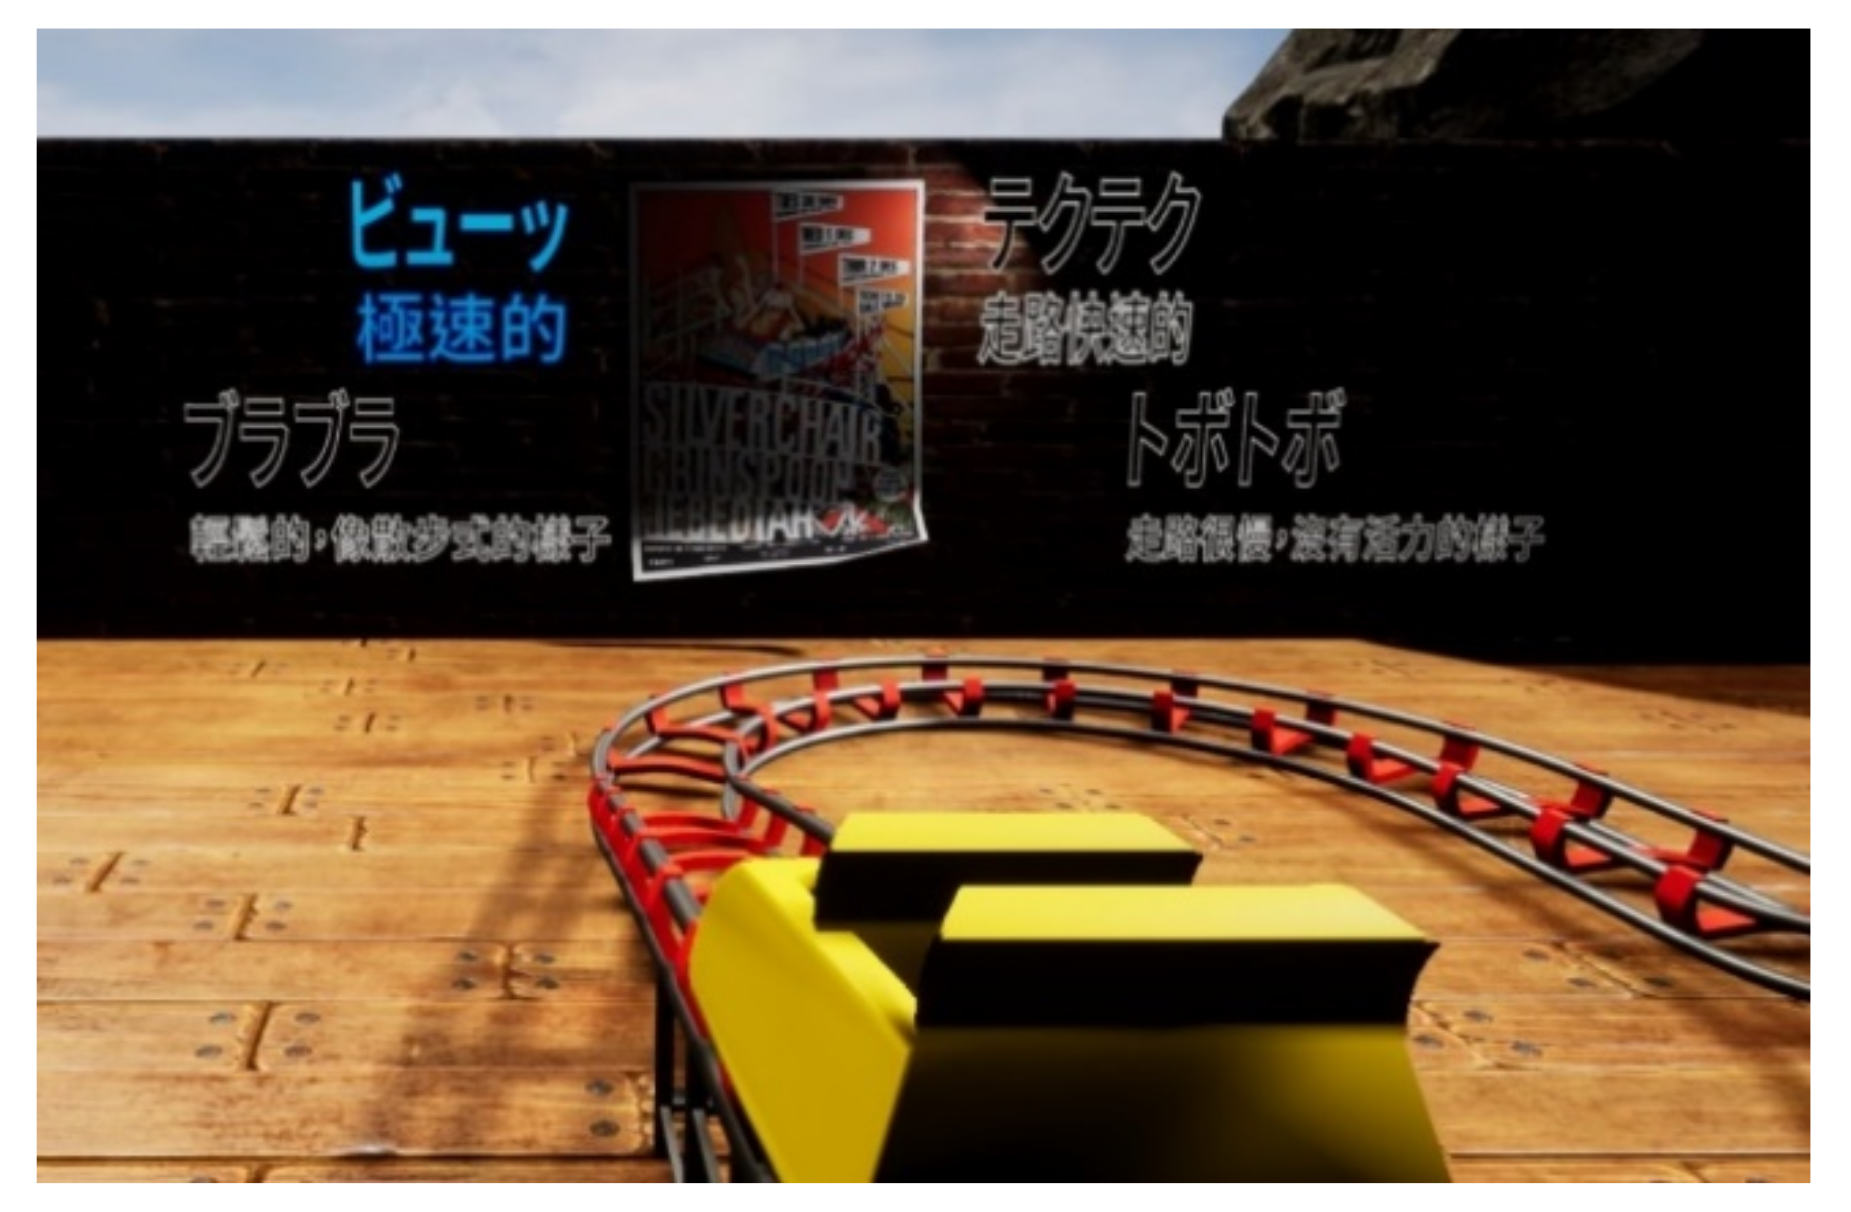
giongo in Japanese) refers to a word used to imitate sounds made by things in nature (e.g., woof woof for dog barks). The sound heard by the ear is expressed in the form of onomatopoeia. On the other hand, mimicry (gitaigo in Japanese) is a word that describes the movement, appearance, shape, or state of objects or living beings (e.g., kira-kira for the twinkling stars). In other words, mimicry symbolizes what is seen by the eye (i.e., form, action, or appearance) by describing how it should sound. However, for non-native Japanese learners, onomatopoeia is extremely difficult, mainly because the abstract meaning of onomatopoeia must be mastered before it can be used adeptly in communication. Besides, for Chinese native L2 learners, onomatopoeia is especially difficult, since they often rely too much on Kanji, i.e., the adopted logographic Chinese characters used in the Japanese writing system.
When learning onomatopoeia in the past, Japanese learners often tried to simply memorize the words. Then, supplementary materials with vivid pictures came into the pedagogy. By describing vivid actions and expressions, these materials allow learners to go beyond words and immediately understand the meaning of onomatopoeia words, so that they can learn Japanese onomatopoeia in a more effortless way. Since onomatopoeia words “simulate” sounds and states of objects, it requires a cultural tacit understanding and a common background to use onomatopoeia words in a natural way. Ref. [6] pointed out that understanding and imagining the meaning of onomatopoeia only through vivid pictures can help learners relate to the usage of onomatopoeia, but since the teaching is not conducted verbally, it still cannot effectively improve the learning outcome. Ref. [7] also mentioned that Japanese onomatopoeia must be expressed correctly through various senses, and it includes many synonyms, reduplications, and assonances. Hence, it is considerably difficult to use onomatopoeia properly in Japanese conversations.
To tackle this issue, ref. [6,7] both used information technology to develop a context-aware Japanese onomatopoeia learning assistant system called JAMIOLAS (Japanese Mimicry and Onomatopoeia Learning Assistant System). JAMIOLAS versions 1.0 and 2.0 used, respectively, wearable sensors and a sensor network to automatically detect the participants’ environment in order to achieve accurate learning results [7]. A later version, JAMIOLAS 3.0, used a web-based system which allows teachers to create an onomatopoeia database and contextual scenarios, and can facilitate the context-aware learning of onomatopoeia by using the sensor data collected via the Internet [6]. However, most JAMIOLAS participants are Japanese students accustomed to using onomatopoeia in daily conversations. Hence, for L learners of Japanese, no empirical evidence can confirm whether the JAMIOLAS system can help them learn onomatopoeia in a more effective way. In this regard, ref. [8] adopted a semantic differential (SD) method to predict the meaning of onomatopoeia for non-native Japanese learners. The research concludes that only sounds and contextual clues do not suffice to help predict and understand onomatopoeia without the implementation of onomatopoeia teaching. To deal with this issue, ref. [9] proposed a learning system to help international students with onomatopoeia based on a previously-constructed system: SCROLL (System for Capturing and Reminding of Learning Logs). SCROLL is the result of a pilot study, and there is the problem of insufficient test functionality. That is, due to the relatively small number of participants, it can only be evaluated as a conducive system which meets the needs of students surveyed, and there is still much room for improvement.
According to the cognitive theory of multimedia learning issued by [10] constructed based on the dual code theory [11], the brain does not interpret a multimedia presentation of words, pictures, and auditory information in a mutually exclusive fashion. That is, words and pictures complement, but cannot replace each other. When words and images are presented together, it helps students to produce mental constructs of language and images and build the relationship between the two mental constructs. Studies also found that combinations of text, imagery, and pictures in instruction facilitated conceptual understanding in multimedia learning [12,13,14]. Ref. [15] further contends that meaningful learning in multimedia environments occurs when learners choose relevant information, conduct the information to form coherent mental representations, and integrate new and existing representations. As a result, to adequately use adjective expressions becomes an important element in the context of multimedia learning while learning Japanese MIO words. Using the rhetorical way of speaking, especially in Japanese onomatopoeia, overseas students would have the solid understanding of the onomatopoeia situations not only to rich communication with Japanese native speakers, but also to properly express the usage of Japanese onomatopoeia depending on the situation where the participants are. Therefore, this study aimed to propose a VR scenario to improve the immersive learning environment and support the effectiveness of learning MIO words.
Compared with traditional teaching materials, VR materials can offer richer experiences. VR technology mainly presents real-time, dynamic, and interactive scenes, which can simulate phenomena that cannot be operated or observed in a real-life teaching setting in a two-way communication of information, known as human-computer interface (HCI). This feature bridges the cognitive difference and allows users to interact with the virtual environment with appropriate software and/or hardware HCI. In this way, users can acquire a more concrete learning experience, which in turn enhances the users’ learning interests and outcomes. For example, ref. [16] integrated VR technology into high school biomolecular education by developing a system called MolecularStudio and concluded that three-dimensional visual design stimulated students’ engagement and motivation when they were learning about protein structures. Another instance can be seen in [17], in which VR technology was adopted to create a learning system which teaches canine bone anatomy and related knowledge [18], on the other hand, provided insight into the learning process and outcomes of using 3D virtual learning environment in computer engineering education. All these examples illustrate that various applications are being derived from VR technology, in fields including medicine, education, etc.
However, with the development of information technology, users now have higher expectations for VR. If VR only realizes the interactive change of view anglevia the gyroscope or head rotation, it can no longer satisfy users. In this sense, innovations in VR must be made, and eye tracking technology is a possible answer as it can identify the true focal point of the eyes. Eye tracking technology has now become the largest application market for VR, as it can solve demands regarding VR experience. Through the acquisition, modeling, and simulation of eye movement data, VR devices can better interact with users and thus enhance immersion and interaction. Thus, in the near future, the integration of VR and eye tracking technologies will very likely be one of the most important applications in teaching settings.
Eye movement is a process in which a person’s gazes would center on interesting or informative areas of the image, leaving blank or uniform regions uninspected. This process involves continuous movements of the eyes, and eye tracking technology is the detection technology to observe such eye movement. The technology enables unobtrusive data collection of eye movement with certain software. In [19], eye tracking applications were surveyed in a variety of domains (such as neuroscience, psychology, industrial engineering, and computer science) and human factors (such as marketing/advertising). Ref. [19] also reported that “Perhaps the first well-known use of eye trackers in the study of human (overt) visual attention occurred during reading experiments” ([19], p. 456). In addition, ref. [20] pointed out that eye tracking technology is an important tool for natural and real-time exploration of cognitive thinking. The information receiving process reflects the correlation between eye movement and psychological change(s) of the reader. Hence, this technology is widely used to understand the reading process and other related topics (e.g., eye movement characteristics, perceptual breadth, information integration, etc.), and to test the cognitive process during different tasks [21].
In recent years, the innovation of hardware and software technology has made the collection and analysis of eye movement data easier [
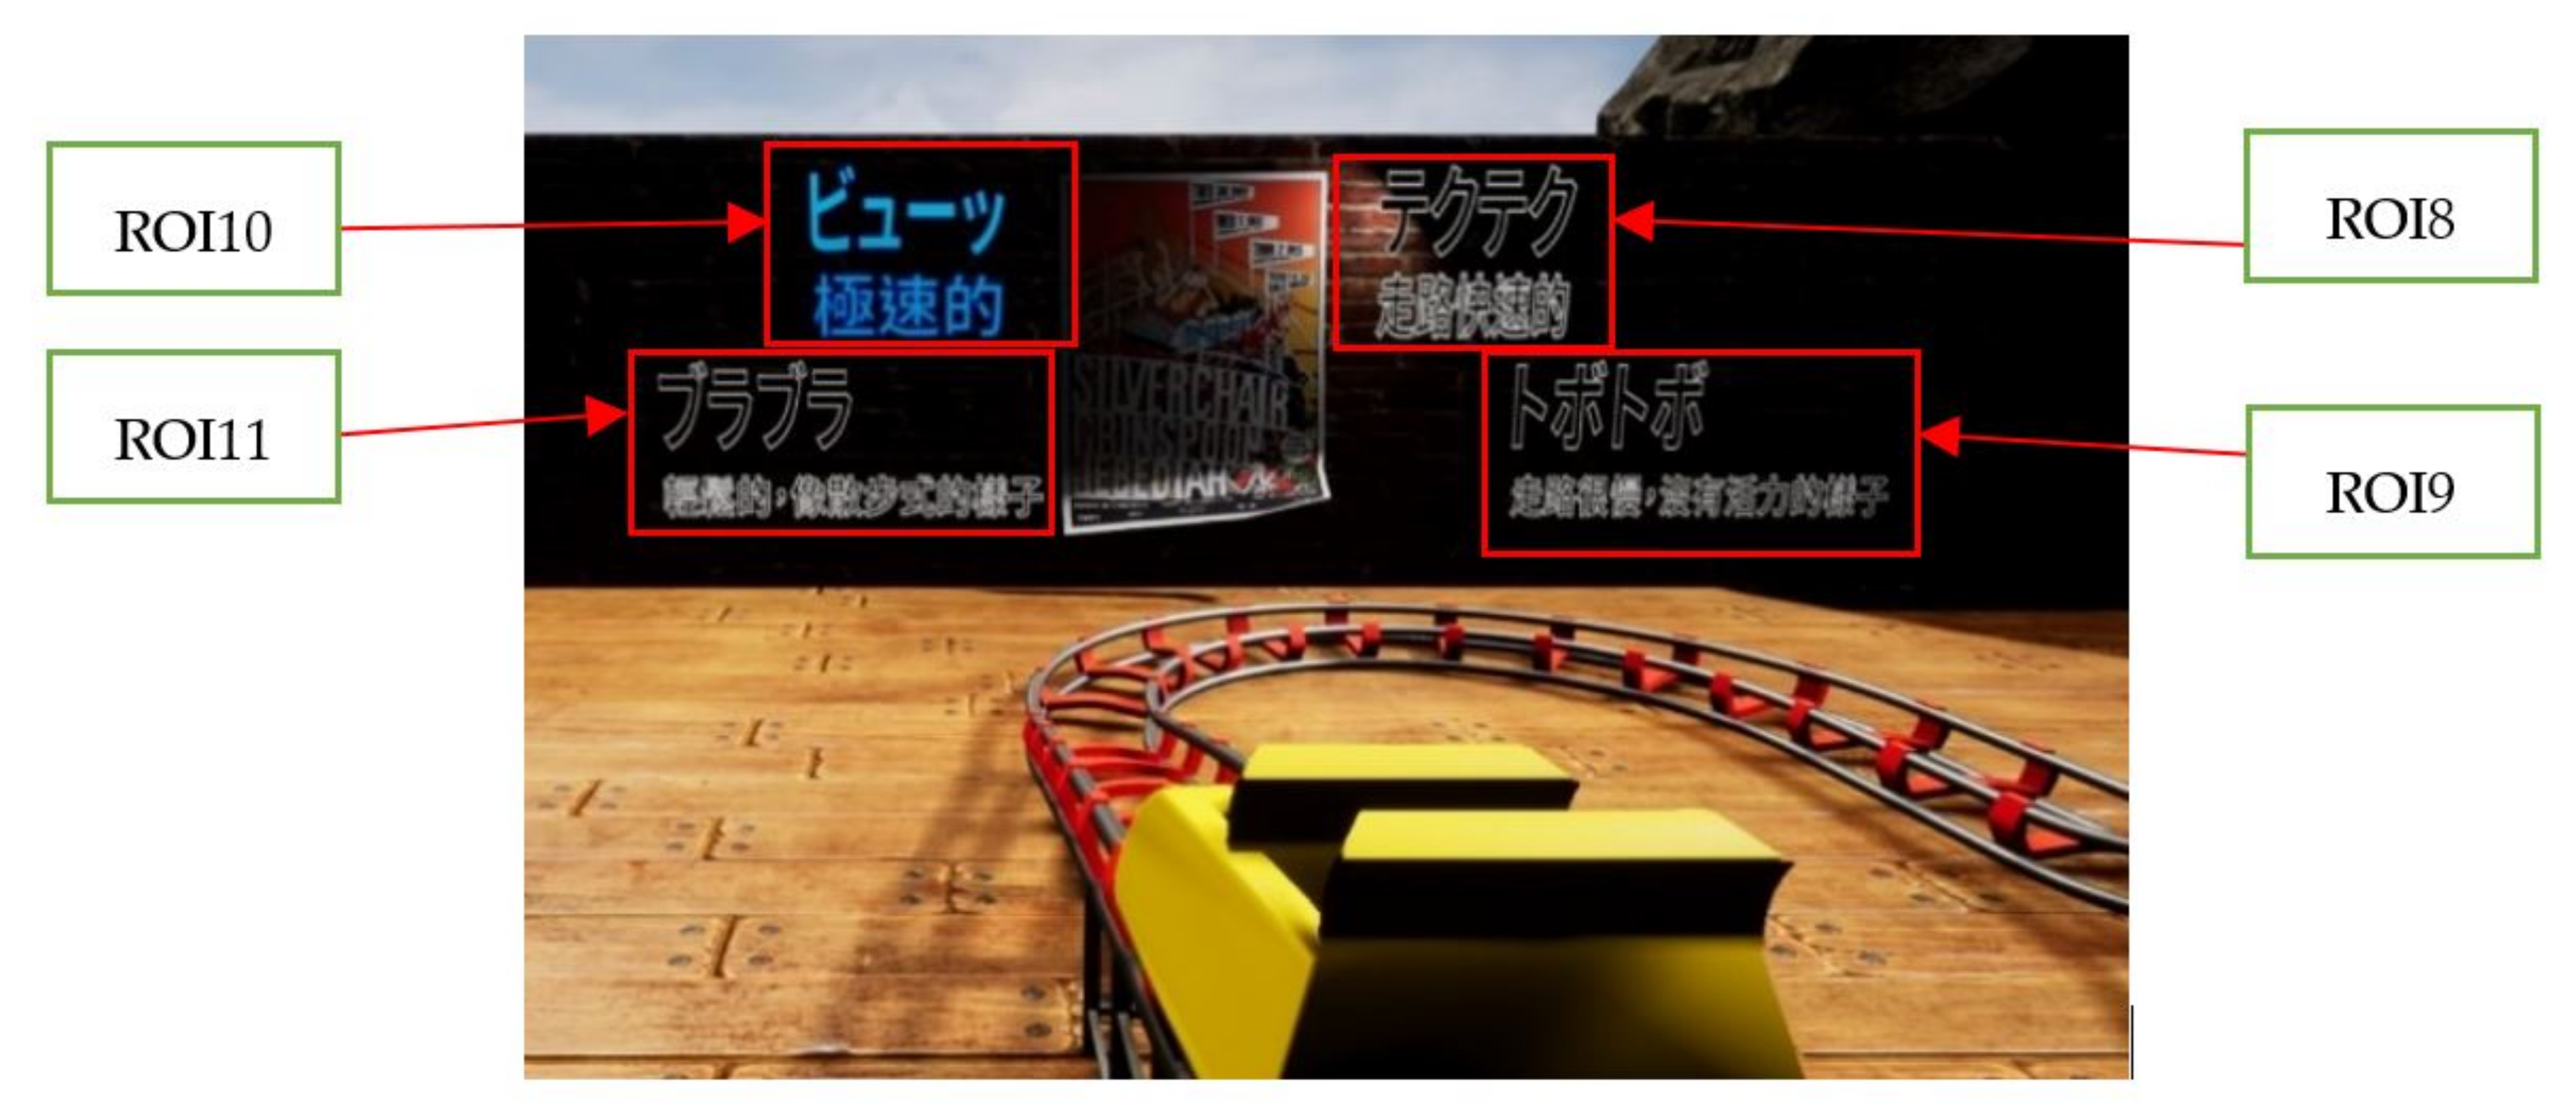
22], which allows researchers to record individual fixation, saccade, and blink events in real time. The first two, i.e., fixation and saccade events, are the two most used parameters in the field of image cognition in a region of interest (ROI), i.e., an area of an object labeled based on a particular purpose and often defined according to research questions.
In relevant research, “fixation” is usually defined as visual attention in a ROI which lasts for 200–300 milliseconds (ms) or longer; on the other hand, “saccade” is defined as rapid movements between fixations that help the eyes land on a specific visual target. During such eye movement, although some peripheral information can be obtained, information processing is constrained [20]. Moreover, the reading process includes a series of saccades and fixations, and the sequence is called a scan path [23,24]. Through eye tracking analysis, it is possible to explore the spots and trajectory of visual attention when a learner is focusing on a certain task, which can serve as supplementary evidence for scientific research.
From the two basic eye movement behaviors, i.e., fixation and saccade, a number of commonly used eye movement indicators are applied in empirical research to analyze the reading of scientific graphs and texts. These indicators include total fixation duration, fixation count, number of saccades, sequence of fixation, ratio of total fixation, times of regression in a text zone, and saccade amplitude [14]. Till now, few studies have accurately discussed the use of eye tracking technology to acquire and process visual attention when learners are watching or reading onomatopoeia-related materials. In addition, in terms of experiment materials, most eye tracking research (e.g., [25,26,27,28]) focuses on reading materials in Chinese or English, with few studies using Japanese texts as the reading material.
What is more, results of recent studies related to learning have consistently illustrated that fixation duration is affected by both signal cues and prior knowledge. With the increase in prior knowledge, participants tend to have more and faster fixation regarding task-related information [29,30,31,32]. Moreover, ref. [33] proposed that eye tracking technology provides a unique opportunity to understand learners’ perceptual processing in learning and helps to examine the influence of specific teaching methods on learning, which can serve as a reference for teaching material design.
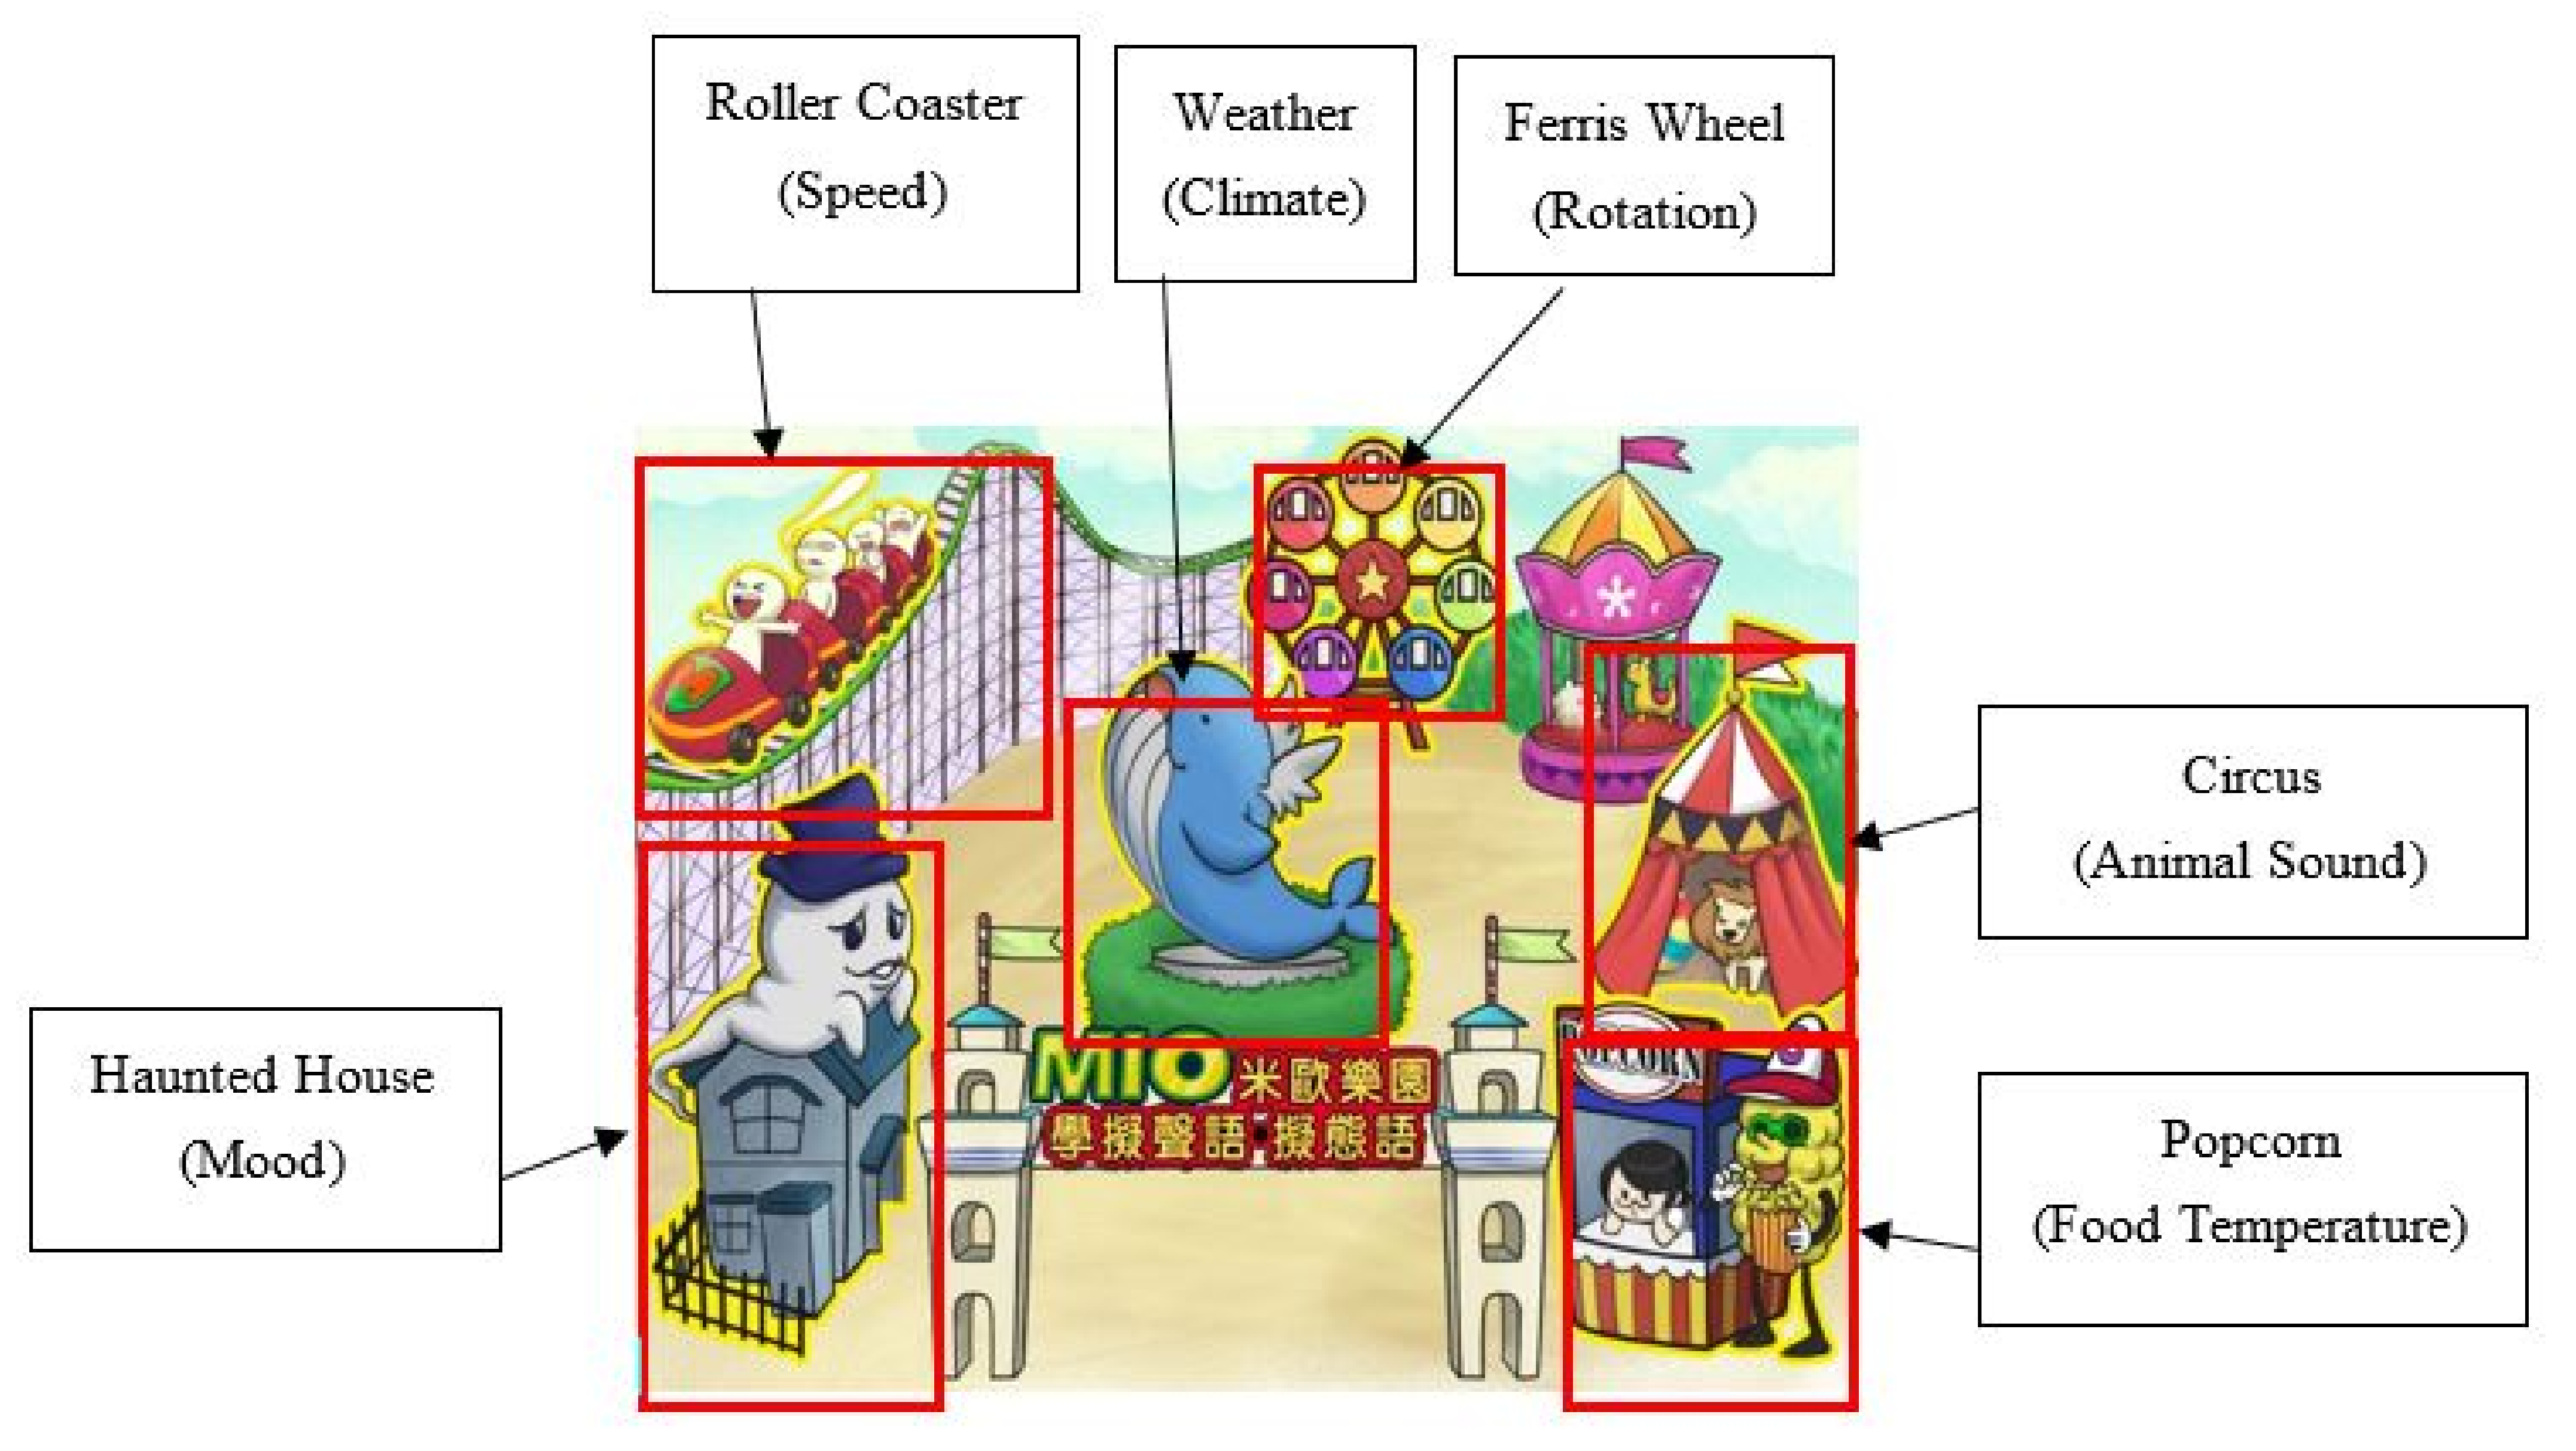
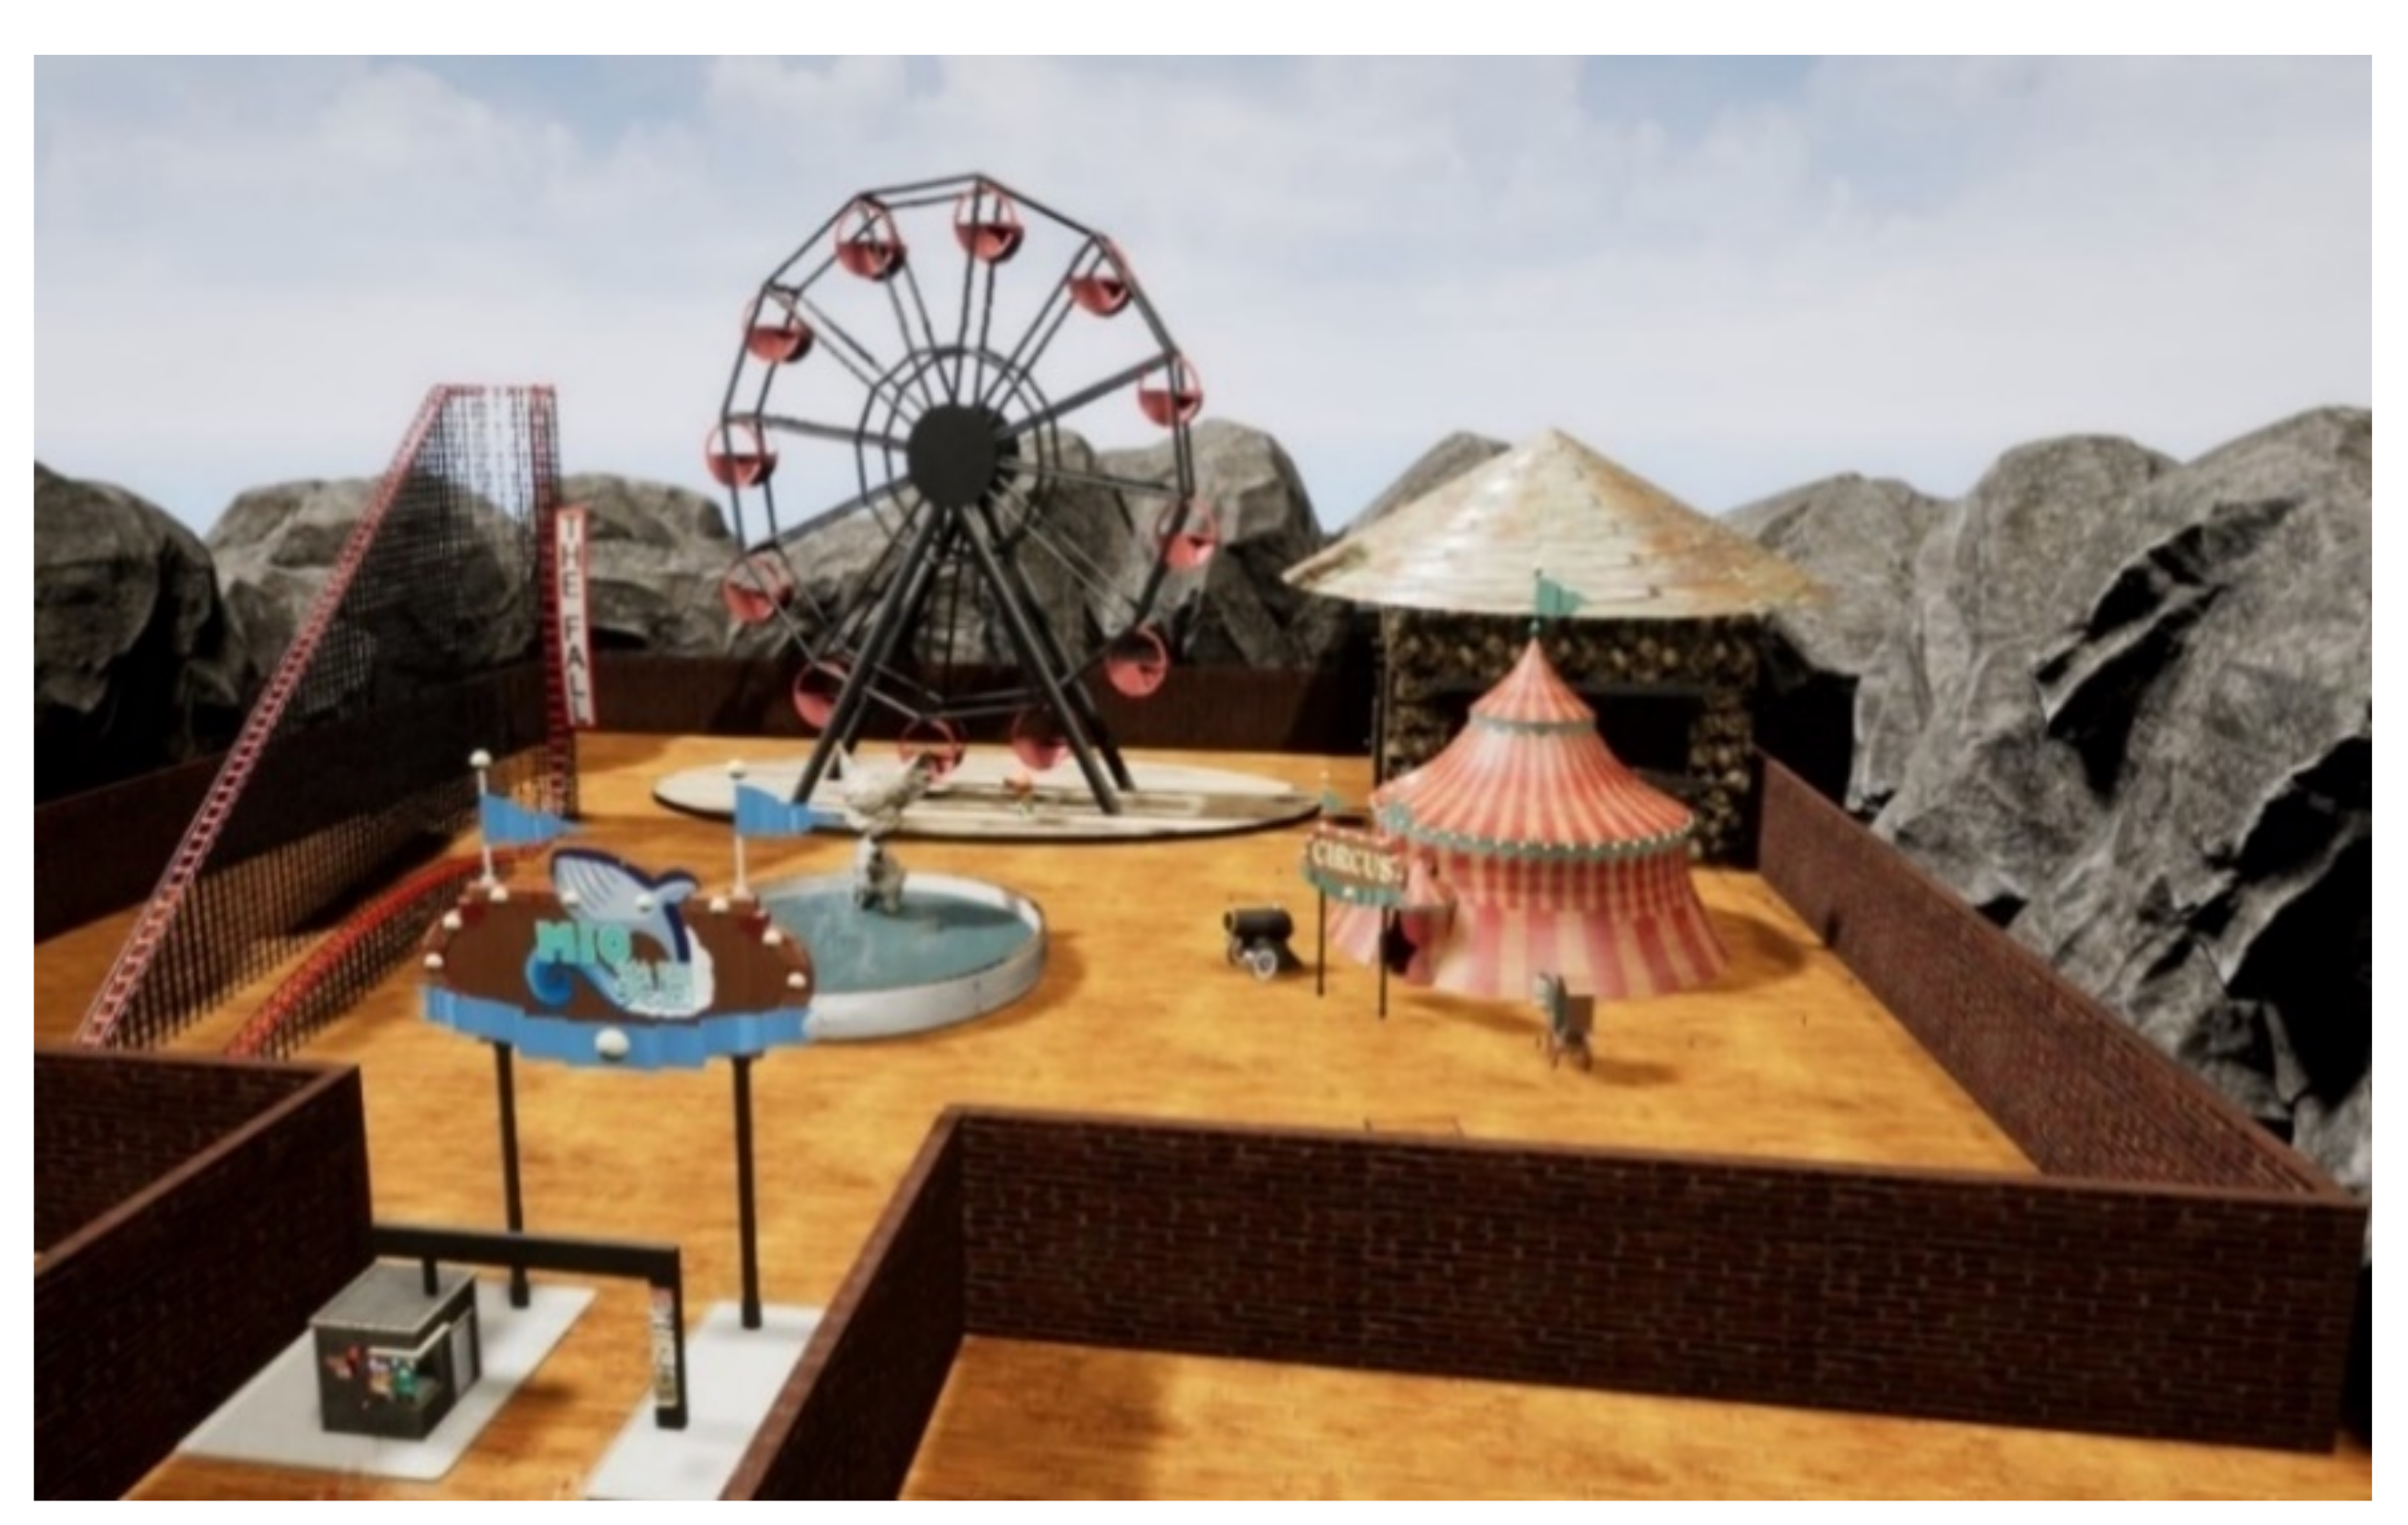
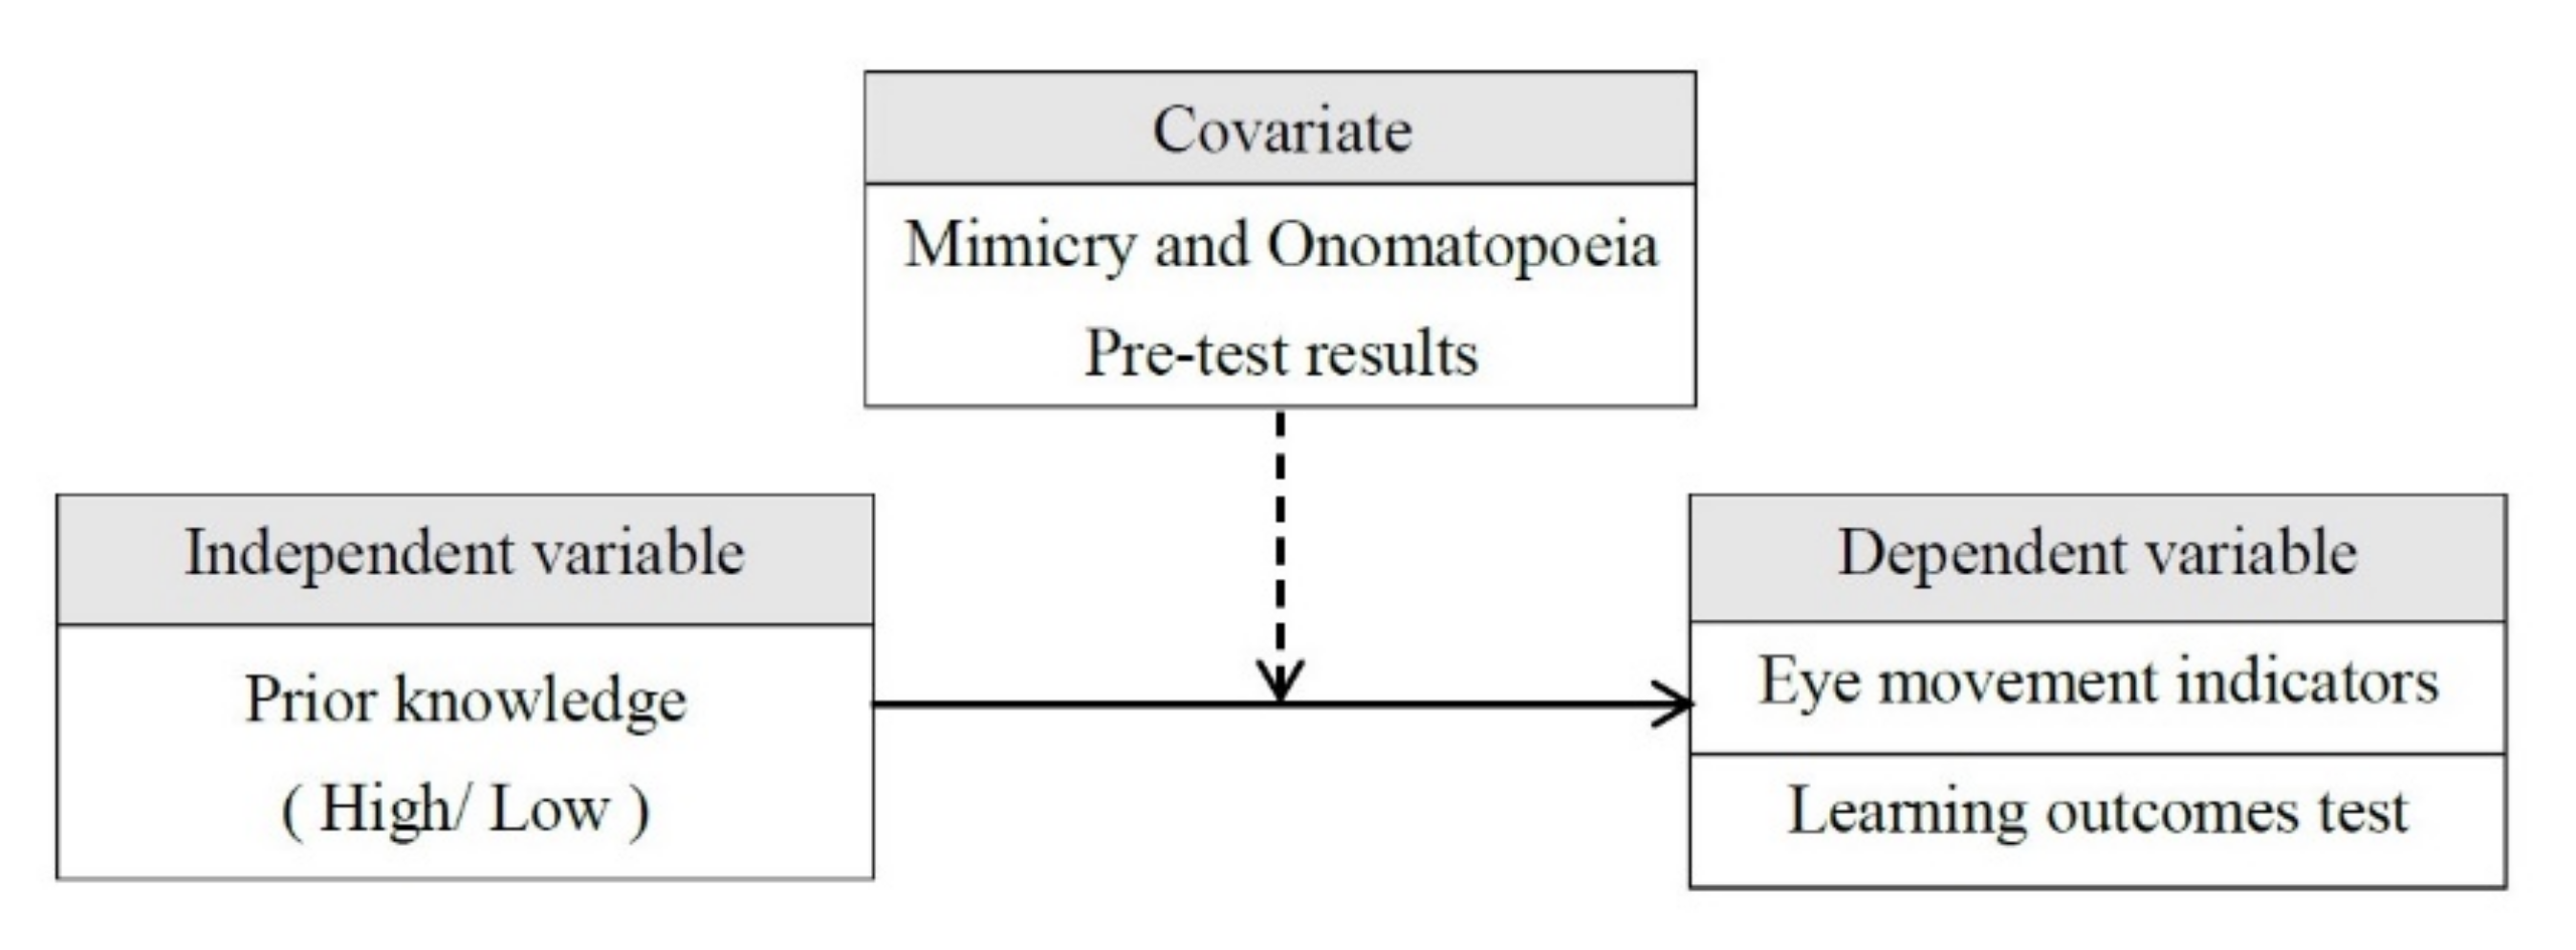
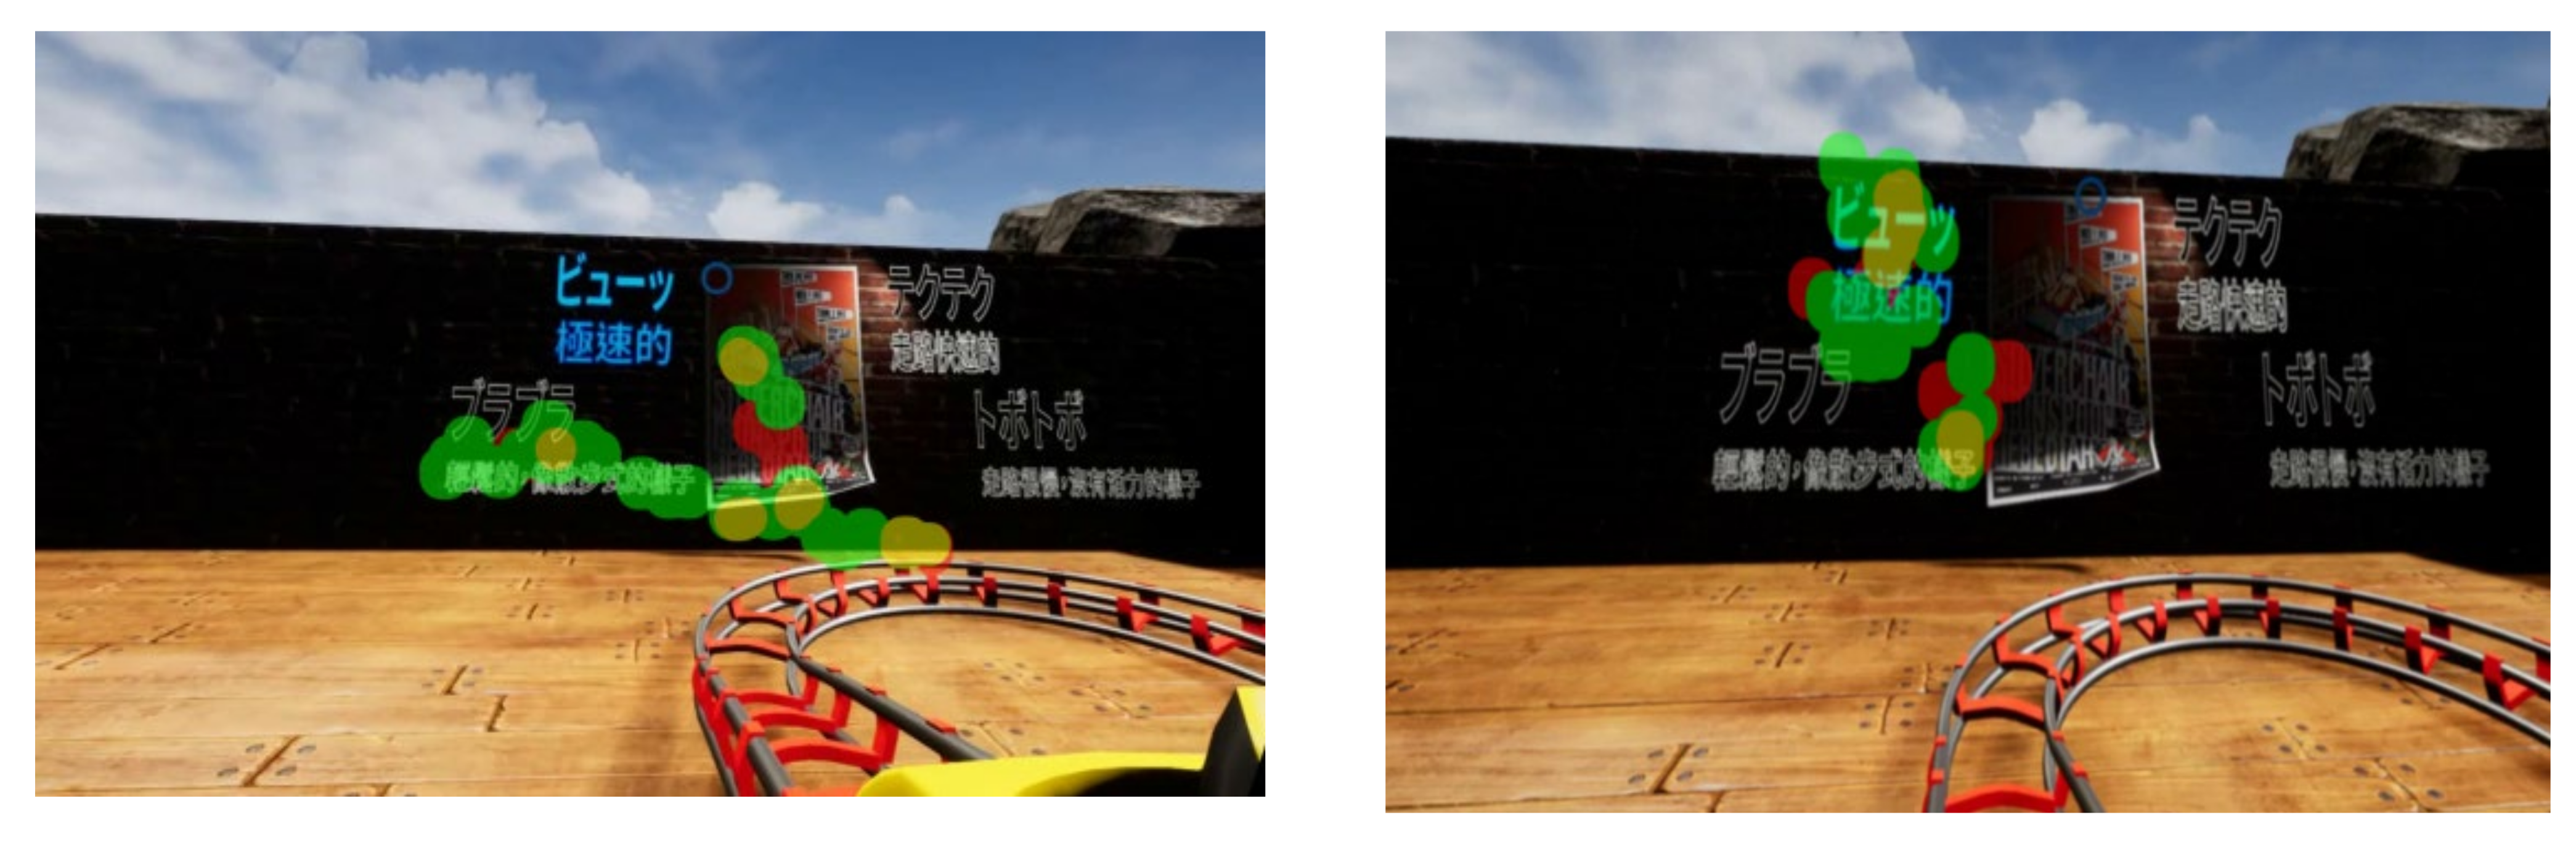
To bridge this gap, the present study aims to explore the eye movements and learning outcome of students with different levels of prior knowledge when they try to understand Japanese onomatopoeia, using eye tracker with contextual teaching content of onomatopoeia enabled by VR. When each participant entered the virtual environment for onomatopoeia learning experience, their eye movements were observed, tracked, and recorded. By analyzing the total fixation durations, total fixation count, total viewing duration, and number of saccades, the study seeks to evaluate whether visual attention distribution differs in the ROIs, and to further compare the differences, if any, in the learning outcomes in a VR setting. The results can serve as reference for teaching strategies and the design of teaching materials, so that Japanese onomatopoeia teaching can be improved, and the practical value of attention-related research in a VR setting can be better demonstrated.

2. Related Work

Since 2016, with the concerted efforts of eye tracking technology companies from different countries, eye tracking technology in VR has gained much importance, but as of now, there are few application cases where eye tracking technology can be successfully equipped on VR devices. Based on the fact that the two technologies are not yet perfectly integrated into a practical application model, the present study aims to lay the foundation for eye tracking technology to become an “indispensable part” of VR technology in the future, by focusing on the application of VR in education, eye tracking technology and visual attention, eye tracking technology and multimedia learning, and eye tracking technology research related to prior knowledge, and also by conducting literature review of related work.

2.1. VR Application in Education

VR offers many unique benefits when used in education. The VR applications allow learners to immerse themselves in the learning environment and make full use of the simulated and interactive experience of VR, so as to increase interaction between learners and materials and provide learners with an immersive experience, while also breaking the constraints of space and time and making it possible for learners to practice repeatedly. As VR has matured as a novel technology, the use of VR has made an important application to education in that learners are allowed to experience situations or environments that are hard to replicate by using traditional learning materials, such as lectures, PowerPoint slideshows, or videos. For example, ref. [34] used VR technology to provide students with repetitive exercises that increase the efficiency and effectiveness of learning in knowledge acquisition, skills, and verification without increasing costs due to the use of additional consumables and availability of devices while providing a safe learning environment [35]. Ref. [36] used immersive VR with a head-mounted-display (HMD) for environmental education to expose students to an underwater environment to facilitate learning of climate change. Considering that VR can simulate the spatial relationship of human body structure, ref. [37] used VR technology to build an interactive and immersive online virtual human anatomy teaching system to improve the teaching of the structure (anatomy) of human body. Ref. [38] applied VR technology to build a teaching system called Anatomic VisualizeR to assist the teaching of clinical anatomy. Ref. [39] also designed a web-based virtual system of human body structure to help teach human anatomy. In [40], the study used immersive VR games to develop players’ spatial awareness skills and construct their ability of spatial reasoning since spatial awareness skills are considered very important in designing urban mobility. Ref. [41] pointed out that teachers use VR technology in the classroom to capture students’ interest, increase students’ creativity, allow students to take virtual trips, increase students’ motivation, improve students’ technology literacy, individualized learning, and make students easier to understand difficult concepts when students participated in STEM (Science, Technology, Engineering, and Mathematics). Recently, ref. [42] presented a new approach to the use of VR in the educational process for the needs of Industry 4.0. The study emphasized on the potential of VR to create dedicated, specialized virtual environments and resulted in a unified and comprehensive approach to designing, implementing, and developing training focused on the needs of individual industries based on the VR environment. Moreover, ref. [43] used the idea of VR to structure the learning process concerning the transformation from the traditional teaching factory to teaching Industry 4.0. Ref. [44] proposed a methodological approach to the use of VR in education and the evaluation of designer’s creativity for the deployment of an industrial design engineering course. Within medical education, experimental results showed that immersion, interaction, and imagination features of VR-mediated course contents have a positive impact on perceived usefulness and perceived ease of use, both of which contributors to behavioral intention to use VR learning [45].

2.2. Eye Tracking Technology and Visual Attention

Concentration of attention is the first step in learning. In a learning environment enabled by computer-assisted teaching and multimedia, it is necessary to help learners focus and retain attention, so that they can actively integrate and absorb knowledge, and successfully perform the expected interaction as in the teaching plan. Selection attention is the mental ability to select a fraction of all the stimuli present in our surroundings. Ref. [46] stated that individuals have capacity to perform specific selections and noted that information processing begins with input and ends with outputs. In [47], it is mentioned that attention can be categorized into focused attention and sustained attention. During the learning process, learners must first manage to focus on the topic, and then sustain such focus for a period of time, so that they can achieve the goal of effective learning. According to [48], human behaviors, including learning, are made possible as we pay attention to the deciding characteristics of the stimuli in the environment. Then, humans further retain the information and adopt cognitive strategies so as to enable activities such as learning, memorization, and thinking. The information received by the senses can only be further processed and memorized when it is noticed. In other words, without attention, there would be no recognition, learning, or memory.
In recent years, many science education researchers have paid attention to information processing theory. Information processing theory began to gain importance around the 1950s. At that time, with the advancement of computer processing technology, psychologists believed that the mechanism of human psychology was similar to that of computers, i.e., the structure and process of human psychology could be understood by studying the processing of computer information. This trend has led many scholars to explore the relationship between perceptual information processing theory and cognitive process. They believed that eye tracking technology is the most direct and effective way to study visual information processing, which can help observe the reading patterns and visual attention of learners and can also help teachers diagnose learning disabilities if any [25,26,27,28]. Visual reception is usually the sensory channel for humans to receive information. The information received through visual attention can be observed by recording eye movements, as there is a close connection between attention and eye movement. Ref. [49] proposed “eye-mind assumption” which suggests that eye movements provide a dynamic trace of where attention is being processed. After the eyes receive the stimulus, the information is transmitted to the brain, and then goes through further cognitive processing, such as the stages of memory and comprehension. The theoretical basis with eye tracking technology to explore information and visual reception is that visual trajectories can reflect the transfer process of one’s internal attention. Therefore, monitoring eye movement is equivalent to monitoring real-time cognitive process and attention, which can help explore effective modes of information presentation.
Eye movements that are often observed and measured via eye tracking technology are fixations and saccades. Composed of a series of fixations and saccades, scan path is a conscious eye movement related to the shift of attention, higher-level memory, and the cognitive process of comprehension [20]. In [25], eye tracking technology and electroencephalograph (EEG) were combined to explore the relationship between reading comprehension and visual attention when students read misplaced words in Chinese sentences. The results showed that the misplaced words did not affect reading comprehension and increasing the number of misplaced words in a sentence did not prolong their fixation duration. In other words, most participants did not spend too much time fixating on the regions with misplaced words. Moreover, in [27,50], empirical analysis was conducted with eye tracking technology to explore how learners could be influenced when exposed to graphics designed to teach Spanish words related to the state of being high and low in the e-book, in order to explore how graphic design might affect learners’ visual behavior and learning outcome. In [28], eye tracking technology was adopted to collect and analyze eye movement data when participants used e-books to learn English words in order to explore the correlation between the students’ cognitive load and visual behavior and their learning outcomes. Moreover, ref. [51] proved that eye tracking technology is an effective research tool in information processing. In addition, eye tracking technology is very practical for verifying the knowledge acquisition and processing sequence of second foreign language learners when they process ambiguous information input. For example, ref. [52] used eye tracking technology to examine the difference in the sequence and cognitive breadth of native Japanese speakers when they were seeing and reading texts in their native language (L1) and second language (L2). The research results showed that for L2 readers, reading is preferred to seeing; when reading the target words in a sentence, there is a difference in the effectiveness of parafovea processing between L1 and L2 readers. Ref. [53] used eye tracker to observe the effect of a guiding cursor on the attention and learning outcome for learners while they were watching digital course images. Through different digital course interfaces, the study explored the subjects’ spots of fixation and eye movements during the reading process. Their results showed that the use of a moving cursor in digital courses has a significant influence on the attention distribution of learners and affects the average saccade amplitude of learners when they watch the digital course. In addition, ref. [54] used eye tracking technology to explore the design and development of digital teaching games and found that through the visual attention analysis of learning process, learners’ learning outcomes and concentration level in game-based learning can be evaluated, and that incorporating clear goals into teaching games can effectively catch the attention of learners.

2.3. Eye Tracking Technology and Multimedia Learning

In recent years, eye tracking technology has been frequently used in research on multimedia learning, mainly because eye tracking technology provides insight into the allocation of visual attention, which is adequate for exploring the differences in attention process when participants are exposed to different types of multimedia and multi-layer graphic learning materials [33,55]. Ref. [33] noted in the special issue of Learning and Instruction, entitled “Eye tracking as a tool to study and enhance multimedia learning”, that eye movement data can provide researchers with an insight into a learner’s knowledge processing when he or she is learning. When eye tracking is used as a teaching tool, researchers can understand what teaching materials in what section are making a difference, when they are making a difference, and how long they have been making a difference. Furthermore, researchers can better understand how teaching materials work, in order to depict a more detailed internal process when subjects are reading graphics. Hence, eye movement data can offer a more detailed and objective set of data to help explain the reading process of multimedia materials. Through eye movement data, researchers can understand how learners deal with specific multimedia information, which can further improve and reinforce multimedia content design [32]. In fact, as early as in the early 1980s, ref. [56] started to use eye tracking technology to explore subjects’ visual attention allocation at different stages, further discovering how information is processed in the process of learning. In recent years, the development of eye tracking equipment has become more mature and easier to operate with lower prices. The data collection and analysis software is easy to operate, which enables researchers in the field of education to actively incorporate eye tracking technology into their research. Therefore, introduced into multimedia learning research, eye tracking technology provides a unique opportunity to help understand the perceptual processing of learners in the learning process of multimedia teaching materials. Properly utilizing eye tracking technology will help understand how specific teaching materials or teaching methods affect the process of cognitive information processing, and it will also help identify important factors for effective reading. For example, in [57], learners watched animations of the complicated blood circulation system through eye trackers and were guided as different key areas were highlighted. The results were further divided into the unit of interest duration for analysis, in order to narrow the space for visual search and reduce the subjects’ cognitive load. By the same token, ref. [32] pointed out that in multimedia learning research, it is of great importance to examine how learners learn and think through graphics, and how to help learners learn and think through graphics. Ref. [58] used eye tracking technology to explore the distribution of learners’ attention in the learning process of multimedia learning materials and the cognitive processing of multimedia information. This research found that the text of the multimedia teaching materials seemed to attract learners more. According to the multimedia learning theory, ref. [59] used eye tracking technology to examine the effects of redundancy, modality, and contiguity in the pedagogy design principles of multimedia teaching materials. Ref. [60] proposed a dynamic analysis system for advertising videos based on eye tracking technology, integrating the three functions of “eye tracking”, “dynamic ROI module”, and “video analysis” to provide advertisers with objective analysis results to select the optimal advertising proposal. However, the analysis system does not support automatic detection of integrated objects of dynamic and static multimedia yet, and manual operation is required to define the ROI. Thus, researchers may need to explore more possibilities on how the system can effectively assist researchers with various needs for eye movement research in the future, and how it can further boost the efficiency of eye tracking data analysis.

2.4. Eye Tracking Technology and Prior Knowledge

Cognitive psychologists have long discovered that prior knowledge is an important factor which affects reading comprehension [61,62,63]. Ref. [64] pointed out that prior knowledge is a well-structured and consistent knowledge base that can facilitate individuals’ learning behaviors such as reasoning, conceptualization, and knowledge acquisition. Prior knowledge also contains relevant knowledge which may cause reading comprehension to be either easy or laborious when readers try to understand a relevant text. Humans can recognize speech and text mainly because the human brain has a mental dictionary. When external stimuli such as symbols or language reach a certain part of the mental dictionary, it triggers word recognition. If the reader has no prior knowledge of certain vocabulary which does not exist in the mental lexicon, how does the reader tell the meaning of an unfamiliar word? At present, many studies have confirmed that prior knowledge affects the degree of reading comprehension. It is found that readers with high prior knowledge can retrieve more information from the text, as well as better organize and construct its main points, than readers with low prior knowledge. This allows high prior knowledge readers to perform better in terms of reading comprehension. For example, ref. [61] argued that if readers have richer prior knowledge, they are able to generate inferences on their own initiative without having to rely on the information provided in the text for comprehension. Especially, when reading more difficult or less clearly interpreted texts, readers must utilize their prior knowledge to achieve reading comprehension [63]. In other words, when reading texts with low continuity, high prior knowledge readers can use prior knowledge to link the concepts, integrate information, and achieve better learning and reading comprehension; on the other hand, low prior knowledge readers cannot tap into their prior knowledge and must rely on the abundant information provided in the text to achieve reading comprehension [61,63,65].
In addition, prior knowledge also affects the distribution of attention. Individuals with higher prior knowledge tend to have faster and more fixations on task-related information [29,30,32]. For instance, ref. [30] employed eye tracking technology and eye movement indicators to examine how students with different levels of prior knowledge process text and data diagrams when reading a web-based scientific report in terms of attention distribution. The results show that high prior knowledge students showed longer fixation durations and more regressions on the graphics. Meanwhile, high prior knowledge students showed more inter-scanning transitions not only between the text and graphics, but also between the two data diagrams. Ref. [66] used eye tracking technology to investigate how high school students with different levels of prior knowledge viewed and interpreted graphics on cellular transport. The results show that high prior knowledge students transitioned more frequently between representations of molecular cellular transport, whereas students with low prior knowledge transitioned more frequently between representations of macroscopic cellular transport and between macroscopic and molecular representations. What is more, students with high prior knowledge were more likely to attend to the thematically relevant content in the graphics; in contrast, students with a low level of prior knowledge focused on surface features of the graphics to understand the represented concepts. Overall, low prior knowledge students experienced difficulties in understanding the graphics, as they tended to apply superficial processing strategies and had difficulties understanding the basic concepts. Ref. [31] used eye movement data to explore the behavior of learners with different levels of prior knowledge. When watching videos of fish swimming, high prior knowledge students would spend more time watching relevant areas of the diagram and would pay more attention to the concept-related areas. In [29], as participants were asked to watch climate maps, those with high prior knowledge spent a longer time viewing relevant areas and achieved better results in a following test after receiving brief instruction. Similarly, ref. [67] used the fixation information acquired by eye tracking technology to perform sequence analysis and identify the correlation among the ROIs. The data then helped to reconstruct the subjects’ cognitive process when they were performing the tasks of program understanding and debugging. The results indicated that those who achieved a low score may have less working memory, resulting in frequent calculation and note-taking behaviors, and lower mastery of programming knowledge. In contrast, those who achieved a high score have more logic in their approach of understanding/debugging, with richer prior programming knowledge at their disposal.

2.5. Research Questions

This study aimed to examine participants’ visual attention while interpreting Japanese MIO words using a VR eye tracking. Specifically, this study explored how both of high and low prior knowledge students viewed the gaze sequence of participants and relative order of the capacity of the 24 ROIs (i.e., LFF and DFF) and the relative order of the amount of visual attention paid to the 24 ROIs (i.e., TFD and FC). In addition, statistical analysis method was performed to test whether learning outcomes of Japanese MIO words differed significantly between participants with different prior knowledge in both groups. According to the literature reviews mentioned above, the present study proposed the following research questions based on the VR technology, eye tracking technology, and the role of prior knowledge. By examining participants’ visual attention of Japanese onomatopoeia learning, five research questions were examined:
  • What is the difference in the fixation sequence among different ROIs when participants with different levels of prior knowledge are viewing the VR content of onomatopoeia?
  • What is the difference in terms of the visual attention in different ROIs, when participants with different levels of prior knowledge are viewing the contextual VR content of onomatopoeia, i.e., is there a difference in terms of total fixation duration and total fixation count?
  • Are the learning outcomes of onomatopoeia related to the total fixation duration and the total fixation count in different ROIs?
  • Are the learning outcomes of onomatopoeia related to the number of visual attention transitions between different ROIs?
  • Is the introduction of contextual VR content in the course materials conducive to the participants’ learning outcomes for Japanese onomatopoeia?

2.6. Research Hypotheses

To answer the five proposed research questions, an exploratory study with VR eye tracking technology was applied to observe participants’ eye movements and explore the differences on the visual behaviors of the participants with different levels of prior knowledge on Japanese competence while learning Japanese MIO words, four eye-movement measures were used, including latency of first fixation (LFF), duration of first fixation (DFF), total fixation durations (TFD), and fixation counts (FC). These eye movement measures represent cognitive activities related to comprehension and movement of attention. First, LFF shows the type of ROI that attracts the visual attention of each participant. Second, DFF shows the capacities of all the types of ROI to hold the attention of each participant. The amount of attention paid to each type of ROI is expressed in TFD and FC. Besides, one-way ANOVA analyses of LFF, DFF, TFD, and FC were conducted to find the correlation of all types of ROI in the four variables. The one-way ANOVA along with the homogeneity tests was performed to find differences in eye movements between the different prior knowledge groups. The t-tests showed the cognitive achievement concerning learning Japanese MIO words based on participants’ prior knowledge. Since the sample size of this study was small and not normally distributed, the Wilcoxon rank signed test was used to examine the learning outcomes of the participants by pre-test and post-test scores in each group. Therefore, five research hypotheses were proposed as follows:
Hypothesis 1 (H1).
For participants with different levels of prior knowledge, their fixation sequence of ROIs will be different when they browse the VR content of onomatopoeia teaching.
Hypothesis 2 (H2).
For participants with different levels of prior knowledge, when they browse the VR content of onomatopoeia teaching, they exhibit differences in visual attention in the ROIs, in terms of total fixation duration and total fixation count.
Hypothesis 3 (H3).
The learning outcomes of onomatopoeia is related to the total fixation duration and the total fixation count in different ROIs.
Hypothesis 4 (H4).
The learning outcome of onomatopoeia is related to the number of visual attention transitions between different ROIs.
Hypothesis 5 (H5).
The introduction of contextual VR content in the course materials is conducive, and the difference in test scores in the pre-test and post-test (devised to test the participants’ learning outcomes) has statistical significance.

3. Methods

In this study, an analysis software powered by virtual reality (VR) eye tracking technology was utilized to understand whether participants with different levels of prior knowledge exhibit significant difference in term of visual attention. The software is integrated into the “HTC VIVE Pro Eye” Head-Mounted Display (HMD), which is used to collect and record quantitative data of participants’ eye movements when they were viewing the contextual teaching content of Japanese onomatopoeia based on the eye gaze data recorded by eye tracking technology under the VR immersion experience. In addition, pre-test and post-test were employed to explore the learning outcomes of high- and low-prior knowledge participants based on the scores they had received in the two tests. The methodology, procedure, and execution progress of the present study were addressed as follows:

3.1. Participants

The present study used VR eye tracker to record and analyze the eye movements of learners with different levels of prior knowledge when they watched contextual VR teaching content of onomatopoeia, whereby to explore the differences in their visual attention distribution and learning outcomes. The participants were 20 students in the third and fourth years of study at the Department of Japanese of a university in Taiwan, with an average age of 20.6 years (SD = 3.3 years, range 20–22 years). All participants were healthy with normal or contact lens corrected-to-normal vision. Regardless of gender, the 20 participants were grouped, according to their Japanese language proficiency test (JLPT) certification, into high prior knowledge group (levels N1-N3) (7 participants) and low prior knowledge group (level N4 or below) (13 participants). The experiment was performed in accordance with the guidelines of ethics approval obtained from Human Research Ethics Committee of National Cheng Kung University, Taiwan (No. NCKU HREC-E-108-234-2). Before the experiment, written informed consent was obtained from all participants. They were allowed to stop the experiment whenever they wanted to. No participants were excluded owing to the malfunction of eye tracking recording or a severe level of cybersickness in this study. Thus, this kept us with 20 valid samples.

3.2. Materials

The experiment materials used in this study is a VR facility theme park named “MIO Land”, which was designed by Unreal Engine 4 (UE4) development tool. In this 3D VR MIO Land theme park, there are six main mimicry and onomatopoeia themes (in different contextual scenes), including climate (weather change), speed (roller coaster), mood (haunted house), rotation (Ferris wheel), animal sounds (circus), and food temperature (popcorn booth). After entering the MIO Land via the VR eye tracker, participants can watch the 360-degree VR scenes, use the handheld controller to operate and select facilities, begin to interact with the facilities, and then learn the onomatopoeia words corresponding to the facility. The VR concept design of MIO Land is shown in Figure 1, and the completed version is shown in Figure 2. Each of the six amusement rides in MIO Land was designed using the UE4 game engine software, and each ride has a corresponding topic of onomatopoeia in Japanese. The contextual representation onomatopoeia is thus created for the participants to be immersed in the VR environment, so as to achieve the best learning effectiveness. For example, in the scene of the roller coaster facility, if the participant interacts with the scene, the facility will be activated immediately (see Figure 3). During the ride, the participant will see onomatopoeia words generated from the facility context through the VR scene displayed by the system, so as to help the participant test their mastery of the content, deepen the impression, and evaluate their cognitive understanding (see Figure 4).

3.3. Design

The experiment design of this study focuses on learning attention and learning outcomes based on the factor of prior knowledge. Through the introduction and application of VR eye tracking technology, data were collected as participants with different levels of prior knowledge watched three-dimensional contextual teaching content of onomatopoeia enabled by VR, in order to explore the participants’ attention distribution and learning outcomes. To this end, the 20 participants in the present study were divided into two groups (i.e., high prior knowledge group and low prior knowledge group) according to their JLPT (Japanese language proficiency test) results, and eye tracker was used to record the subjects’ eye movement trajectories. Then, the eye movement data collected by the eye tracker were analyzed to compare whether participants with different levels of prior knowledge exhibit significant differences in the distribution of visual attention. Before the experiment, the two groups of participants both received a pre-test on the topic of onomatopoeia. The pre-test results were used to evaluate the participants’ cognitive understanding of onomatopoeia before viewing the VR teaching content and served as the covariate variable. After the VR experiment, the two groups of participants took a post-test to evaluate the effectiveness of the VR onomatopoeia teaching. The post-test results served as the basis for the evaluation of the participants’ learning outcome. The relationship between each variable in the experiment design is shown in the structure diagram in Figure 5.

3.4. Instruments

This study used HTC VIVE Pro Eye for eye tracking while displaying the VR content. The HMD of HTC VIVE Pro Eye has two AMOLED screens, with a resolution of 2880 × 1600 pixels in total, with a refresh rate of 90 Hz and a field of view of 110°. We integrated an EyeNTNU-120p analysis software to collect the eye movement data with a sampling rate of 120 Hz and the accuracy of 0.5° to the VR HMD, and then adjusted the camera module for capturing pupil movements to serve as a VR eye tracker eye tracker (see Figure 6 and Figure 7). This VR eye tracker’s connection device supports the Windows 10 operating system. The operation procedure of this VR eye tracker with modified eye tracking software is shown in Figure 8. The VR eye tracker uses a miniature microscope lens to record the position of the eyeballs and measures the eye movement and the degree of pupil dilation. Then, the VR eye tracker uses the pupil movement and iris reflection to calculate the eye movement. Before the eye tracker starts to collect eye movement data from the participant, it needs to go through a calibration sequence with the assistance of the operator. A snapshot photo of a participant wearing the VR eye tracker during the actual experiment is shown in Figure 9.
The present study first referred to onomatopoeia teaching materials by various publishers, and then identified the two items of evaluation, i.e., “process” and “cognition”, to determine the participants’ learning outcomes. Then, the post-test questions were compiled by a professional teacher of the Japanese language. To ensure the content validity of the test, a native Japanese teacher of the Japanese language was recruited to review the questions. After the review, two students who had passed the JLPT (level N2 or above) were recruited to review whether they could understand the questions, to ensure that all participants would be able to understand the questions and to establish face validity. In this way, the questions can test the participants with different levels of prior knowledge and evaluate whether there is a significant difference in learning outcomes.

3.5. Procedure

3.5.1. Experimental Process

Before the experiment, participants were required to conduct their pre-tests on the topic of onomatopoeia in a classroom. The pre-test results were used to evaluate the participants’ cognitive understanding of onomatopoeia before viewing the VR content and served as the covariate variable. Each participant firstly went through a five-point calibration process for the VR eye tracker to capture the correct viewing position in a separate research laboratory. The experimenter had assisted the participant to correctly put on the VR eye tracker, the participants would receive a series of instruction for calibration, with their head moving as little as possible. When the calibration is in progress, both eyes of the participant are making saccadic movements, and will move quickly in the same direction and amplitude. In order for the eyes to focus on the stimulus, the fovea will be aligned at the same position. However, sometimes there will be inconsistent alignments, especially during the initial fixations. In the absence of binocular coordination, saccades will cause different fixations and affect the visual process of reading. In the case of such a large difference in disconjugacy (change of disparity), a second sequence of binocular calibration must be run [24]. The VR eye tracker calculated the coordinates on the screen corresponding to the saccade of the eyes based on the calibration results. Once calibration process was completed, the formal experiment was immediately conducted. During the experiment, only one participant was allowed to the separate room except where unavoidable. Through the completion of the calibration, participants entered a 3D VR MIO Land theme park created by Unreal Engine 4 (UE4) (i.e., learning material), including five main amusement parks and a climate situation for mimicry and onomatopoeia themes (in different contextual scenes), that is, climate (weather change), speed (roller coaster), mood (haunted house), rotation (Ferris wheel), animal sounds (circus), and food temperature (popcorn booth). Participants can watch the 360-degree VR scenes freely, use the handheld controller to operate and select facilities at their own pace, start to interact with the facilities, and then learn the onomatopoeia words corresponding to the facility. The total duration of the VR experience was about 15 min (3 min per amusement park). After the VR experiment, every participant immediately took a post-test to evaluate the effectiveness of the VR onomatopoeia teaching in the research lab. The post-test results served as the basis for the evaluation of the participants’ learning outcomes. The VR eye tracker will calculate the coordinates on the screen corresponding to the saccade of the eyes based on the calibration results. After calibration is completed, the formal experiment is conducted. The experimental procedures of the present study were as follows:
(1)
Pre-test: The content of the pre-test was devised by the Japanese language experts at the Department of Applied Japanese Language. The questions were drafted based on the cognition, comprehension, and application of the six major types of onomatopoeia, and then reviewed and revised by a native Japanese teacher to ensure accuracy. The test time is 15 min. The test papers were taken back after the test; the correct answers were not given.
(2)
Experiment: The experiment was set up in a separate research laboratory. Since there was only one set of VR eye tracking equipment available for use, the experimenter gathered all participants to inform that the aim of this experiment was to measure pupil expansion in response to visual stimuli. This was done to prevent participants from consciously conforming to the experimental goal, and then participants were allowed to get familiar with the VR environment before the experiment. After the illustration procedure, the 20 recruited participants for the experiment went into the separate room one after another to participate in the VR experiment. During the experiment, only one participant was allowed to the separate room except where unavoidable. When the experiment began, the participant first needed to complete the five-point eye movement calibration. After the calibration was completed, the experiment would continue.
(3)
Output: During the experiment, participants need to watch the contextual teaching content on onomatopoeia via the VR device. In addition to having their eye movement data recorded through the eye tracker, the participants also need to use a handheld controller to interact and click the end button to indicate the end of session. After the viewing session of the contextual VR teaching content is completed, the computer connected to the VR eye tracker will automatically export the participant’s eye movement data. The output files are, respectively, a video file and a text file. The video file (.wmv) is used to define ROIs, and the text file (.txt) is the participant’s eye movement data.
(4)
Post-test: The post-test was immediately completed in the separate room for each participant while finishing in performing the experiment. The content of the post-test is similar to that of the pre-test. The test time is 15 min. The results serve to evaluate the learning outcomes of the two groups of participants after they have watched the VR teaching content.

3.5.2. Data Collection and Analysis

After eye movement data were recorded, the output video files and text files underwent preliminary data collection and archiving with two auxiliary tools modified from the EyeNTNU-120p eye movement analysis software, i.e., VR Dynamic ROI Tool and Fixation Calculator Tool. The VR Dynamic ROI Tool mainly helps operators define the regions of interest, while the Fixation Calculator Tool can automatically process ROIs according to the priority when ROIs are overlapping, which can avoid errors in the process of data analysis. The VR eye movement analysis software’s process for operating and defining ROIs is shown as follows:
  • The VR videos from the experiment are imported into the Dynamic ROI Tool software.
  • After the videos are imported, the research team starts playing the experiment videos.
  • The research team clicks the left mouse button and drags the mouse to frame the area to be analyzed. Then, the left mouse button is released to complete the definition of the ROI.
  • According to the Fixation Calculator Tool guidelines, the team repeats the previous step (step 3), until all ROIs in the videos have been defined. Then, the information of ROIs can be used for eye movement analysis.
The present study used VR eye tracker to collect eye movement data from subjects watching the contextual VR teaching content. Visualization analysis software tool in the system architecture is then used to calculate the fixation behavior indicators and analyze the distribution of visual attention when participants were watching the onomatopoeia teaching content. In this way, it is possible to evaluate whether the key ROIs emphasized in the VR content of onomatopoeia received visual attention from the participants.
After participants viewed the VR content, the eye tracking system used in this study automatically exports a video file (.wmv) to help to define the dynamic ROIs. For example, the red boxes represent the ROIs which need to be defined after the experiment and their respective names. Since the contextual VR video contains dynamic multimedia content, in the process of defining the ROIs, the experimenter used the keyboard bar to control the playback of the video file, so as to accurately complete the definition of all ROIs in the dynamic frames. After the dynamic ROIs had been defined for the entire video, the ROI definition tool module would generate a dynamic ROI file, which would be subsequently imported into the visualization analysis software for eye movement indicator analysis. A total of 24 ROIs were defined for the eye tracking data analyses. Three ROIs, ROI1~ROI3, indicate MIO words in the weather scenario. Four ROIs, ROI4~ROI7, indicate MIO words in the Ferris wheel facility. Four ROIs, ROI8~ROI11, indicate MIO words in the roller coaster facility. Four ROIs, ROI12~ROI15, indicate MIO words in the circus facility. Four ROIs, ROI16~ROI19, indicate MIO words in the haunted house facility. Five ROIs, ROI20~ROI24, indicate MIO words in the popcorn booth. Take the contextual onomatopoeia scenes in the roller coaster facility as an example (see Figure 10): based on the eye tracking data analysis, a total of four ROIs were defined out of this scene, respectively representing onomatopoeia words with different feelings of speed (i.e., ROI8~ROI11). To clearly recognize the scope of a ROI, the red boxes represent the ROIs which need to be defined after the experiment and their respective names. For each ROI, visualization analysis software is used to calculate fixation behavior indicators, including Total Fixation Duration (TFD), Fixation Count (FC), Latency of First Fixation (LFF), Duration of First Fixation (DFF), and Number of Inter-Scanning Counts (NISC). After finishing watching the VR content, the participant can click the end button on the handheld controller in the interactive mode to complete the experiment.
The study used eye tracking device and visualization analysis software to collect participants’ eye movement data, which are subsequently examined using the following eye movement indicators and SPSS for Windows 22 for one-way ANOVA, to test whether there was a significant difference in visual attention for participants with different levels of prior knowledge when they read onomatopoeia words in the VR setting. The time unit for the following eye tracking indicators is milliseconds (ms).
  • Latency of First Fixation (LFF): The latency from the onset of the stimulus to the initial fixation on the defined ROI, when the participant is reading the onomatopoeia words in the VR setting.
  • Duration of First Fixation (DFF): The duration of fixation when a participant’s first fixation is formed in an ROI as he or she is reading onomatopoeia words in the VR setting.
  • Total Fixation Durations (TFD): The total fixation duration when a participant’s fixation falls into a certain ROI, as he or she is reading onomatopoeia words in the VR setting. TFD includes the duration of the first fixation and all fixations that follow.
  • Fixation Counts (FC): The total number of fixations when the participant’s fixation falls into a certain ROI, as he or she is reading onomatopoeia words in the VR setting. FC reflects the importance of a particular ROI. Higher FC indicates that this ROI is more important to the participant or can provide more clues for him or her.
  • Heat Zone Map: The visualization which depicts the overall fixation distribution of the participant to different ROIs. The most frequently staring points of the participants will be shown in red.
  • Number of Inter-Scanning Counts (NISC): The number of fixation transactions between a pair of ROIs, which reflects the participant’s fixation sequence to analyze the eye movement among the points of fixation in different ROIs [68].

3.5.3. Learning Outcomes

To evaluate learning outcomes, onomatopoeia test papers devised and reviewed by professional Japanese instructors were used in the pre-test and post-test. The scores then went through a paired samples t-test to examine the differences in the pre-test and post-test scores within each group. In addition, to assess whether there was a significant difference in the two groups’ learning outcomes, the post-test scores from the two groups went through an independent samples t-test to examine the post-test performance of the two groups. The Wilcoxon rank signed test was also used to test the learning outcomes of the participants in each group because the sample size of this study was small and not normality distributed.
Based on the eye movement data collected by the VR eye tracker and then analyzed by the upgraded visualization analysis software, the proposed research hypotheses to be verified by the aforementioned eye movement indicators were as follows:
Hypothesis 1 (H1).
(in response to Research Question 1): For participants with different levels of prior knowledge, their fixation sequence of ROIs will be different when they browse the VR content of onomatopoeia teaching.
Hypothesis 2 (H2).
(in response to Research Question 2): For participants with different levels of prior knowledge, when they browse the VR content of onomatopoeia teaching, they exhibit differences in visual attention in the ROIs, in terms of total fixation duration and total fixation count.
Hypothesis 3 (H3).
(in response to Research Question 3): The learning outcomes of onomatopoeia is related to the total fixation duration and the total fixation count in different ROIs.
Hypothesis 4 (H4).
(in response to Research Question 4): The learning outcomes of onomatopoeia is related to the number of visual attention transitions between different ROIs.
Hypothesis 5 (H5).
(in response to Research Question 5): The introduction of contextual VR content in the course materials is conducive, and the difference in test scores in the pre-test and post-test (devised to test the participants’ learning outcome) has statistical significance.

4. Results and Discussions

During the experiment, the participant’s view in the VR environment was projected in real time through the computer, so the eye movement of the participant could be monitored simultaneously. Currently, the present study has completed 20 participants, including 13 participants in the low prior knowledge group and 7 participants in the high prior knowledge group. The eye movement data of the 20 participants collected as they were watching the onomatopoeia teaching content in MIO Land were analyzed and compared to explore the different visual attention behaviors of students with different levels of prior knowledge. The analysis was conducted by discussing the following eye movement indicators in each ROI of different facility scenes: Latency of First Fixation (LFF), Duration of First Fixation (DFF), Total Fixation Durations (TFD), and Fixation Counts (FC). The results of the present study were shown in Table 1, Table 2, Table 3, Table 4, Table 5, Table 6, Table 7, Table 8, Table 9, Table 10, Table 11, Table 12, Table 13, Table 14, Table 15, Table 16 and Table 17.

4.1. Differences in Visual Attention for Participant with Different Levels of Prior Knowledge

According to the eye movement data and results of the one-way ANOVA in Table 1, Table 2, Table 3, Table 4, Table 5 and Table 6, in terms of participants’ visual behavior of reading onomatopoeia words, the LFF data show that participants from both groups had the same fixation sequence only in the circus facility scene (ROI12→ROI15→ROI14→ROI13), while in other facility scenes, the ROI fixation sequences from the two groups are different. This finding illustrates that participants with different levels prior knowledge have different cognition of the onomatopoeia words in most facility scenes. In addition, according to the DFF data, except for ROI18 in the haunted house facility scene, participants from both groups directed their visual attention to different ROIs in other facility scenes. Hence, Hypothesis 1 (H1) is partially valid.
According to the eye movement data and results of the one-way ANOVA, as shown in Table 7, Table 8, Table 9, Table 10, Table 11 and Table 12, in terms of the visual behavior for onomatopoeia in the VR content, participants with different levels of prior knowledge do not exhibit significant difference in the TFD and FC indicators, except in ROI10 in the roller coaster scene (t(18) = −2.82, p = 0.01, d = 1.35 and t(18) = −2.24, p = 0.04, d = 1.05), ROI16 in the haunted house scene (t(18) = −2.40, p = 0.03, d = 1.13 and t(18) = −3.33, p < 0.00, d =1.56), and ROI18 in the haunted house scene (t(18) = −2.25, p = 0.04, d = 1.06 and t(18) = −4.53, p < 0.00, d = 2.13) (see Table 13). Moreover, according to the statistical analysis of Table 13, the high prior knowledge group has longer fixation durations and more fixation counts than the low prior knowledge group does, namely ROI10, ROI16, and ROI18. This might be the reason that these three ROIs (i.e., ROI10, ROI16, ROI18) with significant differences were previously defined in the context of the roller coaster (speedy situation) and haunted house (fright situation) facilities at MIO amusement park. Apparently, it produced the significant differences in participants’ patterns of the distribution of visual attention because high prior knowledge group happened more fixation durations than low prior knowledge group for cognitive process due to their instinctive awareness. That is to say, the context of exciting and thrilling situations obviously produced significant differences in distribution of visual attention between the two groups while the context of steady situations did not. Hence, Hypothesis 2 (H2) is partially valid. According to the heat zone map of the roller coaster facility scene output based on the participants’ fixation duration, the participant (#9) from the high prior knowledge group paid more visual attention to ROI10 than the participant (#18) from the low prior knowledge group (see Figure 11). The redder the color, the longer the fixation duration on that position. Hence, Hypothesis 3 (H3) is valid.

4.2. Differences in NISC for Participants with Different Levels of Prior Knowledge

According to the results of the one-way ANOVA in Table 14, there is no significant difference in the number of inter-scanning counts (NISC) between the two groups, t(18) = −1.05, p = 0.31, d = 0.49. There is no significant difference in the NISC between the two groups. Hence, Hypothesis 4 (H4) is not valid.

4.3. Differences in Learning Outcome for Participants with Different Levels of Prior Knowledge

As shown in Table 15, the average pre-test score of the low prior knowledge group is 28.46 with a standard deviation of 6.88, while the pre-test score of the high prior knowledge group is 58.57 with a standard deviation of 8.99. The analysis results of t-test show that students with different levels of prior knowledge do exhibit significant differences in the cognitive comprehension of onomatopoeia (t(18) = −8.39, p < 0.00). As for the post-test, the average post-test score of the low prior knowledge group is 53.85 with a standard deviation of 6.50, while the post-test score of the high prior knowledge group is 84.29 with a standard deviation of 5.35. The results of the t-test analysis show that students with different levels of prior knowledge still exhibit significant differences after watching the VR teaching content (t(18) = −10.57, p = 0.01), but the outcome in the two groups is similar in terms of performance and progress. In other words, the experiment activities in this study rendered similar results in the effectiveness of improving cognitive understanding for students with different levels of prior knowledge.
According to pre-test and post-test scores and the analysis of the paired samples t-test in Table 16, the average scores of the pre-test and post-test of participants from the two groups both exhibit significant difference (t(12) = −11.79, p < 0.00, d = 3.79 and t(6) = −6.97, p = 0.01, d = 3.48). The post-test scores of the low prior knowledge group (M = 53.85, SD = 6.50) are significantly higher than the pre-test scores (M = 28.46, SD = 6.88). The post-test scores of the high prior knowledge group (M = 84.29, SD = 5.35) are also significantly higher than the pre-test scores (M = 58.57, SD = 8.99). Hence, either in the low prior knowledge group or the high prior knowledge group, participants’ post-test scores are higher than those of the pre-test after they watched the contextual VR teaching content of onomatopoeia, and the differences reached a significant level. This result is consistent with that in [69], which concludes that using immersive VR as a teaching tool can improve learning outcome. Additionally, due to a small sampling size (<30 samples) and not normally distributed in this study, the nonparametric statistical Wilcoxon rank signed test was performed to determine whether learning outcomes of Japanese MIO words using VR eye tracking technology differed significantly in high and low prior knowledge groups. Table 17 showed the results for the learning outcomes by pre-test and post-test in both groups. The differences between pre-test and post-test results were significant for both groups (Z = −3.235, p = 0.001 < 0.05; Z = −2.214, p = 0.027 < 0.05). Therefore, the statistical results showed that participants achieved significant improvement in cognitive process of Japanese MIO words using VR eye tracking technology in both groups. It can thus be proved that the introduction of Japanese onomatopoeia in a contextual VR setting is conducive to the learning outcome for students either with a high or low level of prior knowledge. Hence, Hypothesis 5 (H5) is valid.

5. Conclusions and Suggestions

5.1. Conclusions

In the present study, Unreal Engine 4 (UE4) was used to construct a three-dimensional VR “MIO Land” with various facility scenes. Through the application of eye tracking analysis software, the difference in visual attention of participants with different levels of prior knowledge when they viewed the contextual VR content was explored by analyzing the eye movement data. Although VR and eye tracking are not two brand-new technologies, they can be integrated on the VR eye tracker, which can be used to analyze the dynamic visual behavior for Japanese onomatopoeia presented in the VR content. This can be an important reference for the future development of VR in the field of language learning. The key findings of the present study were as follows:
  • According to the LFF data, participants from both groups had the same fixation sequence only in the circus facility scene (ROI12→ROI15→ROI14→ROI13), while in other facility scenes, the ROI fixation sequences from the two groups are different. 2. According to the DFF data, except for ROI18 in the haunted house facility scene, participants from both groups directed their visual attention to different ROIs in other facility scenes.
  • As indicated by the TFD, in terms of the indicators of TFD and FC, there is no significant difference in the visual attention behaviors for onomatopoeia in the VR context between the two prior knowledge groups, except in ROI10 (in the roller coaster facility), ROI16, and ROI18 (both in the haunted house facility). In other ROIs, the TFD and FC show no significant difference.
  • According to the participants’ pre-test and post-test scores, whether in the high prior knowledge group or low prior knowledge group, all participants’ post-test scores are higher than those in the pre-test, after they watched the VR simulation content of Japanese onomatopoeia. Such difference has statistical significance. The results show that the use of immersive VR as a language teaching tool can improve the learning outcomes of students.

5.2. Suggestions and Implications

This study not only provided concrete evidence of the visual attention while learning Japanese onomatopoeia for overseas students, but also extended existing applications of visual behaviors immersed in VR environment in real time. This evidence of visual behaviors may be applied to future empirical research in the field of VR eye tracking. Because few literature works far has documented an experiment of this kind, the finding results of this study may help VR designers and eye tracking researchers to integrate both technologies making VR eye tracker attractive to target students. The results of the ANOVA statistical analysis showed that the usage of MIO words using VR eye tracker is effective for learning MIO and increases the learning outcomes of comprehension. With the prior knowledge of how learners learned Japanese, learning material designers now know how to construct and attract the attention of learners who can learn the Japanese MIO words with both of meaning and feeling.
The present study is enabled by the combination eye tracking and VR technology. The aim of the study is to integrate eye tracking technology and data acquisition of dynamic experiment materials into immersive VR environment to construct and arrange proper curriculum design as well as effective learning environment. The concept of using eye tracking in virtual reality for education has explained the technological aspects and inspires interest in the field of foreign language learning from sustainable education. Therefore, the system not only proves foreign language education efficiency for achieving education for sustainable development (ESD), but also enables students’ better understanding of fundamental principles of sustainable development competences via foreign language learning. According to the finding results of the present study, it is hoped that future research can raise students’ positive awareness and perception to apply foreign language knowledge on quality education and to find out the prevailing trends in the field of higher education for ESD based on foreign language competence.

5.3. Study Limitation

This study explores the visual attention of learning Japanese onomatopoeia via VR eye tracker and studies the association between the Japanese MIO expression learning and learning outcomes. However, a study limitation needs to be taken into account. That is, small sample sizes of this study tend to reduce the power of the statistical analysis. However, all of the 20 participants’ eye movements were successfully recorded in the present study, the statistical results of the study might not be statistically significant but of sufficiently large size to be of interest [70]. Further studies with larger sample sizes will enrich the generalizations of the study findings. Nevertheless, it should be noticed that for the eye movement data, since every participant in the study engages in six MIO expression situations with 24 ROIs, as a result, there were obviously 408 sets of eye movement data in total (20 participants times 24 ROIs) because of dynamic stimuli. When these eye movement data were pooled together, the amount of data was actually quite large for an explorative study. Actually, this results in a major difficulty of applying remote eye tracking technology in the educational research. On the other hand, when sample sizes increase, the eye movement data would become quite large and make the consequent data analyses complex. This phenomenon leads to a time-consuming problem, but on the other, educational studies on novel technologies need large sample sizes of participants to generate and identify significant behaviors. In the future, more empirical eye movement data should be acquired to reveal a significant index for learning effectiveness when considering visual behaviors of learning Japanese MIO words during VR eye tracking technology.

Author Contributions

All authors contributed to several aspects of the study, specifically, conceptualization, C.-C.W. and H.-C.C.; methodology, C.-C.W. and H.-C.C.; software, C.-C.W.; validation, C.-C.W., J.C.H. and H.-C.C.; formal analysis, C.-C.W.; investigation, J.C.H.; resources, C.-C.W.; data curation, C.-C.W., J.C.H. and H.-C.C.; writing—original draft preparation, C.-C.W.; writing, review and editing, C.-C.W., J.C.H. and H.-C.C.; supervision, C.-C.W. and J.C.H. All authors have read and agreed to the published version of the manuscript.

Funding

This work was supported by the Ministry of Science and Technology, Taiwan (No. MOST 108-2511-H-309-001-).

Institutional Review Board Statement

Not applicable.

Informed Consent Statement

Informed consent was obtained from all participants involved in the study.

Data Availability Statement

Data sharing not applicable.

Conflicts of Interest

The authors declare no conflict of interest.

References

  1. Biasutti, M.; Frate, S. A validity and reliability study of the Attitudes toward Sustainable Development scale. Environ. Educ. Res. 2017, 23, 214–230. [Google Scholar] [CrossRef]
  2. Laurence, J.; Schmid, K.; Hewstone, M. Ethnic diversity, ethnic threat, and social cohesion: (re)-evaluating the role of perceived out-group threat and prejudice in the relationship between community ethnic diversity and intra-community cohesion. J. Ethn. Migr. Stud. 2019, 45, 395–418. [Google Scholar] [CrossRef]
  3. Makarova, E. Application of sustainable development principles in foreign language education. In Proceedings of the First Conference on Sustainable Development: Industrial Future of Territories (IFT 2020), Yekaterinburg, Russia, 28–29 September 2020; pp. 1–6. [Google Scholar]
  4. Ogata, H.; Yin, C.; Yano, Y. JAMIOLAS: Supporting Japanese mimicry and onomatopoeia learning with sensors. In Proceedings of the 4th IEEE International Workshop on Wireless and Mobile Technologies in Education (WMTE2006), Athens, Greece, 16–17 November 2006; pp. 111–115. [Google Scholar]
  5. Tamori, I.; Schourup, L. Onomatope: Keitai to Imi; Kuroshio Shuppan: Tokyo, Japan, 1999. [Google Scholar]
  6. Hou, B.; Li, M.; Ogata, H.; Yano, Y. JAMIOLAS3.0 Supporting Japanese Mimicry and Onomatopoeia Learning Using Sensor Data. Int. J. Mob. Blended Learn. 2010, 2, 40–54. [Google Scholar] [CrossRef] [Green Version]
  7. Miyata, M.; Ogata, H.; Kondo, T.; Yano, Y. JAMIOLAS 2.0: Supporting to learn Japanese mimetic words and onomatopoeia with wireless sensor networks. In Proceedings of the International Conference on Computer in Education (ICCE 2008), Taipei, Taiwan, 27–31 October 2008; pp. 643–650. [Google Scholar]
  8. Maeda, M. Access to Japanese mimetic words. In JALT2008 Conference Proceedings; Stoke, A.M., Ed.; JALT: Tokyo, Japan, 1996. [Google Scholar]
  9. Uosaki, N.; Ogata, H.; Mouri, K.; Lkhagvasuren, E. Japanese onomatopoeia learning support for international students using SCROLL. In Proceedings of the 23rd International Conference on Computers in Education (ICCE 2015), Hangzhou, China, 30 November–4 December 2015; pp. 329–338. [Google Scholar]
  10. Mayer, R.E. Multimedia Learning; Cambridge University Press: Cambridge, UK, 2001. [Google Scholar]
  11. Paivio, A. Mental Representations: A Dual Coding Approach; Oxford University Press: Oxford, UK, 1986. [Google Scholar]
  12. Purnell, K.N.; Solman, R.T. The influence of technical illustrations on students’ comprehension in geography. Read. Res. Q. 1991, XXVI, 277–299. [Google Scholar] [CrossRef]
  13. Sadoski, M.; Willson, V.L. Effects of a theoretically-based large scale reading intervention in a multicultural urban school district. Am. Educ. Res. J. 2006, 43, 137–154. [Google Scholar] [CrossRef]
  14. Yang, F.Y.; Chang, C.Y.; Chien, W.R.; Chien, Y.T.; Tseng, Y.H. Tracking learners’ visual attention during a multimedia presentation in a real classroom. Comput. Educ. 2013, 62, 208–220. [Google Scholar] [CrossRef]
  15. Mayer, R.E. Principles for reducing extraneous processing in multimedia learning: Coherence, signaling, redundancy, spatial contiguity, and temporal contiguity principles. In The Cambridge Handbook of Multimedia Learning; Mayer, R.E., Ed.; Cambridge University Press: Cambridge, UK, 2005; pp. 183–200. [Google Scholar]
  16. Lu, B.; Fan, Z.; Zheng, J.; Li, L. Bio-Native shape modeling and virtual reality for bio education. Int. J. Image Graph. 2006, 6, 251–265. [Google Scholar] [CrossRef]
  17. Seo, J.H.; Smith, B.; Cook, M.; Pine, M.; Malone, E.; Leal, S.; Suh, J. Anatomy builder VR applying a constructive learning method in in the virtual reality canine skeletal system. In Proceedings of the IEEE Virtual Reality (VR 2017), Los Angeles, CA, USA, 18–22 March 2017; pp. 18–22. [Google Scholar]
  18. Xenos, M.; Maratou, V.; Ntokas, I.; Mettouris, C.; Papadopoulos, G.A. Game-based learning using a 3D virtual world in computer engineering education. In Proceedings of the 2017 IEEE Global Engineering Education Conference (EDUCON), Athens, Greece, 26–28 April 2017; pp. 1078–1083. [Google Scholar]
  19. Duchowski, A.T. A breadth-first survey of eye-tracking applications. Behav. Res. Methods Instrum. Comput. 2002, 34, 455–470. [Google Scholar] [CrossRef]
  20. Rayner, K. Eye movements in reading and information processing: 20 years of research. Psychol. Bull. 1998, 124, 372. [Google Scholar] [CrossRef]
  21. Chen, H.C.; Lai, H.D.; Chiu, F.C. Eye tracking technology for learning and education. J. Res. Educ. Sci. 2010, 55, 39–68. [Google Scholar]
  22. Josephson, S.; Holmes, M.E. Attention to repeated images on the world wide web: Another look at scan path theory. Behav. Res. Methods Instrum. Comput. 2002, 34, 539–548. [Google Scholar] [CrossRef] [PubMed] [Green Version]
  23. Pan, B.; Hembrooke, H.A.; Gay, G.K.; Granka, L.A.; Feusner, M.K.; Newman, J.K. The determinants of web page viewing behavior: An eye-tracking study. In Proceedings of the 2004 Symposium on Eye Tracking Research & Applications, San Antonio, TX, USA, 22–24 March 2004; pp. 147–154. [Google Scholar]
  24. Vernet, M.; Kapoula, Z. Binocular motor coordination during saccades and fixations while reading: A magnitude and time analysis. J. Vis. 2009, 9, 1–13. [Google Scholar] [CrossRef] [Green Version]
  25. Ho, H.F.; Chen, G.A.; Vicente, C.T. Impact of misplaced words in reading comprehension of Chinese sentences: Evidences from eye movement and electroencephalography. In Proceedings of the 23rd International Conference on Computers in Education (ICCE 2015), Hangzhou, China, 30 November–4 December 2015; pp. 573–579. [Google Scholar]
  26. Ho, H.F.; Hou, G.Y.; Lin, C.K.; Lin, C.H.; Soh, O.K. Correlation of English test outcome from TVE joint college entrance examination of Taiwan vs. professional English reading speed and comprehension. In Proceedings of the 22nd International Conference on Computers in Education (ICCE 2014), Nara, Japan, 30 November–4 December 2014; pp. 648–655. [Google Scholar]
  27. Pan, T.W.; Tsai, M.J. Eye-tracking analyses of text-and-graphic design effects on e-book reading process and performance: “Spanish Color Vocabulary” as an example. In Proceedings of the 22nd International Conference on Computers in Education (ICCE2014), Nara, Japan, 22–24 March 2014; pp. 494–498. [Google Scholar]
  28. Wu, A.H.; Hsu, P.F.; Chiu, H.J.; Tsai, M.J. Visual behavior and cognitive load on e-book vocabulary learning. In Proceedings of the 22nd International Conference on Computers in Education (ICCE2014), Nara, Japan, 30 November–4 December 2014; Asia-Pacific Society for Computers in Education: Taoyuan, Taiwan, 2014; pp. 156–159. [Google Scholar]
  29. Canham, M.; Hegarty, M. Effects of knowledge and display design on comprehension of complex graphics. Learn. Instr. 2010, 20, 155–166. [Google Scholar] [CrossRef]
  30. Ho, H.N.J.; Tsai, M.J.; Wang, C.Y.; Tsai, C.C. Prior knowledge and online inquiry-based science reading: Evidence from eye tracking. Int. J. Sci. Math. Educ. 2014, 12, 525–554. [Google Scholar] [CrossRef]
  31. Jarodzka, H.; Scheiter, K.; Gerjets, P.; van Gog, T. In the eyes of the beholder: How experts and novices interpret dynamic stimuli. Learn. Instr. 2010, 20, 146–154. [Google Scholar] [CrossRef] [Green Version]
  32. Van Gog, T.; Scheiter, K. Eye tracking as a tool to study and enhance multimedia learning. Learn. Instr. 2010, 20, 95–99. [Google Scholar] [CrossRef]
  33. Mayer, R.E. Unique contributions of eye-tracking research to the study of learning with graphics. Learn. Instr. 2010, 20, 167–171. [Google Scholar] [CrossRef]
  34. Zhao, D.; Lucas, J. Virtual reality simulation for construction safety promotion. Int. J. Inj. Control Saf. Promot. 2015, 22, 57–67. [Google Scholar] [CrossRef]
  35. Merchant, Z.; Goetz, E.T.; Cifuentes, L.; Keeney-Kennicutt, W.; Davis, T.J. Effectiveness of virtual reality-based instruction on students’ learning outcomes in k-12 and higher education: A meta-analysis. Comput. Educ. 2014, 70, 29–40. [Google Scholar] [CrossRef]
  36. Markowitz, D.M.; Laha, R.; Perone, B.P.; Pea, R.D.; Bailenson, J.N. Immersive virtual reality field trips facilitate learning about climate change. Front. Psychol. 2018, 9, 2364. [Google Scholar] [CrossRef]
  37. Temkin, B.; Acosta, E.; Hatfield, P.; Onal, E.; Tong, A. Web-based three-dimensional virtual body structures: W3D-VBS. J. Am. Med Inform. Assoc. 2002, 9, 425–436. [Google Scholar] [CrossRef] [Green Version]
  38. Hoffman, H.; Murray, M.; Curlee, R.; Fritchle, A. Anatomic visualizeR: Teaching and learning anatomy with virtual reality. Inf. Technol. Med. 2001, 1, 205–218. [Google Scholar]
  39. Brenton, H.; Hernandez, J.; Bello, F.; Strutton, P.; Purkayastha, S.; Firth, T. Using multimedia and Web3D to enhance anatomy teaching. Comput. Educ. 2007, 49, 32–53. [Google Scholar] [CrossRef]
  40. Freina, L.; Bottino, R.; Tavella, M. From e-learning to VR-learning: An example of learning in an immersive virtual world. J. E-Learn. Knowl. Soc. 2016, 12, 101–113. [Google Scholar]
  41. Yildirim, B.; Sahin-Topalcengiz, E.; Arikan, G.; Timur, S. Using virtual reality in the classroom: Reflections of STEM teachers on the use of teaching and learning tools. J. Educ. Sci. Environ. Health 2020, 6, 231–245. [Google Scholar] [CrossRef]
  42. Paszkiewicz, A.; Salach, M.; Dymora, P.; Bolanowski, M.; Budzik, G.; Kubiak, P. Methodology of implementing virtual reality in education for industry 4.0. Sustainability 2021, 13, 5049. [Google Scholar] [CrossRef]
  43. Mourtzis, D.; Vlachou, E.; Dimitrakopoulos, G.; Zogopoulos, V. Cyber-physical systems and education 4.0 –The teaching factory 4.0 concept. Procedia Manuf. 2018, 23, 129–134. [Google Scholar] [CrossRef]
  44. Jimeno-Morenilla, A.; Sánchez-Romero, J.L.; Mora-Mora, H.; Coll-Miralles, R. Using virtual reality for industrial design learning: A methodological proposal. Behav. Inf. Technol. 2016, 35, 897–906. [Google Scholar] [CrossRef] [Green Version]
  45. Huang, H.M.; Liaw, S.S.; Lai, C.M. Exploring learner acceptance of the use of virtual reality in medical education: A case study of desktop and projection-based display systems. Interact. Learn. Environ. 2016, 24, 3–19. [Google Scholar] [CrossRef]
  46. Cohen, A. Selective Attention; Encyclopedia of Cognitive Science; John Wiley & Sons: New York, NY, USA, 2006. [Google Scholar]
  47. Berdine, W.H.; Meyer, S.A. Assessment in Special Education; Little, Brown Co.: Boston, MA, USA, 1987. [Google Scholar]
  48. Lyon, G.; Krasnegor, N.A. Attention, Memory, and Executive Function; Brookes: Baltimore, MD, USA, 1996. [Google Scholar]
  49. Just, M.A.; Carpenter, P.A. A theory of reading: From eye fixations to comprehension. Psychol. Rev. 1980, 87, 329–354. [Google Scholar] [CrossRef]
  50. Pan, T.W.; Hsu, M.C.; Tsai, M.J. Effect of graphic design on e-book reading: A pilot eye-tracking study. In Proceedings of the 21st International Conference on Computers in Education, Bali, Indonesia, 18–22 November 2013; Asia-Pacific Society for Computers in Education: Taoyuan, Taiwan, 2013. [Google Scholar]
  51. Roberts, L. Using Eye-tracking to investigate topics in L2 acquisition and L2 processing. Stud. Second Lang. Acquis. 2013, 35, 213–235. [Google Scholar] [CrossRef] [Green Version]
  52. Leung, C.Y. Can Japanese EFL learners “See” before they “Read”. In 2014 Studies in Japan Association for Language Education and Technology, Kansai Chapter; Methodology Special Interest Groups (SIG): Kobe, Japan, 2014; Volume 5, pp. 16–27. [Google Scholar]
  53. Pan, Y.Y.; Lin, C.H. Effect of e-Learning course design with guided pointer on students’ locus of attention and learning achievement. J. Curric. Stud. 2011, 6, 51–80. [Google Scholar]
  54. Marcus, J. Eye Tracking and Its Application in Research; Technical Report, presented in Tainan; SR Research Ltd.: Ontario, Canada, 2011. [Google Scholar]
  55. Holsanova, J.; Holmberg, N.; Holmqvist, K. Reading information graphics: The role of spatial contiguity and dual attentional guidance. Appl. Cogn. Psychol. 2009, 23, 1215–1226. [Google Scholar] [CrossRef]
  56. Just, M.A.; Carpenter, P.A. Eye fixations and cognitive processes. Cogn. Psychol. 1976, 8, 441–480. [Google Scholar] [CrossRef]
  57. De Koning, B.B.; Tabbers, H.; Rikers, R.; Paas, F. Attention guidance in learning from a complex animation: Seeing is understanding? Learn. Instr. 2010, 20, 111–122. [Google Scholar] [CrossRef]
  58. Liu, H.C.; Chuang, H.H. An examination of cognitive processing of multimedia information based on reviewers’ eye movements. Interact. Learn. Environ. 2011, 19, 503–517. [Google Scholar] [CrossRef]
  59. Liu, H.C.; Lai, M.L.; Chuang, H.H. Using eye-tracking technology to investigate the redundant effect of multimedia web pages on viewers’ cognitive processes. Comput. Hum. Behav. 2011, 27, 2410–2417. [Google Scholar] [CrossRef]
  60. Zhang, X.B.; Yuan, S.M.; Chen, M.D.; Liu, X.L. A complete system for analysis of video lecture based on eye tracking. IEEE Access 2018, 6, 49056–49066. [Google Scholar] [CrossRef]
  61. Best, R.M.; Rowe, M.P.; Ozuru, Y.; McNamara, D.S. Deep-level comprehension of science texts: The role of reader and the text. Top. Lang. Disord. 2005, 25, 65–83. [Google Scholar] [CrossRef]
  62. Kintsch, W. The role of knowledge in discourse comprehension: A construction-integration model. Psychol. Rev. 1988, 95, 163–182. [Google Scholar] [CrossRef] [Green Version]
  63. McNamara, D.S. Reading both high-coherence and low-coherence texts: Effects of text sequence and prior knowledge. Can. J. Exp. Psychol. 2001, 55, 51–62. [Google Scholar] [CrossRef] [PubMed]
  64. Glaser, R.; De Corte, E. Preface to the assessment of prior knowledge as a determinant for future learning. In Assessment of Prior Knowledge as a Determinant for Future Learning; Dochy, F.J.R.C., Ed.; Lemma B.V./Jessica Kingsley Publishers: London, UK, 1992. [Google Scholar]
  65. McNamara, D.S.; Kintsch, E.; Songer, N.B.; Kintsch, W. Are good texts always better? Text coherence, background knowledge, and levels of understanding in learning from text. Cogn. Instr. 1996, 14, 1–43. [Google Scholar] [CrossRef]
  66. Cook, M.; Carter, G.N.; Wiebe, E. The interpretation of cellular transport graphics by students with low and high prior knowledge. Int. J. Sci. Educ. 2008, 30, 241–263. [Google Scholar] [CrossRef]
  67. Lin, Y.T.; Wu, C.C.; Hou, T.Y.; Lin, Y.C.; Yang, F.Y.; Chang, C.H. Tracking students’ cognitive processes during program debugging—An eye-movement approach. IEEE Trans. Educ. 2016, 59, 175–186. [Google Scholar] [CrossRef]
  68. Lai, M.L.; Tsai, M.J.; Yang, F.Y.; Hsu, C.Y.; Liu, T.C.; Lee, S.W.Y.; Li, M.-H.; Chiou, G.-L.; Liang, G.-C.; Tsai, C.-C. A review of using eye-tracking technology in exploring learning from 2000 to 2012. Educ. Res. Rev. 2013, 10, 90–115. [Google Scholar] [CrossRef]
  69. Hamilton, D.; McKechnie, J.; Edgerton, E.; Wilson, C. Immersive virtual reality as a pedagogical tool in education: A systematic literature review of quantitative learning outcomes and experimental design. J. Comput. Educ. 2021, 8, 1–32. [Google Scholar] [CrossRef]
  70. Chen, Y.C.; Yang, F.Y. Probing the relationship between process of spatial problems solving and science learning: An eye tracking approach. Int. J. Sci. Math. Educ. 2014, 12, 579–603. [Google Scholar] [CrossRef]
Figure 1. Conceptual design of the six facilities in MIO Land.
Sustainability 13 11058 g001
Figure 2. A captured VR scene in MIO Land.
Sustainability 13 11058 g002
Figure 3. A captured VR scene in the roller coaster facility.
Sustainability 13 11058 g003
Figure 4. A captured VR scene with four MIO words in the roller coaster facility.
Sustainability 13 11058 g004
Figure 5. Structure diagram of the relationship between each variable in the experiment design.
Sustainability 13 11058 g005
Figure 6. Instruments used in the experiment.
Sustainability 13 11058 g006
Figure 7. HTC VIVE Pro Eye VR device.
Sustainability 13 11058 g007
Figure 8. System architecture of the VR eye movement analysis software.
Sustainability 13 11058 g008
Figure 9. Actual VR eye tracking experiment in progress.
Sustainability 13 11058 g009
Figure 10. The definition of regions of interest in the roller coaster facility.
Sustainability 13 11058 g010
Figure 11. Heat zone map of the fixated regions of interest for low prior knowledge group (left, participant #18); heat zone map of the fixated regions of interest for high prior knowledge group (right, participant #9).
Sustainability 13 11058 g011
Table 1. LFF and DFF in each ROI in the weather scenario (Time unit: ms).
IndicatorGroupROI1ROI2ROI3
LFFLow PK (n= 13)38,090.6355,947.7555,827.88
High PK (n= 7)21,549.1449,619.5055,710.00
DFFLow PK (n= 13)121.36112.25257.88
High PK (n= 7)125.57174.00119.75
Table 2. LFF and DFF in each ROI in the Ferris wheel facility (Time unit: ms).
IndicatorGroupROI4ROI5ROI6ROI7
LFFLow PK (n= 13)68,505.0061,594.5060,197.1672,992.83
High PK (n= 7)89,523.5282,179.3377,319.5067,765.00
DFFLow PK (n= 13)96.33129.16130.83166.33
High PK (n= 7)105.62117.23132.00123.21
Table 3. LFF and DFF in each ROI in the roller coaster facility (Time unit: ms).
IndicatorGroupROI8ROI9ROI10ROI11
LFFLow PK (n= 13)71,266.2584,548.2570,748.0081,387.00
High PK (n= 7)54,212.5070,746.6665,486.5057,087.66
DFFLow PK (n= 13)178.50150.00174.00200.20
High PK (n= 7)181.75106.66113.66118.83
Table 4. LFF and DFF in each ROI in the circus facility (Time unit: ms).
IndicatorGroupROI12ROI13ROI14ROI15
LFFLow PK (n= 13)26,593.16739,910.6337,912.6235,653.429
High PK (n= 7)23,240.0055,010.6052,010.6746,368.75
DFFLow PK (n= 13)142.50157.12157.12122.86
High PK (n= 7)126.00123.40126.48165.00
Table 5. LFF and DFF in each ROI in the haunted house facility (Time unit: ms).
IndicatorGroupROI16ROI17ROI18ROI19
LFFLow PK (n= 13)127,230.00120,766.00104,478.50119,388.00
High PK (n= 7)43,408.1443,012.1342,168.2834,775.00
DFFLow PK (n= 13)74,605.5081.0077,854.00103.00
High PK (n= 7)108.00132.03250.00124.00
Table 6. LFF and DFF in each ROI in the popcorn booth (Time unit: ms).
IndicatorGroupROI20ROI21ROI22ROI23ROI24
LFFLow PK (n= 13)52,354.5033,248.0051,893.5081,594.7540,686.40
High PK (n= 7)49,530.3346,728.4623,340.0033,417.0040,982.53
DFFLow PK (n= 13)135.5090.00107.50112.0071.21
High PK (n= 7)120.83112.38108.00143.00135.33
Table 7. TFD and FC in each ROI in the weather scenario (Time unit: ms).
IndicatorGroupROI1ROI2ROI3
TFDLow PK (n= 13)933.181530.771652.44
High PK (n= 7)814.422789.161563.75
FCLow PK (n= 13)7.3310.2510.22
High PK (n= 7)6.5719.759.25
Table 8. TFD and FC in each ROI in the Ferris wheel facility (Time unit: ms).
IndicatorGroupROI4ROI5ROI6ROI7
TFDLow PK (n= 13)677.331770.161483.50816.50
High PK (n= 7)228.33158.16323.50759.67
FCLow PK (n= 13)5.3311.3310.285.50
High PK (n= 7)1.661.162.506.40
Table 9. TFD and FC in each ROI in the roller coaster facility (Time unit: ms).
IndicatorGroupROI8ROI9ROI10ROI11
TFDLow PK (n= 13)1857.50884.33522.331082.80
High PK (n= 7)787.67106.66974.16786.50
FCLow PK (n= 13)9.256.134.258.16
High PK (n= 7)8.131.337.136.33
Table 10. TFD and FC in each ROI in the circus facility (Time unit: ms).
IndicatorGroupROI12ROI13ROI14ROI15
TFDLow PK (n= 13)985.161529.371559.37812.28
High PK (n= 7)588.661232.201432.20859.16
FCLow PK (n= 13)7.3313.5010.506.57
High PK (n= 7)4.168.338.206.06
Table 11. TFD and FC in each ROI in the haunted house facility (Time unit: ms).
IndicatorGroupROI16ROI17ROI18ROI19
TFDLow PK (n= 13)268.62181.33303.30487.03
High PK (n= 7)881.66801.16882.14250.33
FCLow PK (n= 13)2.772.122.844.24
High PK (n= 7)10.718.8311.131.33
Table 12. TFD and FC in each ROI in the popcorn booth (Time unit: ms).
IndicatorGroupROI20ROI21ROI22ROI23ROI24
TFDLow PK (n= 13)1245.33497.631840.38204.33134.88
High PK (n= 7)331.67434.38616.66497.13233.16
FCLow PK (n= 13)9.334.3319.662.331.33
High PK (n= 7)2.663.665.334.162.13
Table 13. TFD and FC of participants with different levels of prior knowledge in the most fixated ROIs (Time unit: ms).
IndicatorROIM (SD)Degree of Freedomt Valuep ValueEffect Size * (d)
Low PK (N = 13)High PK (N = 7)
TFDROI10522.33 (298.58)974.16 (833.00)18−2.820.011.35
FC4.25 (4.52)7.13 (3.65)18−2.240.041.05
TFDROI16268.62 (623.69)881.66 (331.79)18−2.400.031.13
FC2.77 (6.37)10.71 (4.11)18−3.330.001.56
TFDROI18303.30 (639.82)882.14 (277.85)18−2.250.041.06
FC2.84 (4.57)11.13 (3.69)18−4.530.002.13
* Cohen’s d is the effect size of the t-test: d >= 0.2 indicates a small effect, d >= 0.5 indicates a medium effect, and d >= 0.8 indicates a large effect.
Table 14. NISC of participants with different levels of prior knowledge (Time unit: ms).
IndicatorM (SD)Degree of Freedomt Valuep ValueEffect Size * (d)
Low PK (n = 13)High PK (n = 7)
NISC10.15(2.82)11.71(3.77)18−1.05.310.49
* Cohen’s d is the effect size of the t-test: d >= 0.2 indicates a small effect, d >= 0.5 indicates a medium effect, and d >= 0.8 indicates a large effect.
Table 15. Results of the t-test on the pre-test and post-test scores of participants with different levels of prior knowledge.
ItemLow PKHigh PKMDt Valuep ValueEffect Size * (d)
M (SD)M (SD)
Pre-Test Score28.46 (6.88)58.57 (8.99)30.11−8.390003.97
Post-Test Score53.85 (6.50)84.29 (5.35)30.44−10.570.014.96
* Cohen’s d is the effect size of the t-test: d >= 0.2 indicates a small effect, d >= 0.5 indicates a medium effect, and d >= 0.8 indicates a large effect.
Table 16. Results of the t-test on the learning outcomes of participants with different levels of prior knowledge.
PKM (SD)Degree of Freedomt Valuep ValueEffect Size * (d)
Pre-Test ScorePost-Test Score
Low28.46 (6.88)53.85 (6.50)12−11.790.003.79
High58.57 (8.99)84.29 (5.35)6−6.970.013.48
* Cohen’s d is the effect size of the t-test: d >= 0.2 indicates a small effect, ·d >= 0.5 indicates a medium effect, and d >= 0.8 indicates a large effect.
Table 17. Wilcoxon rank signed test of the learning outcomes of both groups for pre-test and post-test.
PKM (SD)Number of ParticipantsMean RankSum of RanksZSig.
(Two-Tailed)
Pre-Test ScorePost-Test Score
Low28.46 (6.88)53.85 (6.50)137.0091.00−3.235 *0.001
High58.57 (8.99)84.29 (5.35)73.5021.00−2.214 *0.027
* indicates p < 0.05.
Publisher’s Note: MDPI stays neutral with regard to jurisdictional claims in published maps and institutional affiliations.

