Article

Measuring Soil Colour to Estimate Soil Organic Carbon Using a Large-Scale Citizen Science-Based Approach

1
Department of Geography and Environmental Science, University of Reading, Reading RG6 6AB, UK
2
Earthwatch Institute, Oxford OX2 7DE, UK
*
Author to whom correspondence should be addressed.
Sustainability 2021, 13(19), 11029; https://doi.org/10.3390/su131911029
Submission received: 30 August 2021 / Revised: 22 September 2021 / Accepted: 29 September 2021 / Published: 5 October 2021

Abstract

:
Rapid, low-cost methods for large-scale assessments of soil organic carbon (SOC) are essential for climate change mitigation. Our work explores the potential for citizen scientists to gather soil colour data as a cost-effective proxy of SOC instead of conventional lab analyses. The research took place during a 2-year period using topsoil data gathered by citizen scientists and scientists from urban parks in the UK and France. We evaluated the accuracy and consistency of colour identification by comparing “observed” Munsell soil colour estimates to “measured” colour derived from reflectance spectroscopy, and calibrated colour observations to ensure data robustness. Statistical relationships between carbon content obtained by loss on ignition (LOI) and (i) observed and (ii) measured soil colour were derived for SOC prediction using three colour components: hue, lightness, and chroma. Results demonstrate that although the spectrophotometer offers higher precision, there was a correlation between observed and measured colour for both scientists (R2 = 0.42; R2 = 0.26) and citizen scientists (R2 = 0.39; R2 = 0.19) for lightness and chroma, respectively. Foremost, a slightly stronger relationship was found for predicted SOC using the spectrophotometer (R2 = 0.69), and citizen scientists produced comparable results (R2 = 0.58), highlighting the potential of a large-scale citizen-based approach for SOC monitoring.

1. Introduction

Soils are the second largest active pool of carbon after the oceans, and account for more than three times the amount of carbon stored in the atmosphere and terrestrial vegetation combined [1]. The carbon storage capacity of soils has been a subject of great interest in recent environmental literature, exemplified by an increasing number of publications in mapping soil carbon stocks [2]. Globally, it has caught the attention of a wide audience, including policymakers, NGOs, and land managers. This growing interest is mainly due to the realization of soils’ key role as either a natural sink of carbon for climate change mitigation [3,4,5] or as a potentially large and uncertain source of CO2 emissions [6]. Whether soils accumulate or lose carbon—and thus function as carbon sinks or sources—depends on several factors, such as the type of management practices, biomass input levels, and on climatic conditions [6].
Globally, soils are thought to have lost between 50% to 70% of the carbon they once held [7]. Nonetheless, our ability to monitor soil organic carbon (SOC) changes are still limited. Accurate baselines of soil carbon are missing for many countries. Where baseline data are present, reported values vary considerably among authors since there is no standardised approach for the measurement [1,8,9,10]. A wide range of data sources and methodologies are used, which has led to sources of error in SOC determination at the sample, profile, plot, and landscape scales [11,12]. Whilst conventional laboratory methods, such as loss on ignition (LOI) and elemental analysis, can quantify SOC precisely, they are inadequate for large-scale monitoring because they require direct measurements of many samples to capture the inherently dynamic nature of SOC, making them slow and expensive [1,8,9,10,11,12]. Laboratory methods also require access to specific equipment, narrowing the scope of who can make these measurements and how many measurements can be made.
Hence, there is a need for methods that can rapidly, inexpensively, and relatively easily characterize SOC status for reliable monitoring and reporting [1,8,9,11]. This knowledge is crucial to understand where we should seek to preserve or increase SOC stocks to provide the best opportunities to mitigate and adapt to climate change [1]. This is particularly the case for cities, which are relatively understudied and are likely to become net sources of GHG emissions if not managed appropriately [9,10].
Soil colour determination could be a cost-effective and time-saving method for the spatio-temporal monitoring of SOC [8,11,13]. Soil colour descriptions have long been used by soil scientists in the field to aid soil classification and mapping [14,15,16]. Soils can exhibit a wide range of colour: grey, black, white, reds, browns, yellows, and greens [17]. These colours result from the different processes and conditions that the soil is subjected to, the mineralogy of the soil, and the soil organic matter (SOM) content [18]. Organic matter content is the most important pigment that influences soil colour [19], which is why there is a long history of relating soil colour darkness to SOM content [8,17,20,21]. In general, darker soil colours often indicate an increase in decomposed organic matter known as humus. These carbon-containing polymers absorb most visible wavelengths of light, giving soils rich in organic matter a dark brown, nearly black appearance [22].
Qualitative estimates of soil colour made using Munsell soil colour charts (1975) have been routinely made by pedologists in soil surveys for >60 years to describe the normal range of colours found in soils [23]. This method involves the visual determination of colour by comparison with standard chips systematically arranged according to their Munsell notation. In this system, colour is characterized by three parameters: Hue, which refers to the dominant wavelength or basic colour; value, which represents the overall brightness or lightness; and chroma, which expresses the saturation or intensity of hue. For example, a brown soil may be noted as Hue Value/Chroma (10YR 5/2). The most recent edition of the Munsell soil colour chart (MSCC) consists of 443 colour chips, divided among 13 pages. This perceptual colour system was designed by artist Albert H. Munsell to allow for direct comparison of soils anywhere in the world for any observer with a normal colour vision, under controlled illumination conditions.
Hence, given the MSCC’s ease of use and that capturing SOC status requires many observations spread over time and space, this method could be used in a large-scale citizen science-based approach to overcome some of the current limitations of conventional SOC analysis mentioned [10,11,24,25]. The main challenge with the Munsell colour scheme is that several problems have been routinely mentioned in the literature with the consistency and accuracy in colour determination [20,26,27,28,29,30]. This is because the perception of colour attributes is affected by numerous psychophysical factors, such as environmental conditions (e.g., moisture content, illumination conditions) [31], sample characteristics (e.g., size, roughness), difficult statistical analysis (e.g., limited colour chips, cylindrical colour coordinates) [32,33], and the observer’s sensitivities (e.g., colour blindness, subjectivity, poor colour memory, eye fatigue) [20,29,31,32,33,34,35].
These shortcomings mean that soil scientists have generally used colour data descriptively despite its potential in the application of soil carbon determination [13,14,36]. Instead, the rapid development of modern technologies and instrumental methods, such as UV VIS spectrophotometry, allow a more precise and quantitative approach to colour quality control [16,19,37]. They overcome some of the limitations of the Munsell method by removing the human ‘judgement’ from the analysis and using standard values, such as observer viewing angle and fixed lighting conditions to control the conditions of the measurement [8,9,16,23,38,39,40]. For this reason, quantitative measures of colour (e.g., spectrophotometers) have seen apparent exponential growth worldwide and there are new applications of colour data in different fields [16,37].
However, despite the consensus that quantitative assessments of colour increase precision and that they are available, they have not been widely adopted by soil scientists for a variety of reasons, including costs, speed, lack of portability, familiarity with the Munsell method, and small-scale heterogeneity [33]. Consequently, field colour assessment using Munsell soil colour charts are likely to prevail as the standard practice, particularly in the Global South [9,16,20,23,35,38,39].
Thus, given that limited and controversial data exists regarding the uncertainty in colour determination using MSCCs, its prevalence in soil science, and the use of this data for important soil applications, our work evaluates the consistency and accuracy of colour observations collected by scientists and citizen scientists and explores its potential for reliable SOC prediction. The objectives were to (1) develop an objective, quantitative measure of soil colour using a spectrophotometer; (2) compare scientists’ and citizen scientists’ Munsell colour observations with spectrally derived colour, to validate the former; (3) calibrate colour observations using spectral readings for data robustness; (4) measure how well the colour dimensions (hue, lightness, and chroma) can be related to SOC obtained by laboratory analysis (viz. loss on ignition method) for reliable soil colour-SOC predictions.

2. Materials and Methods

2.1. Study Area and Research Design

Soil data were collected by citizen scientists during 28 organised events in Spring and Autumn 2018–2019 over 2 consecutive days. Citizen scientists attended a 1 h training session led by professional scientists prior to the data collection to better understand urban soils and the methods used.
The study was conducted at three urban parks: Kew Gardens (London) and Cannon Hill Park (Birmingham) in the UK, and Les Fontaines Campus of Capgemini (Chantilly) in France. These areas experience similar climatic conditions (average annual temperature): 9, 11, and 11 °C and average annual precipitation: 64.1, 57.5, and 60 mm in Birmingham, London, and Chantilly, respectively [41].
At each site, there were 6 study trees, approximately 30 years old, of genus Tilia species (viz. Lime tree). For each tree studied, citizen scientists took a series of direct soil and tree measurements in the field and collected samples for analysis in the laboratory by scientists. Measurements and samples were collected below and outside of the canopy across a north-south transect. Trees were selected within each park to fall within one of three management categories to compare the effect of management in other related work. Management categories were managed, unmanaged, or street trees. Managed sites were defined as those where the majority of leaf and woody litter was cleared; unmanaged sites where debris was left in situ and had no human intervention; and street trees, those in tree pits where all debris and undergrowth vegetation was removed. The data collected by citizen scientists were part of a wider research campaign looking at soil and tree health in urban areas (https://earthwatch.org.uk/working-with-business/climate-proof-cities (accessed on 1 April 2021)).
From the soil data available, we selected a subsample of topsoil (0–10 cm) Munsell soil colour data collected in the field by trained citizen scientists (n = 270 measurements) and paired readings of the same samples, which were carried out in the laboratory by scientists (n = 270 measurements). Additionally, spectrally derived colour assessments were selected from within that sub-set (n = 90 measurements). In total, for the 30 sampling locations, we analysed 540 soil colour observations collected by scientists and citizen scientists using the Munsell method, and 90 quantitative colour measurements derived from spectral data.
Soil samples were analysed for soil organic carbon (SOC) content using the percent weight loss on ignition technique, referred to as ‘loss on ignition’ (% LOI) [42]. This is one of the most widely used methods for measuring the content of organic matter in soils [42,43]. The content of organic carbon was calculated by multiplying the total C content by a factor of 1.724 [44]. This conversion factor assumes organic matter contains 58% organic carbon.
The study was designed to test the reliability of the observed soil colour estimates taken by scientists and citizen scientists in comparison to soil colour measured using the spectroscopic method, and to explore the soil colour–SOC relationship for SOC prediction. For soil colour–SOC predictions, only data from UK sites were used for the analysis since these sites have a similar soil landscape, experience comparable environmental conditions, and undergo the same management practices. Table 1 shows a summary of the variables for the 30 sampling locations selected and soil measurements.

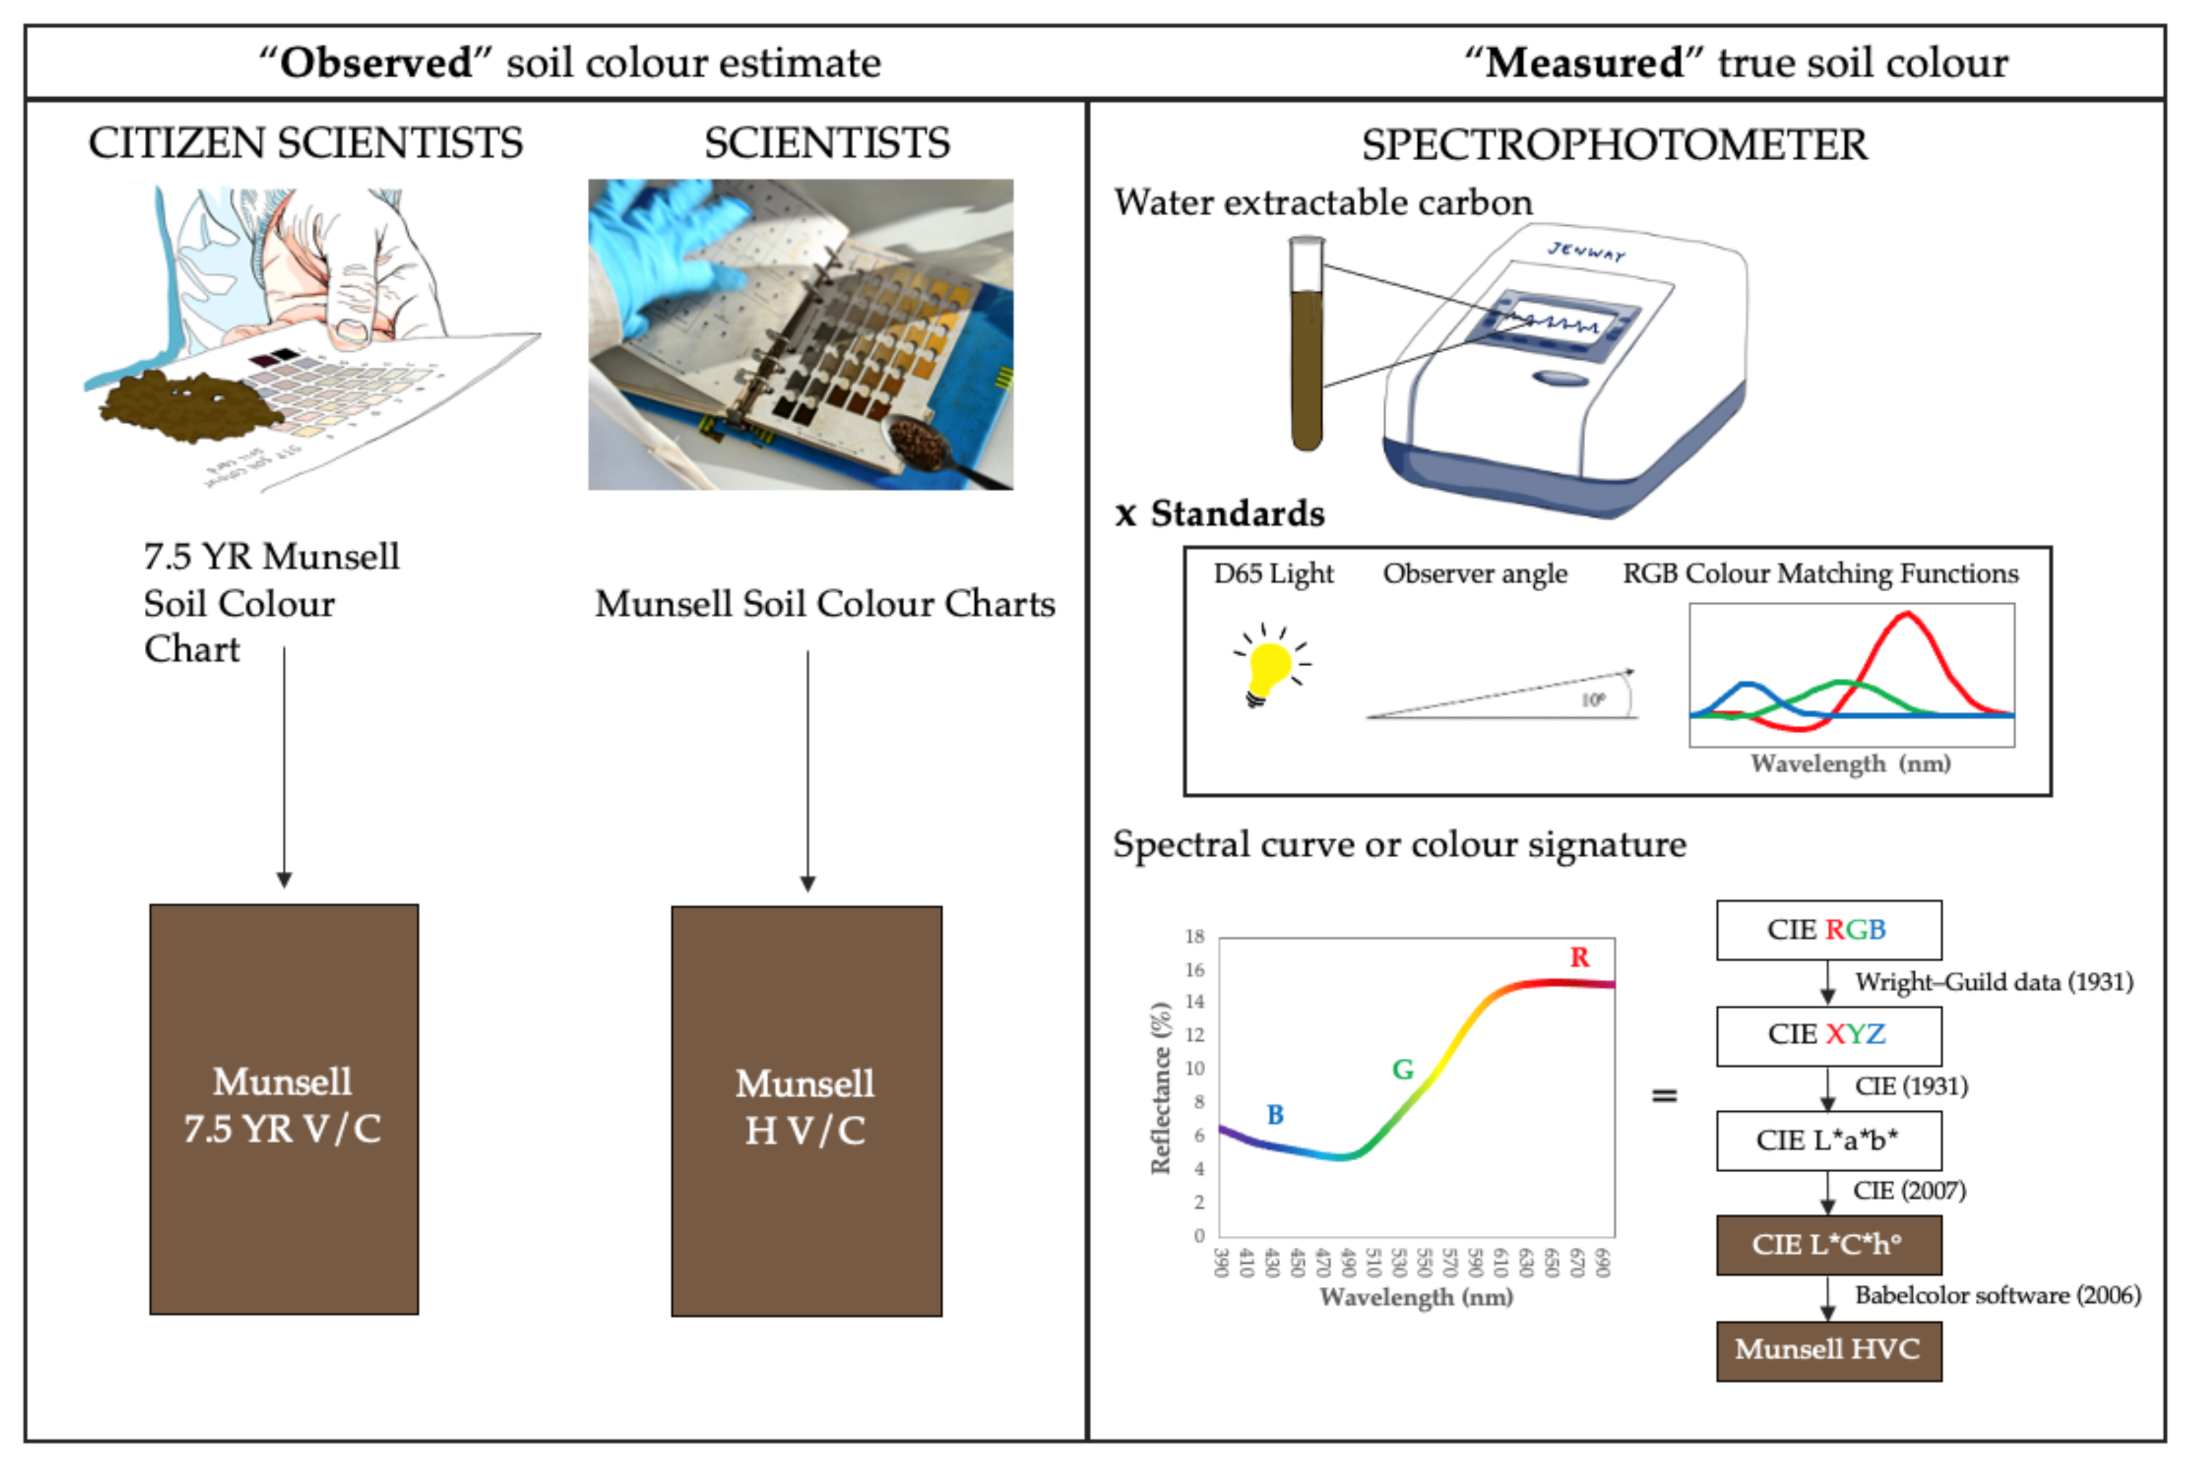
2.2. Visual Determination of Soil Colour

Colour was visually determined by comparison of soil samples with the colour chips in the Munsell soil colour chart (MSCC) [45]. The Munsell soil colour system consists of approximately 250 coloured chips arranged on hue cards. On the Munsell colour chart, hue is denoted categorically by the letter abbreviation of the colour of the spectrum (R = red, YR = yellow-red, Y = yellow) followed by numbers from 0 to 10. Within each letter range, the hue becomes more yellow and less red as the numbers increase. Value and chroma are both denoted on a numerical scale. Value, or lightness, is on a scale from 0 (absolute black) to 10 (absolute white). Chroma, or saturation, is on a scale from 0 for neutral greys (the achromatic point) to a maximum value of 20. Each sample was assigned the nearest integer unit of hue, value, and chroma. All colours were estimated to the nearest whole chip. This colour notation will be referred to as “observed.”

2.2.1. Citizen Scientists

Soil colour was estimated in field visits by citizen scientists. Individuals were trained to visually identify and match colour at each of the sampling locations using a copy of the 7.5 YR extract of the Munsell soil colour book. The method was adapted by preselecting a single chart following preliminary work at the field sites to facilitate data collection for citizen scientists. To ensure consistency under varying field conditions, if the soil was dry and formed a ped, it was broken down and water was added to slightly moisten samples before colour determination.

2.2.2. Scientists

In the laboratory, 3 scientists familiar with the Munsell method independently assessed soil colour for the same samples under controlled lighting conditions. Soil was sieved prior to the analysis to 2 mm following standard soil analysis procedures. Soil colour was determined for moist soil samples to be broadly consistent with conditions in the field. This is important because moisture content is one of the main factors that affect soil colour, making it appear darker than dry soil.

2.3. Determination of Colour from Spectroscopic Analysis

After all visual analysis of colour was complete, we used spectral reflectance data to calculate the true or “measured” soil colour from the water-extractable carbon samples.
For each sample, soil was sieved (2 mm) and a soil solution was created using 45 mL of ultrapure water to extract 4.5 g of soil (ratio 1:10 soil to solution), shaken on an over-head shaker for 24 h, and filtered using first a Whatman GF/A filter paper and next through a 0.45 μm cellulose nitrate filter. The visible reflectance of the water-extractable carbon sample was measured between 390 and 700 nm at 2nm increments using a Jenway 7315 spectrophotometer in the laboratory. The illumination source was a xenon lamp, which is regarded as the universal reference illuminant and represents mean daylight (Illuminant D65, ~6504 K).
The differences in the relative reflectance across the spectrum were recorded and visualized as a curve. Following the three equations of Wyszecki and Stiles (1982), each spectral reflectance curve was converted into three figures or tristimulus values (RGB) that define the colour perceived as a numerical value [46]:
R   = 390 nm 700 nm S λ · I λ · r ¯ λ G   = 390 nm 700 nm S λ · I λ · g ¯ λ B   = 390 nm 700 nm S λ · I λ · b ¯ λ
S(λ) is the spectral reflectance; I(λ) is the wavelength dependent power of the illuminant, and ‘r(λ), ‘g(λ), and ‘b(λ) are the colour matching functions.
The calculations were made with a 10 nm step and using Stiles and Burch (1959) RGB colour matching functions for the illuminant D65 and 10° standard observer [47]. The method used is similar in all respects to the procedure described in detail by Shields et al. (1968) and Fernández and Schulze (1987), except that we used water-extractable soil carbon solution [48,49].
Subsequently, we converted the RGB tristimulus values to the Munsell HVC system for comparison. Figure 1 shows a summary of the steps of transformation from the soil solution to the determination of the Munsell soil colour.

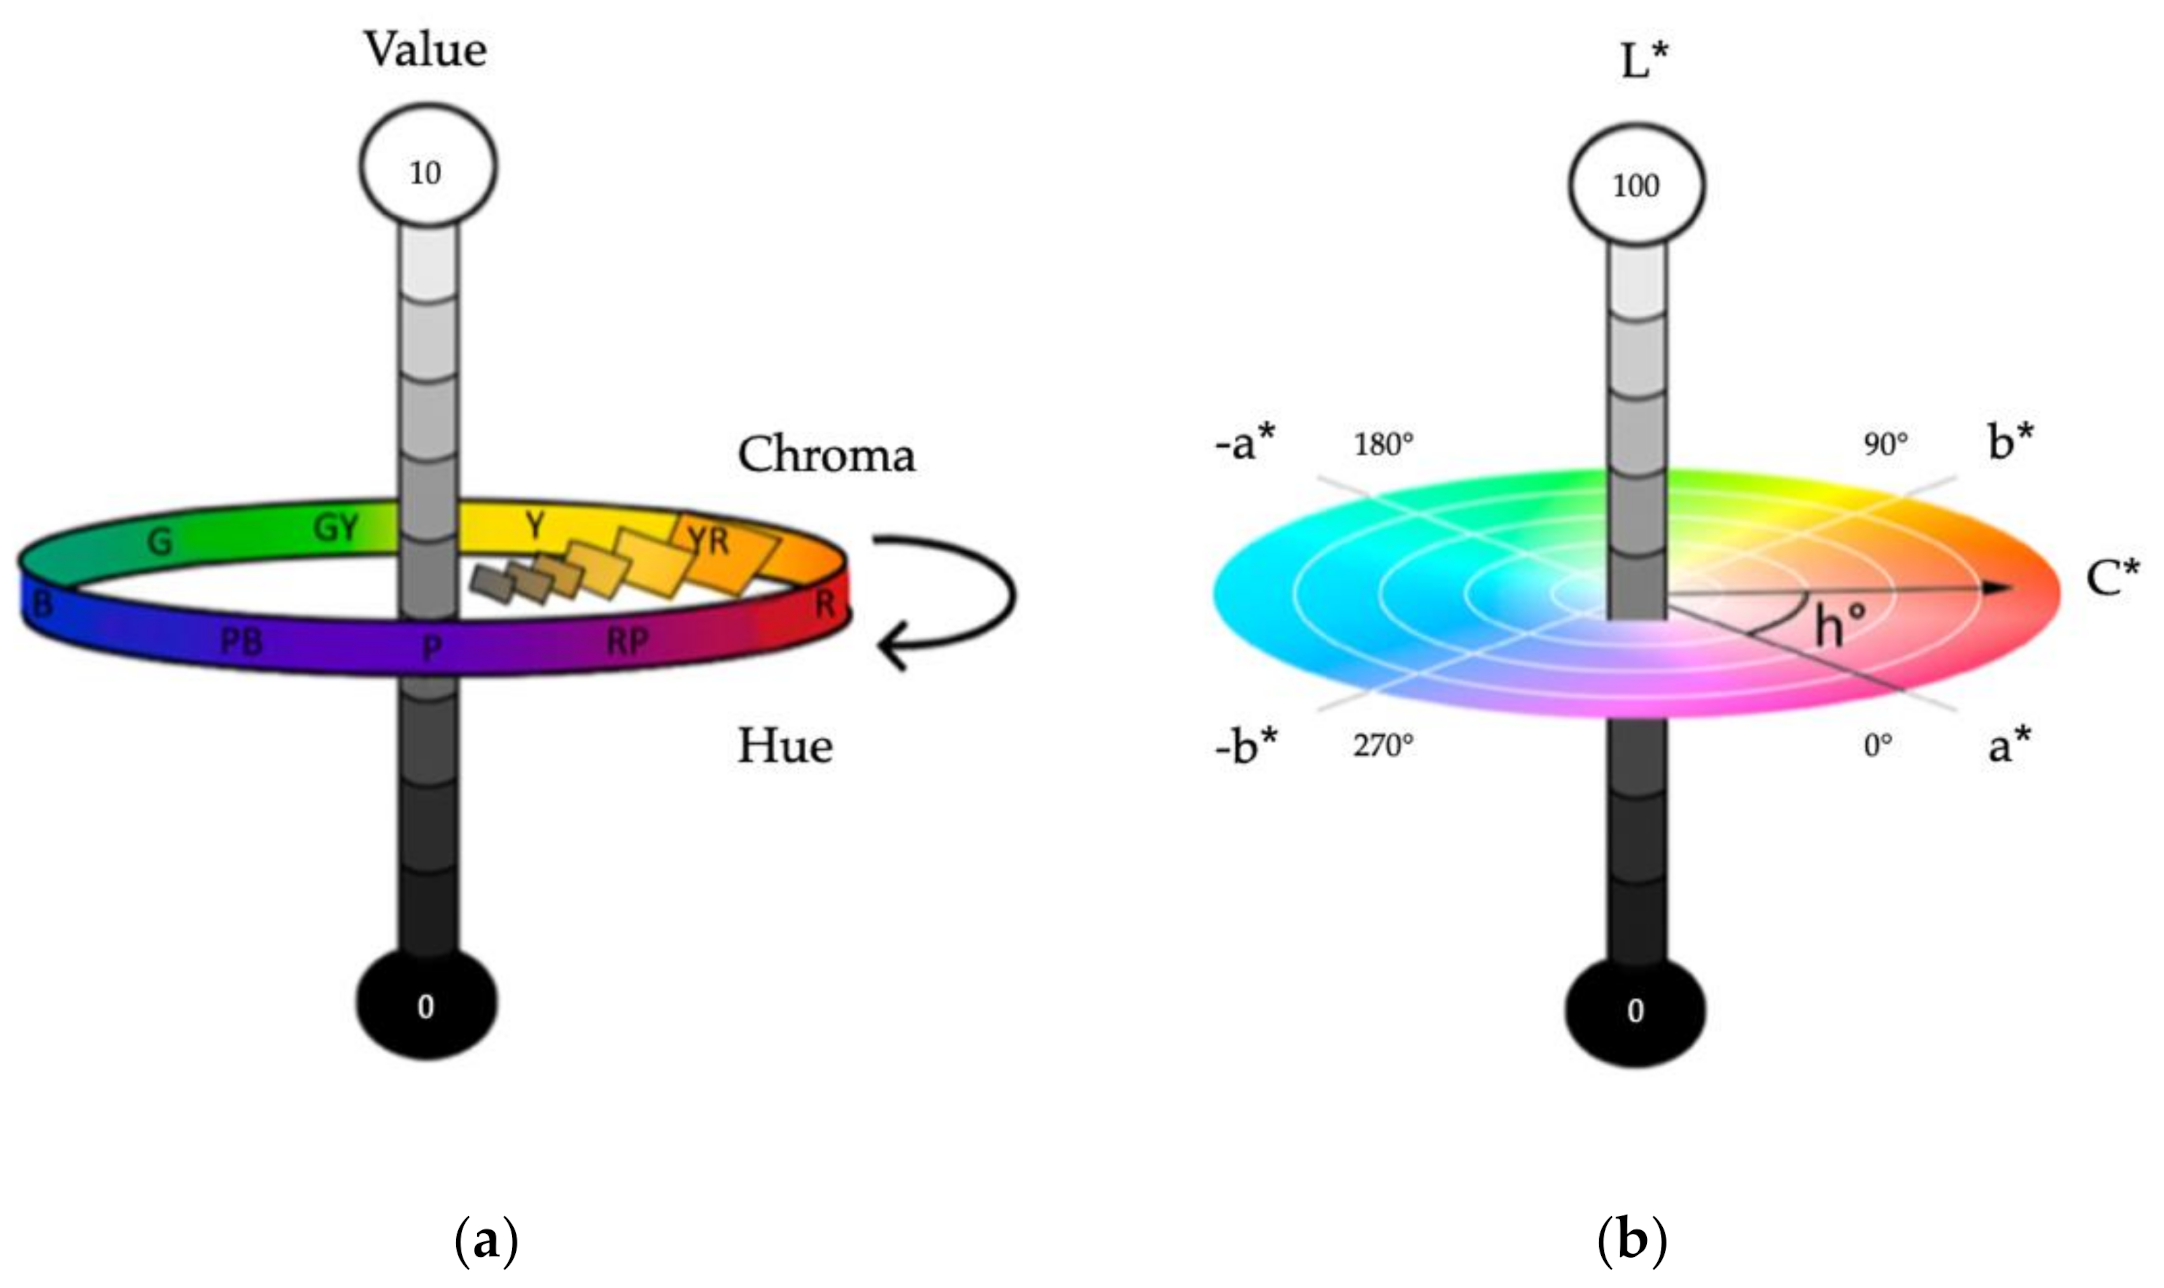
2.4. Colour Transformations for Data Analysis

In order to compare “observed” and “measured” soil colour, all data was converted to: Munsell HVC, CIELAB, and CIELCh (based on CIELAB). Figure 1 shows a conceptual diagram of the steps required for the colour transformations for data analysis. RGB tristimulus values were first converted into CIE XYZ by using CIE (1931) 3 × 3 M−1 conversion [50], and from this, data were transformed to the CIELAB and CIELCh colour space using different colorimetric equations [51]. The formulas and methods of transformation between colour spaces are well documented in the literature. All the conversions were made using the D65 CIE Standard illuminant and an observer angle of 10°.
CIELCh coordinates were translated into equivalent Munsell values, and vice versa, using Babelcolor software (2006), which uses the official Munsell renotation data from the Munsell Color Science Laboratory at Rochester Institute of Technology (RIT). The data can be downloaded from RIT: https://www.rit.edu/science/munsell-color-science-lab-educational-resources#munsell-renotation-data (accessed on 1 April 2021). The CT&A Help manual contains many sections dedicated to technical information, including detailed equations for formulas and conversions between colour spaces: https://www.babelcolor.com/tutorials.htm (accessed on 1 April 2021).
For quantitative data analysis involving Munsell measurements, Munsell hue was converted into a numerical scale of continuous values (hue number) as suggested by Hurst (1977) according to the redness rating (RR) [52]. In this system, the hue charts of interest for our soil dataset were numbered as follows: 5 R was 5, 7.5 R was 7.5, 10 R was 10, 2.5 YR was 12.5, 5 YR was 15, 7.5 YR was 17.5, 10 YR was 20, and 2.5 Y was 22.5. The Munsell value and chroma retained the same numerical value.
The choice was made to conduct the analysis using these colour spaces for several reasons. Although using the Munsell soil colour chart (MSCC) is the prevalent practice in soil science, several problems have been described with the consistency of colour identification using this qualitative method. Thus, we chose to use the CIELAB and CIELCh colour systems, which are contemporary colour spaces defined by the International Commission on Illumination (CIE) that supersede Munsell by offering advantageous properties during statistical analysis, while retaining the same perceptual framework, which is familiar to soil scientists [53]. In fact, there is almost a 1:1 correlation between the Munsell hue, value, and chroma attributes and the equivalent hue (h°), lightness (L*), and saturation (C*) polar coordinates [39]. Figure 2 illustrates the relationship between HVC and CIELCh. Results are displayed in both colour spaces so that it is easier to interpret and apply data in subsequent studies.
Moreover, we used the CIELAB system to pick up on small differences in soil colour since these coordinates have a direct physical meaning, describing colour in the range from green (–a*) to red (+a*), and from blue (–b*) to yellow (+b*). The lightness dimension, represented by L*, ranges from pure black (0) to diffuse white (100) (Figure 2). For this reason, it is possible to calculate the magnitude and direction of colour error and quantify colour differences. We used CIELAB to calculate the average difference between the “observed” and “measured” colour values of each sampling locations for parameters: ΔL*, Δa*, and Δb*.
By using this assessment, we were able to calculate the average deviation for each parameter (L*, a*, b*) from the true, spectrally derived colour and apply this difference to obtain a calibrated colour value. This “calibrated” colour was used in our study as the benchmark or true soil colour for each sample location.
Figure 2. A 2-D representation of the 1:1 correlation between colour spaces (a) Munsell HVC and (b) CIELCh. Munsell hue (dominant wavelength) or CIE hue angle (h°); Munsell value and CIE lightness (L*); and hue chroma or CIE chroma (C*) is the distance from grey. The h° is the angle between the hypotenuse and 0° on a* axis, varying from 0 to 360°, 0° (red colour); 90° + b* (yellow); 180°-a* (green) and 270°-b* (blue).
Sustainability 13 11029 g002

2.5. Data Analysis

2.5.1. Descriptive Statistics

Descriptive statistics (max., min., mean, mode, SD, CV%) were used to summarise the characteristics of the spectroscopic and visual estimates of colour taken by scientists and citizen scientists. While both the standard deviation (SD) and coefficient of variation (CV) measure the variation of the data, CV also calculates the variability relative to the mean. We defined minimally acceptable values in life sciences for SD as <2 and for CV <30% as acceptable, 10–20% good, and <10% as very good.

2.5.2. Correlation and Regression Analysis

Correlation and regression analysis of the above data were conducted using SPSS statistical package. We equated p < 0.05 with statistical significance.

2.5.3. Colour Difference Calculations

“Observed” and “calibrated” colour estimates by scientists and citizen scientists were tested against spectral measurements using the criteria defined by the USDA standard methods [18]. Colorimetrical accuracy was based on the assumption that spectral laboratory measurements were the true soil colour.
Levels of colour difference were divided into 3 groups or contrast classes: faint, distinct, and prominent: faint, where colour difference is evident only on very close examination; distinct, where colour difference is readily seen and contrasts only moderately with the colour to which it is compared; and prominent, where colour contrasts strongly. The criteria for determining contrast class can be found in USDA (2017) Soil Survey Manual [41]. The colour contrast class was calculated using (a) the three Munsell parameters: hue, value, and chroma (HVC); and (b) the only value and chroma (VC).

3. Results

3.1. Reproducibility of Spectral Measurements

Spectroscopic data were used to evaluate the accuracy of the visual soil colour measurements; hence, we evaluated the level of precision afforded by the spectrophotometer by taking five measurements of the same soil solution. Table 2 depicts the magnitude of variation between the spectrally derived colour values for the Munsell parameters: hue, value, and chroma.
Measured values ranged from 11.7 to 20.5 for Munsell hue (on average 16.7); from 3.5 to 3.6 for the Munsell value (on average 3.6); and from 0.9 to 1.3 for Munsell chroma (on average 1.1). A low standard deviation was observed for the Munsell value (SD = 0.04) and chroma (SD = 0.1), whereas Munsell hue measurements were more spread out and had a high SD (SD = 3.1). Similarly, Munsell value measurements had the lowest coefficient of variation (CV = 1.1%), whereas there was a slightly greater level of dispersion for the Munsell chroma measurements (CV = 12.8%), and Munsell hue measurements exhibited the highest variation from the mean (CV = 18.3%).

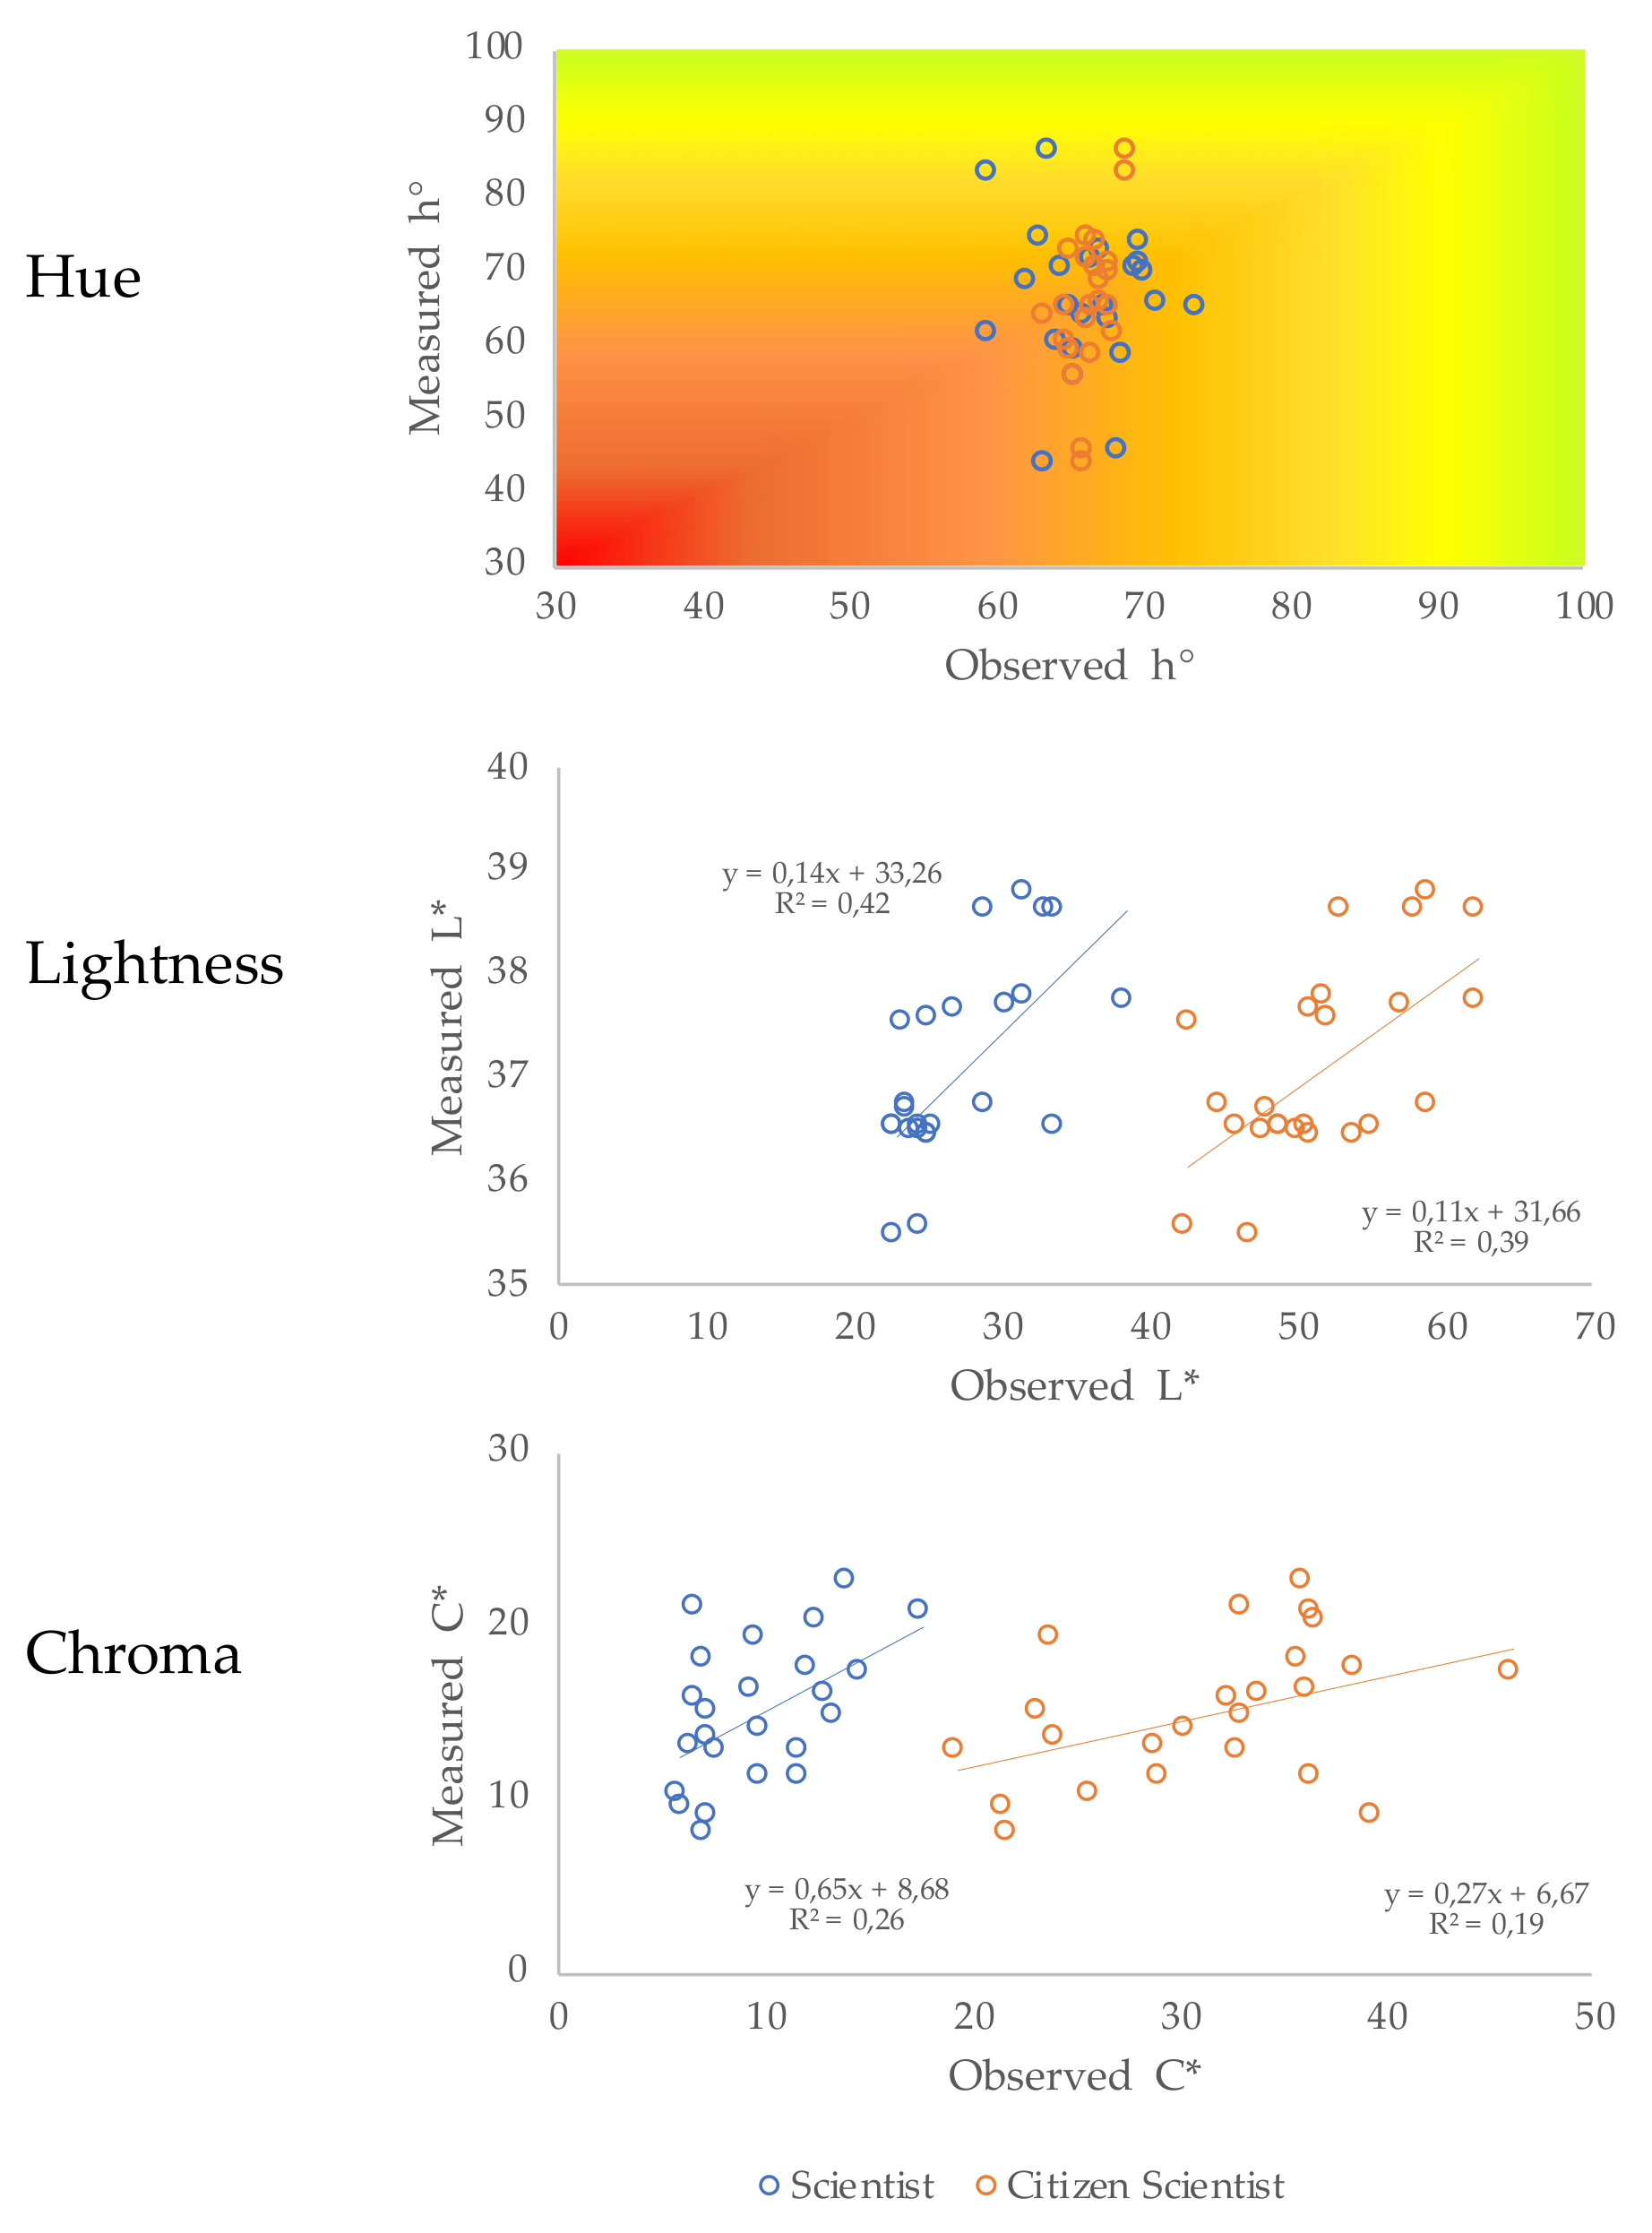
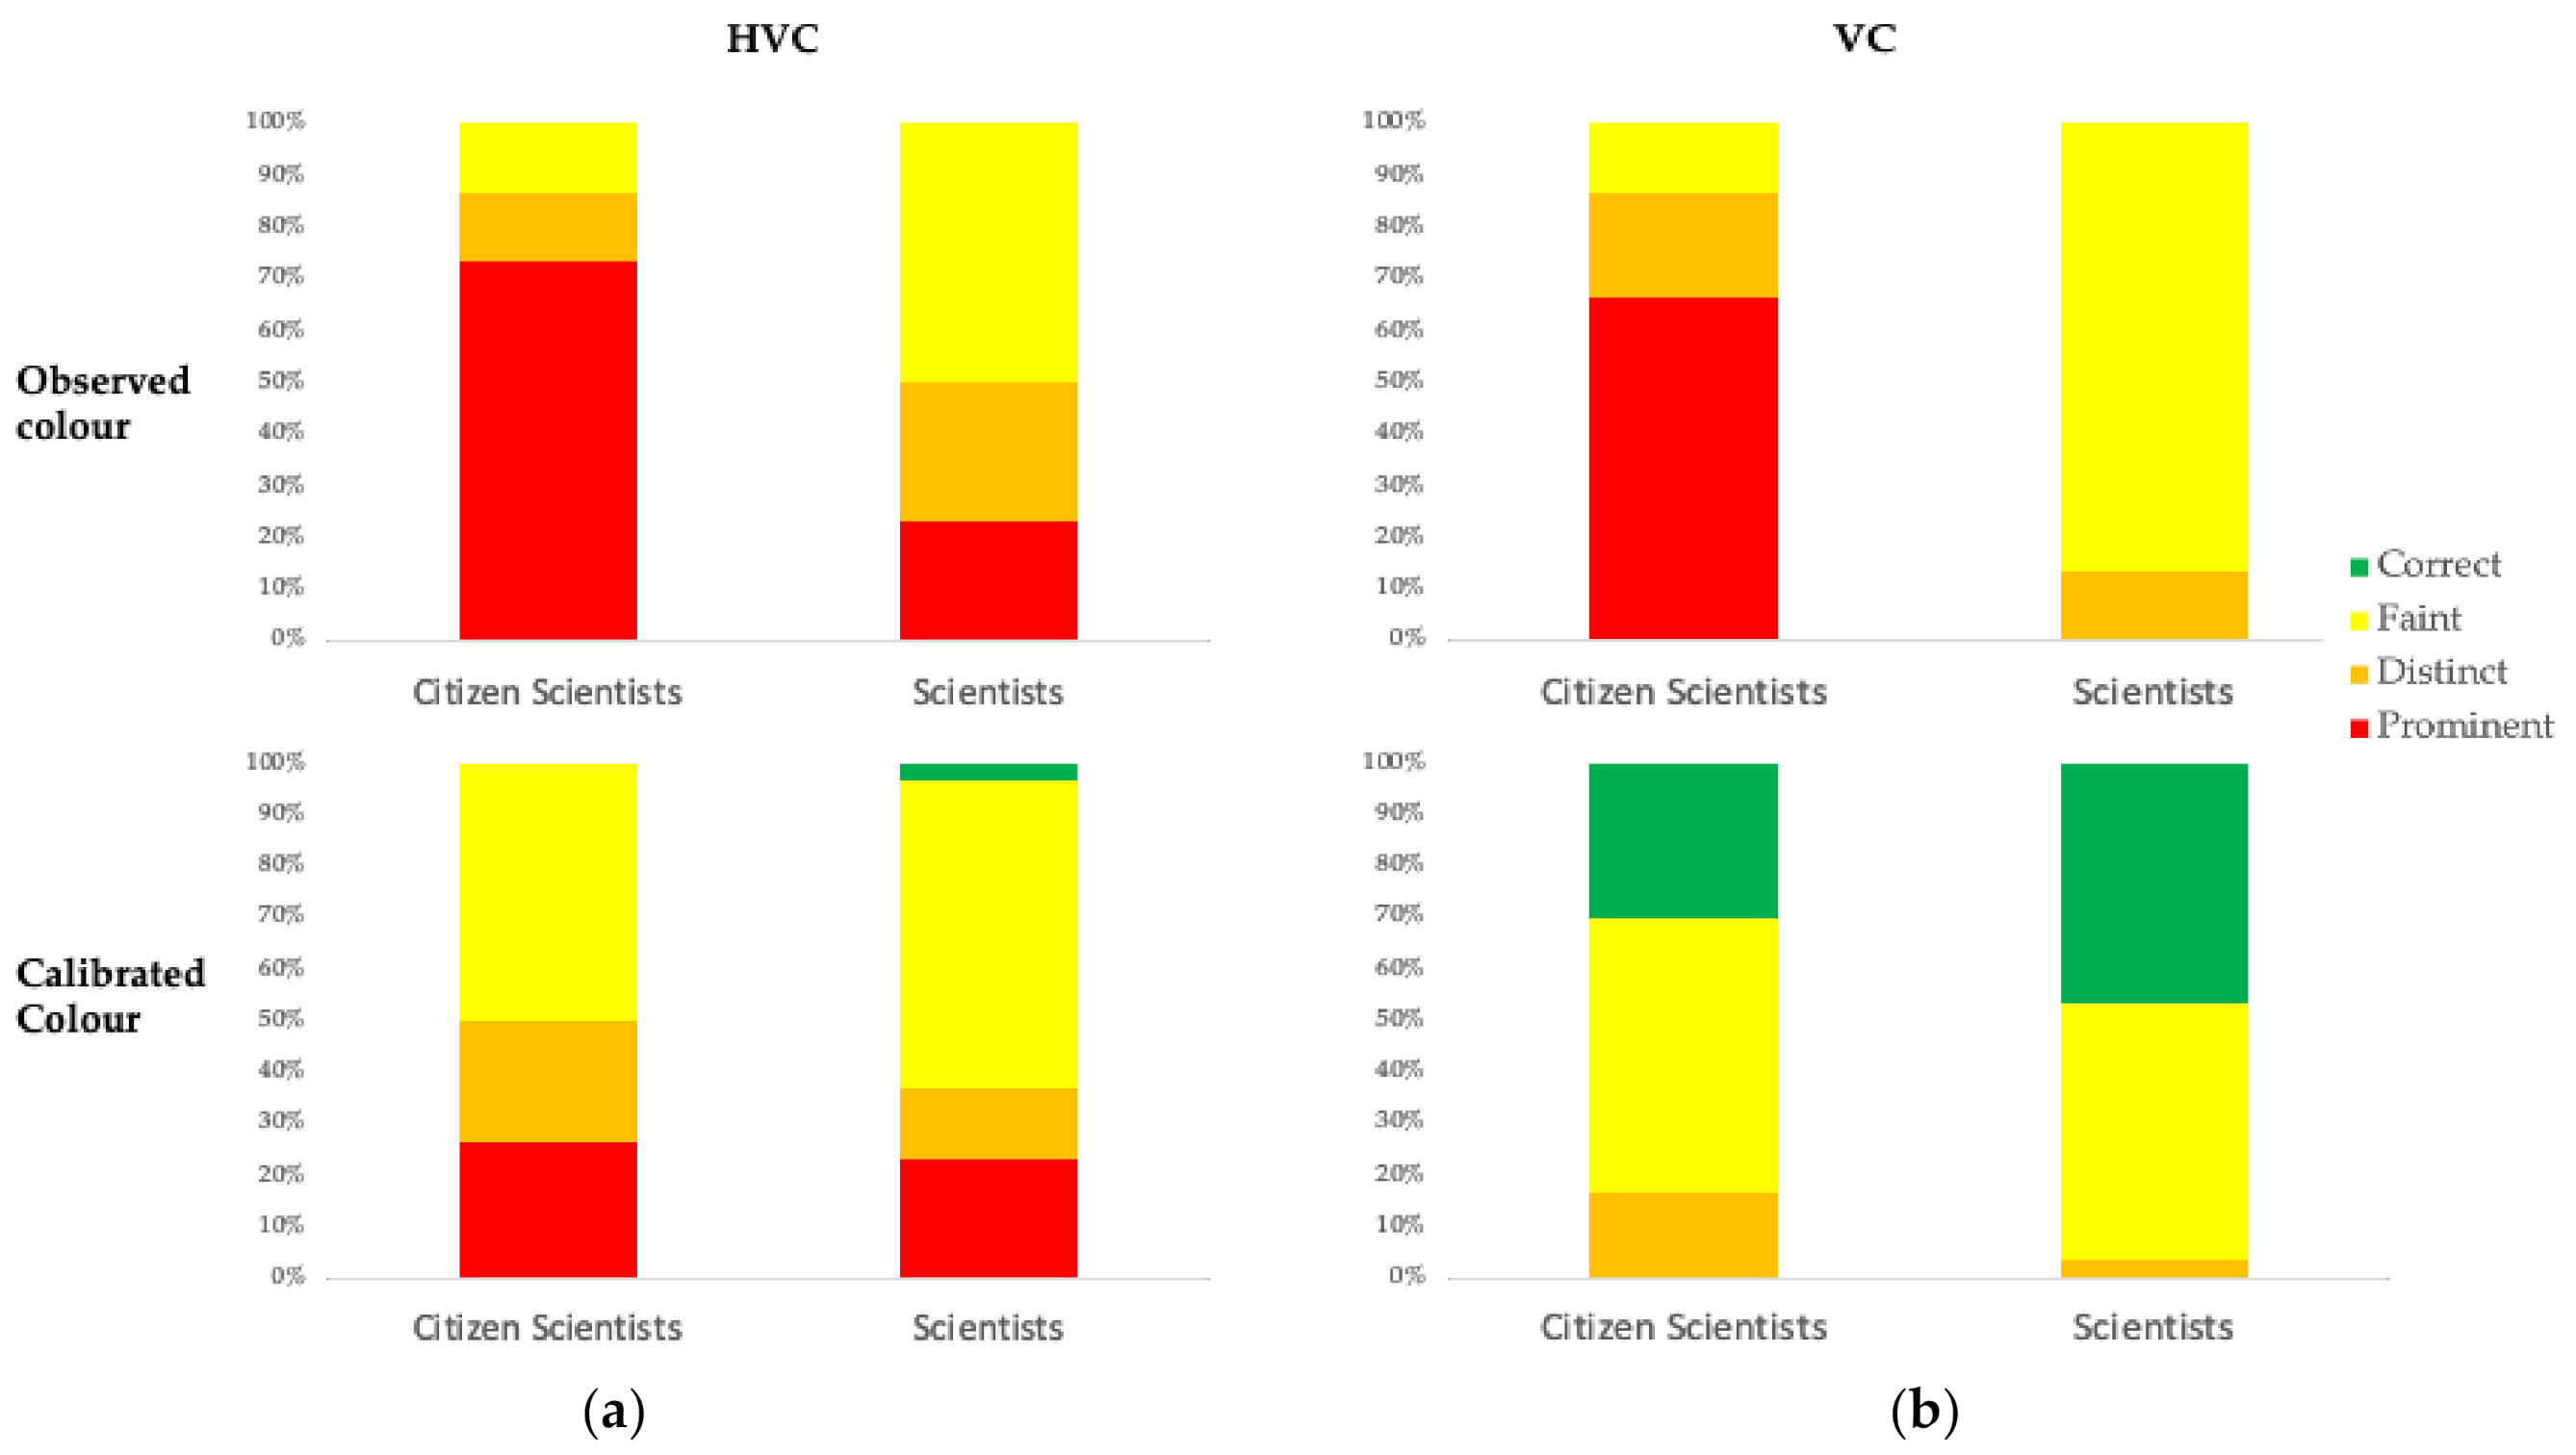
3.2. Comparison of Visual and Spectroscopic Soil Colour Measurements

Table 3 shows a statistical summary of the range, mean, and mode of colour attributes Munsell hue, value, and chroma determined by scientists, citizen scientists, and a spectrophotometer.
The reflectance data revealed that in our dataset, the soil colour (hue) ranged from 3.2 yellow-red (YR) to 3.2 yellow (Y), with approximately 77% of the soil samples in the yellow-red (YR) category, and 23% in the yellow (Y). A narrower hue range was determined by scientists in comparison with the spectrophotometer recordings, extending between three categories: 5 YR, 7.5 YR, and 10YR. 10YR was the most frequent hue page selected for soil samples. Citizen scientists used a single page (viz. 7.5 YR) from the 13 Munsell soil colour charts available for colour determination; hence, the analyses were not applicable for Munsell hue.
The range for the spectroscopic Munsell value was very narrow in comparison to the observed colour Munsell value for the same samples. The spectroscopic Munsell value varied from 3.5 to 3.8 (on average 3.7). Instead, citizen scientists had a highly dispersed range for the Munsell value from 3.0 to 8.0 (on average 5.0). Likewise, scientists’ range for the Munsell value varied from 1.0–4.0 (on average 2.7). A similar trend was observed for Munsell chroma, exhibiting the broadest range for citizen scientists’ visual assessments in comparison to spectroscopic recordings. While spectrally derived Munsell chroma values ranged from 1.3 to 3.5 (on average 2.4), citizen scientists’ chroma extended from 2.0 to 8.0 (on average 5.1). Instead, scientists’ Munsell chroma range was similar to spectrophotometer-measured chroma, varying from 1.0 to 4.0 (on average 1.6).
The relationship between observed colour parameters and those derived from spectral reflectance is plotted in Figure 3. There is a linear relationship between the observed and measured colour assessments for the same perceptual phenomena: Munsell value and chroma. The Munsell value shows the strongest correlation, with an R2 = 0.42 for scientists and R2 = 0.39 for citizen scientists compared to Munsell chroma: R2 = 0.26 and 0.19 for scientists and citizen scientists, respectively. Instead, no linear relationship was found for hue. Measured soil colour (Hue) extended from 44 to 88 degrees, yet visual estimates had a narrower range, from 59 to 74 degrees. On average, both observed and measured hue values fell within the yellow–red (YR) category.
We calculated the total colour difference between the observed and measured colour to validate the former, based on the assumption that spectrally derived colour measurements were the true soil colour. The relative frequency bar graph (Figure 4) shows there were significant differences between associated colours. Examining the three colour parameters hue, value, and chroma (HVC), 23% of scientists’ colour observations were classed as “prominent” errors (in red), contrasting strongly with true soil colour whereas 73% of citizen scientists’ colour assessments were “prominent” (Figure 4a). For the Munsell value and chroma (VC), colorimetric accuracy improved slightly for citizen scientists from 73% “prominent” errors to 67%, and improved greatly for scientists, with no “prominent” errors and 85% of the observations falling within the “faint” category, where the degree of colour difference is very low and only evident on very close examination (Figure 4b).
Colorimetric accuracy for calibrated colour observations improved significantly for both groups. Examining the three parameters (HVC), calibrated citizen scientists’ colour values improved from 73% of the measurements in the “prominent” category to 27% and it elevated the number of “faint” differences in colour from 13% to 50% (Figure 4a). Likewise, for scientists, the category of “distinct” or moderate colour errors (orange) lowered and the percentage of “faint” colour differences increased. This improvement was greatest when focusing only on the Munsell value and chroma attributes (Figure 4b). For citizen scientists, “prominent” errors lowered from 67% to 0%, the percentage of observations in the “faint” category increased to 53%, and 30% of the values showed an exact colour match (green) with the spectroscopic-measured colour. As for scientists, 47% of the calibrated values were classed as “correct,” and only 3% of the calibrated colour observations were categorised as “distinct” errors (orange).

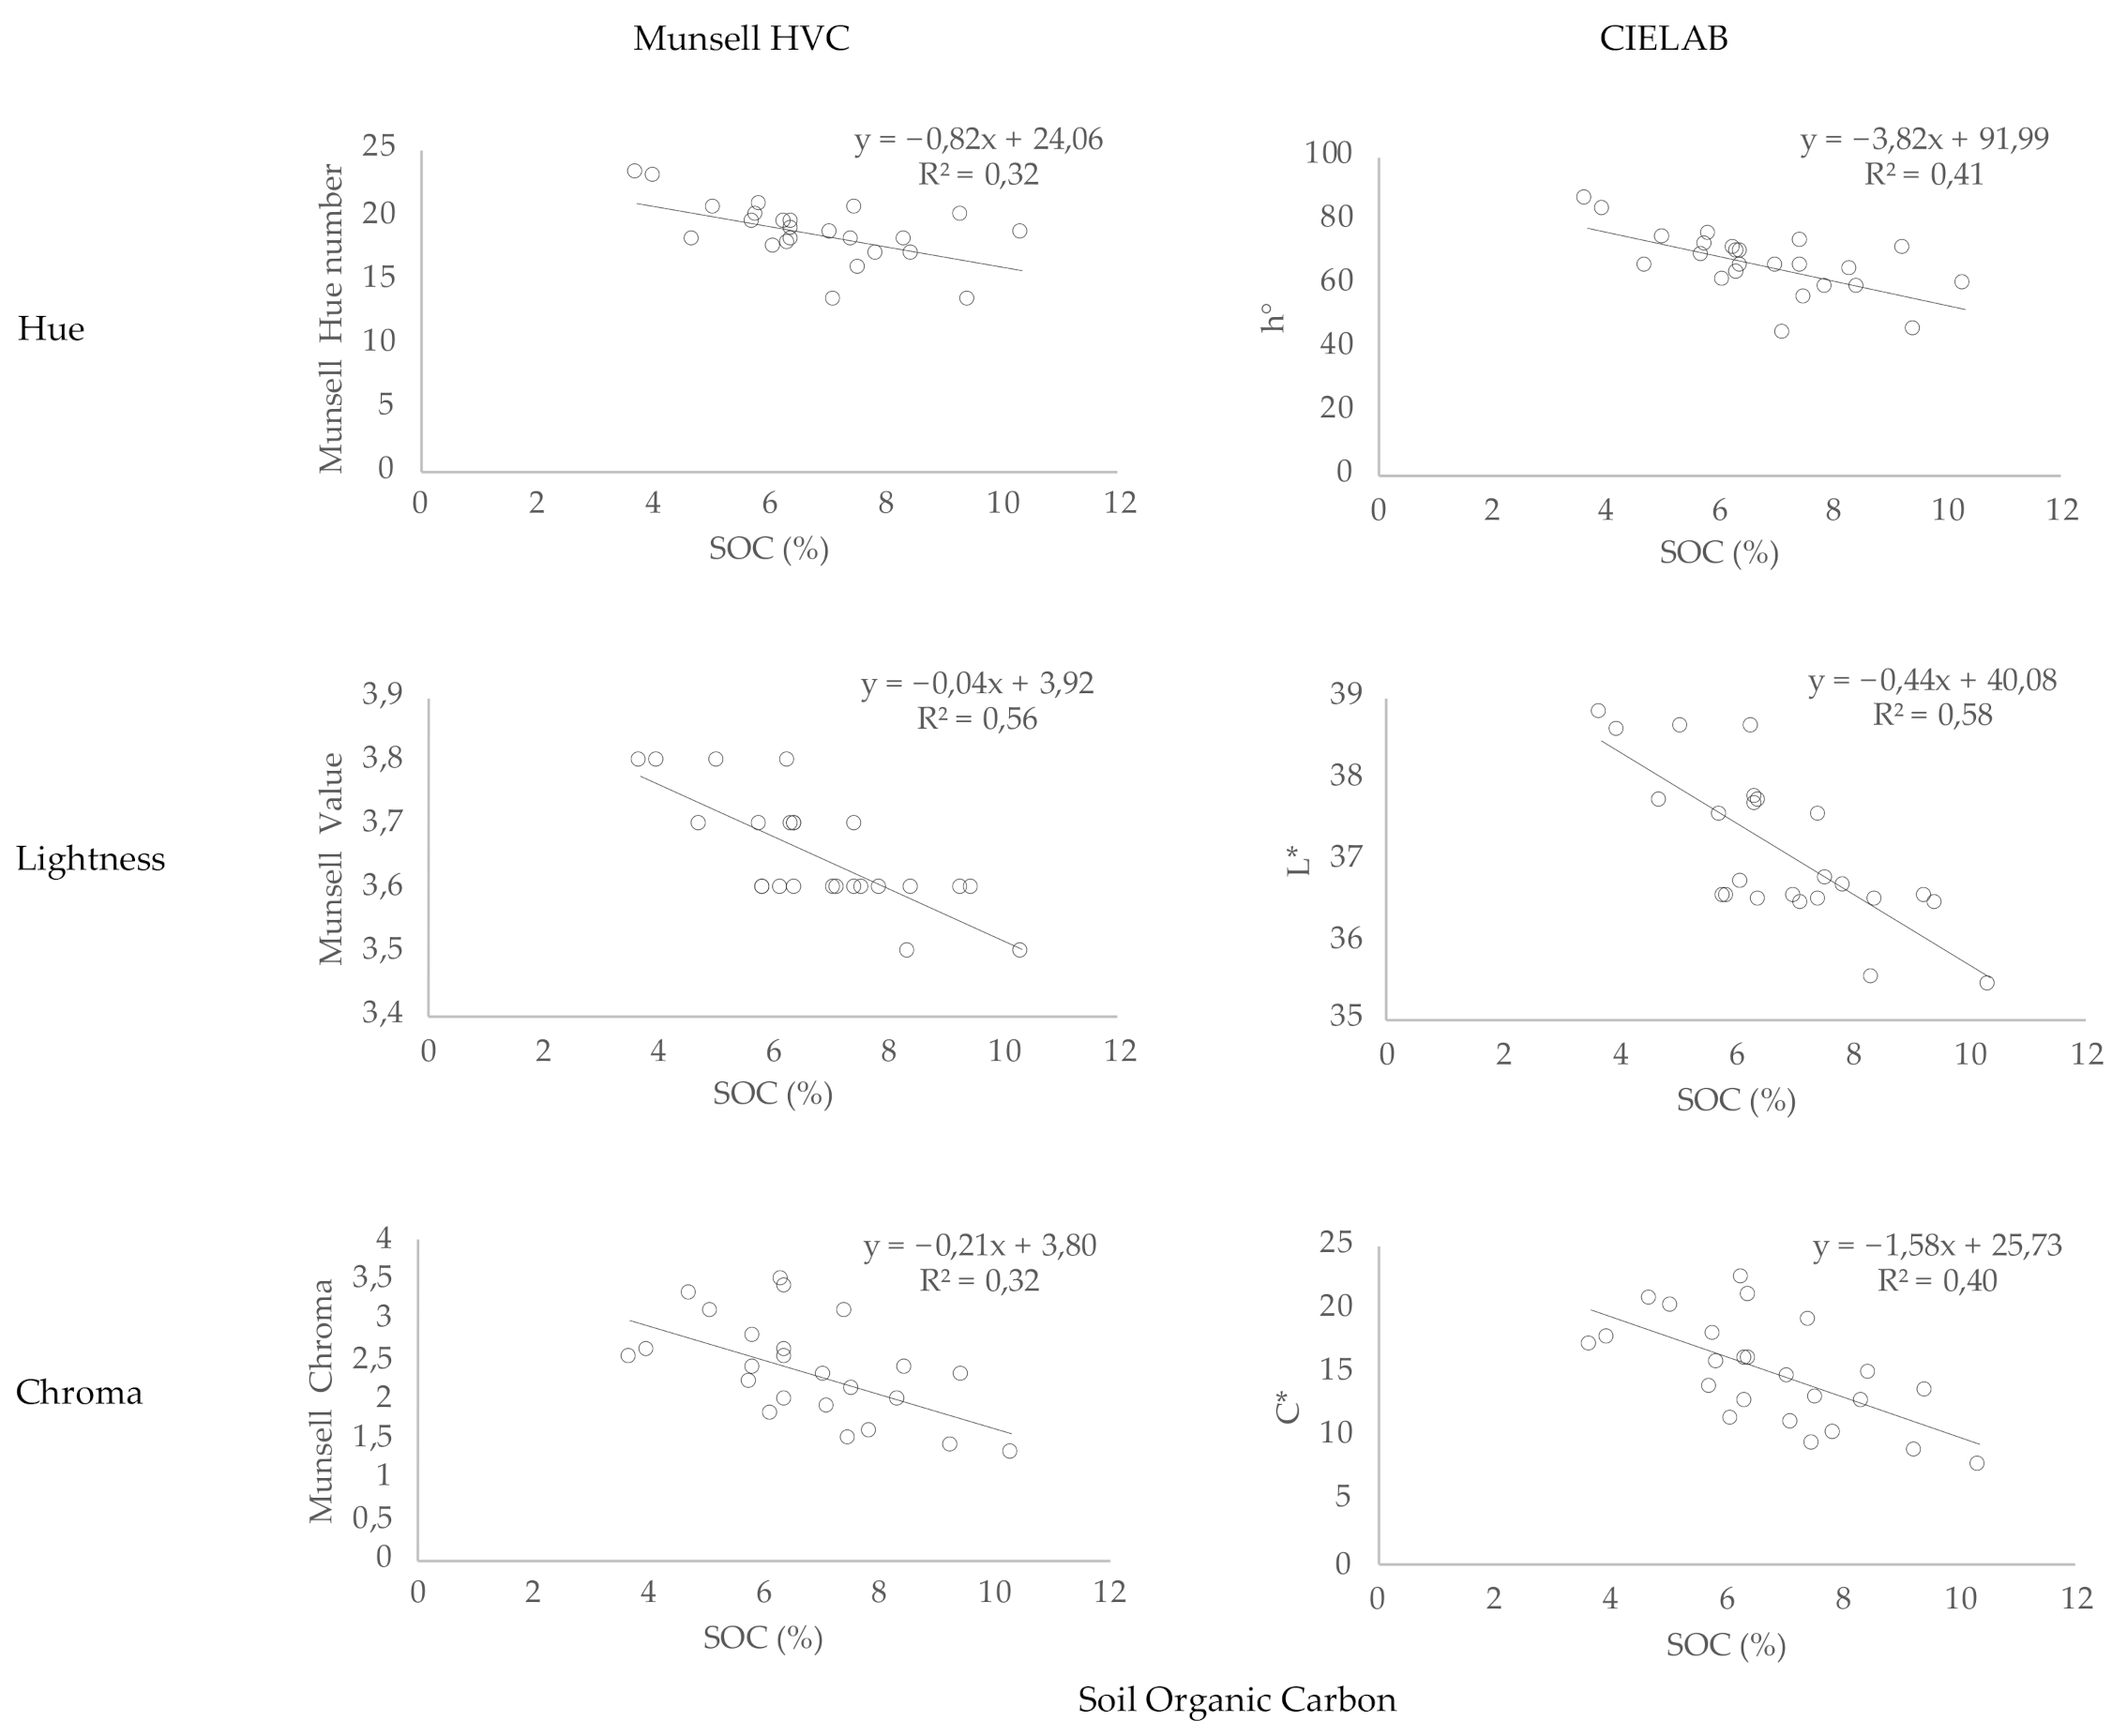
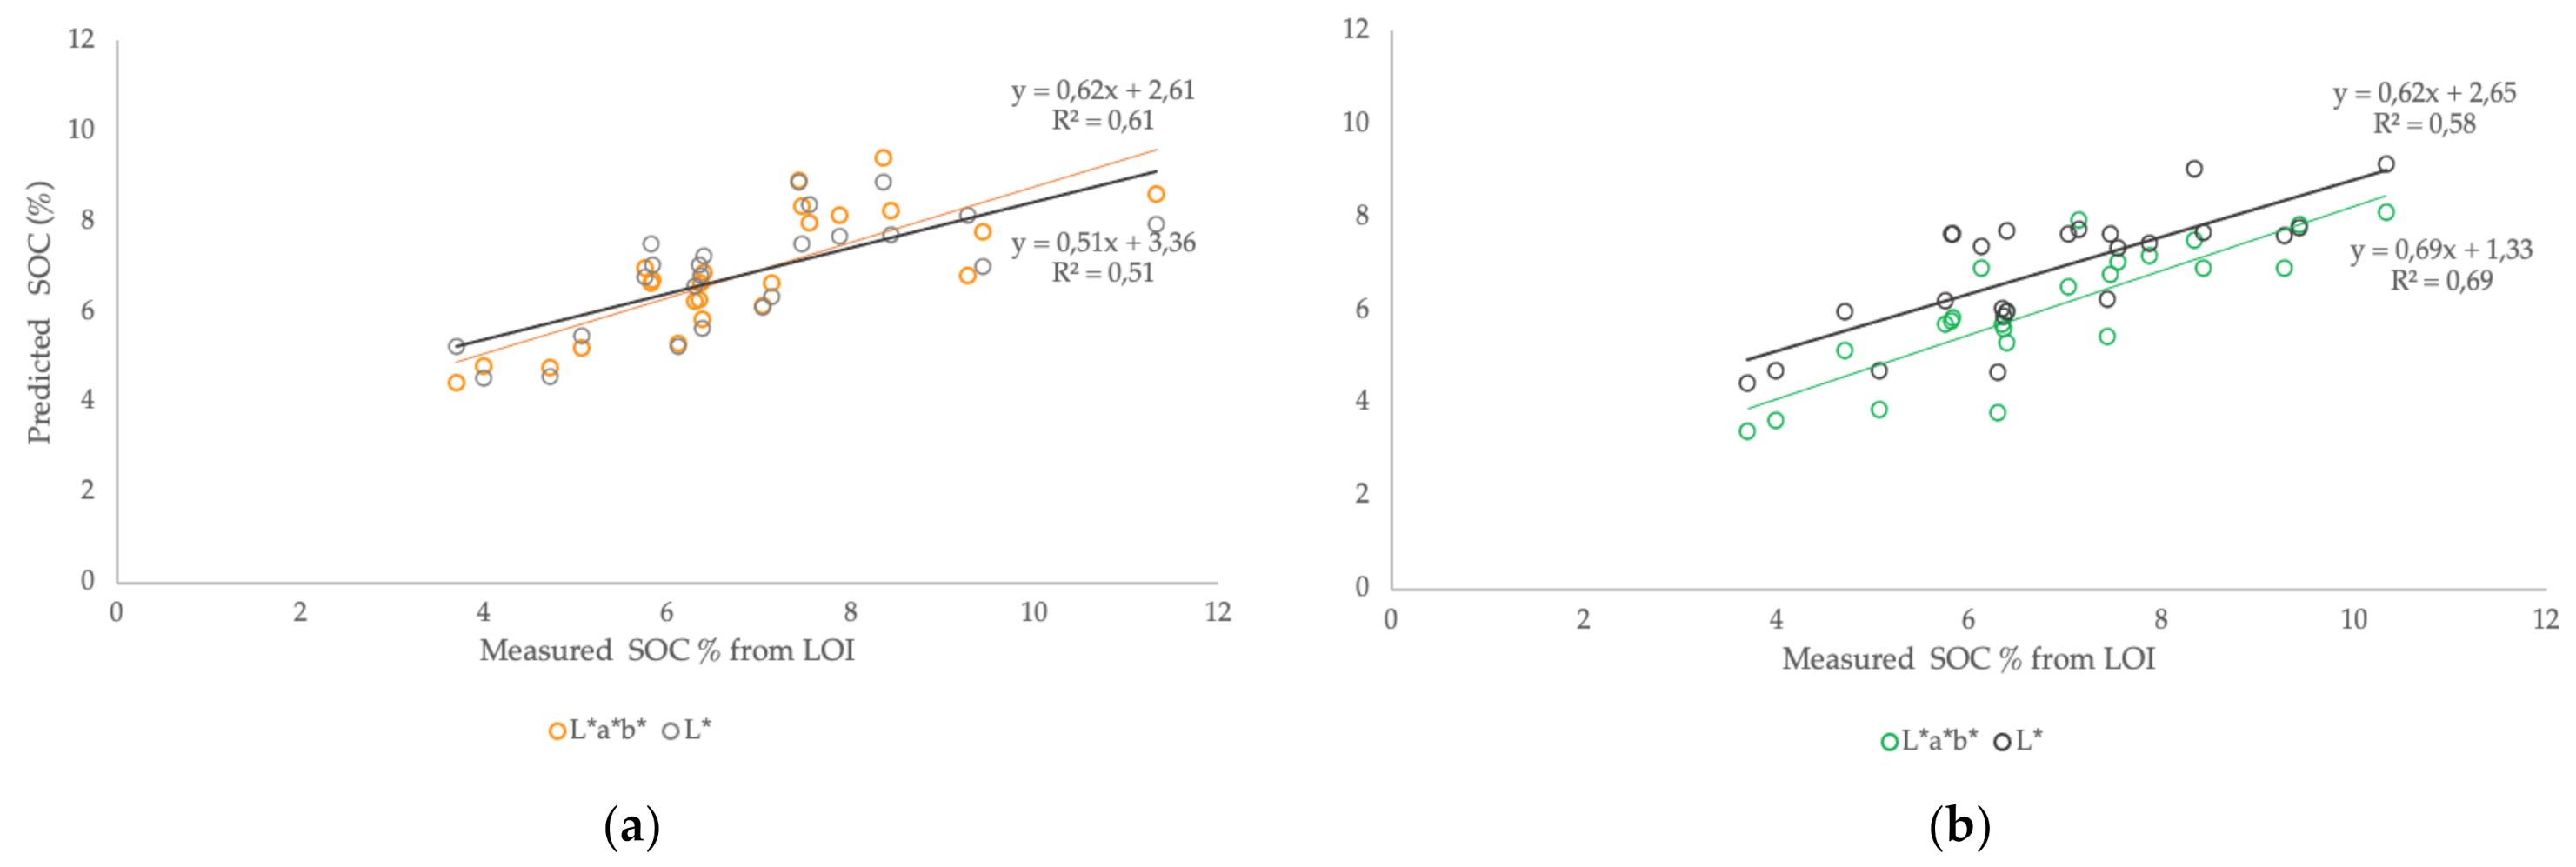
3.3. Soil Colour and Carbon

Figure 5 shows the extent to which “measured” spectrally derived colour attributes can be related to SOC. There is a negative, linear relationship for lightness (Munsell value or L*), saturation (Munsell chroma or C*), and dominant wavelength (hue number and h°) and SOC. The L* value or CIE lightness is the best predictor of SOC (R2 = 58). The CIELAB colour space improves the statistical relationship, with a higher R2 for the different colour components than the Munsell HVC system.
Figure 6 shows the relationship between the measured SOC from LOI with predicted SOC using a simple regression (L*) in black and a three-factor regression equation (L+A+B) for citizen scientists in orange, and spectrophotometer in green. The three-factor regression equation raised the correlation coefficient from R2 = 0.58 to 0.69 for spectrally derived colour and from R2 = 0.51 to 0.61 for citizen scientists.

4. Discussion

Measurement of soil organic carbon (SOC) stocks requires a large number of samples that are costly and time-consuming to analyse [8]. Thus, this study sought to evaluate efficient and accurate methods of predicting SOC contents using simple and rapid Munsell soil colour assessments as an alternative to conventional laboratory analyses, such as loss on ignition.
Our results support the immense potential for citizen scientists with minimal training to collect reliable soil colour data using the Munsell soil colour chart (MSCC). During 28 organized events, trained citizen scientists participating in our research project collected over 600 soil colour measurements, as well as other soil data that will be used in subsequent studies [54]. These big data sets that are collected rapidly go beyond the scope of traditional field researchers [24,25] and can help to overcome some of the barriers associated with current limitations in time and resources required for SOC reporting and mapping [8,11,13].
Here, we analysed a sub-sample of 540 visual soil colour measurements collected by citizen scientists and professional scientists by comparing them to each other and to an objective assessment of colour using a spectrophotometer. We found that the agreement in visual soil colour observations between appraisers over time for the same sample points or “repeatability” was low for our experiment for both scientists and citizen scientists alike. Colour observations from both groups had a wider range for the Munsell value and chroma than corresponding spectrophotometer readings. This is consistent with other studies that have found a lower percentage agreement for these colour attributes because observers making these measurements show a preference for extreme numbers to differentiate amongst similar colours [26,30]. This work brings up the potential biases in observer colour perception, and the dilemma of uncertainty in colour determination using MSCC that is routinely mentioned in the literature [20,30,33,34].
Yet, despite the variation between observers and the comparison of very different methods of colour identification, our data shows a linear relationship between traditional Munsell soil colour estimates and quantitative colour analyses for the same perceptual phenomena: value and chroma (Figure 3). The relationship is coherent but weak for both scientists (R2 = 0.42; R2 = 0.26) and citizen scientists (R2 = 0.39; R2 = 0.19) for lightness and chroma, respectively. Instead, no relationship was found for hue. Nevertheless, spectrally derived Munsell hue could not be used confidently in our study because the reproducibility of this parameter was low, showing a high dispersion from the mean (SD = 3.1) (Table 2).
We assessed the colorimetric accuracy or levels of colour difference between “observed” and “measured” colour attributes using the USDA standards (2017), based on the assumption that spectrally derived measurements were correct [43]. Our results demonstrate that the Munsell method can lead to significant errors for both scientists and citizen scientists. Although scientists determined colour more accurately than citizen scientists, overall, there was a high percentage of observations that contrast strongly with the spectrally derived colour values. For example, analysing three parameters (HVC), 23% of the colour observations for scientists were classified as “prominent” and contrasted strongly from spectral recordings for the same sampling locations whereas 73% of citizen scientists’ colour measurements were classed as “prominent”. These results contrast with earlier findings in the field that suggest there is a high overall agreement using this method. One of the most cited studies in the literature is Post et al.’s (1993) experiment, which states that 52% of soil scientists agreed on all three colour components [35]. Instead, our findings are similar to more recent studies that indicate a very low overall agreement of appraisers vs. the standard, such as Marqués-Mateu et al.’s (2018) experiment (<5%) [30]. Like Marqués-Mateu et al. (2018), we examined a larger data set and used an objective standard (viz. spectrophotometer) to assess the reliability of the Munsell method, whereas past experiments were based on very few samples (<20) and only tested consistency in colour-matching between appraisers [30,35].
This work brings up one of the primary drawbacks of using the MSCC for any observer: the variation in individual perception of soil colour [20,29,31,32,33,34,35]. However, aside from the observer’s sensitivities, there are numerous other psychophysical and physical factors that users have identified as potential sources of discrepancy in the results [37], including (1) sample characteristics (e.g., size, roughness), (2) environmental conditions (e.g., moisture content, lighting conditions) [31], and (3) difficult statistical analysis (e.g., limited colour chips, cylindrical colour coordinates) [32,33].
Instead, our results demonstrate that using the spectrophotometer allowed a more sensitive and precise measure of colour. We took five repeated measures of the same soil solution and the low standard deviations and coefficient of variations for the Munsell value and chroma showed the high reproducibility of this technique (Table 2). A quantitative approach to colour determination can overcome some of the limitations of the Munsell method by removing the human ‘judgement’ from the analysis and controlling the conditions of the measurement (e.g., using standard values for the observer viewing angle and fixed lightning conditions). This is on par with studies showing that modern technologies and instrumental methods, such as UV VIS spectrophotometry, offer an accurate means for analysing and measuring soil colour [8,9,16,19,22,23,26,37,38,39]. For this reason, quantitative measures of colour have seen apparent exponential growth worldwide and there are new applications of colour data in different fields [16,37].
Nevertheless, at this point, spectrophotometers are not a simple replacement for Munsell soil colour books because they are substantially more expensive, require a laboratory, and are time-consuming [8,37]. Thus, pending the development of portable and affordable spectrophotometers or other quantitative field devices [11,29], colour assessments using Munsell charts will remain the standard practice for a variety of reasons, including cost, facility, rapidity, and familiarity with the measurement process, particularly in the Global South [8,23,37,39].
Therefore, in our study, we tested the opportunity of improving the reliability of Munsell visual estimates by calibrating observations through spectroscopy using the CIELAB colour space. Our results indicate that the calibration was successful, with colorimetric accuracy increasing significantly for both groups, particularly when focusing only on the following colour components: Munsell value and chroma (Figure 4b). For citizen scientists, “prominent” errors dropped from 67% to 0%, the percentage of “faint” errors increased to 53%, and 30% of the calibrated observations were an exact match and labelled as “correct”. As for scientists, 47% of the calibrated values were classified as “correct”, and there were only 3% “distinct” errors. These results suggest that this is a promising avenue to complement traditional Munsell colour assessments, while ensuring more reliable colour identification. Moreover, it emphasizes the importance of using the contemporary CIELAB colour space in soil science to calibrate soil colour observations using ΔL*, Δa*, and Δb*, and for numerical statistical or predictive analyses [16,21,22,52]. This colour space overcomes many of the limitations of the Munsell, while retaining a similar perceptual framework that is familiar to soil scientists [32,39,52].
Further work in this area is essential because soil colour is relied on heavily in soil science for a wide variety of practical applications. In particular, our results indicate the importance of calibrating Munsell soil colour assessments for their potential use in SOC estimation. We found that there is a strong negative correlation between soil lightness (L*) and SOC. In other words, soil lightness decreases linearly as the content of organic matter increases. This trend is well documented in the literature and widely accepted [8,9,16,20,22]. However, our results demonstrate that to account for the SOC in soils more accurately, it is important to use all three colour components (L + A + B) instead of a single linear regression with soil lightness (L*). This three-factor regression strengthens the statistical relationship from R2 = 0.51 to 0.61 for citizen scientists (Figure 6a) and R2 = 0.58 to 0.69 for the spectrophotometer (Figure 6b). It supports that the organic carbon content not only affects the lightness or neutralization of white pigments but also influences other colour pigments (e.g., red, yellow, and green). These results coincide with work by Liles et al. (2013) and Vodyanitskii and Savichev (2017) that supports the use of three-factor regressions for stronger soil colour–SOC predictive relationships [9,22].
Furthermore, this study demonstrates that soil colour gathered by citizen scientists for soil colour–SOC estimations is comparable with results obtained from spectrally derived colour (R2 = 0.58 ∼ 0.69). This reinforces the potential use of calibrated Munsell soil colour measurements collected by citizen scientists as a cost-effective and time-saving method for the spatio-temporal monitoring of SOC. Widespread participation in colour determination could significantly accelerate the work of traditional scientists because of the capacity of these projects to provide large sample numbers and survey vast geographical areas [8,11,13,55]. This would overcome some of the barriers associated with conventional laboratory methods, such as loss on ignition, which are inadequate for large-scale monitoring of SOC stock changes since they are time- and cost-intensive and laborious [1,8,9,10,11,12,55]. Soil colour–SOC predictions could provide a detailed assessment of SOC over time and space, which is key to better understanding SOC changes within and between landscapes to implement effective SOC management strategies [1].
We suggest further developments to (1) establish universal protocols for soil spectroscopy to be able to calibrate observations and compare data amongst studies [11,56]; (2) explore soil colour–SOC relationships using the CIELAB space in conjunction with other important climate and soil characteristics, such as illumination, moisture, and texture for stronger soil colour–SOC predictions similarly to recent studies [29,56,57,58,59]; and (3) increase the size of the dataset and the study area to construct a robust database that is representative of soil variability [8,11].

5. Conclusions

This work sheds light on the use of simple Munsell soil colour assessments for estimating SOC. The main challenge is that soil colour determination using the MSCC is subjective and there is concern over low overall agreement amongst measurements made by scientists and citizen scientists. Therefore, we developed a quantitative method to measure “true” soil colour using a spectrophotometer and calibrated soil colour observations using the modern CIELAB colour system to increase their accuracy.
Our results indicate that colorimetric accuracy increased significantly for both groups, particularly when focusing on the colour components: Munsell value and chroma. This work represents an important step towards improving visual colour determination in soil science for reliable SOC estimation.
Additionally, our findings demonstrate that soil colour–SOC estimations from data collected by citizen scientists are comparable to scientists and to spectrally derived colour predictions, highlighting the potential use of these projects as an alternative to support or, to some extent, replace time-consuming and more expensive SOC laboratory analyses with methods, such as loss on ignition.
Similar to other studies, our results show that soil colour lightness (L*) (or Munsell value) is an effective predictor of SOC, with soil lightness decreasing linearly as organic carbon increases. However, we emphasize the importance of using a three-factor regression, with all the three colour characteristics (L + A + B), to account for organic carbon in soils more accurately.
The next steps are to strengthen soil colour–SOC predictions with important soil characteristics, such as moisture and texture data, and construct a robust database that is representative of different soil landscapes.

Author Contributions

Conceptualization, N.F.J., J.C. and M.L.C.; methodology, N.F.J.; formal analysis, N.F.J.; investigation, N.F.J. and V.S.; data curation, V.S., N.F.J. and M.L.C; writing—original draft preparation, N.F.J.; writing—review and editing, J.C., M.L.C. and H.G.; visualization, N.F.J.; supervision, J.C., M.L.C. and H.G.; project administration, M.L.C. and J.C.; funding acquisition, M.L.C. and J.C. All authors have read and agreed to the published version of the manuscript.

Funding

This research was funded through the Earthwatch Institute and HSBC Sustainable Cities (SuCi) project. Ferrando-Jorge was also supported by a University of Reading Studentship, co-funding by the School of Geography and Environmental Science and the Earthwatch SuCi project.

Institutional Review Board Statement

The study was conducted according to the guidelines of Earthwatch Europe Institution. All subjects gave their informed consent for inclusion before they participated in the study.

Informed Consent Statement

Not applicable.

Data Availability Statement

The raw data supporting the conclusions of this article will be made available by the authors, without undue reservation.

Acknowledgments

We thank the Citizen Scientists for their participation in the research by their willingness to learn and collect data; Earthwatch for co-designing the field methods, managed the project and delivered the field training events as well as Imperial College London and INRA academics that supported in the field; and thanks University of Reading Technical Services for their support with laboratory work.

Conflicts of Interest

The authors declare no conflict of interest.

References

  1. Lefèvre, C.; Rekik, F.; Viridiana, A.; Liesl, W. Soil Organic Carbon. The Hidden Potential; Food and Agriculture Organization of the United Nations (FAO): Rome, Italy, 2017; pp. 1–76. Available online: www.fao.org/3/i6937e/i6937e.pdf (accessed on 1 April 2021).
  2. Scharlemann, J.; Tanner, E.; Hiederer, R.; Kapos, V. Global Soil Carbon: Understanding and Managing the Largest Terrestrial Carbon Pool. Carbon Manag. 2014, 5, 81–91. [Google Scholar] [CrossRef]
  3. Merrington, G.; Fishwick, S.; Barraclough, D.; Morris, J.; Preedy, N.; Bourcard, T.; Reeve, M.; Smith, P.; Fang, C. The Development and Use of Soil Quality Indicators for Assessing the Role of Soil in Environmental Interactions; Environmental Agency: Bristol, UK, 2006. Available online: https://assets.publishing.service.gov.uk/government/uploads/system/uploads/attachment_data/file/290729/scho0306bkiq-e-e.pdf (accessed on 5 April 2021).
  4. Setälä, H.; Bardgett, R.; Birkhofer, K.; Brady, M.; Byrne, L.; de Ruiter, P.; de Vries, F.; Gardi, C.; Hedlund, K.; Hemerik, L.; et al. Urban and Agricultural Soils: Conflicts and Trade-Offs in the Optimization of Ecosystem Services. Urban Ecosyst. 2013, 17, 239–253. [Google Scholar] [CrossRef]
  5. Kumar, K.; Hundal, L. Soil in the City: Sustainably Improving Urban Soils. J. Environ. Qual. 2016, 45, 2–8. [Google Scholar] [CrossRef] [PubMed]
  6. Zomer, R.; Bossio, D.; Sommer, R.; Verchot, L. Global Sequestration Potential of Increased Organic Carbon in Cropland Soils. Sci. Rep. 2017, 7, 15554. [Google Scholar] [CrossRef] [Green Version]
  7. Lal, R. Soil carbon sequestration impacts on global climate change and food security. Science 2004, 304, 1623–1627. [Google Scholar] [CrossRef] [Green Version]
  8. Wills, S.; Sandor, J.; Burras, L. Prediction of soil organic carbon content using field and laboratory measurements of soil color. Soil Sci. Soc. Am. J. 2007, 71, 380–388. [Google Scholar] [CrossRef]
  9. Liles, G.; Beaudette, D.; O-Geen, A.; Horwath, W. Developing predictive soil C models for soils using quantitative color measurements. Soil Sci. Soc. Am. J. 2013, 77, 2173–2181. [Google Scholar] [CrossRef]
  10. Smith, P.; Soussana, J.; Angers, D.; Schipper, L.; Chenu, C.; Rasse, D.; Batjes, N.; Egmond, F.; McNeill, S.; Kuhnert, M.; et al. How to Measure, Report and Verify Soil Carbon Change to Realize the Potential of Soil Carbon Sequestration for Atmospheric Greenhouse Gas Removal. Glob. Chang. Biol. 2019, 26, 219–241. [Google Scholar] [CrossRef] [PubMed] [Green Version]
  11. Angelopoulou, T.; Balafoutis, A.; Zalidis, G.; Bochtis, D. From Laboratory to Proximal Sensing Spectroscopy for Soil Organic Carbon Estimation—A Review. Sustainability 2020, 12, 433. [Google Scholar] [CrossRef] [Green Version]
  12. Vanguelova, E.; Bonifacio, E.; De Vos, B.; Hoosbeek, M.; Berger, T.; Vesterdal, L.; Armolaitis, K.; Celi, L.; Dinca, L.; Kjønaas, O.; et al. Sources of Errors and Uncertainties in the Assessment of Forest Soil Carbon Stocks at Different Scales—Review and Recommendations. Environ. Monit. Assess. 2016, 188, 630. [Google Scholar] [CrossRef]
  13. Gholizadeh, A.; Saberioon, M.; Viscarra Rossel, R.; Boruvka, L.; Klement, A. Spectroscopic Measurements and Imaging of Soil Colour for Field Scale Estimation of Soil Organic Carbon. Geoderma 2020, 357, 113972. [Google Scholar] [CrossRef]
  14. Soil Survey Staff. Soil Taxonomy: A Basic System of Soil Classification for Making and Interpreting Soil Surveys, 2nd ed.; U.S. Dept. of Agriculture, Natural Resources Conservation Service: Washington, DC, USA, 1999.
  15. Leone, A.; Escadafal, R. Statistical analysis of soil colour and spectroradiometric data for hyperspectral remote sensing of soil properties (example in a southern Italy Mediterranean ecosystem). Int. J. Remote Sens. 2001, 22, 2311–2328. [Google Scholar] [CrossRef]
  16. Viscarra-Rossel, R.; Minasny, B.; Roudier, P.; McBratney, A. Colour space models for soil science. Geoderma 2006, 133, 320–337. [Google Scholar] [CrossRef]
  17. Brady, N.; Weil, R. Elements of the Nature and Properties of Soils; Pearson Prentice Hall: Boston, MA, USA, 2008. [Google Scholar]
  18. United States Department of Agriculture (USDA). Soil Color. USDA. 2020. Available online: https://www.nrcs.usda.gov/wps/portal/nrcs/detail/wi/soils/?cid=NRCSEPRD1370419 (accessed on 10 April 2021).
  19. Aitkenhead, M.; Coull, M.; Towers, W.; Hudson, G.; Black, H. Prediction of Soil Characteristics and Colour Using Data from The National Soils Inventory of Scotland. Geoderma 2013, 200–201, 99–107. [Google Scholar] [CrossRef]
  20. Torrent, J.; Barrón, V. Laboratory measurements of soil color: Theory and practice. Soil Sci. Soc. Am. 1993, 31, 21–33. [Google Scholar]
  21. Konen, M.; Burras, C.; Sandor, J. Organic carbon, texture, and quantitative color measurement relationships for cultivated soils in north central Iowa. Soil Sci. Soc. Am. J. 2003, 67, 1823. [Google Scholar] [CrossRef]
  22. Vodyanitskii, Y.; Savichev, A. The influence of organic matter on soil color using the regression equations of optical parameters in the system CIE- L*a*b*. Ann. Agrar. Sci. 2017, 15, 380–385. [Google Scholar] [CrossRef]
  23. Rabenhorst, M.; Schmehling, A.; Thompson, J.; Hirmas, D.; Graham, R.; Rossi, A. Reliability of soil color standards. Soil Sci. Soc. Am. J. 2015, 79, 193–199. [Google Scholar] [CrossRef]
  24. Dickinson, J.; Zuckerberg, B.; Bonter, D. Citizen science as an ecological research tool: Challenges and benefits. Annu. Rev. Ecol. Evol. Syst. 2010, 41, 149–172. [Google Scholar] [CrossRef] [Green Version]
  25. Liu, Y.; Qiu, M.; Liu, C.; Guo, Z. Big data challenges in ocean observation: A survey. Pers. Ubiquitous Comput. 2017, 21, 55–65. [Google Scholar] [CrossRef]
  26. Barrett, L. Spectrophotometric colour measurement in situ in well drained sandy soils. Geoderma 2002, 108, 49–77. [Google Scholar] [CrossRef]
  27. Sánchez-Marañón, M.; Delgado, G.; Delgado, R.; Pérez, M.; Melgosa, M. Spectroradiometric and visual color measurements of disturbed and undisturbed soil samples. Soil Sci. 1995, 160, 291–303. [Google Scholar] [CrossRef]
  28. Sánchez-Marañón, M.; Huertas, R.; Melgosa, M. Colour variation in standard soil-colour charts. Aust. J. Soil Resour. 2005, 43, 827–837. [Google Scholar] [CrossRef]
  29. Sánchez-Marañón, M.; García, P.; Huertas, R.; Hernández-Andrés, J.; Melgosa, M. Influence of Natural Daylight on Soil Color Description: Assessment Using a Color-Appearance Model. Soil Sci. Soc. Am. J. 2011, 75, 984–993. [Google Scholar] [CrossRef]
  30. Marqués-Mateu, Á.; Moreno-Ramón, H.; Balasch, S.; Ibáñez-Asensio, S. Quantifying the uncertainty of soil colour measure-ments with Munsell charts using a modified attribute agreement analysis. Catena 2018, 171, 44–53. [Google Scholar] [CrossRef]
  31. Mouazen, A.; Karoui, R.; Deckers, J.; De Baerdemaeker, J.; Ramon, H. Potential of visible and near-infrared spectroscopy to derive colour groups utilising the Munsell soil colour charts. Biosyst. Eng. 2007, 97, 131–143. [Google Scholar] [CrossRef]
  32. Kirillova, N.; Vodyanitskii, Y.; Sileva, T. Conversion of soil color parameters from the Munsell System to the CIE-Lab System. Eurasian Soil Sci. 2014, 48, 468–475. [Google Scholar] [CrossRef]
  33. Stiglitz, R. Evaluation of an Inexpensive Sensor to Measure Soil Color. All Theses 2016, 2367. Available online: https://tigerprints.clemson.edu/all_theses/2367 (accessed on 1 June 2021).
  34. Gómez-Robledo, L.; López-Ruiz, N.; Melgosa, M.; Palma, A.; Capitan-Vallvey, L.; Sánchez-Marañon, M. Using the mobile phone as Munsell soil-colour sensor: An experiment under controlled illumination conditions. Comput. Electron. Agric. 2013, 99, 200–208. [Google Scholar] [CrossRef]
  35. Post, D.; Levine, S.; Bryant, R.; Mays, M.; Batchily, K.; Escadafal, R.; Huete, A. Correlations between field and laboratory measurements of soil color. In Soil Color; Bigham, J., Ciolkosz, E., Eds.; SSSA. Special Publication 31; SSSA: Madison, WI, USA, 1993; pp. 35–50. [Google Scholar]
  36. IUSS Working Group (WRB). World Reference Base for Soil Resources; World Soil Resources Reports No. 103; FAO: Rome, Italy, 2006. [Google Scholar]
  37. Bloch, L.; Hosen, J.; Kracht, E.; LeFebvre, M.; Jazmine-Lopez, C.; Woodcock, R.; Keegan, W. Is it better to be objectively wrong or subjectively right?: Testing the accuracy and consistency of the Munsell capsure spectrocolorimeter for archaeological applications. Adv. Archaeol. Pract. 2021, 9, 132–144. [Google Scholar]
  38. Doi, R.; Wachrinrat, C.; Teejuntuk, S.; Sakurai, K.; Sahunalu, P. Semiquantitative color profiling of soils over a land degradation gradient in Sakaerat, Thailand. Environ. Monit. Assess. 2010, 170, 301–309. [Google Scholar] [CrossRef] [PubMed]
  39. Warr, B. Soil Colour; INSEAD: Fontainebleau, Singapore, 2015. [Google Scholar]
  40. Turk, J.; Rebecca, Y. Field Conditions and the Accuracy of Visually Determined Munsell Soil Color. Soil Sci. Soc. Am. J. 2020, 84, 163–169. [Google Scholar] [CrossRef]
  41. Climate-Data. Climate: Europe. 2020. Available online: https://en.climate-data.org/europe/ (accessed on 20 June 2021).
  42. Dean, W. Determination of carbonate and organic matter in calcareous sediments and sedimentary rocks by loss on ignition: Comparison with other methods. J. Sediment. Petrol. 1974, 44, 242–248. [Google Scholar]
  43. United States Department of Agriculture (USDA). Soil Survey Manual. Agriculture Handbook No. 18. 2017. Available online: https://www.iec.cat/mapasols/DocuInteres/PDF/Llibre50.pdf (accessed on 20 April 2021).
  44. Nelson, D.; Sommers, L. Total carbon, organic carbon, and organic matter. In Methods of Soil Analysis: Part 3. Chemical Methods; Sparks, D., Ed.; SSSA Book Series No. 5; SSSA-ASA: Madison, WI, USA, 1996; pp. 961–1010. [Google Scholar]
  45. Munsell, A. Munsell Soil Color Charts; Munsell Color Company: Baltimore, MD, USA, 1975. [Google Scholar]
  46. Wyszecki, G.; Stiles, W. Concepts and Methods. Quantitative Data and Formulae, 2nd ed.; Wiley-Interscience Publication: New York, NY, USA, 1982. [Google Scholar]
  47. Stiles, W.; Burch, J.N.P.L. Colour matching investigation: Final report (1958). Opt. Acta 1959, 6, 1–26. [Google Scholar] [CrossRef]
  48. Shields, J.; Arnaud, R.; Paul, E.; Clayton, J. Measurement of soil color. Can. J. Soil Sci. 1966, 46, 83–90. [Google Scholar] [CrossRef] [Green Version]
  49. Fernández, R.; Schulze, D. Calculation of soil color from reflectance spectra. Soil Sci. Soc. Am. J. 1987, 51, 1277–1282. [Google Scholar] [CrossRef]
  50. Guild, J. The colorimetric properties of the spectrum. Philos. Trans. R. Soc. A 1931, 230, 149–187. [Google Scholar]
  51. CIE. Colorimetry—Part 4: CIE 1976 L*a*b* Colour Space (Report). Draft Standard. 2007. Available online: http://cie.co.at/publications/colorimetry-part-4-cie-1976-lab-colour-space-1 (accessed on 10 April 2021).
  52. Hurst, V. Visual estimation of iron in saprolite. Geol. Soc. Am. Bull. 1977, 88, 174–176. [Google Scholar] [CrossRef]
  53. Vodyanitskii, Y.; Kirillova, N. Conversion of Munsell color coordinates to Cie-L*a*b* system: Tables and calculation examples. Mosc. Univ. Soil Sci. Bull. 2016, 71, 139–146. [Google Scholar] [CrossRef]
  54. Pudifoot, B.; Cárdenas, M.; Buytaer, W.; Paul, J.; Narraway, C.; Loiselle, S. When it rains, it pours: Integrating citizen science methods to understand resilience of urban green spaces. Front. Water 2021, 3, 33. [Google Scholar] [CrossRef]
  55. Kosmala, M.; Wiggins, A.; Swanson, A.; Simmons, B. Assessing data quality in citizen science. Front. Ecol. Environ. 2016, 10, 551–560. [Google Scholar] [CrossRef] [Green Version]
  56. Moritsuka, N.; Matsuoka, K.; Katsura, K.; Sano, S.; Yanai, J. Soil color analysis for statistically estimating total carbon, total nitrogen and active iron contents in Japanese agricultural soils. Soil Sci. Plant Nutr. 2014, 60, 475–485. [Google Scholar] [CrossRef] [Green Version]
  57. Spielvogel, S.; Knicker, H.; Köel-Knabner, I. Soil organic matter composition and soil lightness. J. Plant Nutr. Soil Sci. 2004, 167, 545–555. [Google Scholar] [CrossRef]
  58. Mirzaee, S.; Ghobani-Dashtaki, S.; Mohammadi, J.; Asadi, H.; Asadzadeh, F. Spatial variability of soil organic matter using remote sensing data. Catena 2016, 145, 118–127. [Google Scholar] [CrossRef]
  59. Moreno-Ramón, H.; Marqués-Mateu, Á.; Ibañez Asensio, S. Significance of Soil Lightness Versus Physicochemical Soil Properties in Semiarid Areas. Arid Land Res. Manag. 2014, 28, 371–382. [Google Scholar]
Figure 1. Conceptual diagram of colour transformations required for comparison between observed and measured colour.
Sustainability 13 11029 g001
Figure 3. Relationship between observed and measured colour values for hue (h°), lightness (L*), and chroma (C*) for scientists (in blue) and citizen scientists (in orange).
Sustainability 13 11029 g003
Figure 4. Contrast class category for observed and calibrated visual estimates compared to spectroscopic measured colour for 2 groups: citizen scientists and scientists. (a) Contrast class for Munsell parameters: hue, value, and chroma (HVC), (b) Contrast class for Munsell attributes: value and chroma (VC).
Sustainability 13 11029 g004
Figure 5. Relationship between soil organic carbon (SOC) and hue, lightness, and chroma in both the Munsell HVC and CIELAB colour space.
Sustainability 13 11029 g005
Figure 6. Relationship between measured SOC from LOI with predicted SOC using simple regression in black and the three-factor regression equation for (a) citizen scientists in orange and (b) spectrophotometer in green.
Sustainability 13 11029 g006
Table 1. Variables of the sampling locations and soil measurements.
Sampling Location Number of Colour Measurements
Park SiteLand
Management
Tree NumberOrientationCanopy PositionCitizen ScientistsScientistsSpectralSOC by LOI (%)
1Cannon HillManaged1NorthInner8837.1
2Cannon HillManaged1SouthOuter8835.8
3Cannon HillManaged2NorthInner8837.5
4Cannon HillManaged2SouthOuter8836.4
5Cannon HillManaged3NorthInner8835.8
6Cannon HillManaged3SouthOuter8835.8
7Cannon HillUnmanaged4NorthInner8834.0
8Cannon HillUnmanaged4SouthOuter8833.7
9Cannon HillUnmanaged5NorthInner88311.3
10Cannon HillUnmanaged5SouthOuter8836.1
11Cannon HillUnmanaged6NorthInner8839.4
12Cannon HillUnmanaged6SouthOuter8839.3
13Kew GardenManaged7NorthInner9936.3
14Kew GardenManaged7SouthOuter9935.1
15Kew GardenManaged8NorthInner9936.4
16Kew GardenManaged8SouthOuter9937.0
17Kew GardenManaged9NorthInner9936.4
18Kew GardenManaged9SouthOuter9934.7
19Kew GardenUnmanaged10NorthInner9937.4
20Kew GardenUnmanaged10SouthOuter9938.4
21Kew GardenUnmanaged11NorthInner9937.9
22Kew GardenUnmanaged11SouthOuter9936.4
23Kew GardenUnmanaged12NorthInner9938.3
24Kew GardenUnmanaged12SouthOuter9937.5
25Les FontainesStreet tree13NorthInner11113-
26Les FontainesStreet tree14NorthInner11113-
27Les FontainesStreet tree15NorthInner11113-
28Les FontainesManaged16NorthInner11113-
29Les FontainesManaged17NorthInner11113-
30Les FontainesManaged18NorthInner11113-
Managed, removal of leaf and woody litter; unmanaged, leaf and woody litter left in situ; street tree, in tree pits with all debris and undergrowth vegetation is cleared; SOC, Soil Organic Carbon; LOI, Loss on Ignition (%). SOC by LOI data not applicable for Les Fontaines site (-).
Table 2. Descriptive statistics for five repeated measurements of spectrally derived colour.
Hue NumberMunsell ValueMunsell Chroma
Range11.7 to 20.53.5 to 3.60.9 to 1.3
Mean16.73.61.1
SD3.10.040.1
CV (%)18.31.112.8
Munsell hue number, basic colour; Munsell value, lightness, or darkness of a colour; Munsell chroma, saturation of a colour; SD, standard deviation; CV, coefficient of variation.
Table 3. Descriptive statistics for the Munsell colour attributes (hue, value, and chroma) determined by scientists, citizen scientists, and a spectrophotometer.
Munsell Hue NumberMunsell ValueMunsell Chroma
RangeMax.–Min.MeanModeRangeMax.–Min.MeanModeRangeMax.–Min.MeanMode
Scientists15.0–205.019.2201.0–4.03.02.73.01.0–4.03.01.62
Citizen Scientists17.50 17.517.53.0–8.05.05.05.02.0–8.06.05.16.0
Spectroscopic13.3–23.29.918.5183.5–3.80.33.73.61.3–3.52.22.42.5
Max., maximum; Min., minimum; Munsell hue number, basic colour; Munsell value, lightness, or darkness of a colour; Munsell chroma, saturation of a colour.
Publisher’s Note: MDPI stays neutral with regard to jurisdictional claims in published maps and institutional affiliations.

