
Bringing Back in the Spatial Dimension in the Assessment of Cultural and Creative Industries and Its Relationship with a City’s Sustainability: The Case of Milan


Abstract
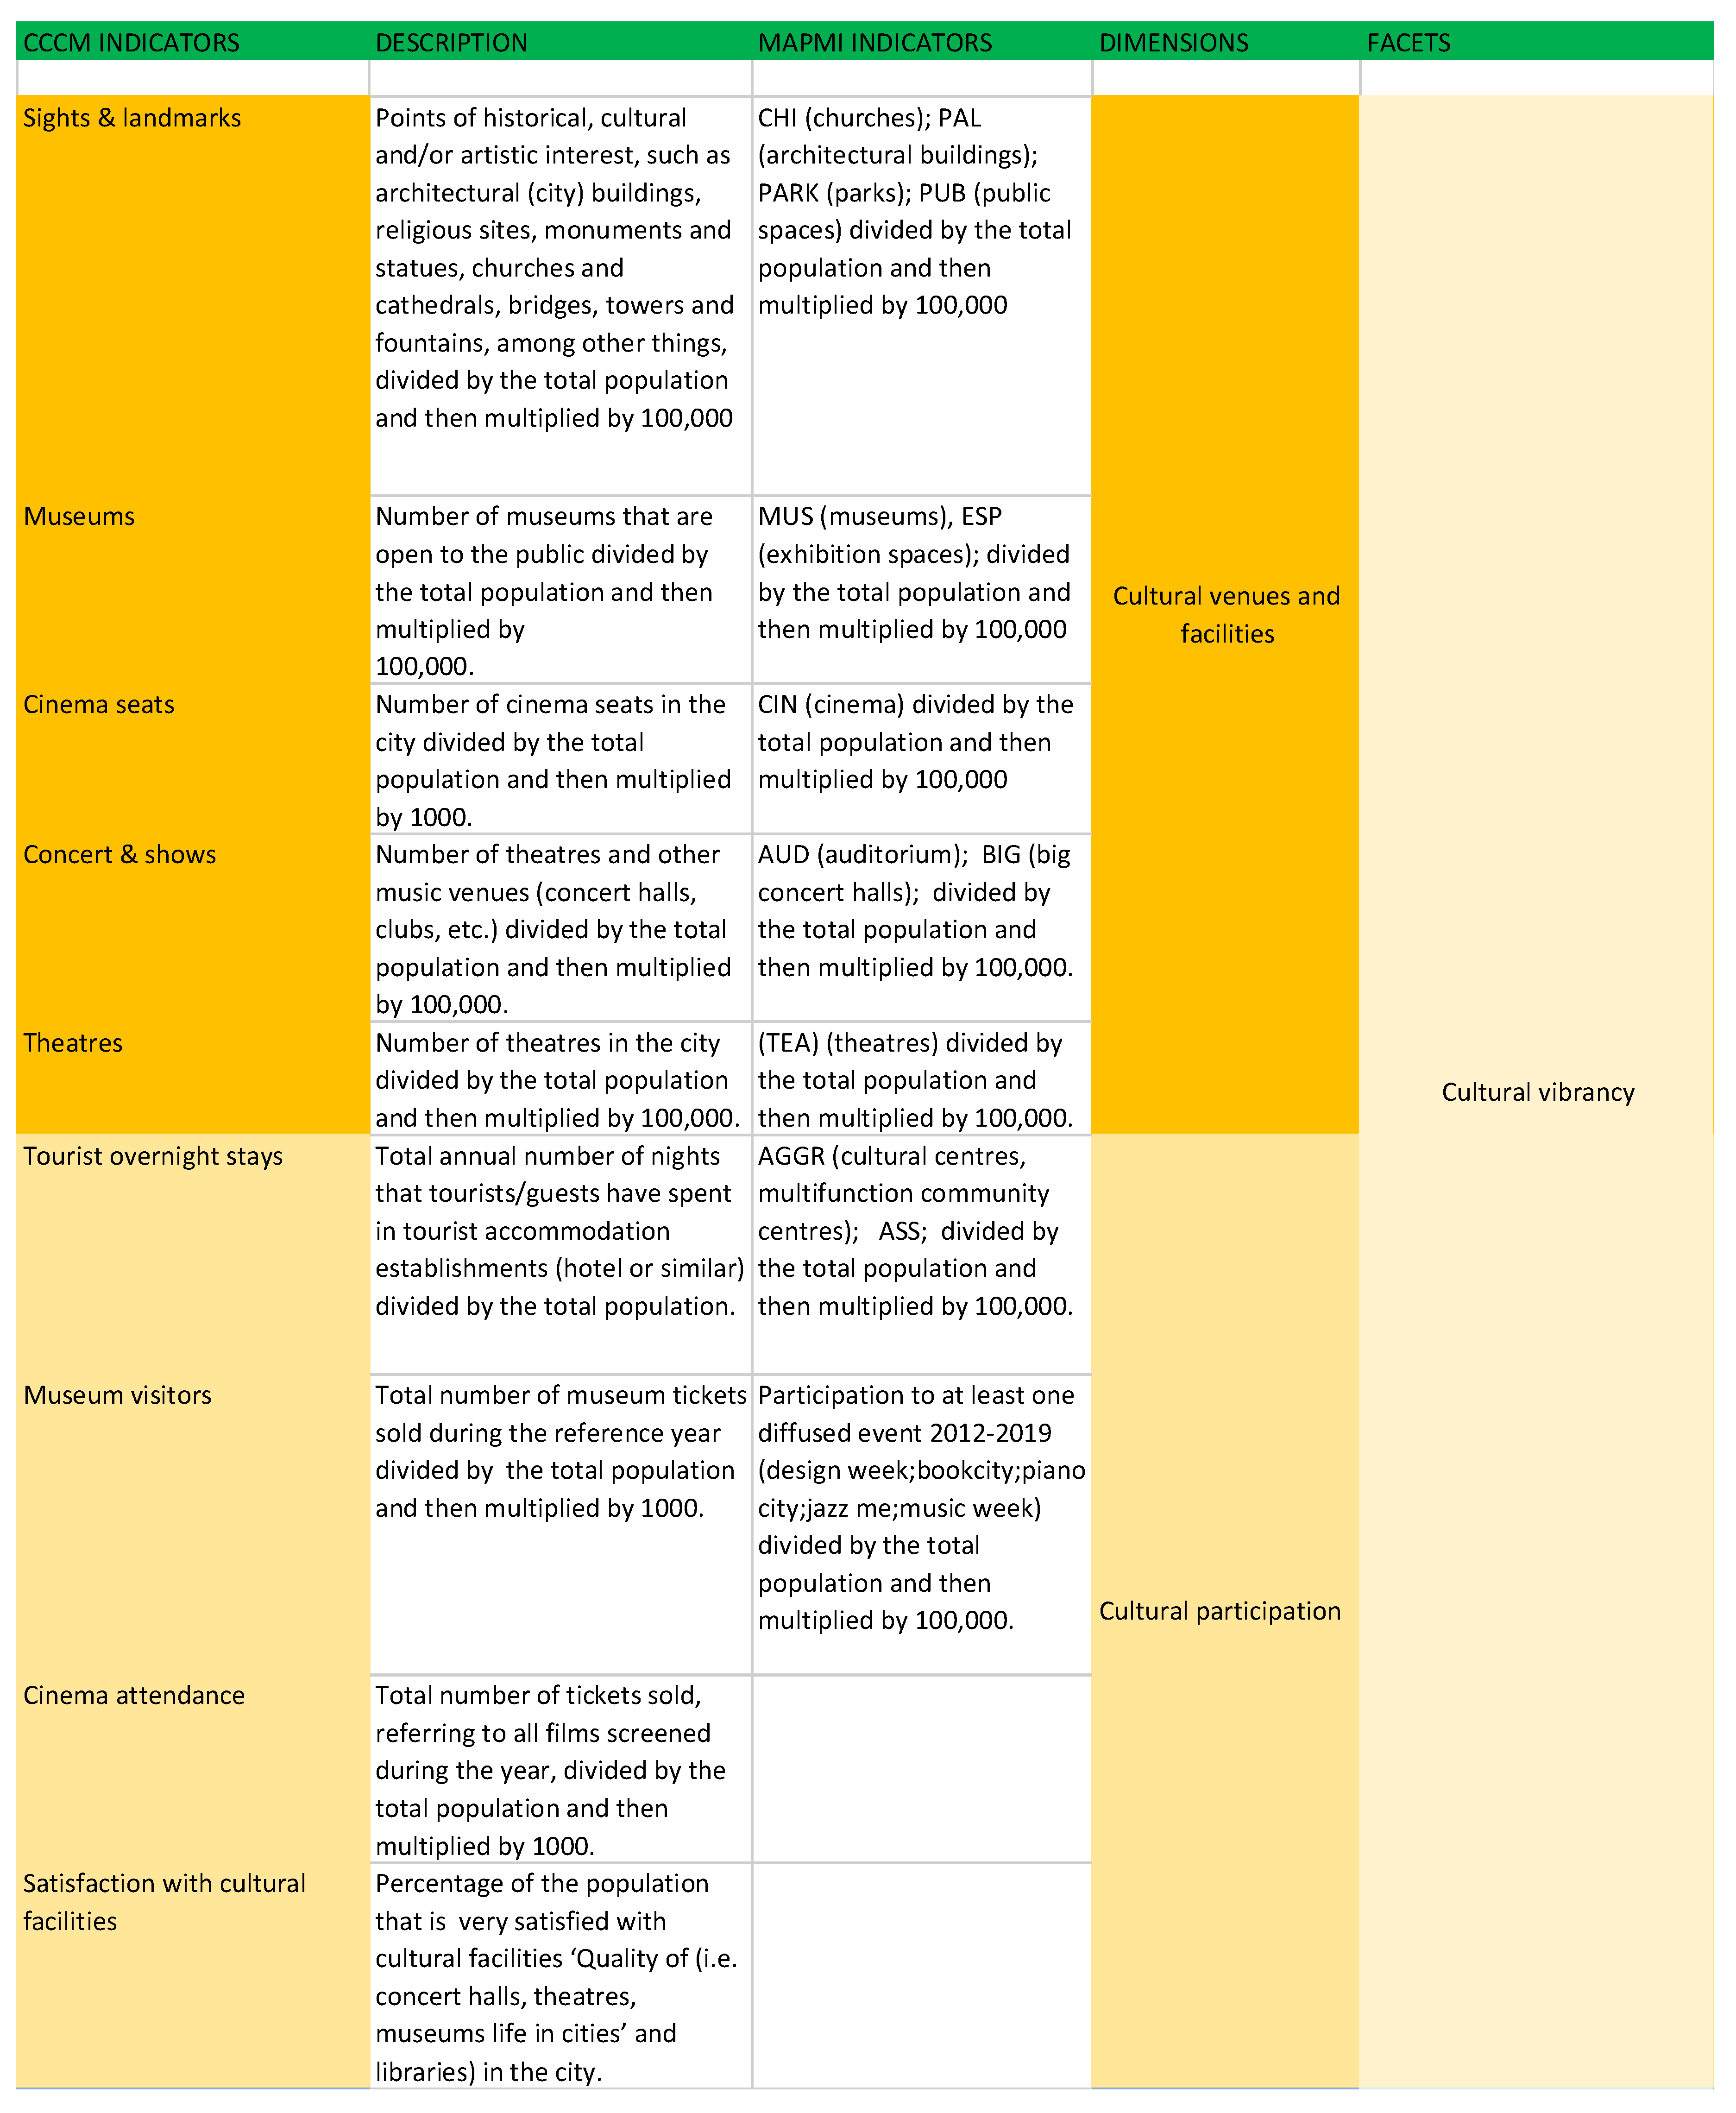
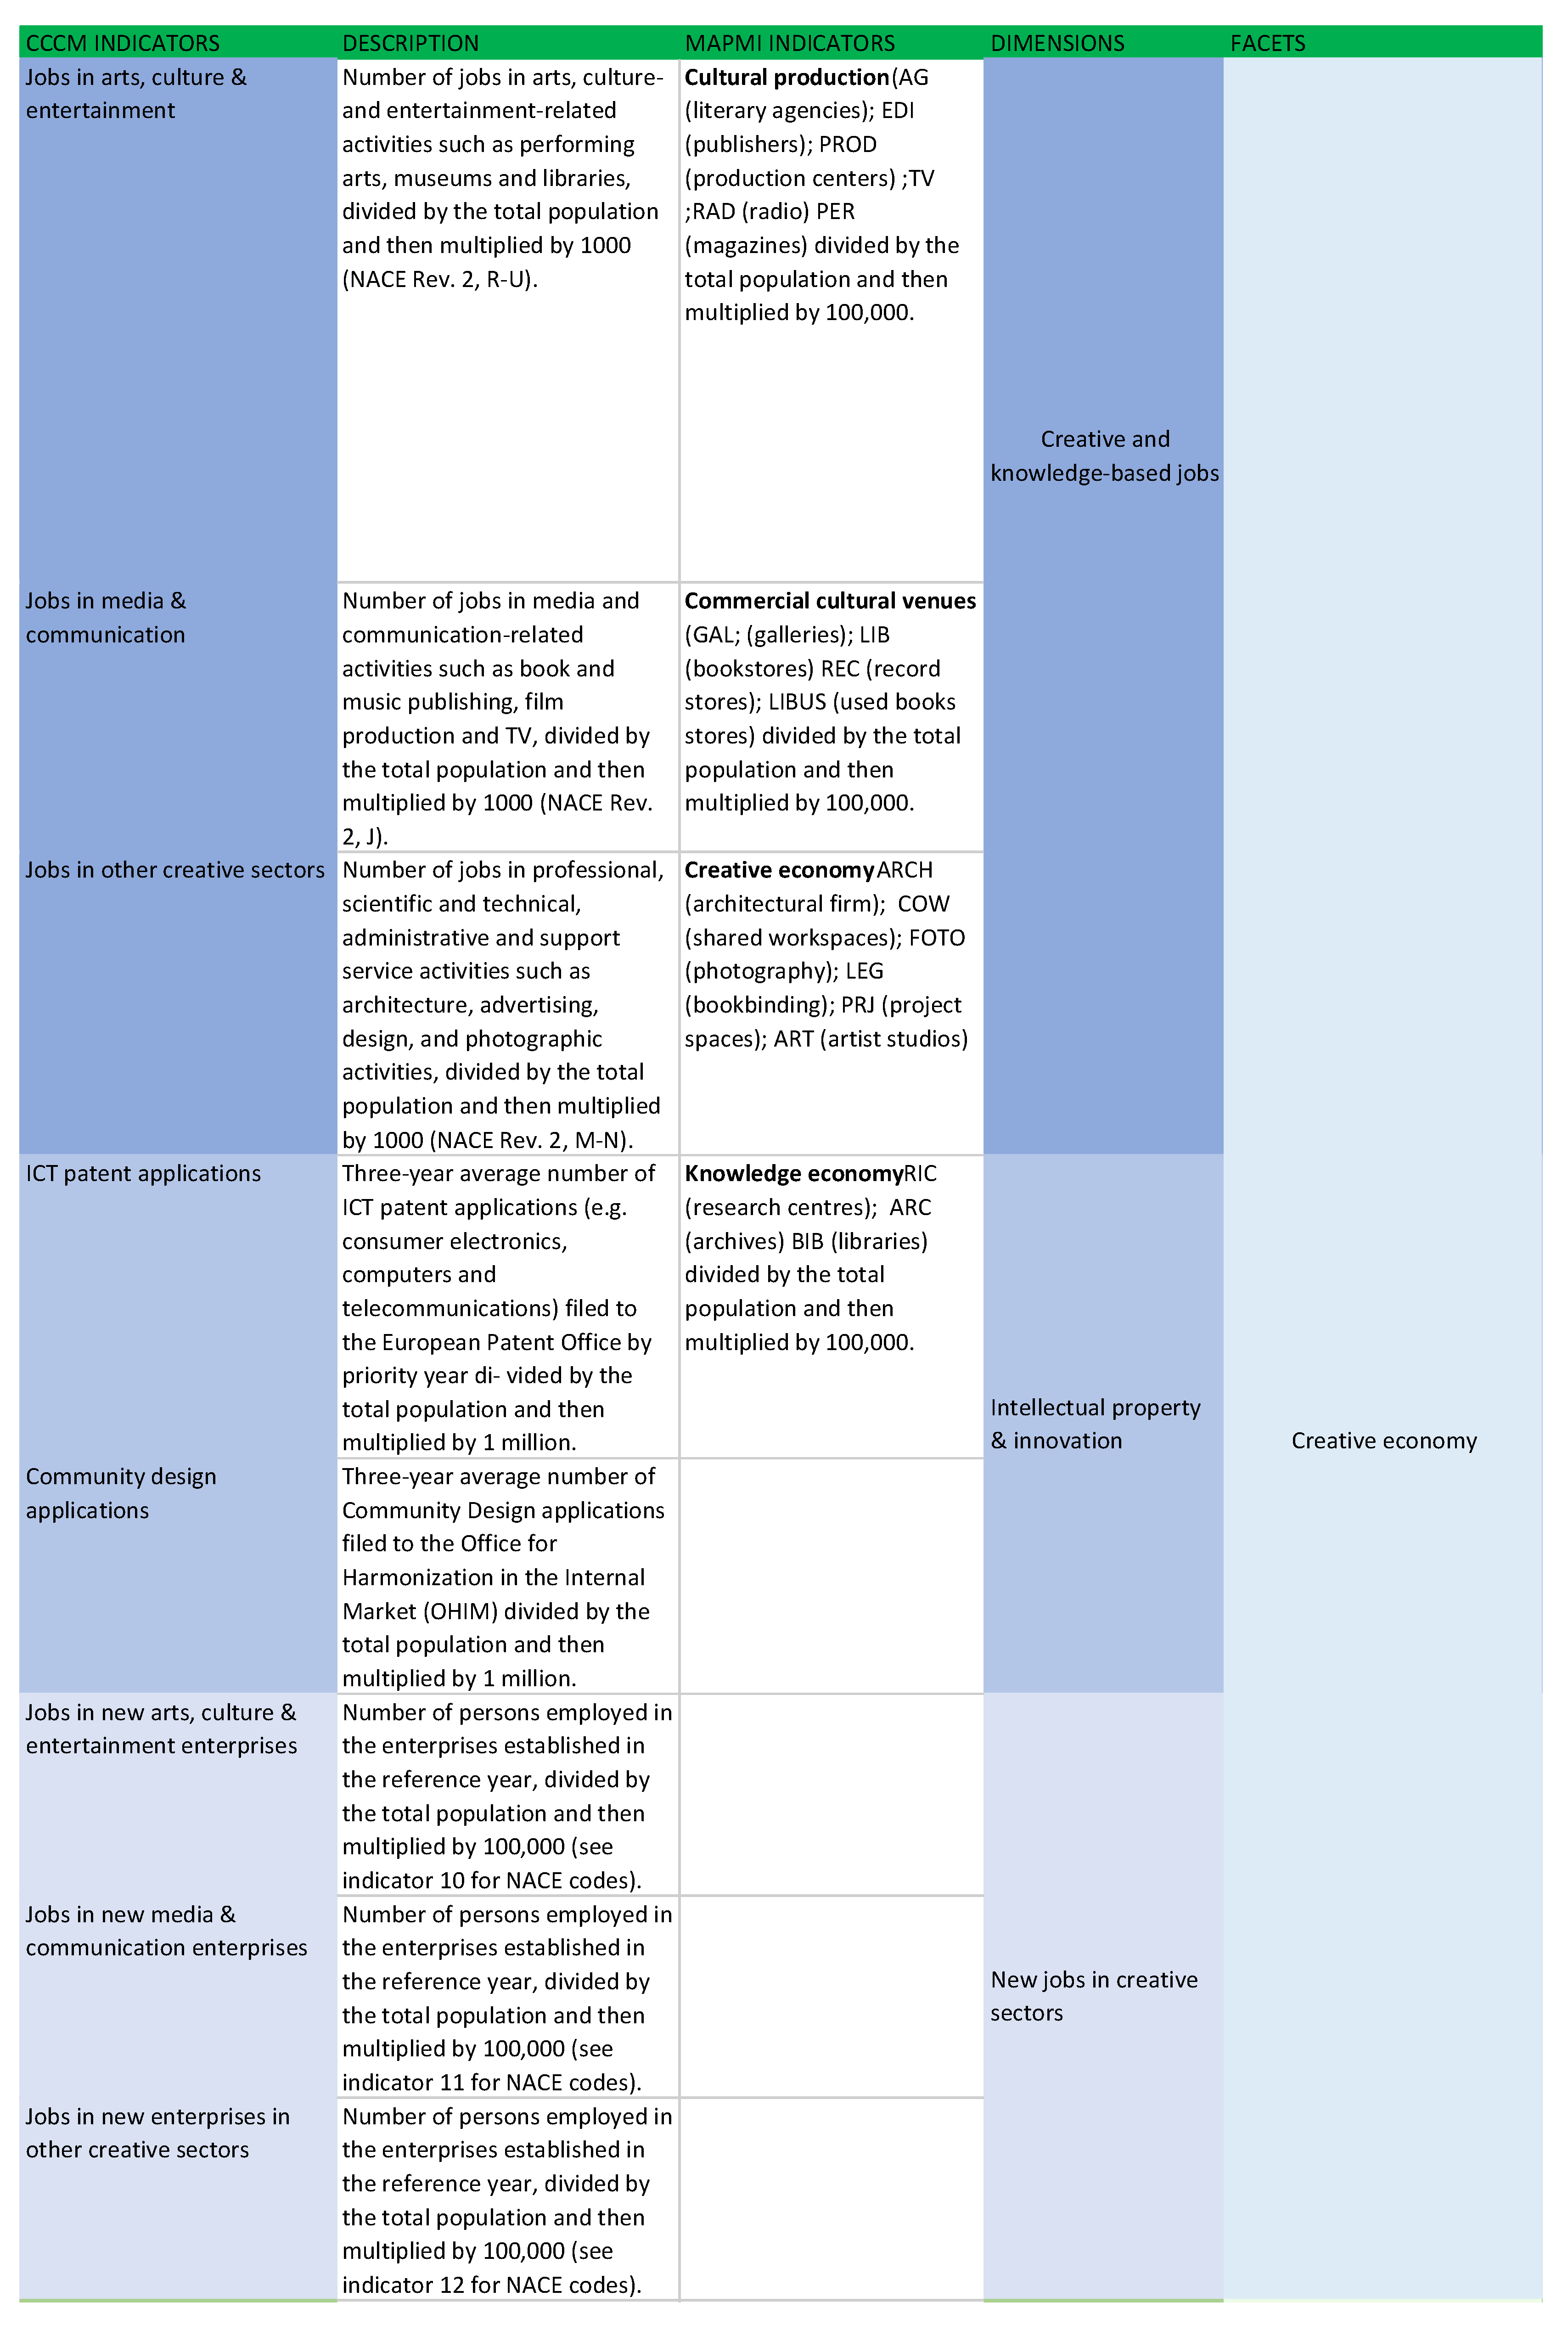
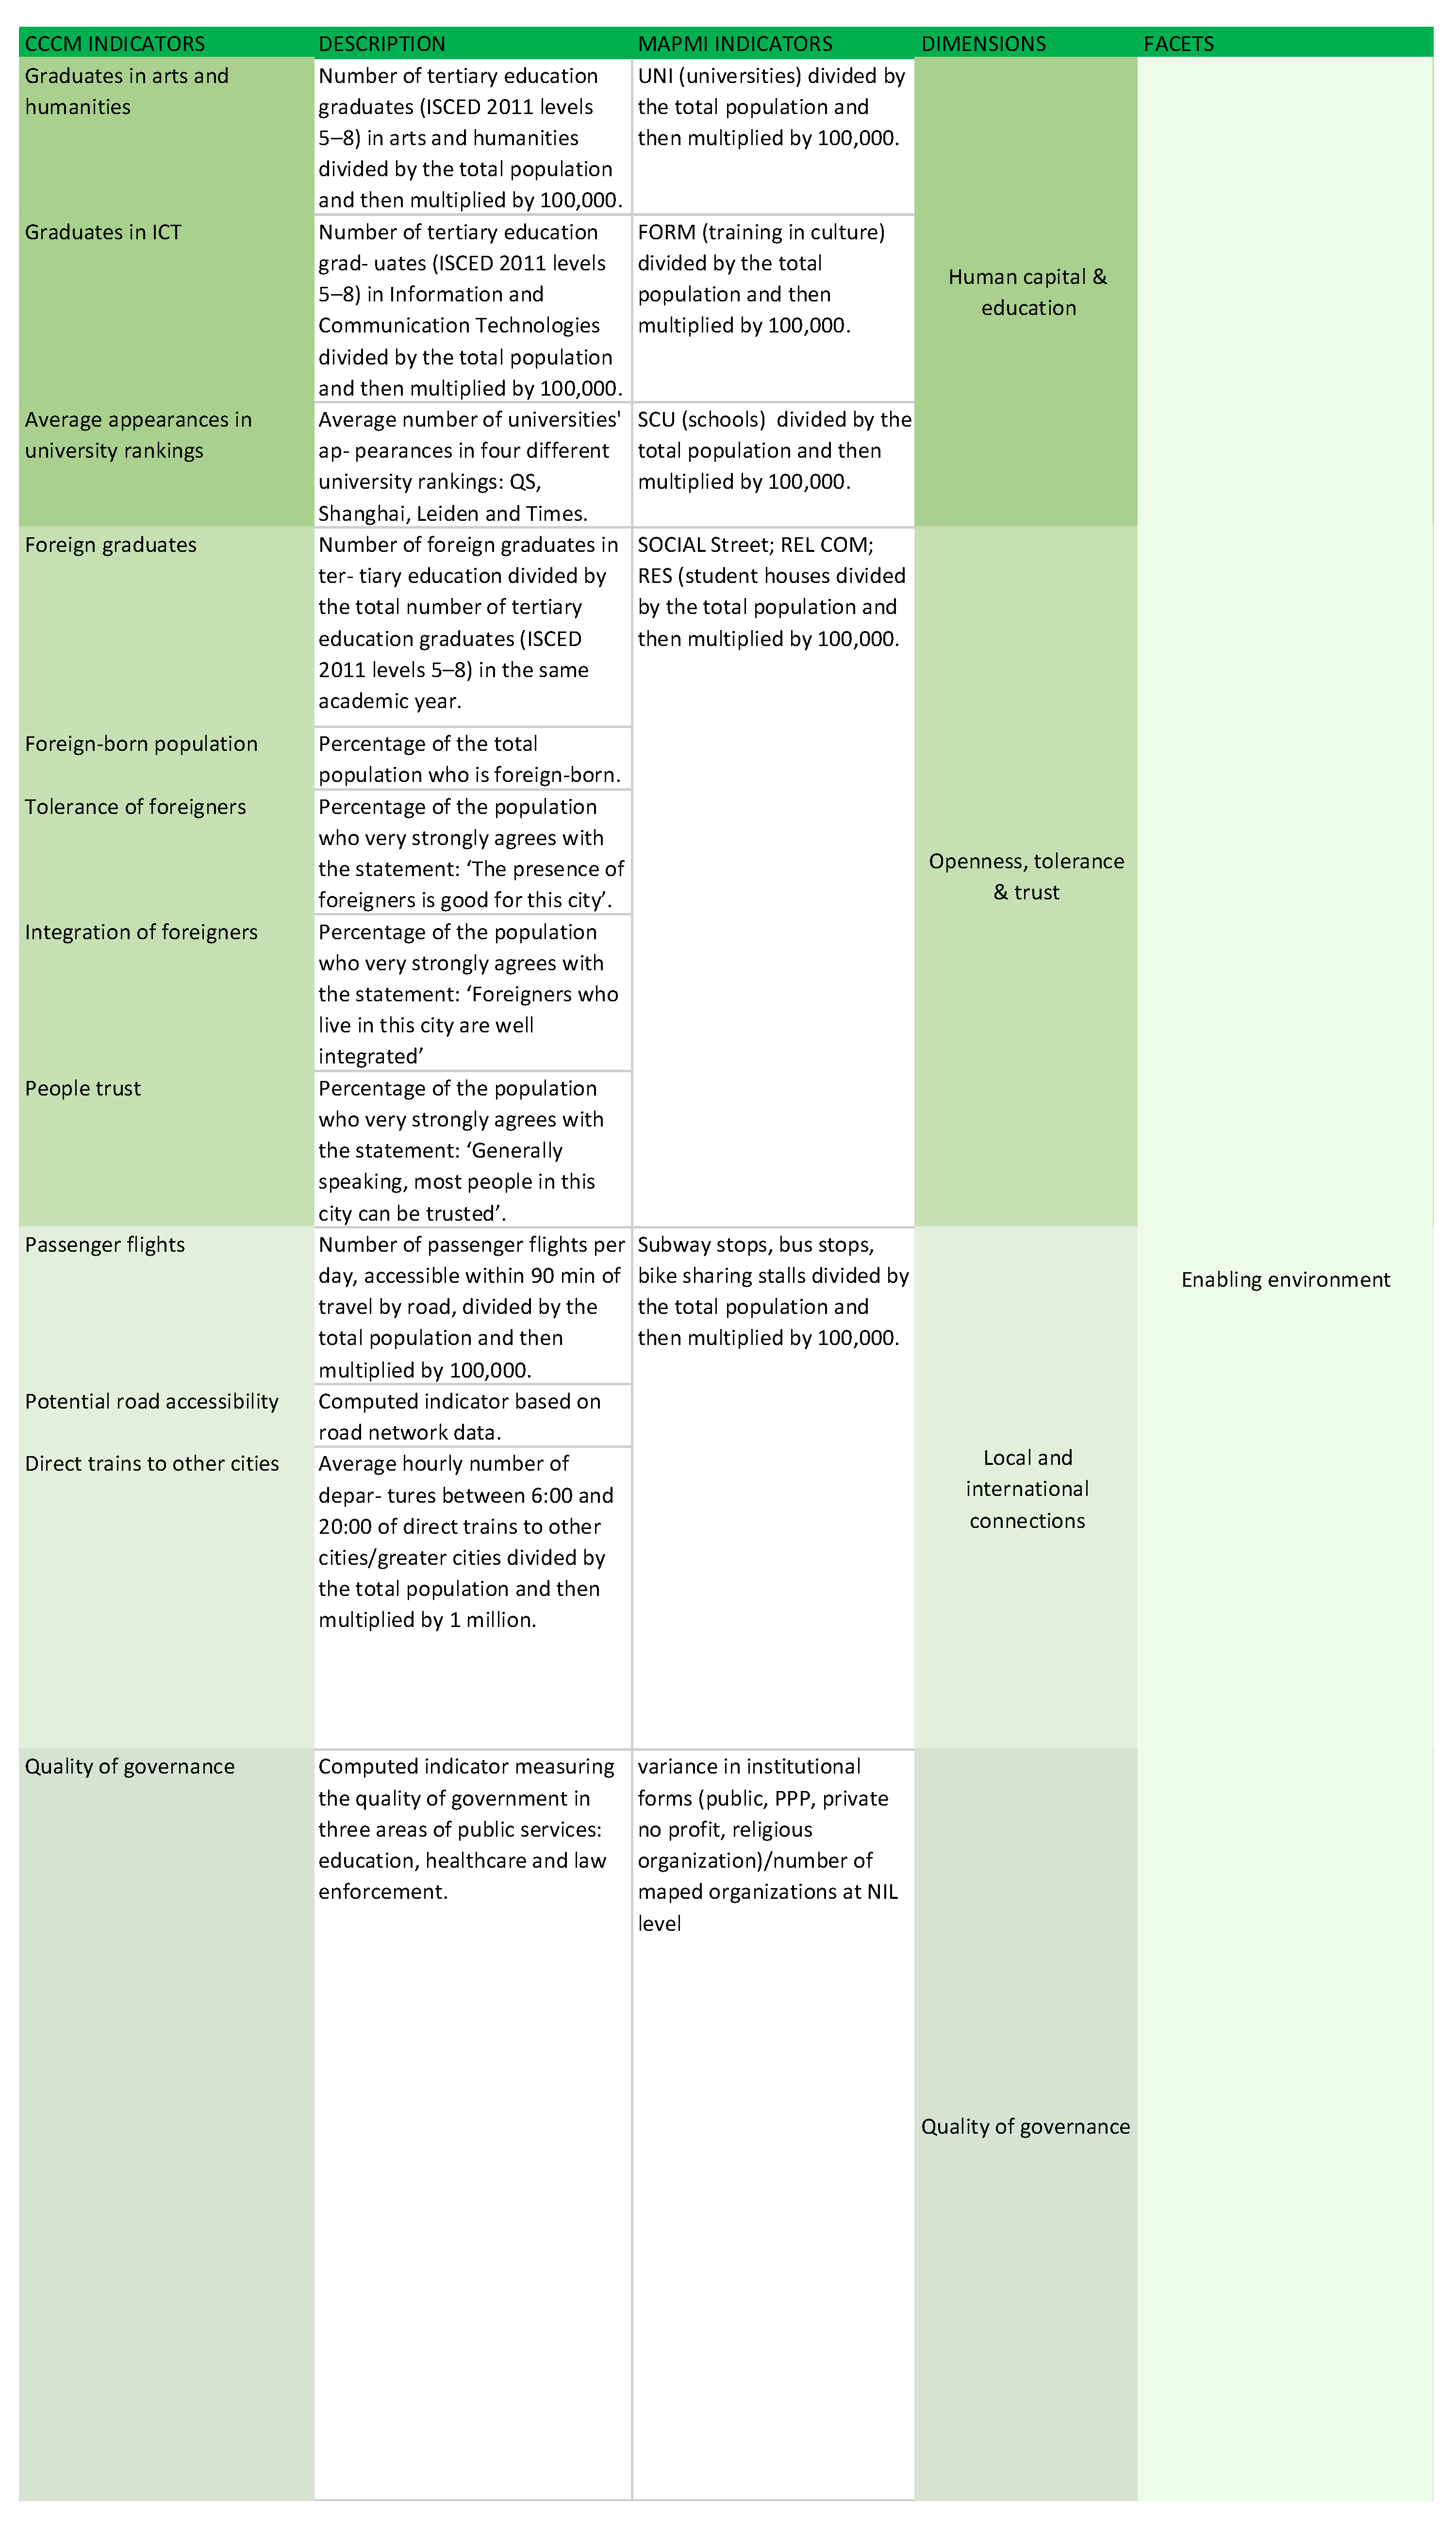
:1. Defining and Measuring CCI
2. Methodology
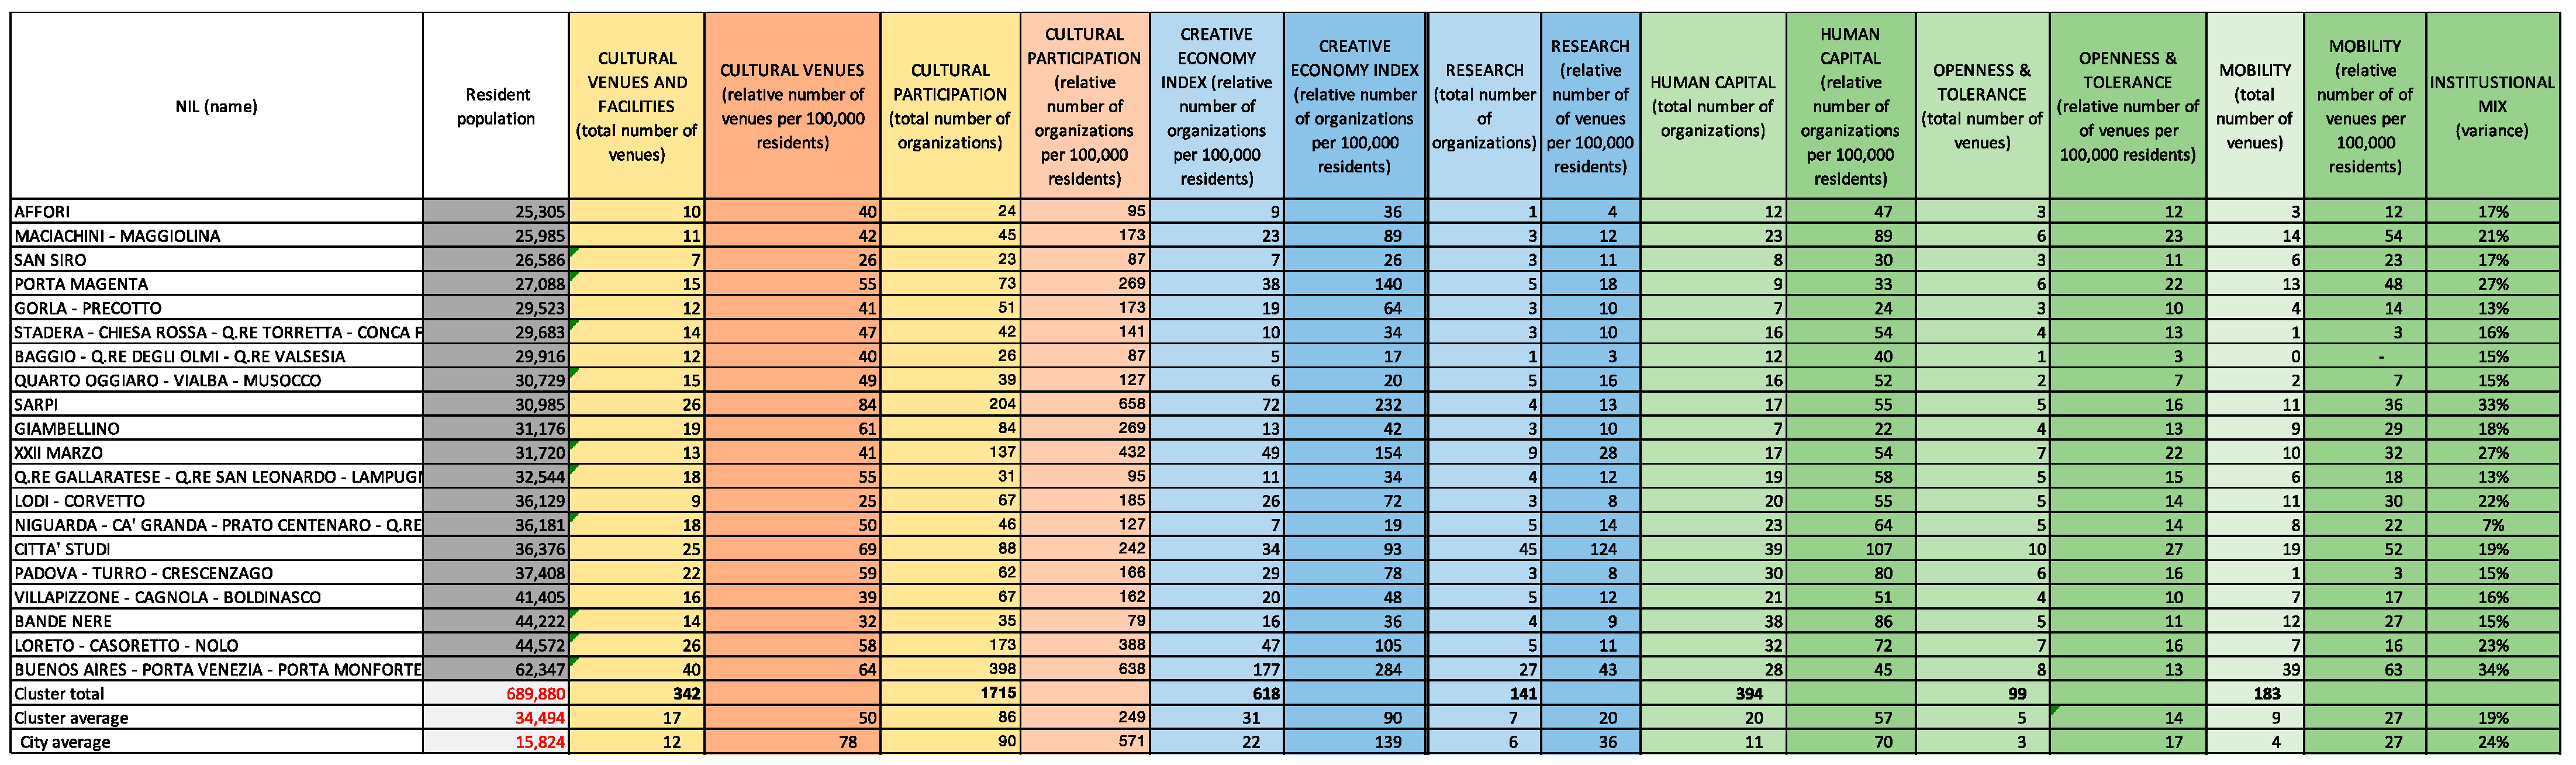
3. Analysis of Data
4. Cultural Vocation
5. Discussions and Conclusions
Author Contributions
Funding
Conflicts of Interest
References
- DCMS (Department for Culture, Media and Sport). Creative Industries Mapping Document 2001; DCMS: London, UK, 2001.
- DCMS (Department for Culture, Media and Sport). Creative Industries Economic EstimatesTechnical Note-February 2010; DCMS: London, UK, 2010. Available online: https://www.gov.uk/government/uploads/system/uploads/attachment_data/file/78418/Creative_Industries_Economic_Estimates_2010_technica__note.pdf (accessed on 20 September 2021).
- UNESCO. Universal Declaration on Cultural Diversity; UNESCO: Paris, France, 2001; Available online: http://unesdoc.UNESCO.org/images/0012/001271/127160m.pdf (accessed on 20 September 2021).
- UNESCO. Convention for the Safeguarding of the Intangible Cultural Heritage; UNESCO: Paris, France, 2003. [Google Scholar]
- UNESCO. UNESCO Framework for Cultural Statistics; UNESCO: Paris, France, 2009. [Google Scholar]
- Caves, R.E. Creative Industries: Contracts between Art and Commerce (No. 20); Harvard University Press: Cambridge, CA, USA, 2000. [Google Scholar]
- Jones, P.; Comfort, D.; Eastwood, I.; Hillier, D. Creative Industries: Economic Contributions, Management Challenges and Support Initiatives. Manag. Res. News 2004, 27, 134141. [Google Scholar] [CrossRef]
- Scott, A.J. Creative cities: Conceptual issues and policy questions. J. Urban Aff. 2006, 28, 1–17. [Google Scholar] [CrossRef] [Green Version]
- Sacco, P.L.; Ferilli, G.; Blessi, G.T.; Nuccio, M. Culture as an engine of local development processes: System-wide cultural districts I: Theory. Growth Chang. 2013, 44, 555–570. [Google Scholar] [CrossRef]
- Sacco, P.L.; Vella, G. Introduction to Valletta 2018 cultural mapping: Debating space and place. City Cult. Soc. 2017, 11, 1–3. [Google Scholar] [CrossRef]
- Santagata, W. Cultural districts and their role in economic development. In Handbook of the Economics of Art and Culture; Ginsburgh, V., Throsby, D., Eds.; Elsevier: Amsterdam, The Netherlands, 2006; pp. 1100–1119. [Google Scholar]
- Throsby, D. Economics and Culture; Cambridge University Press: New York, NY, USA, 2001. [Google Scholar]
- Towse, R. A Handbook of Cultural Economics; Edward Elgar Publishing: Cheltenham, UK, 2003. [Google Scholar] [CrossRef] [Green Version]
- Bertacchini, E.; Borrione, P. The geography of the Italian creative economy: The special role of the design and craft-based industries. Reg. Stud. 2013, 47, 135–147. [Google Scholar] [CrossRef]
- Boix, R.; Capone, F.; De Propris, L.; Lazzeretti, L.; Sanchez, D. Comparing creative industries in Europe. Eur. Urban Reg. Stud. 2014, 23, 935–940. [Google Scholar] [CrossRef]
- Cooke, P.; Lazzeretti, L. (Eds.) Creative Cities, Cultural Clusters and Local Development; Edward Elgar: Cheltenham, UK, 2008. [Google Scholar] [CrossRef]
- Mommaas, H. Cultural clusters and the post-industrial city: Towards the remapping of urban cultural policy. Urban Stud. 2004, 41, 507–532. [Google Scholar] [CrossRef]
- Cruz, S.; Teixeira, A.A. Assessing the magnitude of creative employment: A comprehensive mapping and estimation of existing methodologies. Eur. Plan. Stud. 2014, 22, 2172–2209. [Google Scholar] [CrossRef]
- Cruz, S.S.; Teixeira, A.A. The magnitude of creative industries in Portugal: What do the distinct industry-based approaches tell us? Creat. Ind. J. 2015, 8, 85–102. [Google Scholar] [CrossRef]
- Markusen, A.; Nicodemus, A.G.; Giarratani, F.; Hewings, G.; McCann, P. Spatial divisions of labor: How key worker profiles vary for the same industry in different regions. In Handbook of Industry Studies and Economic Geography; Edward Elgar Publishing: Cheltenham, UK, 2013. [Google Scholar]
- Markusen, A.; Wassall, G.H.; DeNatale, D.; Cohen, R. Defining the creative economy: Industry and occupational approaches. Econ. Dev. Q. 2008, 22, 24–45. [Google Scholar] [CrossRef] [Green Version]
- Higgs, P.; Cunningham, S.; Bakhshi, H. Beyond the Creative Industries: Mapping the Creative Economy in the United Kingdom; Nesta: London, UK, 2008. [Google Scholar]
- UNCTAD (United Nations Conference on Trade and Development). Creative Economy Report 2008: The Challenge of Assessing the Creative Economy Towards Informed Policy-making; United Nations: Geneva, Switzerland, 2008; Available online: http://unctad.org/fr/Docs/ditc20082cer_en.pdf (accessed on 20 September 2021).
- Thorsby, D. The Economics of Cultural Policy; Cambridge University Press: Cambridge, UK, 2010. [Google Scholar]
- KEA. The Economy of Culture in Europe; European Commission: Brussels, Belgium, 2006. [Google Scholar]
- KEA. Measuring Economic Impact of CCIs Policies: How to Justify Investment in Cultural and Creative Assets; European Commission, Directorate-General for Education and Culture: Brussels, Belgium, 2012. [Google Scholar]
- Santagata, W. Libro Bianco Sulla Creativita’: Per un Modello Italiano di Sviluppo; Universita Bocconi: Milano, Italy, 2009. [Google Scholar]
- DCMS (Department for Culture, Media and Sport). Creative Industries Economic Estimates Full Statistical Release 8 December 2011; DCMS: London, UK, 2011.
- UNESCO. UNESCO Framework for Cultural Statistics-Handbook No. 1 Measuring the Economic Contribution of Cultural Industries. 2012. Available online: http://uis.unesco.org/sites/default/files/documents/measuring-the-economic-contribution-of-cultural-industries-a-review-and-assessment-of-current-methodological-approaches-en_1.pdf (accessed on 20 September 2021).
- OECD. Culture and Local Development; OECD Publications: Paris, France, 2005. [Google Scholar]
- Florida, R. The Rise of the Creative Class: And How It’s Transforming Work, Leisure, Community, and Everyday Life; Basic Books: London, UK, 2002. [Google Scholar]
- Bakhshi, H.; MacVittie, E.; Simmie, J. Creating innovation. Do the creative industries support innovation in the wider economy? NESTA 2008. [Google Scholar] [CrossRef]
- Innocenti, N.; Lazzeretti, L. Do the creative industries support growth and innovation in the wider economy? Industry relatedness and employment growth in Italy. Ind. Innov. 2019, 26, 1152–1173. [Google Scholar] [CrossRef]
- Müller, K.; Rammer, C.; Trüby, J. The role of creative industries in industrial innovation. Innovation 2009, 11, 148–168. [Google Scholar] [CrossRef]
- Pratt, A.C.; Jeffcutt, P. Creativity, innovation and the cultural economy. In Snake Oil for the Twenty-First Century? Creativity, Innovation and the Cultural Economy; Routledge: London, UK, 2009; pp. 1–20. [Google Scholar] [CrossRef]
- Grossi, E.; Blessi, G.T.; Sacco, P.L. Magic moments: Determinants of stress relief and subjective wellbeing from visiting a cultural heritage site. Cult. Med. Psychiatry 2019, 43, 4–24. [Google Scholar] [CrossRef] [PubMed]
- Reyes-Martínez, J.; Takeuchi, D.; Martínez-Martínez, O.A.; Lombe, M. The role of cultural participation on subjective well-being in Mexico. Appl. Res. Qual. Life 2021, 16, 1321–1341. [Google Scholar] [CrossRef]
- Helliwell, J.F.; Layard, R.; Sachs, J.; De Neve, J.E. World Happiness Report. 2020. Available online: https://happiness-report.s3.amazonaws.com/2020/WHR20.pdf (accessed on 20 September 2021).
- Sasaki, M. Urban regeneration through cultural creativity and social inclusion: Rethinking creative city theory through a Japanese case study. Cities 2010, 27, S3–S9. [Google Scholar] [CrossRef]
- Moulaert, F.; MacCallum, D.; Mehmood, A.; Hamdouch, A. General introduction: The return of social innovation as a scientific concept and a social practice. In The International Handbook on Social Innovation: Collective Action, Social Learning and Transdisciplinary Research; Moulaert, F., MacCallum, D., Mehmood, A., Hamdouch, A., Eds.; Edward Elgar Publishing: London, UK, 2013; pp. 1–6. [Google Scholar] [CrossRef]
- Scott, A.J. Cultural economy and the creative field of the city. Geogr. Ann. Ser. B Hum. Geogr. 2010, 92, 115–130. [Google Scholar] [CrossRef] [Green Version]
- Bianchini, F.; Parkinson, M. Cultural Policy and Urban Regeneration: The West European Experience; Manchester University Press: Manchester, UK, 1993. [Google Scholar]
- Evans, G.; Shaw, P. The Contribution of Culture to Regeneration in the UK: A Review of Evidence—A Report to the Department for Culture Media and Sport. 2004. Available online: http://www.scholars-on-bilbao.info/fichas/EvansShaw2004.pdf (accessed on 20 September 2021).
- García, M. Citizenship practices and urban governance in European cities. Urban Stud. 2006, 43, 745–765. [Google Scholar] [CrossRef]
- Liu, Y.D. Event and sustainable culture-led regeneration: Lessons from the 2008 European Capital of Culture, Liverpool. Sustainability 2019, 11, 1869. [Google Scholar] [CrossRef] [Green Version]
- Evans, G. Measure for measure: Evaluating the evidence of culture’s contribution to regeneration. Urban Stud. 2005, 42, 959–983. [Google Scholar] [CrossRef]
- Demartini, P.; Marchegiani, L.; Marchiori, M.; Schiuma, G. Connecting the Dots: A Proposal to Frame the Debate Around Cultural Initiatives and Sustainable Development. In Cultural Initiatives for Sustainable Development; Springer International Publishing: Basel, Switzerland, 2021. [Google Scholar]
- Duxbury, N.; Jeannotte, M.S. Making it real: Measures of culture in local sustainability planning and implementation in Making Culture Count. In New Directions in Cultural Policy Research; MacDowall, L., Badham, M., Blomkamp, E., Dunphy, K., Eds.; Palgrave Macmillan: London, UK, 2015; pp. 145–161. [Google Scholar]
- Guzman, P.; Roders, A.P.; Colenbrander, B. Measuring links between cultural heritage management and sustainable urban development: An overview of global monitoring tools. Cities 2017, 60, 192–201. [Google Scholar] [CrossRef]
- Sacco, P.L.; Blessi, G.T.; Nuccio, M. Cultural policies and local planning strategies: What is the role of culture in local sustainable development? J. Arts Manag. Law Soc. 2009, 39, 45–64. [Google Scholar] [CrossRef]
- Evans, G. Creative cities, creative spaces, and urban policy. Urban Stud. 2009, 46, 1003–1040. [Google Scholar] [CrossRef] [Green Version]
- European Union. European Union. European Agenda for Culture. In Communication from the Commission to the European Parliament, the Council, the European Economic, and Social Committee, and the Committee of the Regions; European Commission: Brussels, Belgium, 2007. [Google Scholar]
- European Union. A New European Agenda for Culture. In Communication from the Commission to the European Parliament, the European Council, the Council, the European Economic, and Social Committee, and the Committee of the Regions; European Commission: Brussels, Belgium, 2018. [Google Scholar]
- Markusen, A.; Gadwa, A. Arts and culture in urban or regional planning: A review and research agenda. J. Plan. Educ. Res. 2010, 29, 379–391. [Google Scholar] [CrossRef]
- Benassi, F.; D’Elia, M.; Petrei, F. The “meso” dimension of territorial capital: Evidence from Italy. Reg. Sci. Policy Pract. 2021, 13, 159–175. [Google Scholar] [CrossRef]
- Montalto, V.; Moura, C.J.T.; Langedijk, S.; Saisana, M. Culture counts: An empirical approach to measure the cultural and creative vitality of European cities. Cities 2019, 89, 167–185. [Google Scholar] [CrossRef]
- Scott, A.J. The Cultural Economy of Cities: Essays on the Geography of Image-Producing Industries; Sage: London, UK, 2000. [Google Scholar]
- Yin, M.; Derudder, B. Geographies of cultural industries across the global urban system. Geogr. Compass 2021, 15. [Google Scholar] [CrossRef]
- Marrocu, E.; Paci, R. Education or creativity: What matters most for economic performance? Econ. Geogr. 2012, 88, 369–401. [Google Scholar] [CrossRef] [Green Version]
- Lorenzen, M.; Frederiksen, L. Why do cultural industries cluster? Localization, urbanization, products and projects. In Creative Cities, Cultural Clusters and Local Economic Development; Cook, P., Lazzeretti, L., Eds.; Edward Elgar Publishing: Cheltenham, UK, 2008. [Google Scholar]
- Nuccio, M.; Ponzini, D. What does a cultural district actually do? Critically reappraising 15 years of cultural district policy in Italy. Eur. Urban Reg. Stud. 2017, 24, 405–424. [Google Scholar] [CrossRef]
- Burke, P. The Italian Renaissance: Culture and Society in Italy; Princeton University Press: Princeton, NJ, USA, 2014. [Google Scholar]
- UN. World Population Prospects 2019. Available online: https://population.un.org/wpp/ (accessed on 20 September 2021).
- The World Bank. Urban Development. 2020. Available online: https://www.worldbank.org/en/topic/urbandevelopment/overview#1 (accessed on 20 September 2021).
- Fainstein, S.S. The just city. Int. J. Urban Sci. 2014, 18, 1–18. [Google Scholar] [CrossRef]
- KEA. Culture and Creative Sectors in the European Union–Key Future Developments, Challenges and Opportunities; Policy Department for Structural and Cohesion Policies on Behalf of the European Parliament Committee on Culture and Education; KEA: Brussels Belgium, 2019. [Google Scholar]
- Bonet, L.; Donato, F. The financial crisis and its impact on the current models of governance and management of the cultural sector in Europe. ENCATC J. Cult. Manag. Policy 2011, 1, 4–11. [Google Scholar]
- Bertoni, A.; Dubini, P.; Monti, A. Participatory event platforms in the urban context: The importance of stakeholders’ meaning of “participation”. In Cultural Initiatives for Sustainable Development Management, Participation and Entrepreneurship in the Cultural and Creative Sector; Contributions to Management Science Series; Demartini, P., Marchegiani, L., Marchiori, M., Schiuma, G., Eds.; Springer (Indexed in SCOPUS): Berlin/Heidelberg, Germany, 2021; pp. 271–292. ISBN 978-3-030-65686-7. [Google Scholar] [CrossRef]
- Biondi, L.; Demartini, P.; Marchegiani, L.; Marchiori, M.; Piber, M. Understanding orchestrated participatory cultural initiatives: Mapping the dynamics of governance and participation. Cities 2020, 96, 102459. [Google Scholar] [CrossRef]
- Lazzeretti, L.; Boix, R.; Capone, F. Do creative industries cluster? Mapping creative local production systems in Italy and Spain. Ind. Innov. 2008, 15, 549–567. [Google Scholar] [CrossRef] [Green Version]
- UCCN. Special edition: Widening local development pathways. In Creative Economy Report; UCCN: Paris, France, 2013. [Google Scholar]
- Miguel, B.S.; Herrero-Prieto, L.C. A Spatial-Temporal Analysis of Cultural and Creative Industries with Micro-Geographic Disaggregation. Sustainability 2020, 12, 6376. [Google Scholar] [CrossRef]
- Czarniawska, B. A Tale of Three Cities; Oxford University Press: Oxford, UK, 2002. [Google Scholar]
- Accardo, G.; Giani, E.; Giovagnoli, A. The risk map of Italian cultural heritage. J. Archit. Conserv. 2003, 9, 41–57. [Google Scholar] [CrossRef]
- Mariani, M.M. Coopetition as an emergent strategy: Empirical evidence from an Italian consortium of opera houses. Int. Stud. Manag. Organ. 2007, 37, 96–126. [Google Scholar] [CrossRef]
- Putnam, R.D. Making Democracy Work: Civic Traditions in Modern Italy; Princeton University Press: Princeton, NJ, USA, 1993. [Google Scholar]
- Settis, S. Battaglie Senza Eroi: I Beni Culturali tra Istituzioni e Profitto Electa; Mondadori Electa: Milan, Italy, 2005. [Google Scholar]
- Fratesi, U.; Perucca, G. Territorial capital and the resilience of European regions. Ann. Reg. Sci. 2018, 60, 241–264. [Google Scholar] [CrossRef]
- Perucca, G. The role of territorial capital in local economic growth: Evidence from Italy. Eur. Plan. Stud. 2012, 22, 537–562. [Google Scholar] [CrossRef]
- Lazzeretti, L.; Capone, F.; Seçilmiş, I.E. In search of a Mediterranean creativity. Cultural and creative industries in Italy, Spain and Turkey. Eur. Plan. Stud. 2016, 24, 568–588. [Google Scholar] [CrossRef]
- Kemeny, T.; Nathan, M.; O’Brien, D. Creative differences? Measuring creative economy employment in the United States and the UK. Reg. Stud. 2019, 54, 377–387. [Google Scholar] [CrossRef]
- European Commission. Promoting Cultural and Creative Sectors for Growth and Jobs in the EU COM(2012) 537 Final. 2012. Available online: https://eur-lex.europa.eu/legal-content/EN/TXT/PDF/?uri=CELEX:52012DC0537&from=EN (accessed on 20 September 2021).
- Pratt, A.C. Creative Clusters: Towards the Governance of the Creative Industries Production System? Media Int. Aust. 2004, 112, 50–66. [Google Scholar] [CrossRef]
- Oppio, A.; Bottero, M.; Ferretti, V.; Fratesi, U. Giving space to multicriteria analysis for cmplex cultural heritage systems: The case of the castles in Valle d’Aosta region. J. Cult. Herit. 2015, 16, 779–789. [Google Scholar] [CrossRef]
- Montalto, V.; Moura, C.J.T.; Langedijk, S.; Saisana, M. The Cultural and Creative Cities Monitor; European Commission: Brussels, Belgium, 2017. [Google Scholar] [CrossRef]
- JRC-OECD. Handbook on constructing composite indicators. In Methodology and User Guide; Nardo, M., Saisana, M., Saltelli, A., Tarantola, S., Hoffman, A., Giovannini, E., Eds.; OECD Publishing: Paris, France, 2008; ISBN 978-92-64-04345-9. [Google Scholar]
- Camerin, F. Open Issues and Opportunities to Guarantee the “Right to the ‘Healthy’ City” in the Post-Covid-19 European City. Contesti. Città. Territori. 2021, 2, 149–162. [Google Scholar]
- Moreno, C.; Allam, Z.; Chabaud, D.; Gall, C.; Pratlong, F. Introducing the “15-Minute City”: Sustainability, Resilience and Place Identity in Future Post-Pandemic Cities. Smart Cities 2021, 4, 93–111. [Google Scholar] [CrossRef]
- Pozoukidou, G.; Chatziyiannaki, Z. 15-Minute City: Decomposing the New Urban Planning Eutopia. Sustainability 2021, 13, 928. [Google Scholar] [CrossRef]
- Della Lucia, M.; Segre, G. Intersectoral local development in Italy: The cultural, creative and tourism industries. Int. J. Cult. Tour. Hosp. Res. 2017, 11, 450–462. [Google Scholar] [CrossRef]
- Jansson, J.; Power, D. Fashioning a global city: Global city brand channels in the fashion and design industries. Reg. Stud. 2010, 44, 889–904. [Google Scholar] [CrossRef] [Green Version]
- Cartone, A.; Panzera, D. Deprivation at local level: Practical problems and policy implications for the province of Milan. Reg. Sci. Policy Pr. 2021, 13, 43–61. [Google Scholar] [CrossRef]
- Dubini, P. L’infrastruttura Culturale di Milano in AA.VV. Città, Quartieri, reti e Cultura a Milano Che Fare Disponibile su. 2019. Available online: https://www.che-fare.com/progetto/milano-city-school-un-dossier-sulle-trasformazioni-culturali-del-territorio-milanese/ (accessed on 20 September 2021).
- Foster, S.R.; Iaione, C. The city as a commons. Yale Law Poly Rev. 2015, 34, 281. [Google Scholar] [CrossRef] [Green Version]
- Bertoni, A. Il valore della cultura nella città dei 15 minuti. Economia & management; SDA Bocconi: Milan, Italy, 2021; pp. 69–72. [Google Scholar]
- Soini, K.; Dessein, J. Culture-sustainability relation: Towards a conceptual framework. Sustainability 2016, 8, 167. [Google Scholar] [CrossRef] [Green Version]
- Ferilli, G.; Sacco, P.L.; Noda, K. Culture driven policies and revaluation of local cultural assets: A tale of two cities, Otaru and Yūbari. City Cult. Soc. 2015, 6, 135–143. [Google Scholar] [CrossRef]
- Ghasemi, K.; Hamzenejad, M.; Meshkini, A. An analysis of the spatial distribution pattern of social-cultural services and their equitable physical organization using the TOPSIS technique: The case-study of Tehran, Iran. Sustain. Cities Soc. 2019, 51, 101708. [Google Scholar] [CrossRef]


Publisher’s Note: MDPI stays neutral with regard to jurisdictional claims in published maps and institutional affiliations. |
© 2021 by the authors. Licensee MDPI, Basel, Switzerland. This article is an open access article distributed under the terms and conditions of the Creative Commons Attribution (CC BY) license (https://creativecommons.org/licenses/by/4.0/).
Share and Cite
Bertoni, A.; Dubini, P.; Monti, A. Bringing Back in the Spatial Dimension in the Assessment of Cultural and Creative Industries and Its Relationship with a City’s Sustainability: The Case of Milan. Sustainability 2021, 13, 10878. https://doi.org/10.3390/su131910878
Bertoni A, Dubini P, Monti A. Bringing Back in the Spatial Dimension in the Assessment of Cultural and Creative Industries and Its Relationship with a City’s Sustainability: The Case of Milan. Sustainability. 2021; 13(19):10878. https://doi.org/10.3390/su131910878
Chicago/Turabian StyleBertoni, Aura, Paola Dubini, and Alberto Monti. 2021. "Bringing Back in the Spatial Dimension in the Assessment of Cultural and Creative Industries and Its Relationship with a City’s Sustainability: The Case of Milan" Sustainability 13, no. 19: 10878. https://doi.org/10.3390/su131910878
APA StyleBertoni, A., Dubini, P., & Monti, A. (2021). Bringing Back in the Spatial Dimension in the Assessment of Cultural and Creative Industries and Its Relationship with a City’s Sustainability: The Case of Milan. Sustainability, 13(19), 10878. https://doi.org/10.3390/su131910878