1. Introduction
The over-representation of pedestrian-involved collisions in fatal outcome is a serious challenge in North America. In 2019, 6519 pedestrians were killed in traffic crashes in the US and Canada. This was equal to one death every 81 min and involved 17.2% of all traffic fatalities during this year [
1,
2]. Extensive effort has been made in recent years to apply advanced onboard technologies to alert drivers when pedestrians are in their close proximity or in hazard zone. Currently, most pedestrian detection sensors are visual or radar-based with significant limitations in certain conditions. They are not always reliable and may only be considered as a backup rather than a self-sufficient system for collision avoidance. Conditions in which pedestrians may not be detected by these systems are often specified in a vehicle owner’s manual. Examples are darkness, inclement weather conditions and lateral offset of the vehicle [
3]. Detection rates of camera systems significantly decline at nighttime, during precipitations, and in foggy weather conditions. Cameras should be kept relatively clean which may not be observed in many situations [
4]. Resolution in radar sensors is relatively low and is not effective in recognizing object details or distinguishing between pedestrians and other objects. Lidar systems are sensitive to precipitation and fog. They may also be blinded by direct sunlight. Ultrasonic detectors do not have the potential to be used for pedestrian detection. They usually have an effective range of 6 m or less and are typically utilized in parking assistance systems [
3].
With advances in communication technologies, innovative traffic control systems have been developed and are commercially available. Wireless technology has been widely used in traffic studies in recent years. Utilizing wireless signal scanning sets is a common technique for traffic data collection. Wireless signal transmitters (beacons) are sufficiently widespread among road users thanks to the popularity of Wi-Fi and Bluetooth activated smart devices; therefore, the transmitted signals by beacons may be collected by signal scanners and used in determining some traffic parameters.
Unique media access control (MAC) address, signal mode, detection timestamp and received signal strength indicator (RSSI) are the only data the current models of signal scanners provide. A MAC address is a unique ID assigned to each network module. None of these provide direct information about the position of the beacon. Due to the complexity of wireless signal positioning using these data, the applications of this technology in traffic studies have historically been limited to finding some parameters in certain situations. The technology is commonly applied for finding travel time and origin-destination in long road segments using MAC re-identification technique. This is achieved by determining the presence of a beacon located at an origin and a destination by signal scanners. Although the most common applications of these scanners are in travel time measurement and origin-destination classification, recent studies on their application in safety management are emerging. An area with a significant value is the application of wireless signal scanning in real-time vehicle–pedestrian collision warning systems as a supplement for the currently available technologies. This requires determination of positional data of pedestrians.
Extensive effort has been made for developing reliable methods to locate beacons based on their RSSI values, e.g., [
5], since these values normally decrease along with the distance between the beacon and signal scanner. RSSI values solely collected by a signal scanner, can provide an estimation of the distance, but not the direction nor the position. For finding a beacon position, the data obtained by multiple signal scanners should be utilized. Trilateration and radio map creation are among the methods introduced for beacon positioning, although they generally come with inaccuracies and need further improvement. This is because RSSI values normally have fluctuations and include outliers.
2. The Case for Sustainable Models of Travel
With the recent advances in wireless signal positioning using the data provided by wireless signal scanners, new avenues have been opened to application of this technology in traffic studies in which accurate positional data of road users are required. The case for studying sustainable modes of travel and vulnerable road users is especially evident. Most pedestrians and cyclists currently, or in the soon future, carry smart devices on their person. The practical context is to utilize the prevalence of beacons and advanced sensing technology in real-time vehicle–pedestrian collision warning systems with the goal of preventing these types of crash. These systems should be able to detect pedestrians if present in the hazard zone of vehicles. The vehicle hazard zone may be considered an area around the vehicle whose edges are several meters away from it. Detection of pedestrians in the hazard zone may be done on account of the potential of RSSI values transmitted by pedestrians’ beacons for wireless signal positioning.
The presence of a pedestrian carrying a beacon in the hazard zone of a vehicle may be determined in two approaches. In the first approach, a certain distance from the vehicle is specified as its hazard zone. The RSSI value corresponding to this distance is determined and is set as warning threshold for the system. Detection of RSSI values higher than this threshold by a signal scanner installed on the outer side of the vehicle will be the indicator of the presence of a beacon in its hazard zone (distance-based approach). In the second approach which is more complicated, instead of only determining the presence of a beacon at a distance closer than a threshold around the vehicle, the exact position of the beacon is determined by using multiple scanners. Therefore, the position of the pedestrian walking in the vicinity of a vehicle can be dynamically determined and such information is utilized to protect the pedestrian. Specifying a hazard zone around the vehicle, the driver will be alerted if the position of the beacon is determined to be inside this zone (position-based approach). Successful application of wireless technology as a collision warning system in motorized vehicles, especially commercial vehicles, may significantly enhance the safety of pedestrians, resulting in reduction of the number of fatalities and injuries due to vehicle–pedestrian crashes. This is dependent on the characteristics of wireless signals as well as the accuracy of wireless signal ranging and positioning methods.
Wi-Fi, Bluetooth, and BLE are three widespread signal modes, transmitted by popular beacons used in daily life. BLE started as part of Bluetooth 4.0, designed for lower power consumption as well as lower complexity and cost in comparison with Bluetooth. These come at the expense of reductions in some functionalities such as throughput and support of voice channels in order to reduce the required memory [
6]. The strength of the three signal modes received by signal scanners is measured by RSSI, therefore the available ranging and positioning methods may be applied for three of them. While the three signal modes may be utilized in collision warning systems, the question which arises is: which signal mode leads to higher accuracy and functionality. Accurate positional data of pedestrians are required in these systems. To address this, it is required to investigate the important factors which may affect the aforementioned measures. These factors should be selected considering the characteristics of traffic systems. They should be investigated in an outdoor environment and the moving nature of road users needs to be considered. Concerning these characteristics, five factors including [i] RSSI-distance relationship, [ii] precipitation effects on the signals, [iii] motion effects, [iv] non-line of sight effects, and [v] signal transmission rates were identified for evaluation. These factors are important in comparing the suitability of the three signal modes for traffic safety applications which need the accurate positional data of pedestrians.
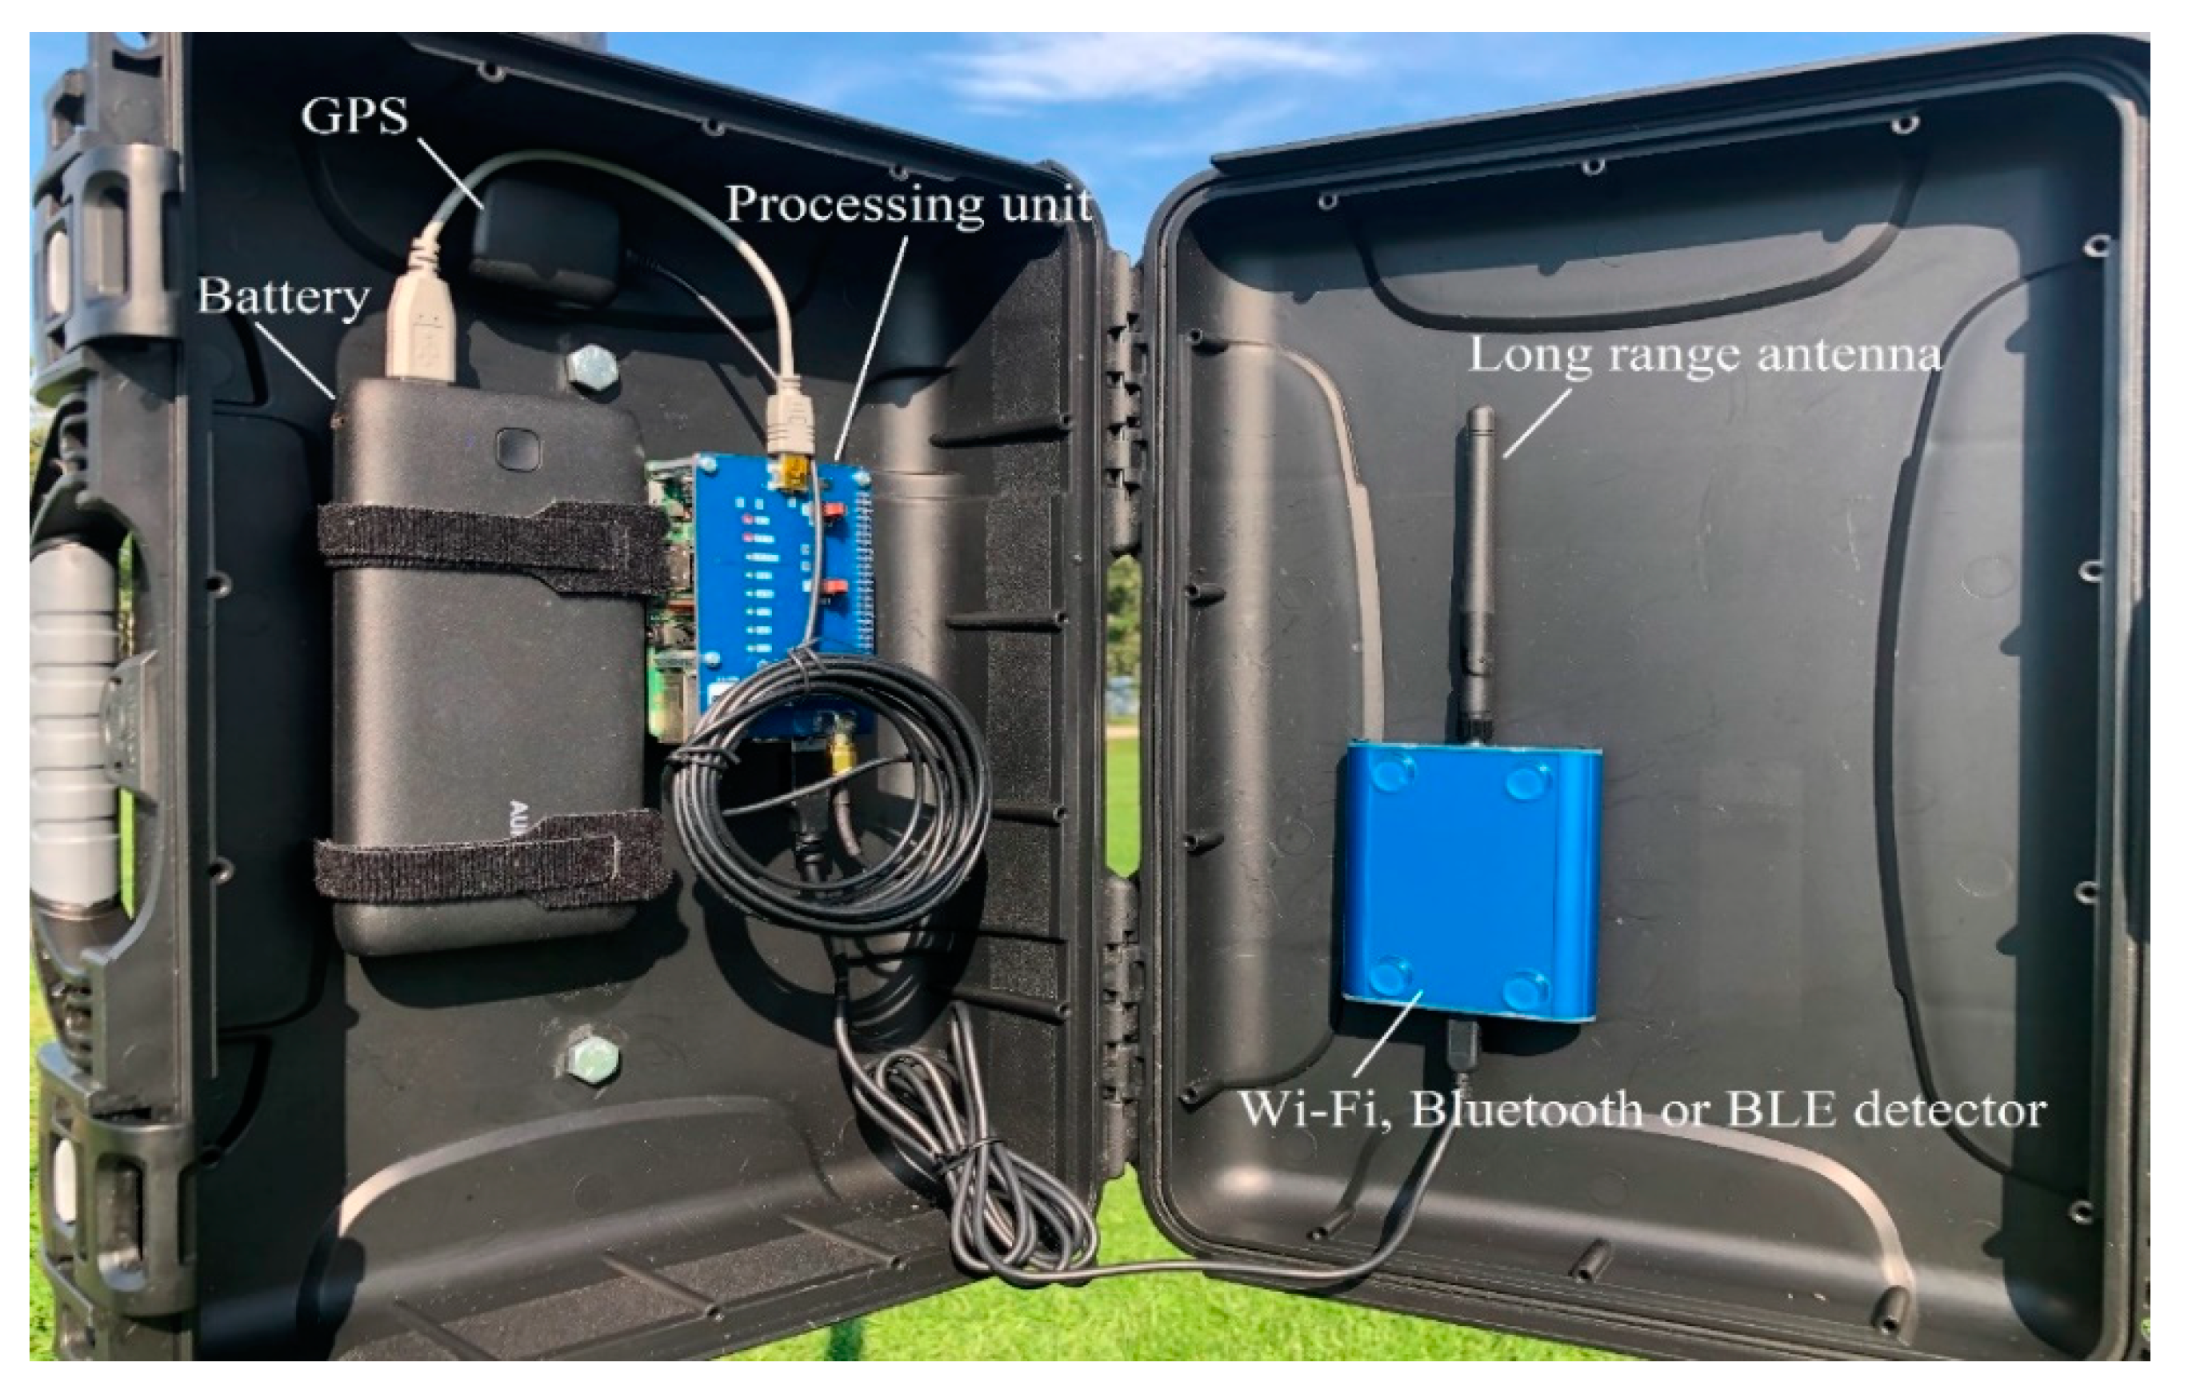
This research was conducted using signal scanners, typically used for traffic data collection which function in three scanning modes. They could scan the three signal modes in their surrounding area using three separate signal detectors. There was also a software platform for monitoring and analyzing the collected data including MAC address, signal mode, detection timestamp, and RSSI. The three scanning modes were Wi-Fi (IEEE 802.11 b/g/n, Receiver Sensitivity: −92 dBm, Transmit Power: +18 dBm), Bluetooth (Class 1, Receiver Sensitivity: −90 dBm, Transmit Power: +18 dBm), and BLE (Receiver Sensitivity: −96 dBm, Transmit Power: +4 dBm) as shown in
Figure 1. The antennas used with the signal scanners were long-range, omnidirectional, 2400 MHz and 2 dBi gain. The beacon in Wi-Fi and Bluetooth modes was an Android operated cell phone and the BLE beacon was a BLE 4.0/4.1 signal transmitter.
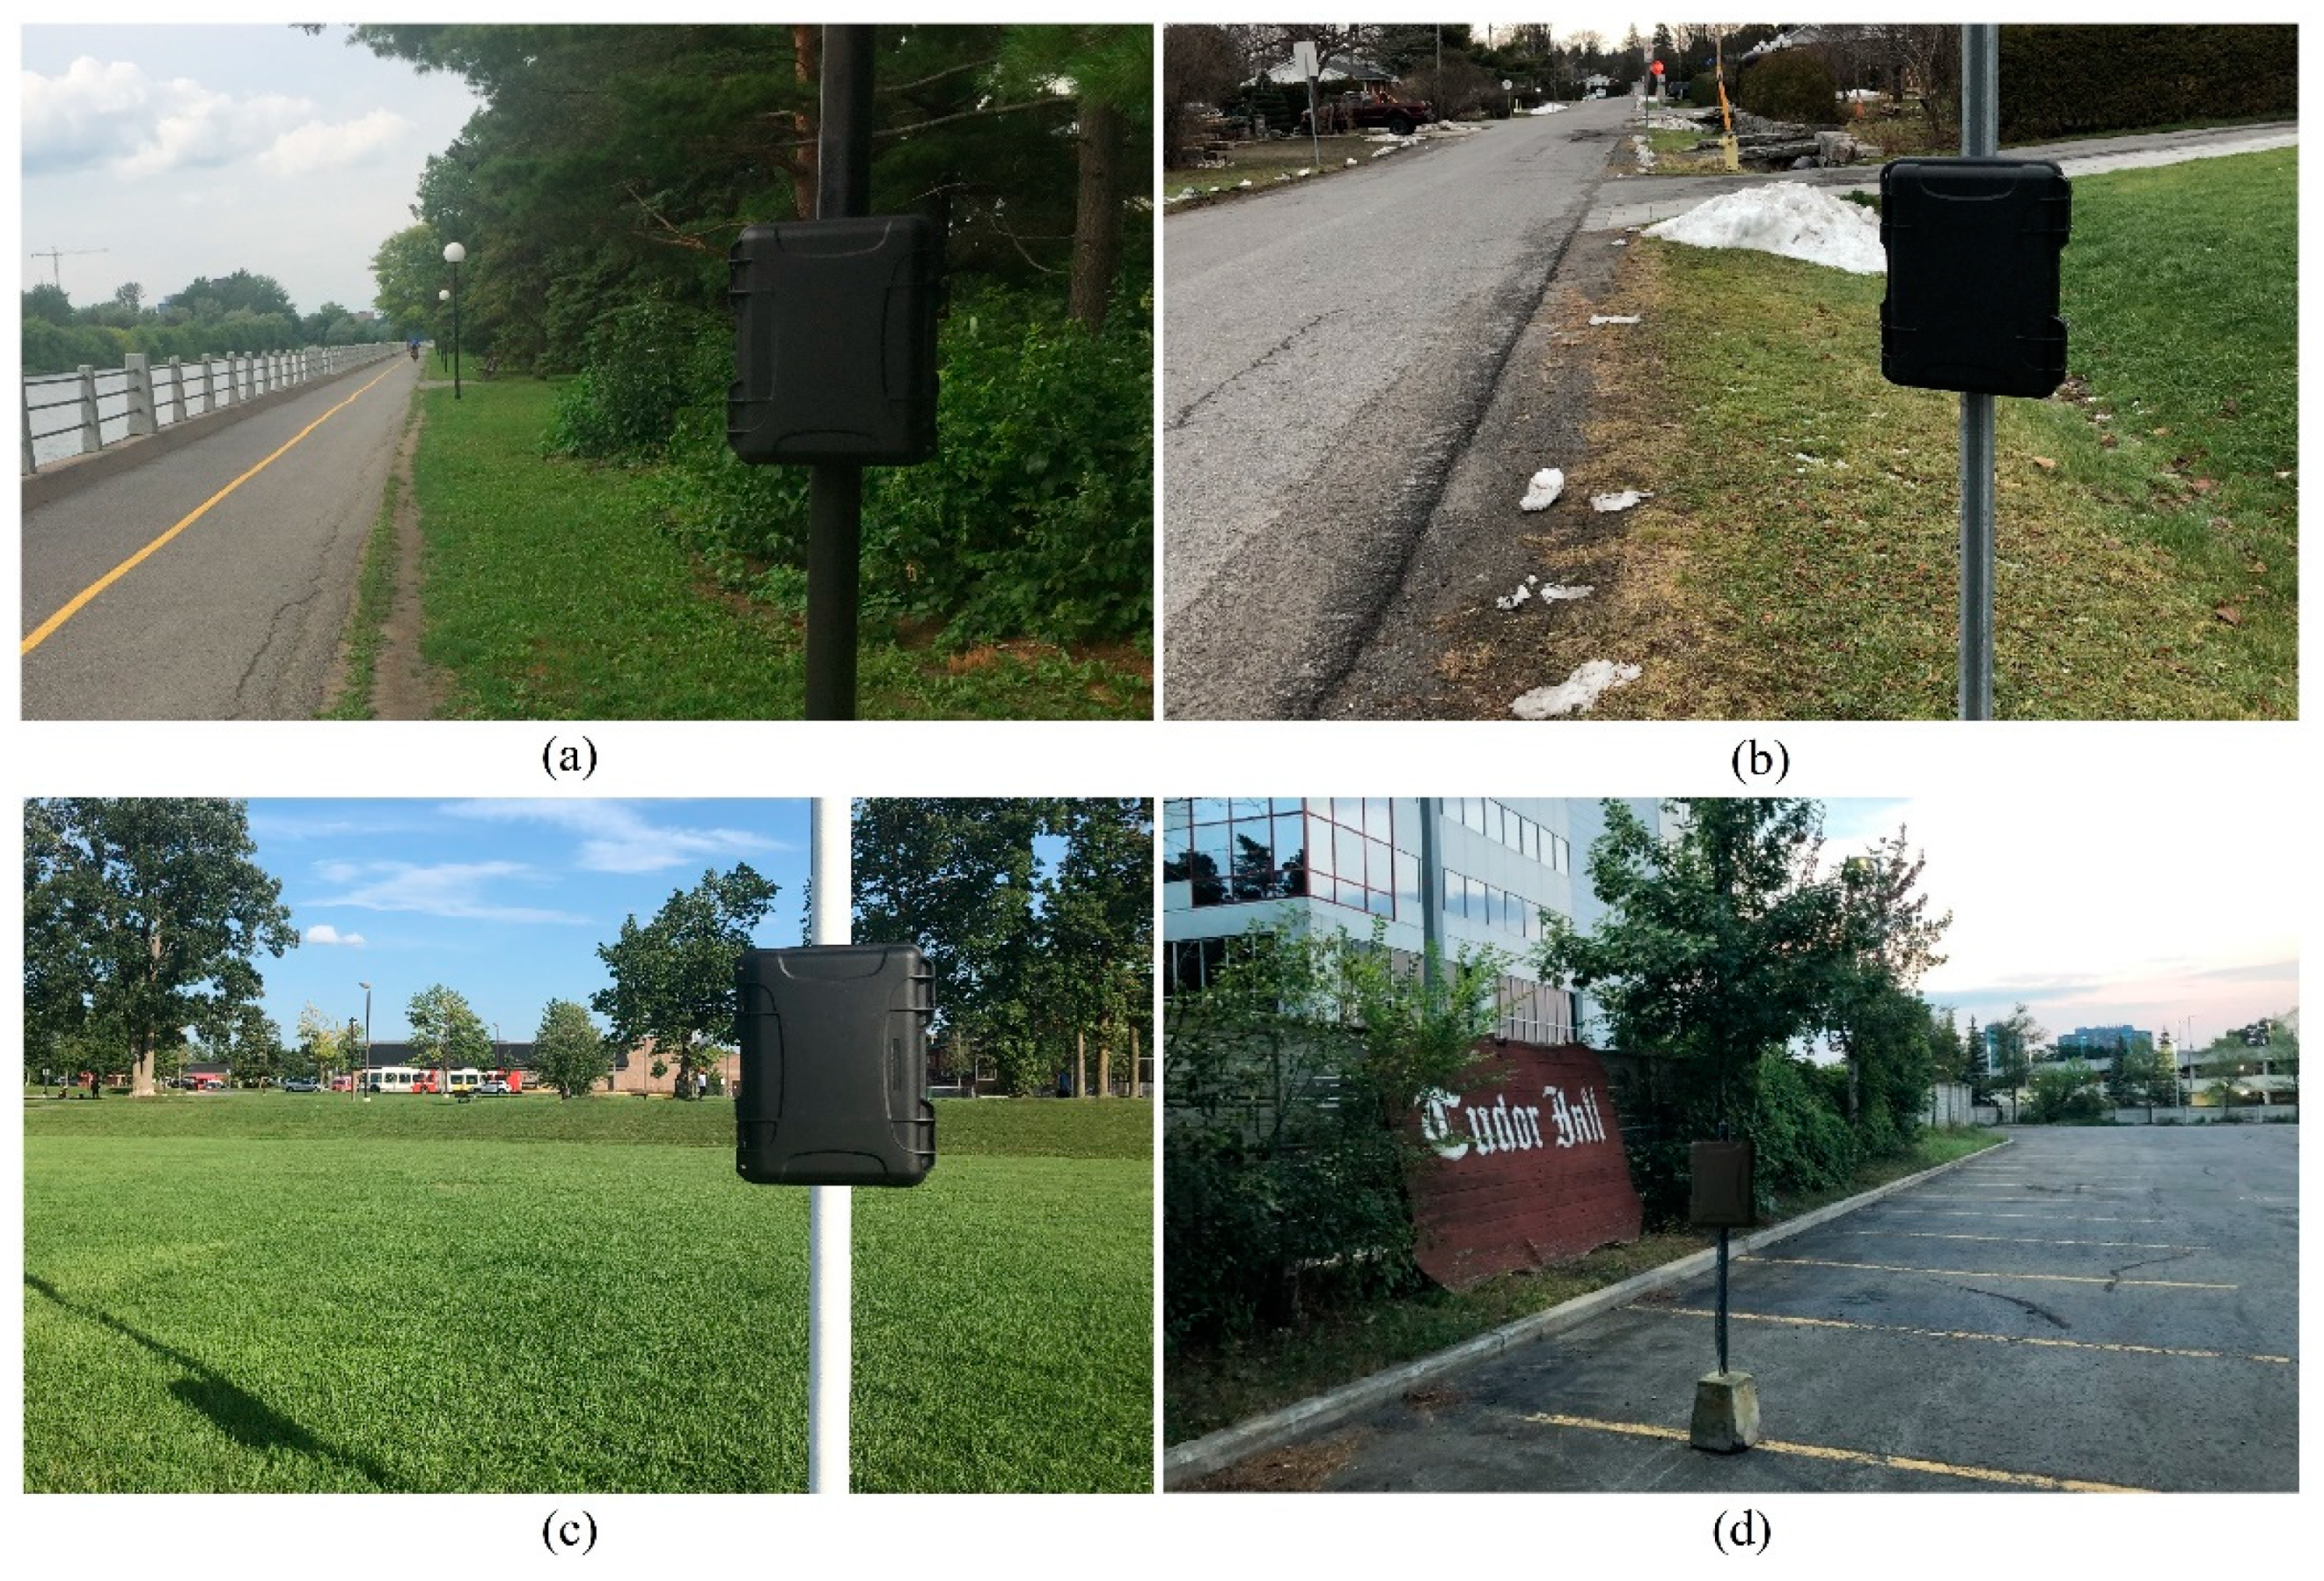
Five experiments were designed for evaluating the five aforementioned factors. They were conducted outdoors in four sites located in Ottawa, Canada (
Figure 2): (a) Rideau Canal bike road, a path used by bikes and pedestrians located several meters away from Colonel By Drive near Carleton University campus, both with moderate traffic flows (Site 1), (b) a residential street with a low traffic flow (Site 2), (c) Hunt Club-Riverside Park soccer field next to Paul Anka Drive with a moderate traffic flow (Site 3), (d) a public parking area next to a high-rise building in which there were a few vehicles on the experiment day (Site 4). As mentioned, the locations were not isolated; there were other beacons in the areas and some activities taking place in the vicinity. The location, weather and environmental conditions were approximately similar for each experiment. Based on the results of the five experiments, the most appropriate wireless signal mode for integration in collision warning systems will be recommended.
3. Previous Work
There is a growing interest in studies which attempt to accurately localize agents in a system without using satellite signals, e.g., the Global Positioning System (GPS). The strength of radio frequency signals transmitted by beacons may be applied to estimate the distance between the beacon and signal scanner. This distance is estimated by the models which relate the reduction in radio frequency signals received by the signal scanner to its distance from the beacon [
7].
Wi-Fi and Bluetooth signal interference influence the speed, strength, and range of the signals. This can reduce the accuracy of the positioning procedure. Radio frequency signals are affected by reflection, refraction, and diffraction [
8]. Transmission of signals in a path obstructed by obstacles is very probable in the real world and is called non-line of sight transmission. Variations in the path conditions of wireless signals between a beacon and a signal scanner causes signal fading. Shadowing is a situation in which the existence of obstructions in the wireless propagation path causes attenuation in the strength of the signals [
9]. These attenuations vary due to surface type and signal frequency [
10]. Finding the suitable propagation model is complex and sometimes not possible, because of the different objects shadowing the signals. The signals may take multi paths and hence result in erroneous results [
7]. Due to the existence of blockage or scattering, the calculated distance may have inaccuracy which even increases as the distance between the beacon and scanner increases [
11].
RSSI-distance models based on the detections of one signal scanner are only able to estimate the distance between the beacon and signal scanner; hence neither the direction nor the position. Regarding this, it will be important to develop proper approaches to combine the results gathered from different signal scanners to find the position of a beacon with adequate accuracy. When information from additional scanners is available, it will be possible to find the position of the beacon, using positioning methods [
11].
Triangulation is a method applicable in wireless signal positioning using triangle specifications to find a beacon position. It is based on angle measurement and estimates an unknown point position, forming triangles which connect it to points with known positions. The positioning method is called trilateration if three distances from an unknown point to three known points are used instead of angles. If both angles and distances are used in positioning, the method is called triangulateration. If the common area of the three circles formed by the three measured distances in trilateration is large, finding the exact position will be more difficult [
12]. Another method for wireless signal positioning is creating radio maps and using appropriate algorithms such as
k-nearest neighbors (
k-NN).
k-NN is a mathematical data classification algorithm for assigning an object to a group according to the similarity of their specifications [
13]. Specifications in this method may be the RSSI values of the beacon received by multiple signal scanners and the radio maps created for a number of reference points. These authors [
5] developed this method in a transportation-based study using four Bluetooth signal scanners in a four-legged intersection to determine pedestrians’ positions using Bluetooth signals. It was found that [i] increasing the distance between the radio map stations along with meeting the minimum accuracy requirements, [ii] making the system arrangement asymmetric can improve the positioning accuracy.
Applying wireless technology for traffic data collection has been the subject of several research projects in recent years. The reliability and efficiency of Bluetooth MAC re-identification technique in comparison with traditional methods for finding arterial traffic parameters such as travel time, origin-destination and average speed was confirmed by [
14]. The average detection rate of Bluetooth signal scanners on highway segments was investigated by [
15] and reported between 2.00% and 8.13%. It was also found that the rate is generally lower in peak hours compared with off peak hours. The mean error of travel time measurement in arterials using Bluetooth MAC re-identification technique was investigated by [
16] and found to be sufficiently low in different traffic conditions. Ref. [
17] combined the data collected by loop detectors and a Bluetooth traffic monitoring system to enhance the accuracy of traffic speed measurement on freeways. Ref. [
18] confirmed the satisfactory performance of Bluetooth MAC re-identification technique for origin-destination data collection in access-controlled networks. Ref. [
19] presented a technique to distinguish between motor vehicles and bicycles prior to travel time calculation using Bluetooth signals. The technique used different criteria such as MAC address specifications to classify travel modes. An approach for determination of different transportation modes applying clustering algorithms was proposed by [
20]. The approach performed based on a parameter defined as the total time a Bluetooth beacon spent in the detection area of the entire Bluetooth signal scanning system. A method for filtering the data collected by Wi-Fi and Bluetooth signal scanners was proposed by [
21] in order to accurately find pedestrian counts, flows, and wait times. Ref. [
22] developed a simulation-based technique which worked on the basis of multiple Bluetooth inquiry scans in order to model the detection of Bluetooth beacons for using in transportation applications.
Behavior of pedestrians in presence of vehicles and safety of walking as a sustainable mode of travel has been the subject of numerous studies. In order to identify important behavioral differences of pedestrians in different situations, gap acceptance and crossing probability models were developed using linear and logistic regression by [
23]. Fixed and in-motion videography techniques were applied to analyze pedestrians’ behaviors from the perspective of both pedestrians and drivers. A data-driven model was proposed by [
24] to simulate trajectories of pedestrians attempting to avoid collisions. The model did not need a calibration phase and was developed using generalized regression neural networks based on only one free parameter. The relationship between incidents and the potential contributing factors was probed by [
25]. Negative and random negative binomial models were developed to predict the number of incidents and an inverse stepwise procedure was used to determine the importance of variables. Horizontal alignment, visibility, speed, AADT and pavement conditions were identified to have significant impacts on occurrence of incidents. The performance of several statistical methods and machine learning algorithms in predicting incident clearance time was investigated by [
26]. It was observed that statistical methods provide more details about the relationship between variables. By contrast, machine learning algorithms ignore the relationship between the variables. Instead, they aim at finding the optimal mapping for prediction. In order to analyze and predict incident clearance time in freeways, a Bayesian averaging method was applied by [
27]. Posterior probabilities were used as the weights for averaging the feasible models. The prediction performance of the method was assessed comparing it with two classical methods including Cox proportional hazards and accelerated failure time methods and was found to be superior.
Several researchers have tried to use the data collected by wireless signal scanners in real-time safety analysis. In an effort to extend the applications of this technology, [
28] developed a microscopic simulation tool using cellular automata models. Occupancy and traffic flow over time were correctly determined on roads with traffic flow anomalies. An automated algorithm for detecting incidents in arterials by Bluetooth signal scanners was proposed by [
29]. The algorithm performed based on travel time and volume data obtained by a MAC re-identification system and a time moving average approach with the capability of recognizing travel time and volume data patterns caused by incidents. Ref. [
30] proposed a technique based on time dependent comparison of travel times with neighbor values to differentiate between normal and anomalous situations. Bluetooth travel time data were monitored in near real-time to determine if they are beyond a plausible threshold for incidents according to the historical data. Ref. [
31] investigated the relationship between occurrence of incidents in urban arterials and real time characteristics of traffic streams as well as signal timing. Bayesian conditional logistic models were created to find parameters with significant impacts on occurrence of incidents. Average speed, downstream green ratio, upstream left-turn volume, and rain were identified as factors with significant impacts. An automated incident detection method using Bluetooth data for freeways was presented by [
32]. The method was developed applying isolation forest technique based on the fact that anomalies are scarce and distinct, consequently easier to isolate in comparison with normal situations. Ref. [
4] proposed a technique for blind spot detection based on RSSI values of BLE signals. The purpose was notifying pedestrians and drivers of the possible blind spot collisions. Being at a distance less than 8 m to trucks was specified as the measure for vulnerability of the pedestrians. The RSSI value corresponding to this distance was considered equal to −70 dBm. The system alerted both the driver and pedestrian if a signal with an RSSI value of higher than −70 dBm was detected as a sign for a potential hazard. The results indicated that the system performed well with a high reliability.
4. Study Method
The comparison between the three modes of wireless signals will be in the form of five field experiments. Each experiment was conducted in the three modes separately. These are described in the next sections.
4.1. Experiment 1: The Relationship between Received Signal Strength Indicator (RSSI) and Distance
RSSI is a parameter obtained in signal scanning which may be used for finding the distance between a beacon and a signal scanner and, therefore, has the potential to be used in beacon positioning. The robustness of the relationship between RSSI and distance is important for distance-based collision warning systems which operate based on a set RSSI threshold corresponding to the beginning of the hazard zone of the vehicles. This relationship is also important for finding the position of the beacons in position-based approach. Distances are directly used in positioning methods such as trilateration, while in methods like radio map, they affect the results indirectly. Hence, a more accurate relationship between RSSI and distance leads to more accurate positioning results. This will increase the accuracy and functionality of collision warning systems.
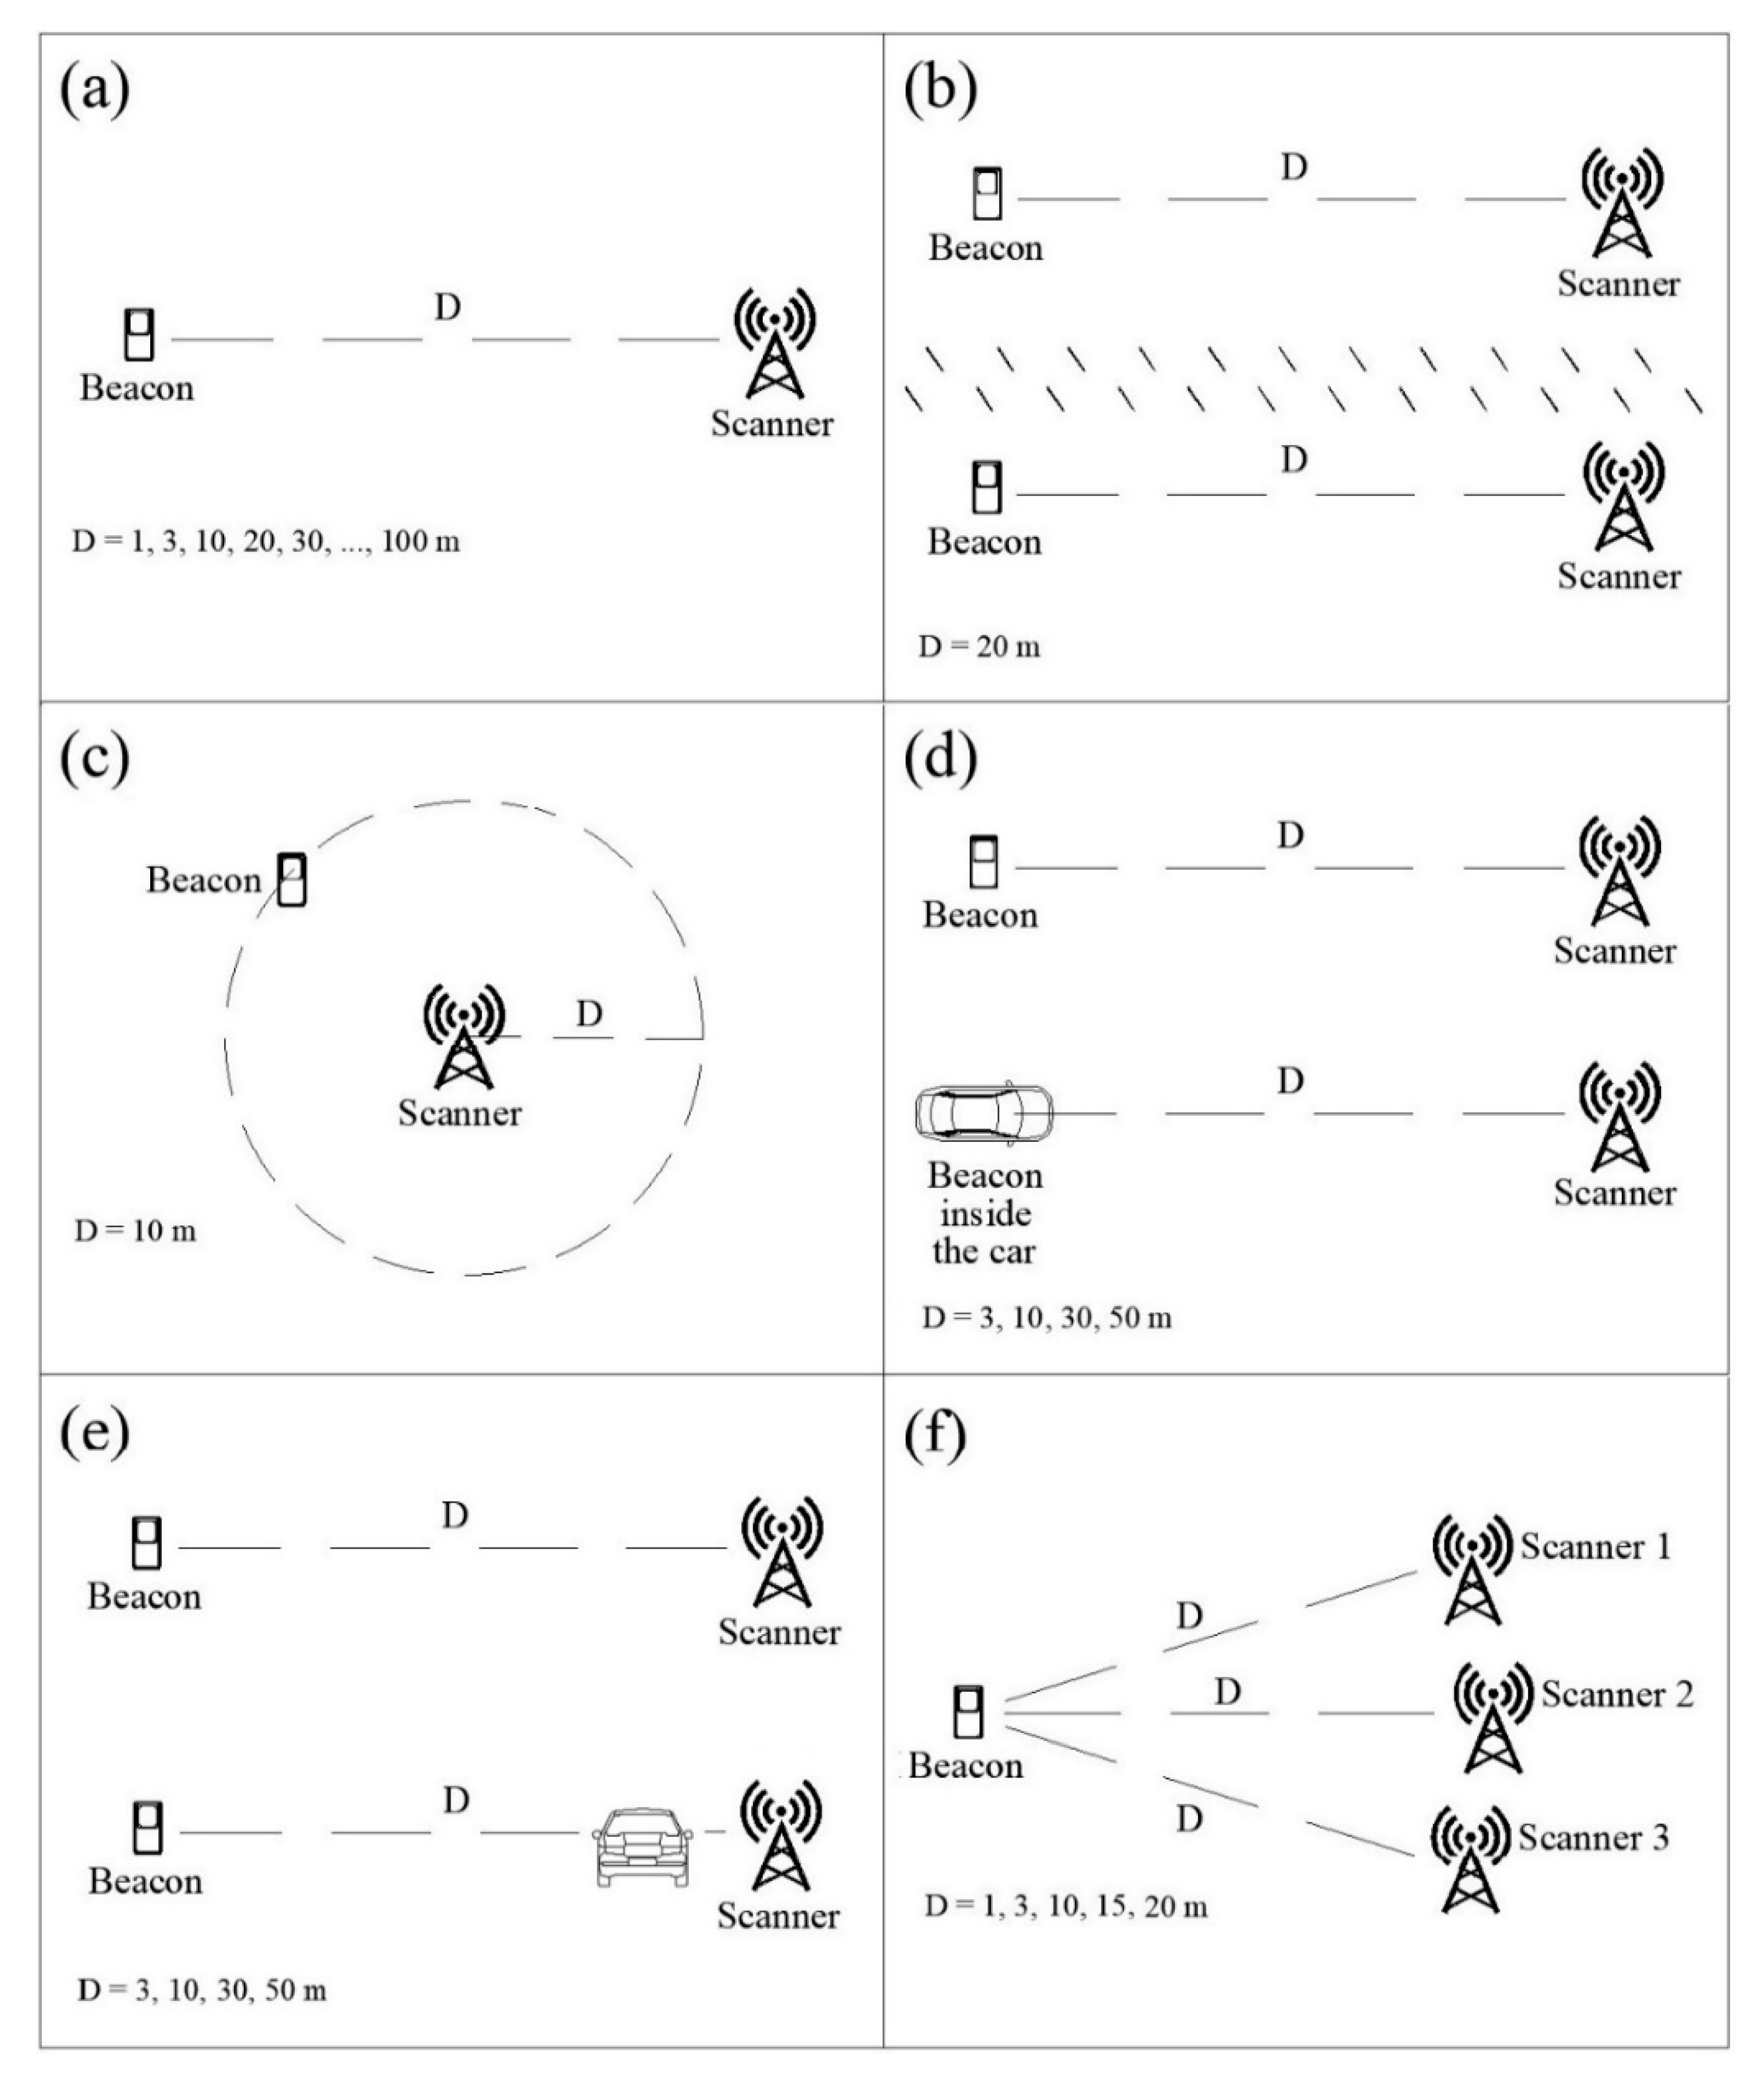
In order to investigate the quality of the relationship between RSSI and distance, a signal scanner was installed on a lighting pole at the height of 1 m and 12 stations were specified on the ground on a longitudinal path (Site 1). The distance between the first station and the signal scanner was 1 m; this distance was 3 m for the second station, 10 m for the third station and after that the distance between each two stations increased to 10 m. The distance between the last station and the signal scanner was considered equal to 100 m (
Figure 3a). The beacon was held stationary at each station at the height of 1 m for 1 min, beginning from the nearest station and then was carried to the next stations. The signals transmitted by the beacon from each station were recorded by the signal scanner.
To determine the relationship, the corresponding RSSI-distance chart was created, and its best fit curve was drawn. RSSI values usually involve some fluctuations and outliers which pollute the data. In order to specify the closeness of the data to the fit curve, R-squared value of the fit curve was specified. In addition to the RSSI-distance curve and R-squared value, in order to determine the dispersion of the data at each distance, five stations were selected (3, 10, 40, 70, and 100 m from the signal scanner) and the variance of the RSSI values was calculated for each of them.
4.2. Experiment 2: Precipitation Effects
Vehicle–pedestrian collision warning systems generally need to operate outdoors; hence, it is important to investigate how variations in weather conditions may impact the quality of signal detection. Rainfall as a probable event in outdoor areas was selected for investigating the effects of weather changes on the data. In order to check if rainfall can have significant impacts on the signals, an experiment was conducted in Site 2. A beacon was placed at a distance of 20 m from a signal scanner (both at the height of 1 m) on a day for which a moderate rainfall had been forecast and signals were continuously collected (
Figure 3b). The moment at which rainfall started was recorded and the signals collected from 15 min before the rainfall to the beginning of it, and the signals collected from the beginning of the rainfall to 15 min after it were separated and compared. In order to compare these two sets of data, the number of the detections, average RSSI values and their variances were considered.
4.3. Experiment 3: Effects of Beacon Motion
According to the fact that in general, both signal detection and positioning in traffic systems should be done for moving beacons, investigating the impacts of motion of the beacons as the transmitters of the signals on their quality is important. Since the beacons are carried by pedestrians, the impacts of the motion of pedestrians were investigated in the research. These impacts were investigated in an experiment conducted on a circular path to keep the other factors, especially the distance between the beacon and the signal scanner constant. A circle with a radius of 10 m was drawn on the ground in Site 3. The signal scanner was placed on the center of the circle at the height of 1 m from the ground. A research assistant carried the beacon at the height of 1 m on the circle perimeter, running at a speed of approximately 10 km/h for two minutes and the transmitted signals were collected by the signal scanner (
Figure 3c). The speed of 10 km/h was selected because pedestrians may rarely move faster than that in urban or rural transportation systems. This is a running speed and may hardly be reached when walking. Then, the beacon was held stationary on a point on the circle perimeter by the research assistant for two more minutes and the data were collected in this position too. The data collected from the moving beacon and the stationary beacon were compared with each other considering the number of the detections, average RSSI values and their variances.
4.4. Experiment 4: Non-Line of Sight Effects
In traffic systems, signals are transmitted by beacons belonging to road users in different situations. They may be riding bikes or be the occupants of vehicles; the beacon may be in a pedestrian’s pocket or may be in his/her hand. Existence of obstacles between a beacon and a signal scanner causes the signals to travel through non-line of sight paths, which may have some impacts on the signals. Therefore, investigating the impacts of existence of obstacles in transmission path on the signals is necessary. Although this may require extensive research and lots of experiments to be thoroughly studied, the impacts of auto glass and vehicle blockage as two examples of the situations causing non-line of sight in traffic systems were investigated in the form of two tests. Each test had two stages. The first stages were conducted in line of sight (free path), and the second stages were conducted in non-line of sight conditions.
In the first test, a signal scanner was installed on a pole beside a residential street (Site 2) at the height of 1 m and four stations were specified on the ground along the street. The distances between the stations and the signal scanner were 3, 10, 30 and 50 m. The signals transmitted by the beacon from each station were collected in the two stages to examine free and non-line of sight paths. In the first stage in which the path was free, a research assistant stood on each of the stations and held the beacon in his hand at the height of 1 m. In the second stage, the beacon was placed on top of the dashboard in a car with closed windows while stopping on each of the stations to examine non-line of sight situations (
Figure 3d). The duration of data collection on each station in each stage was five minutes. For comparison of the data collected from each station, the number of the detections, average RSSI values and their variances in the two situations were considered.
The second test was conducted in a public parking area (Site 4). The first stage of this test was similar to the first stage of the first test, but in the second stage, the signal transmission path was blocked by a vehicle (
Figure 3e). In this stage, the beacon was held stationary at each of the four stations by a research assistant for five minutes while there was a stationary vehicle between the beacon and the signal scanner. The distance between the vehicle and the signal scanner was considered equal to 1 m.
4.5. Experiment 5: Signal Transmission Rates
In wireless signal positioning methods such as trilateration or radio map, it is necessary to have signals detected simultaneously by multiple signal scanners in order to determine the position of a moving beacon at a certain moment. Therefore, the higher probability of having such detections increases the chance to have proper signals for positioning. Because of the nature of safety criteria, this factor is important in the design of position-based collision warning systems. To have on time alerts, the system requires to be able to determine the beacon positions in short time intervals. A high probability of having simultaneous detections by multiple signal scanners is necessary to meet this requirement. In the distance-based approach, short intervals between transmitted signals are important for the system. This reduces the time difference between entrance of the beacon into the hazard zone and alert by the system, which is the indicator of its fast performance.
To investigate signal transmission rates and the opportunity to have simultaneous detections, an experiment was conducted in Site 1 using three signal scanners equipped with the same type of signal detectors. Three signal scanners were used because this is the minimum number of observations required for positioning in trilateration. This is also an acceptable number of signal scanners in radio map technique. The three signal scanners were placed at the height of 1 m above the ground beside each other on a circular sector. Five stations at 1, 3, 10, 15, and 20 m from the signal scanners were specified on the ground. Each station had the same distance from all the three signal scanners (
Figure 3f). The beacon was placed stationary on each station at the height of 1 m for 30 min, so that the total experiment duration was 150 min. The signals transmitted by the beacon were collected by the three signal scanners in order to specify the moments at which the three of them had detected a signal (matching moments). Because of the large number of detections, a MATLAB code was written for finding these moments and the number of them. A time difference of less than 1000 milliseconds, equal to one second was considered as the measure for being simultaneous in the code. The probability of having simultaneous detections by three signal scanners is equal to the number of matching moments divided by the average number of total detections by a signal scanner during the experiment.
5. Results
5.1. Experiment 1: The Relationship between RSSI and Distance
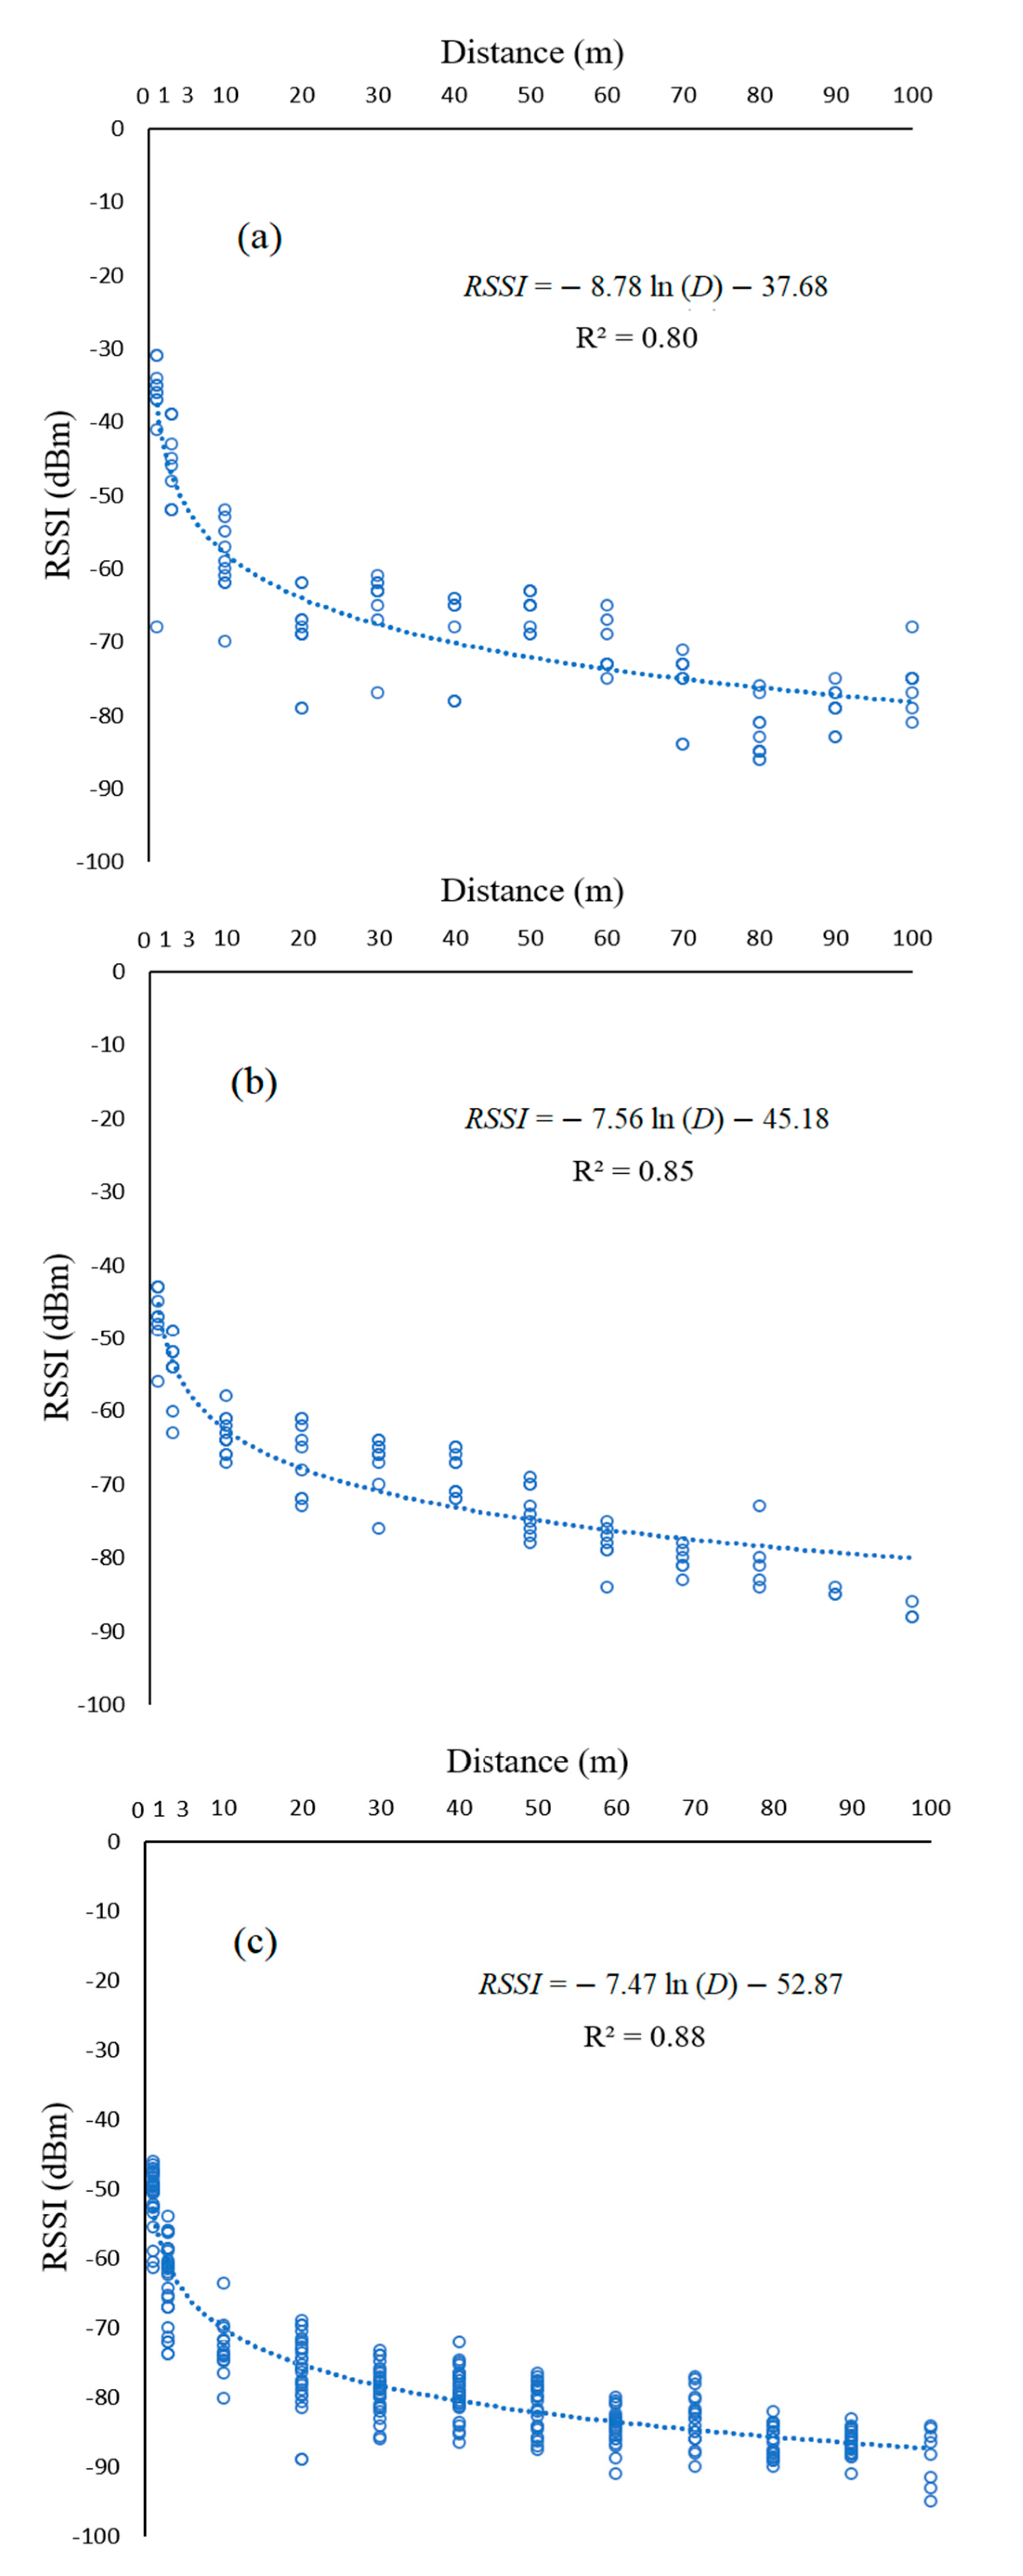
RSSI-distance charts and their best fit curves in the three studied modes may be observed in
Figure 4. It is evident that there is a logarithmic relationship between RSSI values and the distance from the beacon to the signal scanner which is true for the RSSI-distance charts of the three studied modes. In these charts, as the distance increases, the curve slope decreases. The curves have their highest slopes in short distances and then the slopes gradually go to near zero.
The typical equation for the fit curves of the RSSI-distance charts is:
where:
RSSI is received signal strength indicator in dBm;
D is the distance from beacon to signal scanner in m;
a and b are positive coefficients;
and the charts for estimating the distance based on RSSI have exponential fit curves with the following typical equation:
in which:
According to
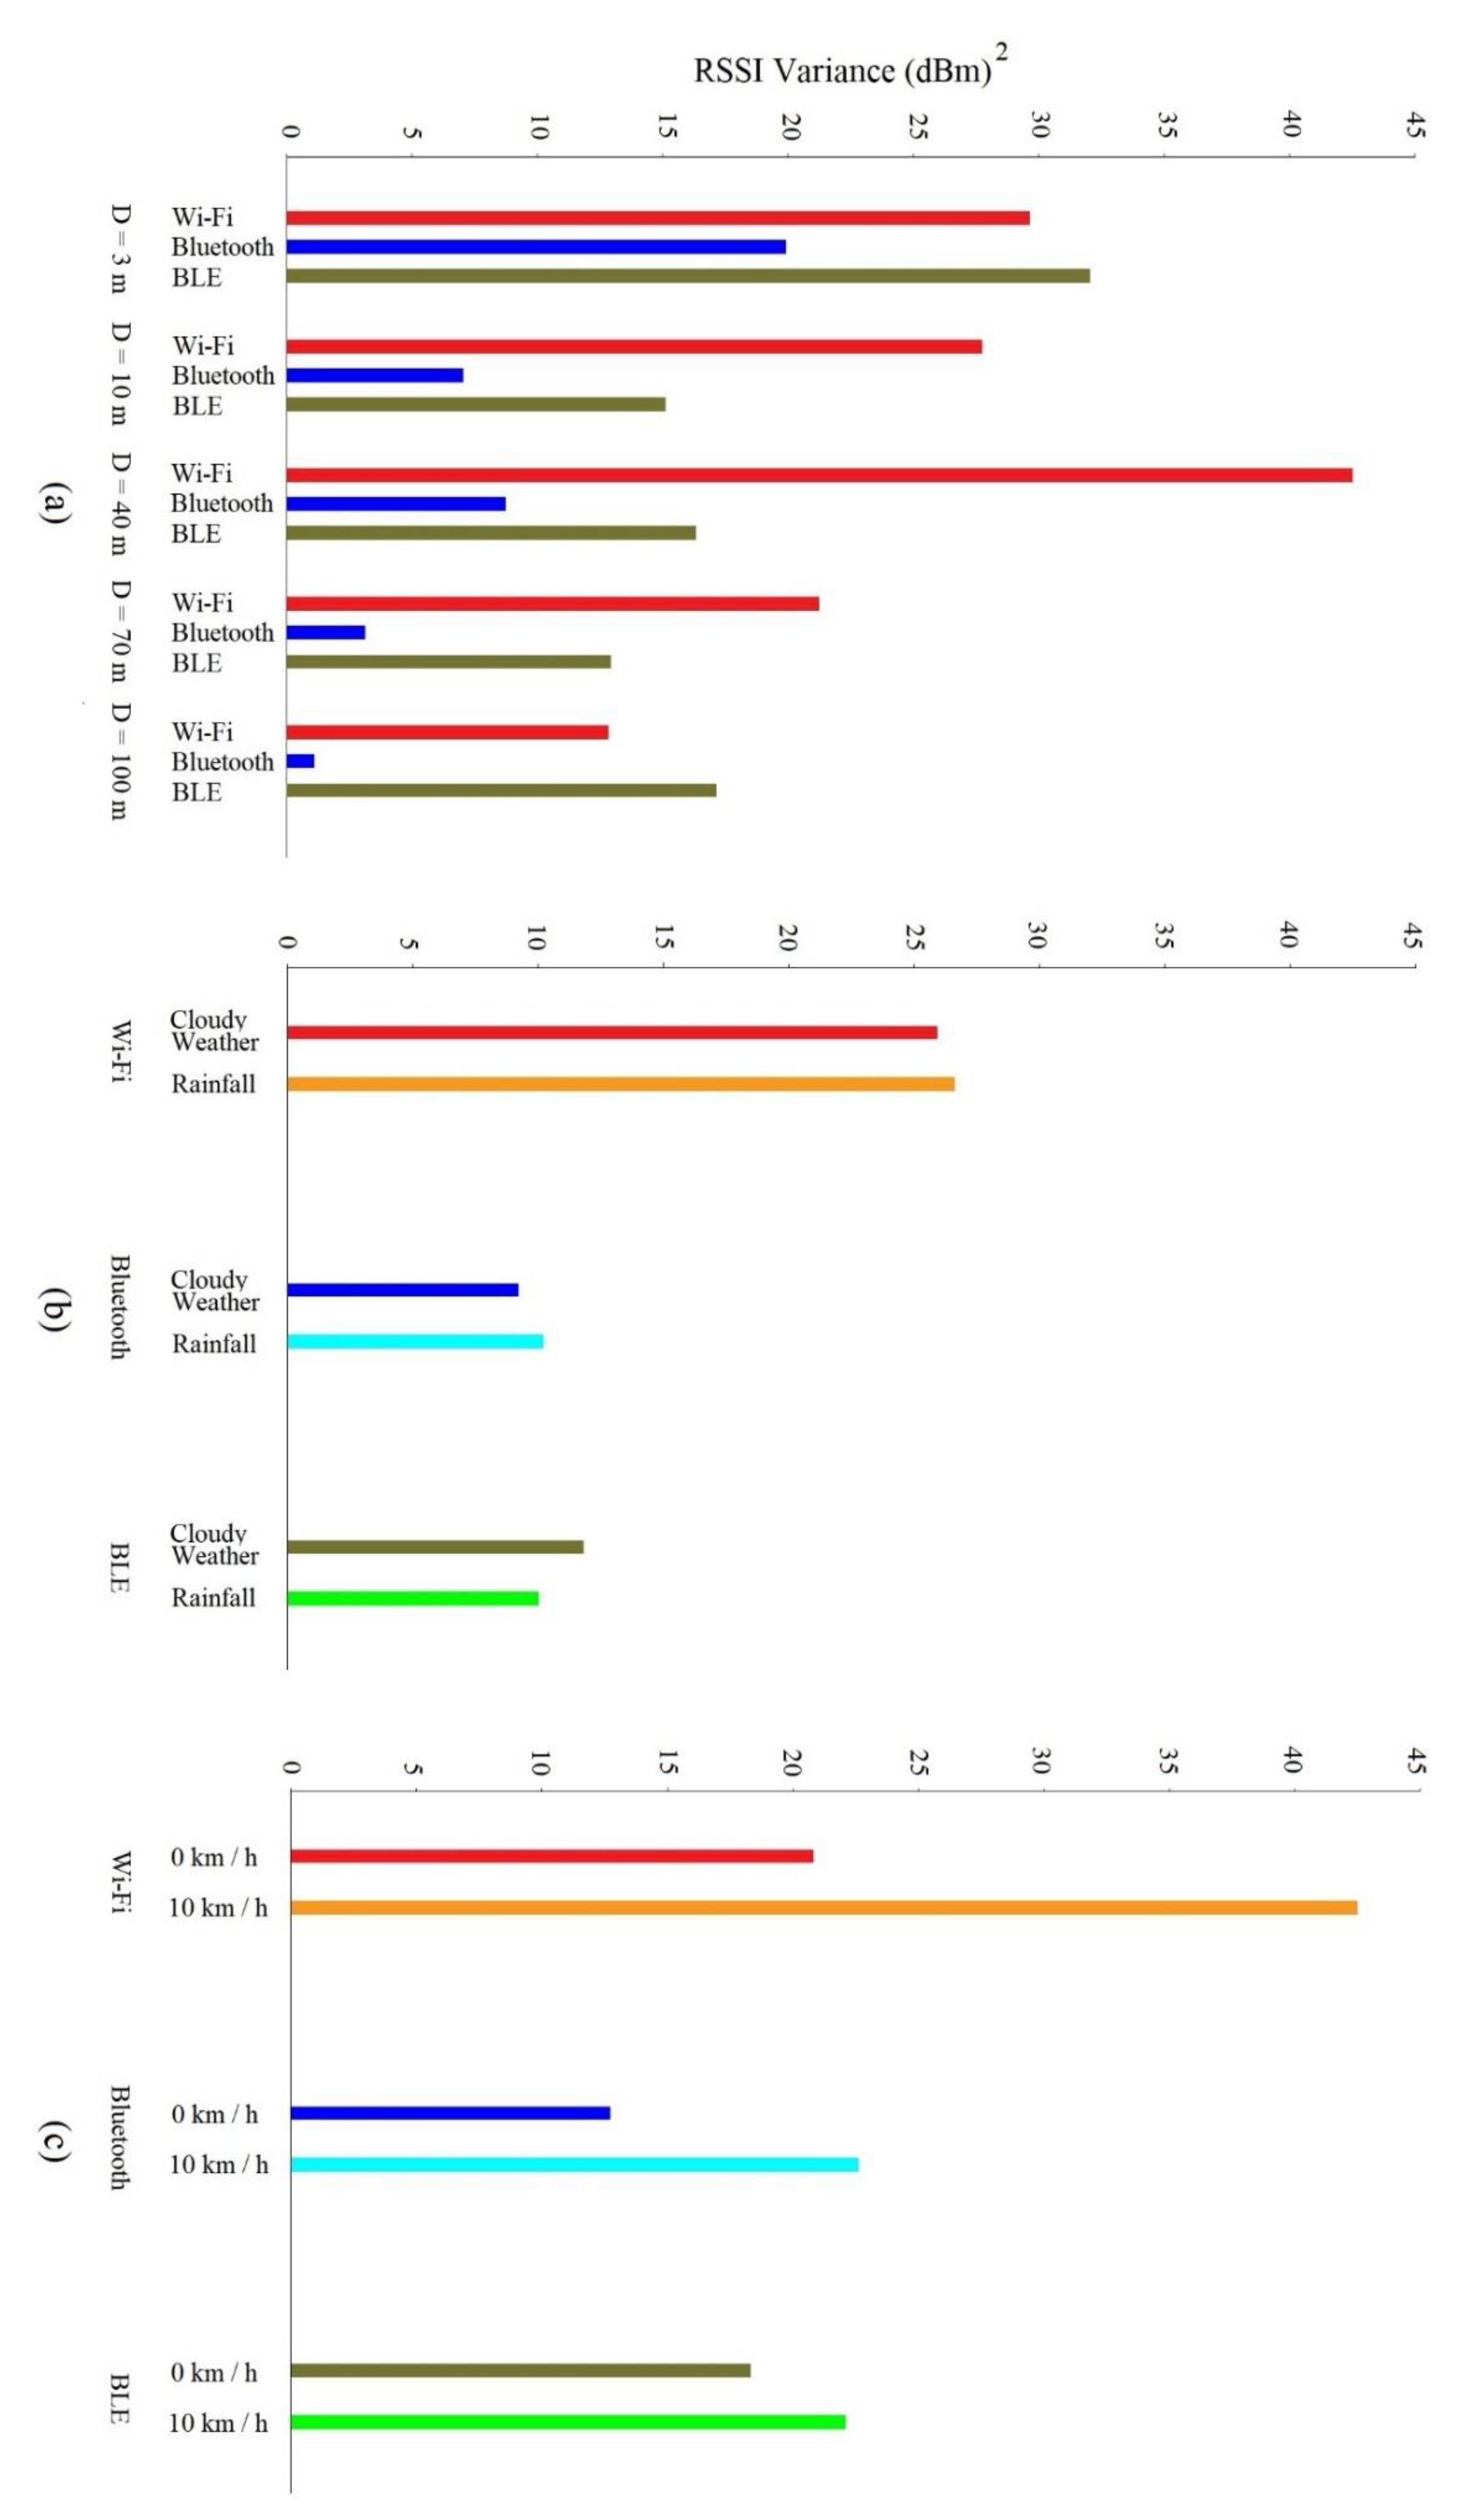
Figure 4, it is observed that R-squared values for Wi-Fi, Bluetooth and BLE equations are 0.80, 0.85 and 0.88 respectively in the conducted experiments. Comparison of these values indicates that in BLE mode, R-squared value is higher than Bluetooth and Wi-Fi modes and its curve is better fit to the data. This value for Wi-Fi mode is the least compared with the other two modes. The variances of the RSSI values for five stations of the experiment as another measure for the quality of the signals may be observed in
Table 1. The histogram of these variances is also provided in
Figure 5a for better illustration. It is observed that although R-squared value of the BLE curve was the highest among the three modes, RSSI variances generally have their lowest values in Bluetooth mode. The variances are the highest in Wi-Fi mode in most cases.
Repeating the experiments for beacons produced by different manufacturers and in different environments, it was observed that although RSSI-distance curves always follow a logarithmic trend and the findings about ranking of R-squared values and variances are generally true among the three modes, there are some variations in RSSI magnitudes. The manufacturers of network modules are identifiable in MAC addresses [
6], therefore, in order to have more reliable reference data in practice, it is recommended to calibrate the models for different manufacturers and environments.
5.2. Experiment 2: Precipitation Effects
The results of the experiments conducted to investigate the impacts of rainfall on the signals may be observed in
Table 2 and
Figure 5b. The table compares the number of detections, average RSSI values and their variances before and during the rainfall in each mode.
Figure 5b involves the histogram of the RSSI variances. As observed, none of the parameters were considerably affected by rainfall during a continuous data collection in the three modes. Hence, rainfall does not appear to impact the positioning results given that data are collected without changing other factors.
5.3. Experiment 3: Effects of Beacon Motion
Table 3 and
Figure 5c summarize the results of the experiments conducted to probe motion impacts on the signals. The number of the signal detections, average RSSI values and their variances during the experiments for both stationary and moving beacons in each scanning mode may be observed in the table.
Figure 5c involves the histogram of the RSSI variances. Although there seem to be some slight differences in the average RSSI values of stationary and moving beacons in each mode, the differences do not indicate systematic impacts caused by motion as these fluctuations are normal for RSSI values. This is while the RSSI variances indicate an overall increase for moving beacons compared with stationary beacons.
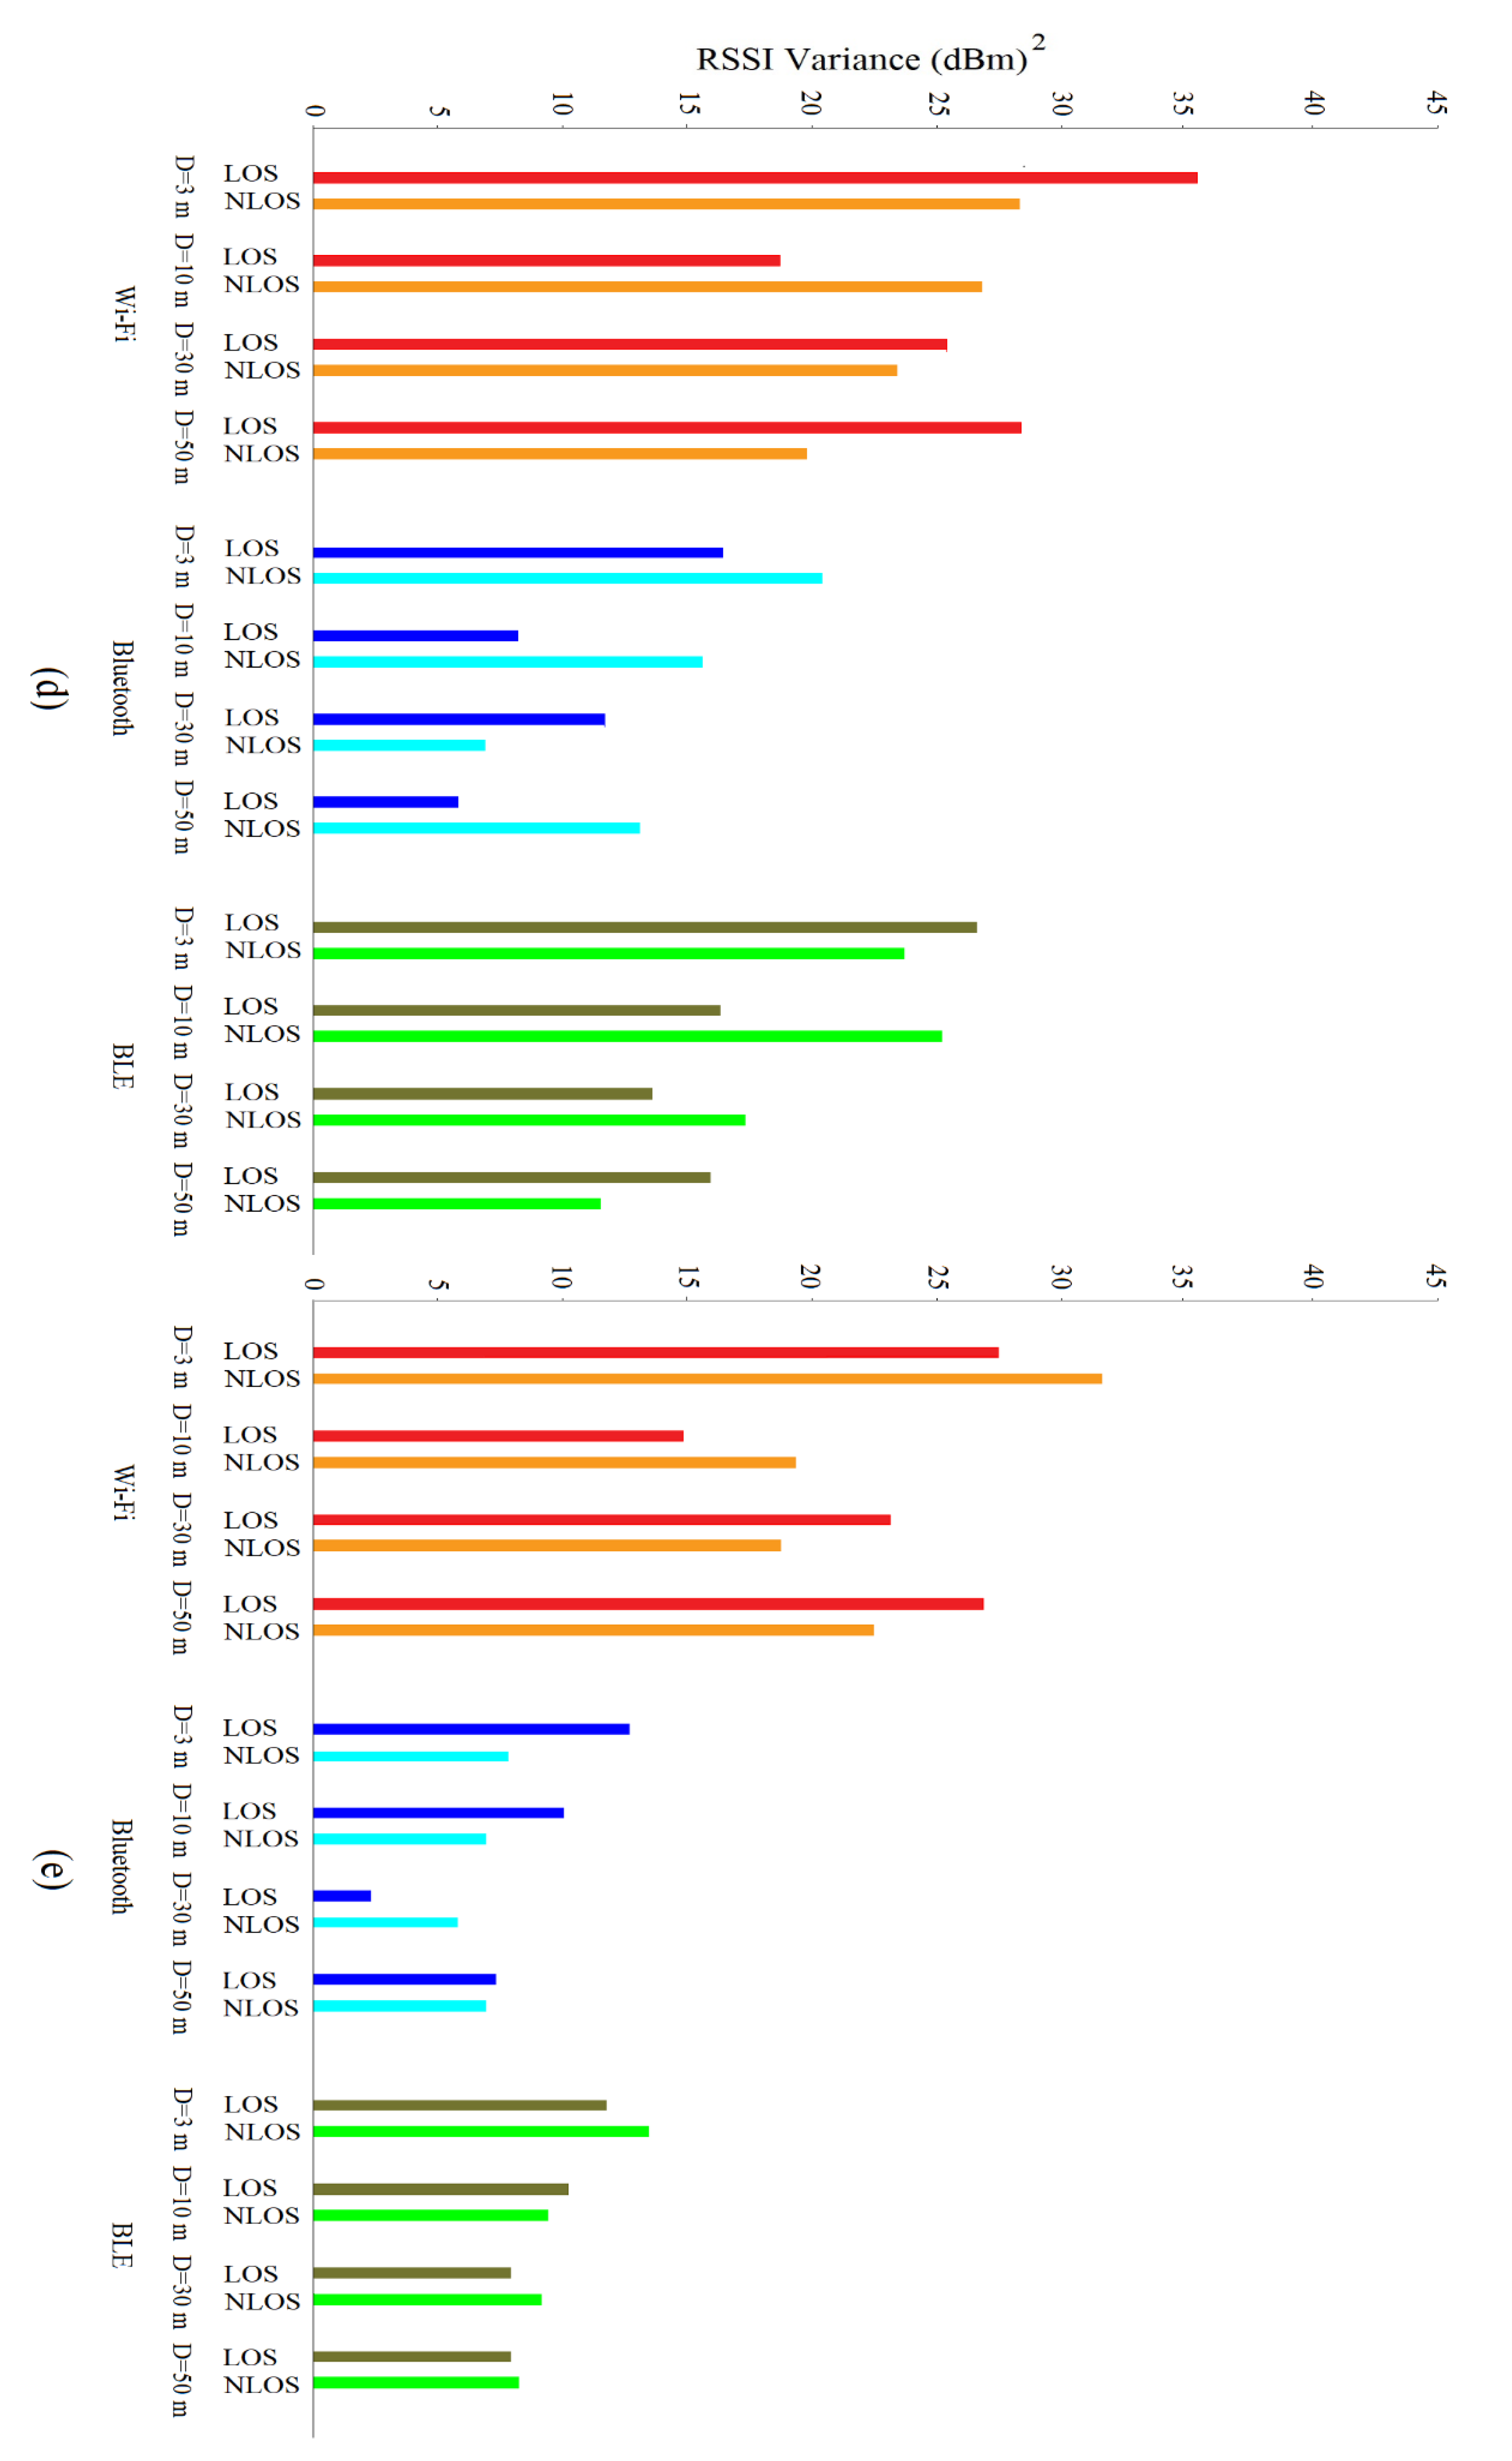
5.4. Experiment 4: Non-Line of Sight Effects
The results of the two tests conducted to investigate the impacts of obstacles on the signals may be observed in
Table 4 and
Table 5 as well as
Figure 5d,e.
Table 4 compares the number of the signals detected by the signal scanner from each station, average RSSI values and their variances when the transmission path was free and when there was an auto glass between the beacon and the signal scanner.
Table 5 compares the results of free path with the situation in which the path was blocked by a vehicle located between the beacon and the signal scanner. The histograms of the RSSI variances may also be observed in
Figure 5d,e.
As observed in the two tables, a reduction in the number of the detected signals in non-line of sight conditions is generally observed compared with line of sight conditions. This reduction is slight for the auto glass obstacle in most cases and for vehicle obstacle when the distance between the beacon and the signal scanner is short (3, 10 m). However, for the vehicle obstacle, this reduction tends to be more as the distance increases. In addition, a reduction in the strength of the signals due to the existence of obstacles is generally observable in non-line of sight conditions, which is again more sever for the vehicle obstacle especially at far distances. The changes in the variances in the two situations do not seem to be systematic.
5.5. Experiment 5: Signal Transmission Rates
The number of the signals detected by each of the three signal scanners and the moments at which there were simultaneous detections by all of them were specified using the MATLAB code (
Table 6). The time interval between the consecutive signal detections in Wi-Fi mode was generally between 4 and 7 s, although missing signals were also recognizable, which increased the time between the signals. Each Wi-Fi scanner had 1276 detections on average during the 150-min duration of the experiment. This was equal to 8.5 signal detections per minute on average. The number of the matching moments in this mode was 75, therefore the simultaneous detections by all the three scanners were 5.9% of total detections. In Bluetooth mode, the time interval between the signals was generally between 5 and 7 s with occasional missing signals. Each Bluetooth scanner detected 1308 signals on average during the experiment duration which was equal to an average of 8.7 detections per minute. There were 63 matching moments among the detections of the three scanners, which was only 4.8% of the signals. In BLE mode, signals were generally detected every one or two seconds, though there were missing signals recognizable among them. Signal detections were more continuous at short distances and missing signals were mostly at farther distances. The average number of signal detections by the BLE signal scanners in the experiment duration was 4214, equal to 28.1 detections per minute on average. There were 3282 matching moments in this mode, which were 77.9% of the detections.
6. Discussion
It was observed in Experiment 1 that the slopes of RSSI-distance curves gradually go to zero as the distance increases and the functionality of the curves decreases at long distances. This means that RSSI values are more distinct in short distances. The distinction in short distances is important for the operation of collision warning systems. This is because it enables the system to recognize the beacons located in the hazard zone of the vehicle which may be considered an area around the vehicle whose edges are several meters away from it. This is while it will be more difficult to have an accurate estimation of the distance based on RSSI at long distances.
RSSI values usually involve some fluctuations and outliers. These reduce the accuracy of distance estimation and positioning which may result in malfunction of collision warning systems and erroneous alerts by them. The outliers should be removed from the data using appropriate filtering methods as far as possible as a necessary step in distance estimation or positioning. There are numerous techniques for filtering RSSI data sets. A simple technique is setting thresholds such as the mean plus/minus certain coefficients of standard deviations for different distances and removing values outside the ranges. The R-squared value as the measure for closeness of the data to the fit curves is an important parameter in RSSI-distance curves. RSSI fluctuations and outliers reduce R-squared value of the fit-curves and result in higher inaccuracies in distance estimation. These fluctuations and outliers also cause the variances of the RSSI values to increase which will decrease the accuracy of RSSI-based distance estimation and positioning methods. This is more severe in methods such as trilateration which require the distances of the beacon from multiple signal scanners, because using distances with high inaccuracies will mathematically cause propagation of the errors in calculating the beacon position. Considering these factors in RSSI-distance curves, R-squared values and RSSI variances in the three modes indicated the superiority of Bluetooth and BLE modes. BLE mode had the highest R-squared value, while the variances of Bluetooth RSSI values were lower. Wi-Fi mode had the worst performance concerning these parameters.
Rainfall did not significantly impact the data compared with normal weather conditions in the three modes according to the second experiment. This is a promising factor for utilizing wireless technology in collision warning systems which require positional data of pedestrians, since these systems may operate even in rainy weather conditions.
The results of Experiment 3 did not indicate significant differences between the average RSSI values of stationary and moving beacons in any of the three modes, although motion of the beacons generally increased RSSI variances. This may decrease the accuracy of positioning for moving beacons in collision warning systems. In this case, no considerable difference in the severity of the motion impacts on moving beacons was observed comparing the three modes with each other; but it should be noted that according to the results of the first experiment, the variances of Wi-Fi RSSI values were generally higher compared with Bluetooth and BLE modes.
Experiment 4, conducted to investigate the impacts of non-line of sight path situations on the signals, indicated a reduction in the number and strength of the signals caused by the glass and vehicle obstacles without systematic impacts on the variances. The reduction magnitudes in the number and strength of the signals were more for the vehicle obstacle especially at far distances. More severity of the reductions at far distances may be meaningful because of the lower strength of the signals in passing through the obstacles. The changes in these parameters were not considerably different comparing the three modes with each other. Although signals were affected by obstacles, the impacts were not extreme. These results are promising for the possibility of beacon detection in collision warning systems under non-line of sight situations. However, it should be mentioned that reduction in strength of signals due to obstacles in non-line of sight situations should be taken into consideration in setting RSSI thresholds corresponding to hazard zones.
According to the results of Experiment 5, simultaneous detection rates of the three signal scanners were very low in Wi-Fi and Bluetooth modes. In contrast to Wi-Fi and Bluetooth modes, the probability of having simultaneous detections was very high in BLE mode. This is equivalent to a very low probability of having signal detections usable by positioning algorithms in Wi-Fi and Bluetooth modes and a high probability in BLE mode. It is a fact that signal scanners do not detect all the signals transmitted by beacons, but lower simultaneous detection rates in Wi-Fi and Bluetooth modes were mostly because of the lower signal transmission rates of beacons and higher detection intervals of signal scanners in these two modes compared with BLE mode. Intervals of several seconds between the signals in Wi-Fi and Bluetooth modes significantly reduce the functionality of collision warning systems if they are designed to operate in these two modes. Short time intervals between the signals especially in short distances are crucial in safety applications. The capability of continuous signal transmission in BLE mode will enable it to have fast performance in terms of the time gap between the entrance of the pedestrians into the hazard zone and the system alert in both distance and position-based approaches. This is equivalent to more time available for drivers to react properly when pedestrians in danger are detected by the system.
Another factor which may be taken into consideration along with the five aforementioned factors is MAC address randomization which has been implemented by major mobile phone manufacturers. MAC address randomization is a technique in which the MAC address is changed by the networking hardware to temporary addresses different from the true address in order to be anonymous [
33]. According to [
34], iOS 14, iPadOS 14, and watchOS 7 may use different Wi-Fi MAC addresses when connecting to different Wi-Fi networks with the purpose of privacy improvement. Activating this feature is optional and my be done in the device settings by the device owner. This is also implemented by Android operated devices starting in Android 8.0 [
35]. According to the announcements of the developers of these operating systems, MAC randomization is only implemented on Wi-Fi MAC addresses, neither for Bluetooth nor for BLE. This was confirmed by the authors observing that in Wi-Fi mode only, MAC addresses changed when detected by different signal scanners and not when being detected by the same signal scanner at different timestamps. Hence, implementation of MAC randomization may be considered another disadvantage for Wi-Fi mode, especially in position-based collision warning systems in which the beacon information from multiple signal scanners should be combined. The reason is that in these systems, identical MAC addresses should be detected by different signal scanners, and this may be prevented by implementation of MAC randomization.
7. Conclusions
The aim of the research was finding out which wireless signal mode is the most proper to be integrated in vehicle–pedestrian collision warning systems in terms of accuracy and functionality. The characteristics of Wi-Fi, Bluetooth and BLE modes, important in these systems were investigated and compared with each other. Five factors including RSSI-distance relationship, precipitation effects on the signals, motion effects, non-line of sight effects, and signal transmission rates were selected for evaluation as the important factors in comparing the suitability of the three signal modes for collision warning systems. The presented findings are specific to the experiments and setup procedure used in this study. The generality of the findings needs to be further examined.
Comparison of RSSI-distance curves fitness and RSSI variances in the three modes indicated the better performance of Bluetooth and BLE modes, when the purpose is distance estimation and positioning. While the R-squared value was the highest in BLE mode, Bluetooth RSSI values had lower variances which increase the potential for more accurate positioning. Rainfall did not significantly affect the data compared with normal weather conditions in the three modes. This indicated that the operation of wireless collision warning systems is not affected by rainy weather conditions. Beacon motion did not have severe impacts on average RSSI values in any of the three modes, although it increased RSSI variances, which may decrease the accuracy of safety systems in moving conditions. No considerable difference in the severity of motion impacts on moving beacons was observed comparing the three modes with each other. The presence of obstacles in signal transmission paths generally caused a reduction in the number and strength of the signals. These reductions were greater when the blockage was caused by a vehicle compared with auto glass. The signal strength reductions due to the presence of obstacles should be taken into consideration in setting RSSI thresholds corresponding to hazard zones. The reductions were not considerably different among the three modes. It was observed that because of the short time intervals between the signals in BLE mode especially in short distances which are critical in safety applications, this mode may have the best performance in terms of the time gap between the entrance of pedestrians into the hazard zone and the system alert. Besides the results of the five conducted experiments, implementation of MAC randomization in Wi-Fi mode by major developers of mobile phone operating systems was identified as a disadvantage for this signal mode in comparison with Bluetooth and BLE modes. This factor may reduce the probability of MAC address matchings by different signal scanners to a large extent.
The promising results of this research indicate the possibility of integration of wireless technology in the design of vehicle–pedestrian collision warning systems as a supplement for the currently used technologies. Considering the results altogether, BLE is recommended as the superior signal mode over Wi-Fi and Bluetooth modes to be utilized in these systems. Application of this mode may provide the possibility of fast collision warnings, whereas its capability in accurate distance estimation and positioning is roughly competitive with Bluetooth mode. Wireless technology may improve the functionality of these systems especially in darkness or inclement weather conditions in which the current systems suffer from inherent limitations. The result will be enhancement of the safety level of both drivers and pedestrians and reduction of the number of vehicle–pedestrian collisions.
The potential of wireless signals in providing the possibility of distance estimation and positioning is the motivation for their integration in vehicle–pedestrian collision warning systems by automotive industry. Practical acceptance of these systems by this industry may benefit from the long-lasting and low-cost availability of wireless technology in the market, the economic scalability of mass production and the advances in development of vehicular-specific amendments of wireless standards. The supplement of this economic advantage is that currently, most pedestrians are carriers of different types of wireless signal transmitters thanks to their personal smart devices.
Author Contributions
Conceptualization, S.M., K.I. and A.H.G.; methodology, S.M.; software, S.M., A.H.G.; validation, S.M., K.I.; formal analysis, S.M.; investigation, S.M.; resources, S.M., A.H.G.; data curation, S.M.; writing—original draft preparation, S.M.; writing—review and editing, S.M., K.I.; visualization, S.M., K.I.; supervision, K.I.; project administration, S.M., K.I.; funding acquisition, K.I. All authors have read and agreed to the published version of the manuscript.
Funding
This research was funded by Natural Sciences and Engineering Research Council of Canada, grant number: NSERC Discovery Grant RGPIN 06208.
Data Availability Statement
The data collected during the experiments of this study are available from the corresponding author upon reasonable request.
Conflicts of Interest
The authors declare no conflict of interest. The funders had no role in the design of the study; in the collection, analyses, or interpretation of data; in the writing of the manuscript, or in the decision to publish the results.
References
- National Highway Traffic Safety Administration. Traffic Safety Facts, Overview of Motor Vehicle Crashes in 2019; U.S. Department of Transportation: Washington, DC, USA, 2020. [Google Scholar]
- Transport Canada. Government of Canada. 2021. Available online: https://tc.canada.ca/en/road-transportation/statistics-data/canadian-motor-vehicle-traffic-collision-statistics-2019 (accessed on 14 June 2021).
- American Automobile Association Inc. Automatic Emergency Braking with Pedestrian Detection; American Automobile Association Inc.: Heathrow, FL, USA, 2019. [Google Scholar]
- Raeve, N.D.; Schepper, M.D.; Verhaevert, J.; Van Torre, P.; Rogier, H. A Bluetooth-Low-Energy-Based Detection and Warning System for Vulnerable Road Users in the Blind Spot of Vehicles. Sensors 2020, 20, 2727. [Google Scholar] [CrossRef]
- Mohammadi, S.; Ismail, K.; Ghods, A.H. Development of a Positioning Technique for Traffic Data Collection Using Wireless Signal Scanners. Transp. Res. Rec. 2020, 2674, 637–648. [Google Scholar] [CrossRef]
- Gupta, N. Inside Bluetooth Low Energy; Artech House: Boston, MA, USA; London, UK, 2013. [Google Scholar]
- Tariq, Z.B.; Cheema, D.M.; Kamran, M.Z.; Naqvi, I.H. Non-GPS Positioning Systems: A Survey. ACM Comput. Surv. CSUR 2017, 50, 1–34. [Google Scholar] [CrossRef]
- Alonso, J.M.; Ocaña, M.; Hernandez, N.; Herranz, F.; Llamazares, A.; Sotelo, M.A.; Bergasa, L.M.; Magdalena, L. Enhanced WiFi localization system based on Soft Computing techniques to deal with small-scale variations in wireless sensors. Appl. Soft Comput. 2011, 11, 4677–4691. [Google Scholar] [CrossRef]
- Rappaport, T. Wireless Communication Principles and Practice; Prentice Hall PTR: Upper Saddle River, NJ, USA, 2002; p. 102. [Google Scholar]
- Haslett, C. Essentials of Radio Wave Propagation; Cambridge University Press: Cambridge, UK, 2008. [Google Scholar]
- An, K.; Xie, S.; Ouyang, Y. Reliable Sensor Location for Object Positioning and Surveillance via Trilateration. Transp. Res. Part B Methodol. 2018, 117, 956–970. [Google Scholar] [CrossRef]
- Park, H.; Noh, J.; Cho, S. Three-dimensional positioning system using Bluetooth low-energy beacons. Int. J. Distrib. Sens. Networks 2016, 12, 1–11. [Google Scholar] [CrossRef]
- Kuhn, M.; Johnson, K. Applied Predictive Modeling, 5th ed.Springer Nature: Berlin/Heidelberg, Germany, 2016; pp. 159–160. [Google Scholar]
- Quayle, S.M.; Koonce, P.; DePencier, D.; Bullock, D.M. Arterial Performance Measures with Media Access Control Readers. Transp. Res. Rec. J. Transp. Res. Board 2010, 2192, 185–193. [Google Scholar] [CrossRef]
- Sharifi, E.; Hamedi, M.; Haghani, A.; Sadrsadat, H. Analysis of Vehicle Detection Rate for Bluetooth Traffic Sensors: A Case Study in Maryland and Delaware. In Proceedings of the 18th ITS World Congress, Orlando, FL, USA, 16–20 September 2011. [Google Scholar]
- Moghaddam, S.S.; Hellinga, B. Quantifying Measurement Error in Arterial Travel Times Measured by Bluetooth Detectors. Transp. Res. Rec. J. Transp. Res. Board 2013, 2395, 111–122. [Google Scholar] [CrossRef]
- Bachmann, C.; Roorda, M.J.; Abdulhai, B.; Moshiri, B. Fusing a Bluetooth Traffic Monitoring System With Loop Detector Data for Improved Freeway Traffic Speed Estimation. J. Intell. Transp. Syst. 2012, 17, 152–164. [Google Scholar] [CrossRef]
- Chitturi, M.V.; Shaw, J.W.; Campbell IV, J.R.; Noyce, D.A. Validation of Origin–Destination Data from Bluetooth Reidentification and Aerial Observation. Transp. Res. Rec. J. Transp. Res. Board 2014, 2430, 116–123. [Google Scholar] [CrossRef]
- Araghi, B.N.; Krishnan, R.; Lahrmann, H. Mode-Specific Travel Time Estimation Using Bluetooth Technology. J. Intell. Transp. Syst. 2015, 20, 219–228. [Google Scholar] [CrossRef]
- Bathaee, N.; Mohseni, A.; Park, S.; Porter, J.D.; Kim, D.S. A cluster analysis approach for differentiating transportation modes using Bluetooth sensor data. J. Intell. Transp. Syst. 2017, 22, 353–364. [Google Scholar] [CrossRef]
- Kurkcu, A.; Ozbay, K. Estimating Pedestrian Densities, Wait Times, and Flows with Wi-Fi and Bluetooth Sensors. Transp. Res. Rec. J. Transp. Res. Board 2017, 2644, 72–82. [Google Scholar] [CrossRef]
- Zarinbal Masouleh, A.; Hellinga, B. Simulation of the Bluetooth Inquiry Process for Application in Transportation Engineering. IEEE Trans. Intell. Transp. Syst. 2019, 20, 1020–1030. [Google Scholar] [CrossRef]
- Sheykhfard, A.; Haghighi, F. Assessment pedestrian crossing safety using vehicle-pedestrian interaction data through two different approaches: Fixed videography (FV) vs In-Motion Videography (IMV). Accid. Anal. Prev. 2020, 144, 1–9. [Google Scholar] [CrossRef] [PubMed]
- Martin, R.F.; Parisi, D.R. Data-driven simulation of pedestrian collision avoidance with a nonparametric neural network. Neurocomputing 2019, 379, 130–140. [Google Scholar] [CrossRef]
- Yan, Y.; Zhang, Y.; Yang, X.; Hu, J.; Tang, J.; Guo, Z. Crash prediction based on random effect negative binomial model considering data heterogeneity. Phys. A 2020, 547, 1–12. [Google Scholar] [CrossRef]
- Tang, J.; Zheng, L.; Han, C.; Yin, W.; Zhang, Y.; Zou, Y.; Huang, H. Statistical and machine-learning methods for clearance time prediction of road incidents: A methodology review. Anal. Methods Accid. Res. 2020, 27, 100123. [Google Scholar] [CrossRef]
- Zou, Y.; Lin, B.; Yang, X.; Wu, L.; Muneeb Abid, M.; Tang, J. Application of the Bayesian Model Averaging in Analyzing Freeway Traffic Incident Clearance Time for Emergency Management. J. Adv. Transp. 2021, 2021, 1–9. [Google Scholar] [CrossRef]
- Pascale, A.; Nicoli, M.; Deflorio, F.; Chiara, B.D.; Spagnolini, U. Wireless sensor networks for traffic management and road safety. IET Intell. Transp. Syst. 2012, 6, 67–77. [Google Scholar] [CrossRef]
- Yu, W.; Park, S.; Kim, D.S.; Ko, S.-S. Arterial Road Incident Detection Based on Time-Moving Average Method in Bluetooth-Based Wireless Vehicle Reidentification System. J. Transp. Eng. 2015, 141, 04014084. [Google Scholar] [CrossRef]
- Margreiter, M. Automatic Incident Detection Based on Bluetooth Detection in Northern Bavaria. Transp. Res. Procedia 2016, 15, 525–536. [Google Scholar] [CrossRef][Green Version]
- Yuan, J.; Abdel-Aty, M.; Wang, L.; Lee, J.; Yu, R.; Wang, X. Utilizing Bluetooth and adaptive signal control data for real-time safety analysis on urban arterials. Transp. Res. Part C Emerg. Technol. 2018, 97, 114–127. [Google Scholar] [CrossRef]
- Mercader, P.; Haddad, J. Automatic incident detection on freeways based on Bluetooth traffic monitoring. Accid. Anal. Prev. 2020, 146, 1–12. [Google Scholar] [CrossRef]
- Martin, J.; Mayberry, T.; Donahue, C.; Foppe, L.; Brown, L.; Riggins, C.; Rye, E.C.; Brown, D. A Study of MAC Address Randomization in Mobile Devices and When it Fails. Proc. Priv. Enhancing Technol. 2017, 2017, 365–383. [Google Scholar] [CrossRef]
- Available online: https://support.apple.com/en-ca/HT211227 (accessed on 8 June 2021).
- Available online: https://source.android.com/devices/tech/connect/wifi-mac-randomization (accessed on 8 June 2021).
| Publisher’s Note: MDPI stays neutral with regard to jurisdictional claims in published maps and institutional affiliations. |
© 2021 by the authors. Licensee MDPI, Basel, Switzerland. This article is an open access article distributed under the terms and conditions of the Creative Commons Attribution (CC BY) license (https://creativecommons.org/licenses/by/4.0/).


