1. Introduction
Over the past decades, energy transition has been growing following the diffusion of renewable energy resources worldwide [
1]. Korea started actively participating in climate-related activities aiming for a higher penetration level of renewable sources. Such activities include operating a renewable energy supply policy referred to as the Renewable Portfolio Standard (RPS), obligating electricity suppliers to source a specified proportion of the electricity they provide to customers from entitled renewable sources [
2]. This can be conducted and fulfilled using a renewable energy certificate (REC). The REC is issued to energy generators according to the amount of eligible renewable electricity they generate. Moreover, the REC is weighted based on the source they use to generate electricity [
3]. Regarding electricity suppliers, demonstrating compliance with renewable obligations at a minimum REC allows them to improve portfolio profitability. However, oftentimes newly installed renewable energy generators hold little data, making modeling the RPS market investment portfolio strenuous. The driving force for investors to invest in the renewable energy market is the guaranteed yield.
Various methods, such as net present value, internal rate of return, and discounted cash flow methods, have been developed to calculate the profit of newly installed solar power plants. After deciding whether to invest in PV, the next step is to decide when to invest in PV. Although these methods can be used to evaluate the economics of a PV investment, they can only be evaluated based on a predefined investment year for the PV investment. In the REC market, the timing of investment is important because the economic feasibility of PV investment depends on SMP and REC price. Since SMP and REC prices fluctuate frequently over time, investors should consider when to invest in order to achieve high returns. Investors can effectively manage their risk by considering when to invest in PV.
The proposed LSMC-based method can be used as a decision-making tool to provide PV investors with information on the best time to invest. By considering when to invest, investors can manage their risk more easily. The study examines all the most essential uncertain features such as PV generation, SMP, and REC prices in Korea. The probability density function based on historical data derived the expected values of long-term, annual, and monthly PV generation. SMP was computed by solving the Lagrangian relaxation and dynamic programming. REC price was estimated following the current renewable expansion policy to ensure feasibility and accuracy, as renewable energy is heavily dependent on the renewable policy. The model then employed the LSMC method to simulate the total period of PV earnings in stocks and determine Korea’s optimal investment time. The dynamic investment approach solves the value of options through a backward induction process, evaluating each trading point of the optimal decision between selling REC or holding REC. The proposed method was designed to determine the investment timing using Real Option. Moreover, the model used several scenarios to determine the optimal condition for profitable solar energy investment.
The rest of this paper proceeds as follows.
Section 2 discusses the existing literature on investment assessment, while
Section 3 presents the formulations of the generation profit of PV and LSMC.
Section 4 models an investment assessment procedure based on the LSMC method.
Section 5 demonstrates the effectiveness of the proposed LSMC method from various case studies.
Section 6 further concludes the results.
2. Literature Review
Sustainable development is a key goal of human development [
4]. Research on sustainability has traditionally focused on changing the way societies produce and consume to achieve global sustainable development [
5]. In recent years, sustainability has been addressed in social [
6,
7,
8], economic [
9,
10,
11], and environmental issues [
12,
13,
14] to achieve the Sustainable Development Goals (SDGs). Various studies have been conducted on the analysis and impact of renewable energy on the short-term operation and long-term planning of the power grid. Sun and Nie [
15] analyzed the impact of government energy policies on increasing renewable energy installations. Zhang Y. et al. [
16] found that subsidy policies effectively promote innovation in new energy companies. Chen et al. [
17] analyzed the development and policy of renewable energy utilization. Hong et al. [
18] used an integrated analysis of Korea’s energy system at the national level.
In the past few years, numerous studies have been conducted on photovoltaic (PV) energy as a representative of clean and renewable resources [
19]. Several studies have been conducted on PV project assessment using traditional investment techniques such as net-present value and the discounted cash flow method [
20,
21,
22,
23]. However, these methods disregard two factors: (1) handling the uncertain factors and (2) presenting the optimal time to invest.
Several studies aim to overcome uncertainty issues by utilizing various methods. The factors relevant to the RPS market investment portfolio are categorized as (1) generated PV electricity, (2) electricity price, and (3) REC price. First, support vector machine, intelligence models such as fuzzy logic, adaptive neural-fuzzy-inference system or artificial neural network, and Markov Chain are used to forecast the short-term PV generation under grid stability [
24,
25,
26,
27]. Second, locational marginal price is predicted using the artificial neural network [
28,
29,
30] with various data such as factors of generators and pumped storage power plants. Finally, REC pricing schemes are applied by determining the REC price [
31,
32,
33]. However, all the above-mentioned models have limitations in predicting long-term results.
Optimal investment timing is crucial for making profitable investment decisions. The real options (RO) theory presents the optimal investment timing as it is can adapt the substantiated financial options theory to the investment decision. Various fields in the power industry are using the RO approaches in renewable energy [
34], P2G (Power-to-Gas), or transmission lines [
35,
36,
37,
38,
39]. In reference [
40,
41], nuclear power plant investment is evaluated by real option analysis. These studies practically exercise the binomial tree model and the simulation method. The binomial tree model was first employed by Hoff et al. [
42]. Martinez-Cesena et al. [
43] employ the simulation method, which focuses on the effect of technological impacts on the project value. For reference, [
44] used the decision-making tree model to assess the wind power productivity at different sites. The same technique is further employed in [
45], where it focuses on the demand uncertainties. Previous research focuses on the solar PV project investment decision, which is only a now-or-never option. However, the REC spot market’s unique characteristics work like the typical stock market. Consequently, decisions on whether to hold or buy options can be exercised.
Therefore, the main contribution of this paper is demonstrating decision making of the timing of PV generation plant investment, taking into consideration all uncertain PV price factors. The proposed LSMC-based method can be used as a decision-making tool to provide PV investors with information on the best time to invest.
3. Problem Formulation
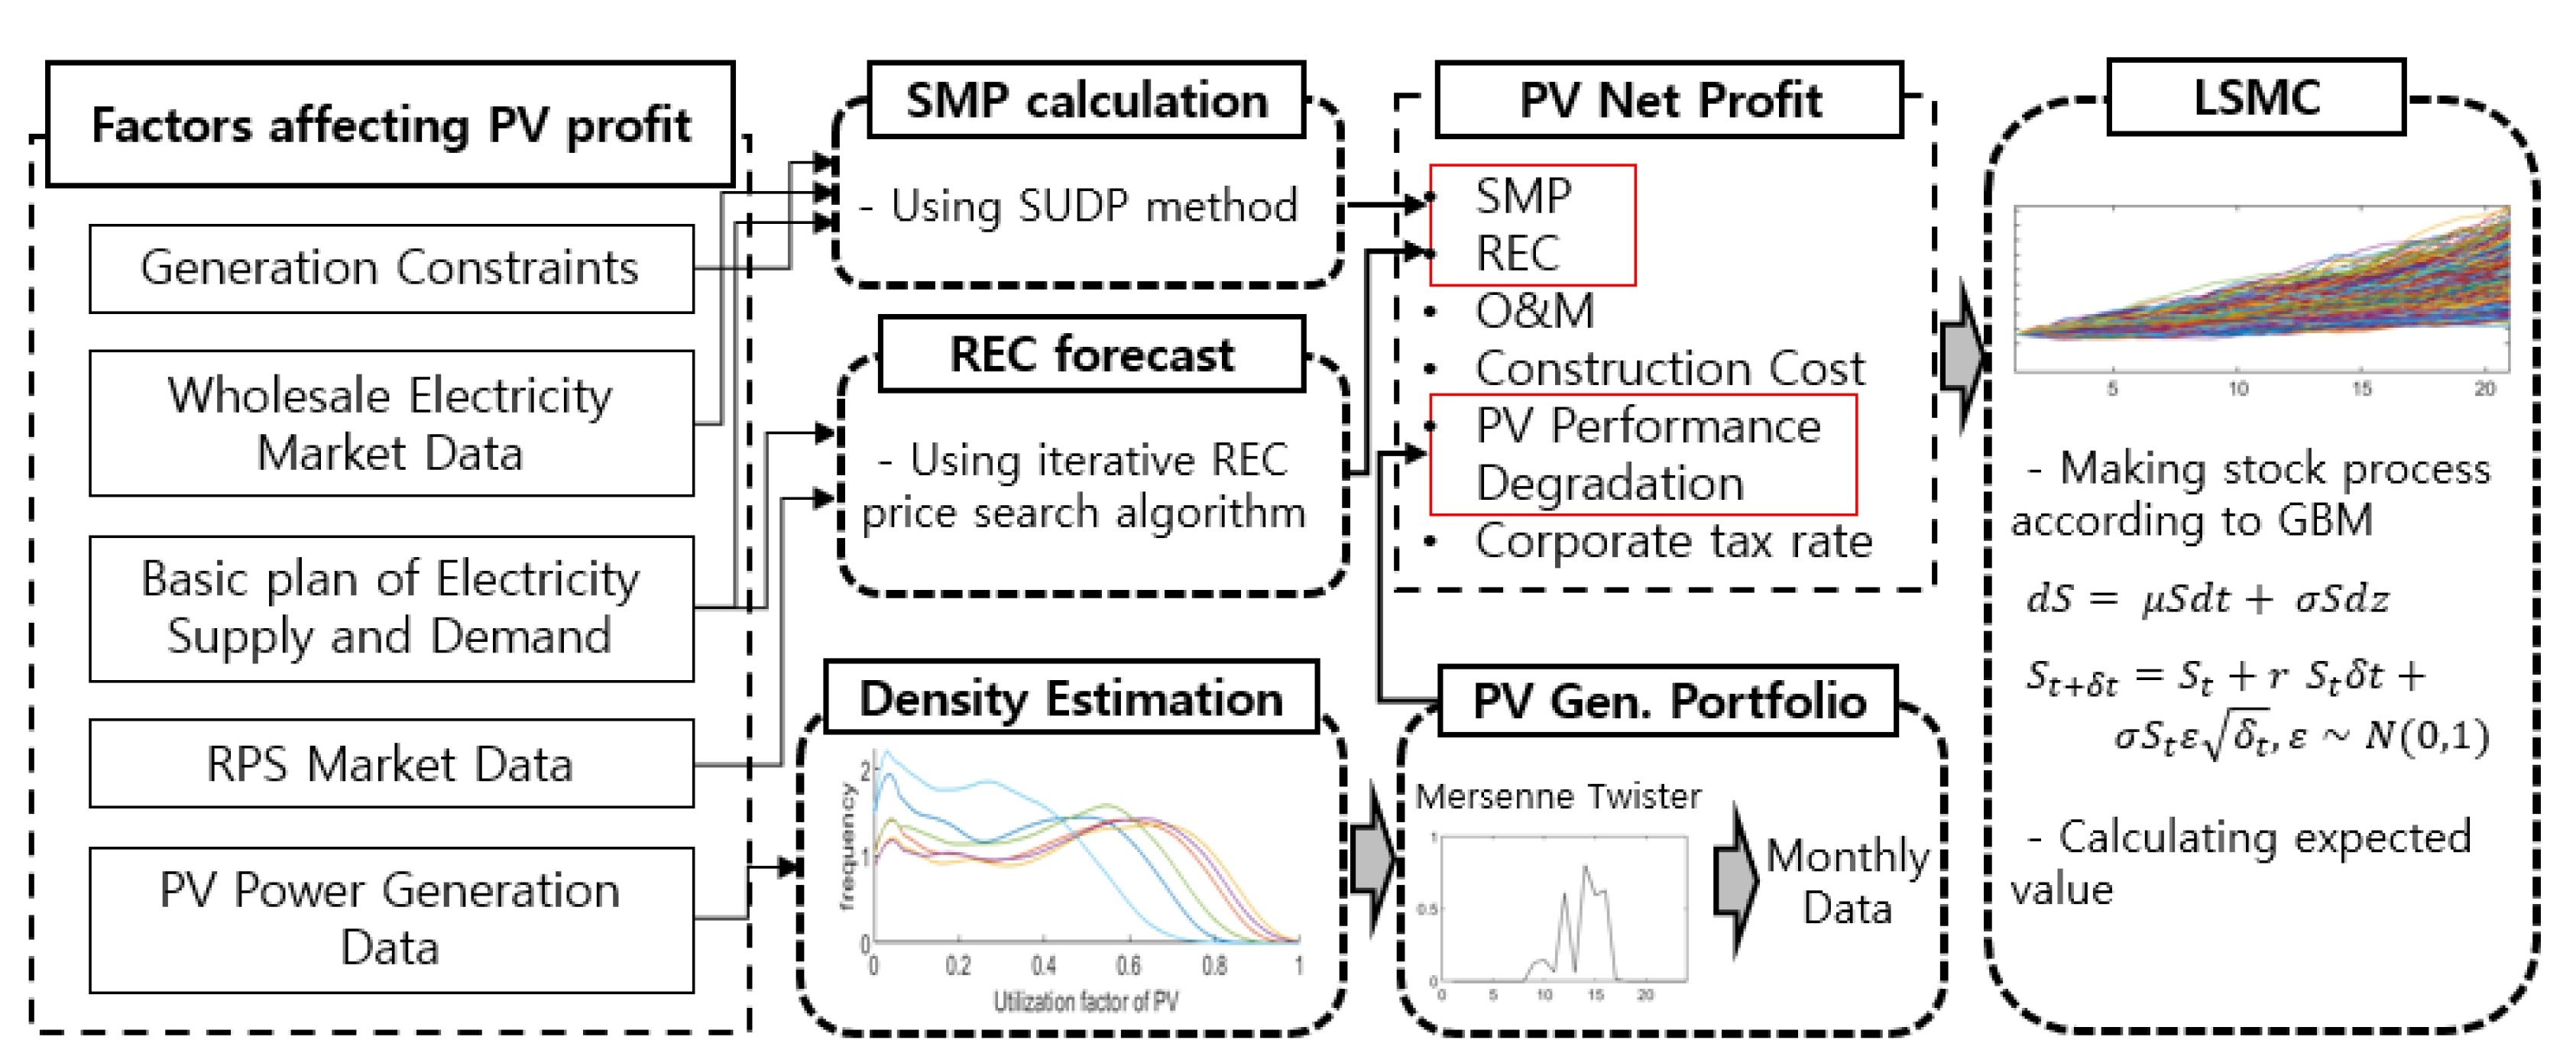
In this section, a mathematical model is proposed to derive the optimal PV investment plan for PV generators participating in REC markets. Note that three core elements that determine the investors’ profit should be designed, namely, solar power generation patterns (generation patterns for 24 h), SMP (system marginal price paid for energy production) and REC (certification for 1 MW of generated renewable energy).
Figure 1 demonstrates the schematic diagram of the proposed PV investment plan method.
PV power generation is derived stochastically based on probabilities of an hourly normalized generation profile generated using the kernel function. The kernel curve presents the relative likelihood of output produced from each sample of data. Moreover, kernel density estimation (KDE) is constructed by stacking those kernel functions. The Epanechnikov function is selected from the KDE as it is the best in estimating distribution [
46]. The probability density function (
) using the Epanechnikov function is defined by:
where
, h,
, and
are the statistical PV generation samples, bandwidth, kernel density function, and the number of solar hourly historical generation data, respectively. The Epanechnikov function is
. In this case, the probability density function is a nonparametric estimate of
of sample
(one-dimensional random variable,
= 1, …,
n) with n data. Based on the density function estimation result, the Mersenne twister random number generator ensures that randomness is well-equidistributed [
47]. Following a long period of quicker computation, the Mersenne twister generates expectation values of PV generation.
In this paper, the SMPs of the Korean wholesale electricity market are simulated until year 2040 using the single unit dynamic programming (SUDP) algorithm. The SUDP algorithm is one of methods for solving the unit commitment problem using dynamic programming in combination with Lagrangian relaxation by optimizing the subproblems of the individual generators separately [
48,
49,
50]. Various factors such as generating capacity, cost function, physical constraint of generator, fuel cost, transmission constraint, and load pattern are used by the SUDP algorithm to obtain the long-term SMPs. Korea’s Long-term Basic Plan for Electricity Supply and Demand was established based on the estimation of these factors. There is a causal relationship between the wholesale price of electricity in Korea and the price of liquefied natural gas (LNG). According to research conducted by the Korea Power Exchange, domestic LNG prices are mainly affected by Dubai oil price, Japan Crude Cocktail (JCC), and Indonesia Crude Price (ICP). In this study, several fuel cost scenarios were created to determine SMPs.
The REC predictive model derives the monthly REC price based on Korea’s renewable energy policy and the RPS distinctive characteristic. However, the demand of the REC spot market is inflexible, as the electricity suppliers are obligated to source a growing proportion of the electricity supply with renewable energy, unless buyers postpone their obligated REC or pay a penalty. Accordingly, the quantity of supply and demand of the REC spot market led to price change. In this study, the model computed the prices by comparing the supply and demand of the REC spot market. When the supply is higher than the demand, the REC spot market price decreases by an explicit rate and vice versa.
REC supply is quantified using the generation blueprint of renewable energy and REC weight, which are planned out by the government and the Korea Energy Agency. REC demand is computed as a specific ratio of whole generation. The equation for REC demand is as follows:
where
is the REC demand of year
in the REC spot market,
denotes the total generation of electricity suppliers from last year,
denotes the ratio intended to determine the amount of obligatory purchasing REC, and
and
are the generation of large-scale hydropower and tidal power, respectively.
The annual expected trading volume of the total RPS market is calculated by comparing the demand and supply of the RPS market of the applicable year. Based on each percentage of the market’s share, the model computes the concluded amount of REC of each RPS market. The self-construction market and in-house contract market’s percentage of each year is fixed to the average of the last five-year ratio as the market’s proportion remains steady since the launch of the RPS policy launch. As the fixed-price contract market ratio increases steadily by approximately 1% each year, the tendency is applied to the variable. The remaining volume determines the supply and demand of the REC spot market under the assumption that the transaction of REC is fully achieved at the smaller quantity from the monthly supply and demand. The supply and demand of the REC spot market obtained from the previous steps is randomly spread monthly and yearly. As the monthly trading volume of the coming years are imperceptible, the SoftMax function [
51] is used to normalize the input of the trading possibilities of 12 months into the standard exponential function of each element. The monthly negotiable quantity of supply and demand is reckoned as follows:
where
is the REC spot market quantity of individual supply and demand for year
of month
,
is the REC spot market quantity for
year,
is the expected ratio of REC to be traded on year
of month
.
The model passes on the quantity difference to the next month. Untraded supply and demand are updated to the following year. Therefore, the expected trading volume for the following year is also freshly updated as untraded REC. By following the steps, the model predicts the REC price for each year until 2040.
The LSMC simulation is processed at the final stage of the algorithm to obtain the optimal transition investment strategy for PV generators. It is used in previous studies such as those of Zhu and Fan [
52], Rigter and Vidican [
53], Ryan et al. [
54], Lee and Shih [
55], Zhang et al. [
56]. When processing the investment strategy for PV generators, Monte Carlo simulates Ω sample paths for performance warranty time
in N discrete time intervals. Along the path,
is generated as a PV net-investment profit for the time evolution of the underlying assets. The net profit of PV generation will drift up by the risk-free rate of the PV investment and will be randomly shocked by the standard deviation of returns at time period
. The expected PV investment profit in time
at
path simulation is as follows:
where
is the expected PV investment profit for
timeline,
is the performance warranty period of
PV,
is the generated PV power in month
,
is the system marginal price in month
of year
as monetary unit in KRW/MWh,
is the standard deviation of PV plant profit,
is the risk-free rate of the PV investment,
is the standard normal distribution,
is the discount rate, dt is the time step when an investor can exercise the option and is derived from dividing
by N, and
is one of the pathways among sigma sample paths.
For each time step
, the exercise value of the PV investment at time step
is to find whether the investor can exercise an investment option or should hold an investment plan. The immediate exercise value is calculated by comparing
with the investment cost. When the PV investment profit exceeds the investment cost at time
, the continuation value equals zero; otherwise, the value is still positive. The equation is as follows:
where
is the immediate exercise value at time step
,
is the PV unit investment cost, and
is the installed capacity of PV. The PV unit investment cost tends to decrease with falling price of PV panels.
Equation (6) derives the total payoffs at time step dt by averaging the obtained net profit and discounting the payoffs back to the present value. When
has a positive value, the continuous value is estimated from the immediate exercise value, using least squares regression [
57]. This starts from terminal time (
and works backwards. Then, the option holder compares the obtained continuous value with the used immediate exercise value and updates the payoff. In conclusion, the value of the PV investment profit is obtained by calculating the average value of all the paths. This statement can be expressed mathematically as follows:
where
is the expected PV investment value and
is the payoff at the
sample pathway.
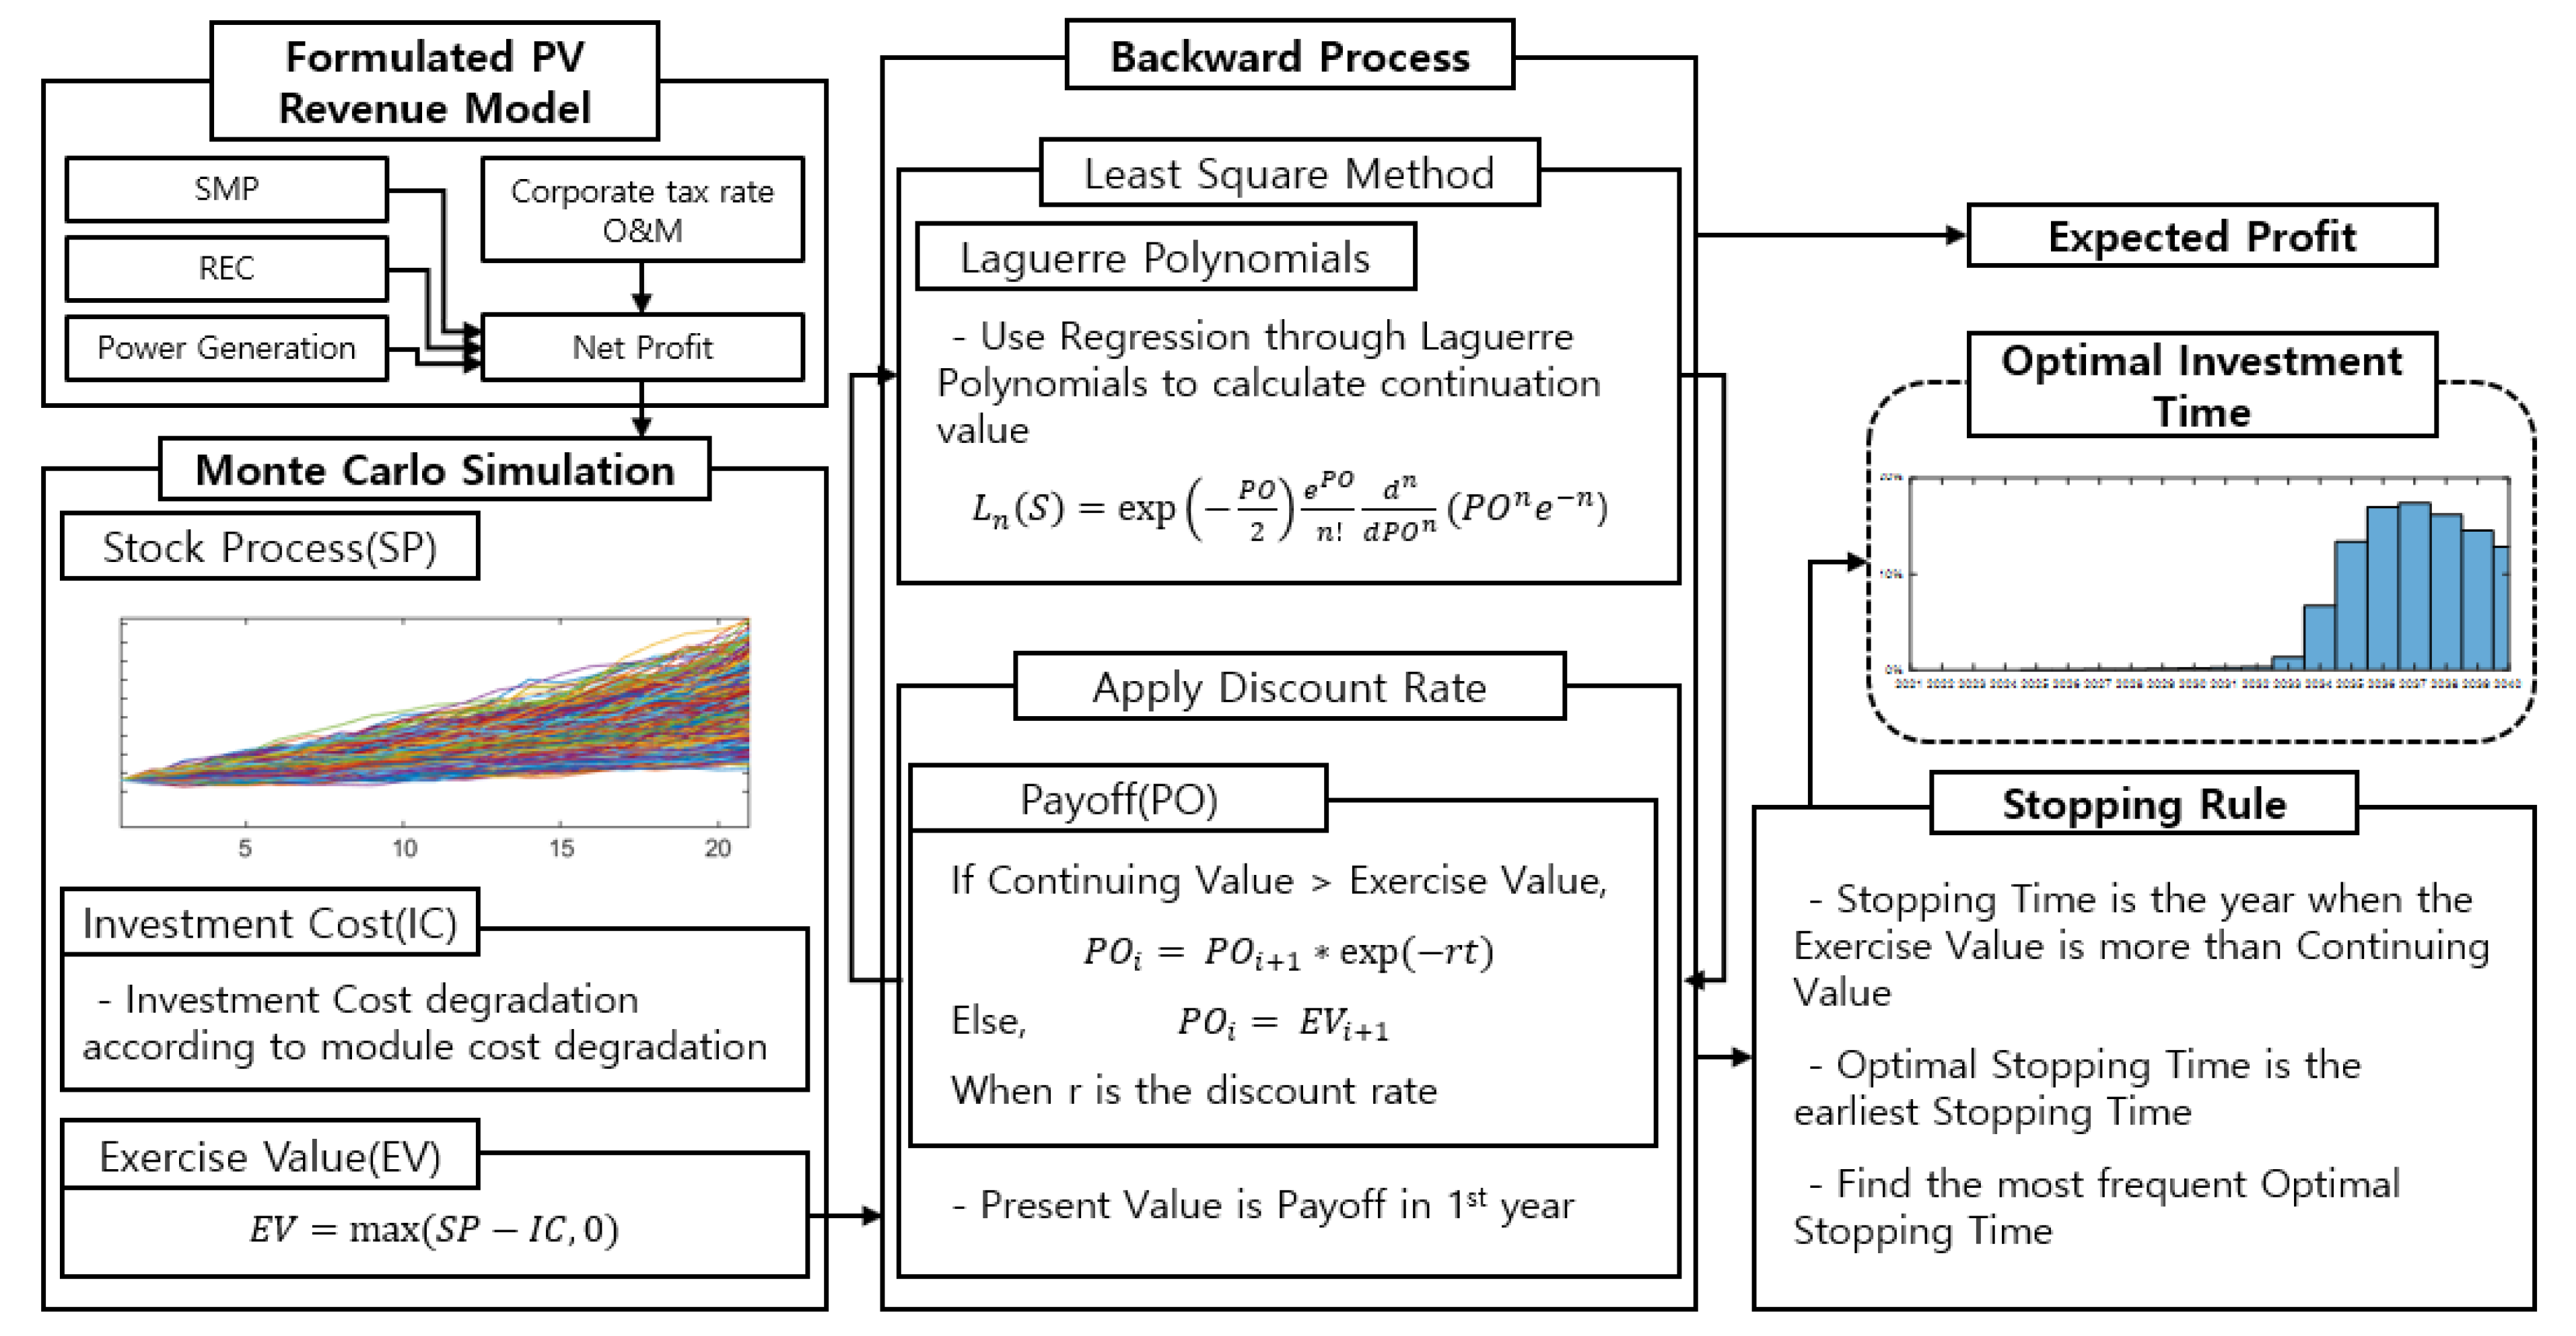
4. Investment Assessment of a Volatile PV Generator Based on LSMC with Stopping Rule
The RO model, especially American options, estimates the value of renewable electricity investment as investors exercise the option at any time point. Particularly, Monte Carlo simulations have commonly been used to evaluate electricity investment projects, as the method computes the uncertainty and benefits of PV generators [
58]. However, the LSMC assumes the lifetime revenue of the PV generators and values the PV generator investment simultaneously.
In the investment assessment process, the expected net profit of the PV generator is regarded as the initial stock value. Further, whole paths are produced in each trial. The option value for investors to exercise their investment is computed by comparing the net profit and investment cost. Optimizing the stopping time is difficult, as the option can be exercised only once. Our proposed model optimizes the stopping time by comparing the options of the investors considering whether to postpone their investment or start investing. The decision-making process starts from the last step and ends in the first step using backward dynamic programming to consider the discount rate. In each calculation, the continuous value is estimated using least squares regression as it signals the decision of the time, which maximizes payoff. Therefore, the LSMC approach estimates the optimal stopping time and maximizes the payoff in the whole observed time step.
Figure 2 displays the entire framework of our proposed investment assessment method, which is as follows:
Step (1). The separate PV profit component model simulates the entire life span of the PV generator and sums up to the annual net profit with the corporate tax rate, operational and maintenance cost, and annual solar panel degeneration rate, all of which are considered.
where
is the net profit in year
in month
,
is the generated PV power in year
in month
,
is the installed capacity of PV,
is the SMP price in year
in month
,
is the REC price in year
in month
,
is the Operation and Maintenance cost, and
is the corporate tax cost.
Step (2). The algorithm then computes the total revenue to the planned retirement of the PV generator. As an input to the LSMC, the investor’s gross profit for year
is calculated as follows:
where
is the investor’s gross profit,
is the annual discount rate, and
is the PV unit investment cost.
Step (3). random stock paths are generated using the Monte Carlo method. The LSMC method simulates stochastic chronological paths of options that investors can exercise.
Step (4). Backward dynamic programming takes the higher value from the exercise value applied with the discount rate and continuous value calculated with least squares regression. The regression functions using Laguerre Polynomials are as follows:
where
,
, and
denote the estimated price of continuous value, Laguerre Polynomials, and stock price at time
t, respectively.
are the coefficients of the regression function. The expression above ignores the exponential term for ease of calculation. If the exercise value is larger than the continuous value, the option can be exercised.
Step (5). The optimal option stopping time can be calculated in Step (4). The stopping time can be determined by continuously comparing the updated exercise value with the continuous value. The last stopping time in the backward process is the most profitable solution of stopping time, as there are many stopping times at one stock process.
Step (6). The averaged value of the first-step data indicates the expected profit of PV generator investors.
The proposed model can be used to analyze the profit of the PV generator in a certain scale of capacity and further calculate the optimal stopping time using the LSMC method.
5. Numerical Results
The case study is presented to denote the RO valuation of PV investment using the LMSC simulation. The model used input data from 2016 to 2020, obtained through the KEPCO and relevant studies. The data for the PV investment plan algorithm, which includes financial variables and maintenance durations, are fixed values.
This study modeled PV generators located in Jeollanam-do, the southwestern part of Korea, as it shows the highest PV insolation rate, above all other regions.
Table 1 details the value of the corresponding parameters. The initial cost of PV panel in
Table 1 is assumed to be installed in 2020. In addition, it is assumed that each year, the cost decreases by 3.9% for PV installations of 100 kW or less, 4.3% for PV installations between 100 kW and 3 MW, and 4.5% for PV installations above 3 MW, respectively. The MATLAB software was used to implement the model.
5.1. Modeling of PV Revenue
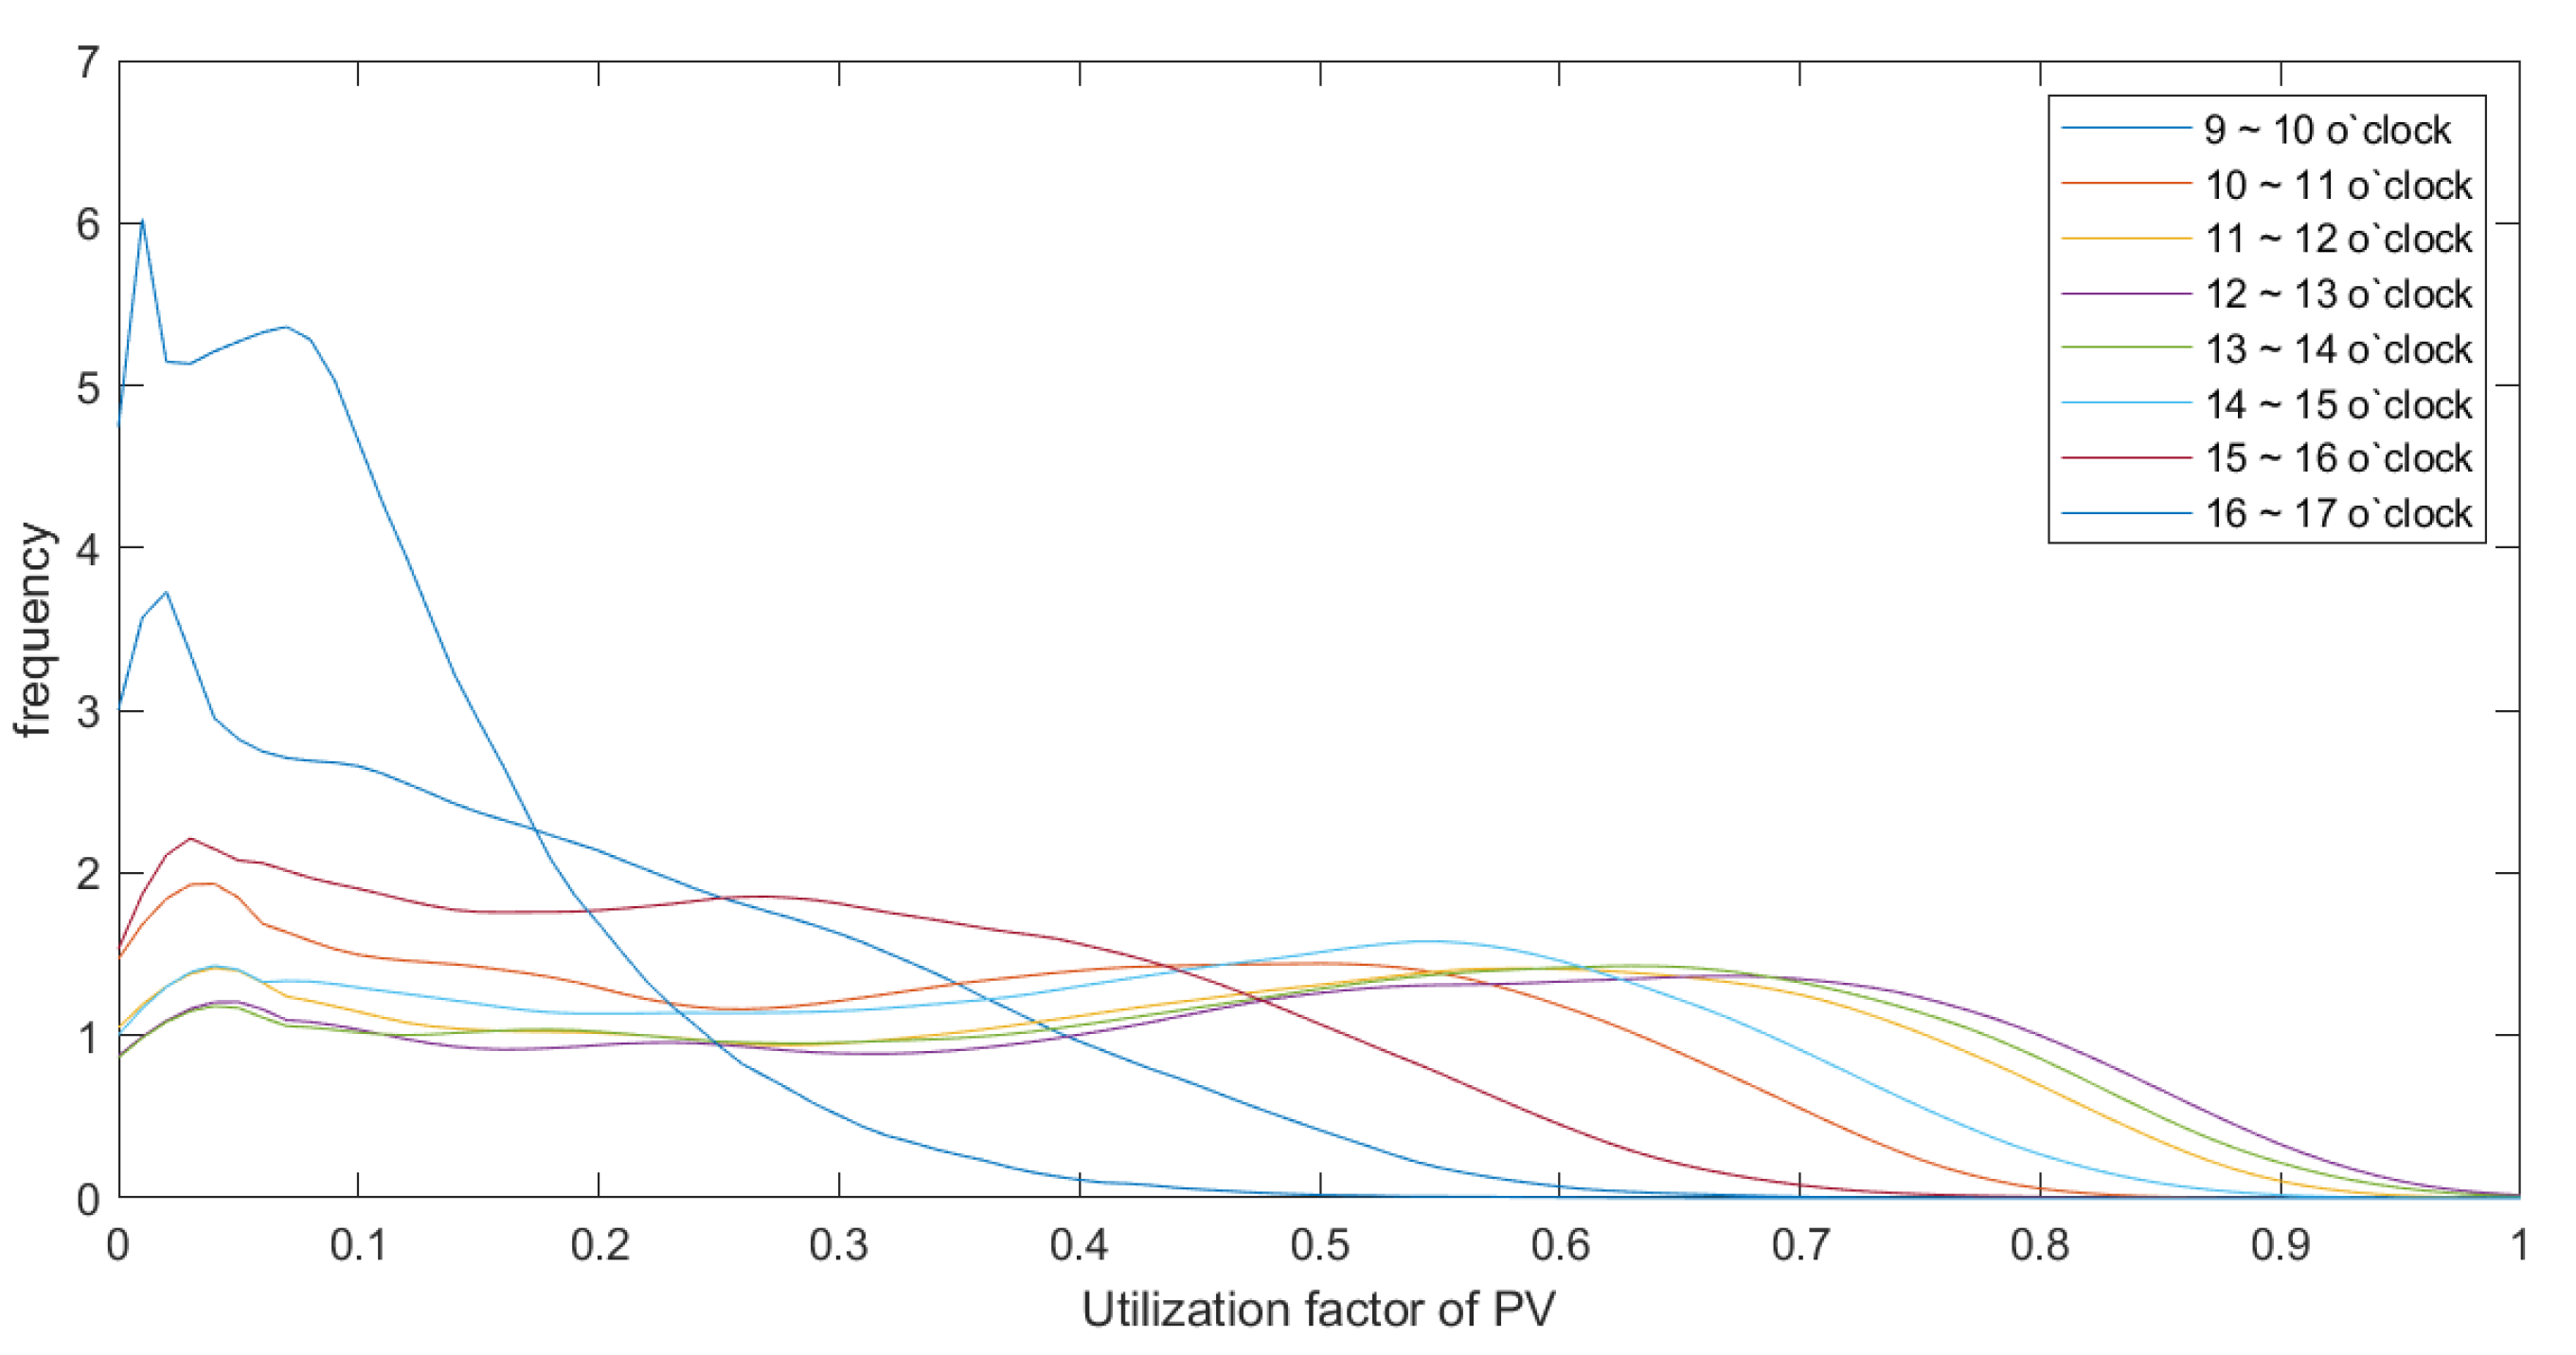
PV generation data constructs a probability density function using historical data. Regarding the estimation, the algorithm selected hourly data with an average utilization factor of over 1%.
Figure 3 illustrates the January case result of the estimated probability density function in a domain as zero to one at 0.01 intervals. In cases without negative historical data, the outcome showed negative values, as density is estimated using relative likelihood. In this case, negative values mean no power generation and were replaced by zero. As the PV generation model is normalized by the capacity of the PV generator, the PV capacity must be multiplied by the simulation results to obtain PV generation.
The generator portfolio and power load data used for SMP forecasting were included in the ninth long-term basic plan for power supply and demand. The SUDP cost functions used historical data. Moreover, those constructing generators were assumed to have the same parameters as brand-new generators using the same fuel. Fuel costs and transmission constraints were assumed to be similar to those in 2019. Renewable energy capacity data predicted for 2040 were used as input data. Its utilization factors were as follows: PV was 14.6%, onshore wind power was 23%, offshore wind power was 30%, and other renewable energies used historical data as the utilization factor. The load pattern was assumed to grow gradually, yearly, in a certain ratio following the total load increase rate.
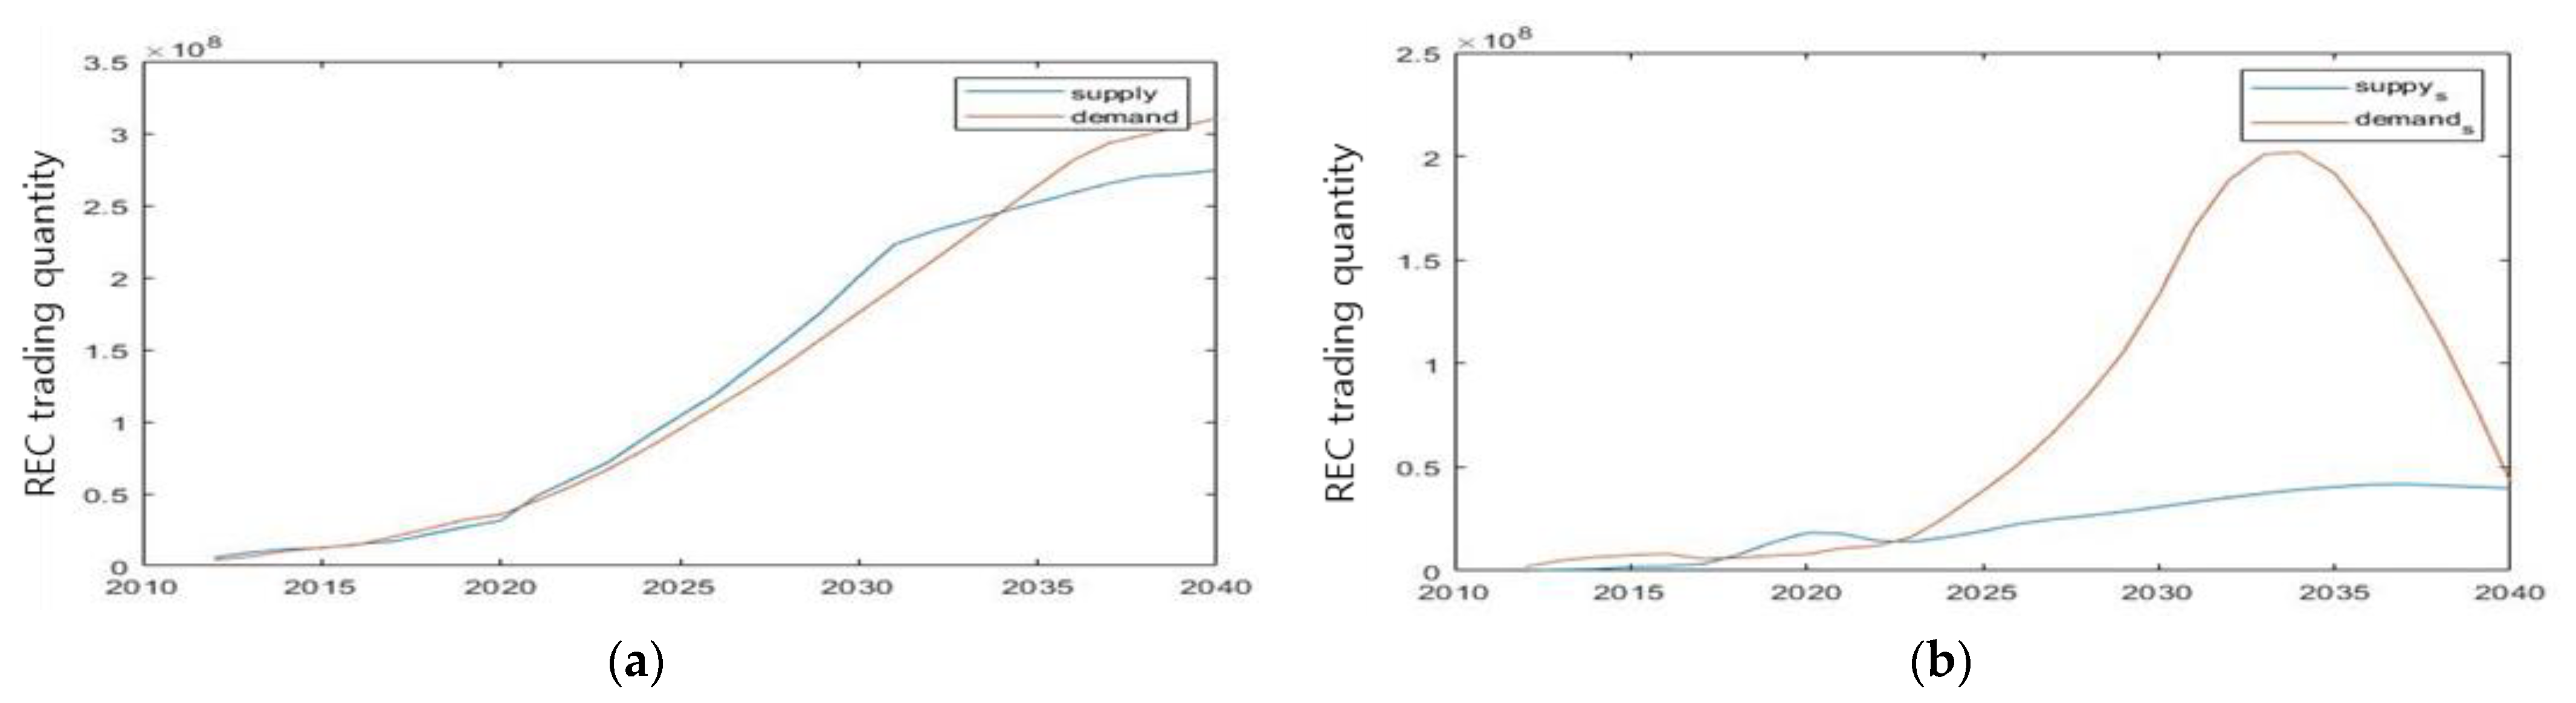
The RPS market supply and demand quantity were estimated on the assumption that the REC weights maintained values of the REC weights in 2018. The volume of the REC spot market was determined by deducting the transactions volume in other REC markets from the annual RPS market volume and updating the previous year’s surplus.
Figure 4a shows the tendency shift of the REC spot market volume compared with the whole transaction of the RPS markets operating in Korea. The RPS market shows that both demand and supply increased while there was an inflection point when demand got higher than supply. However, in the REC spot market, as shown in
Figure 4b, the inflection point was reached quite fast. Further, the gap between the two was considerably high. Note that the REC spot market graph ignored the effect of electricity suppliers paying penalty surcharge and waived their obligated REC.
5.2. Investment Assessment Based on the LSMC
This section presents the optimal investment plan using the LSMC. It outlines three scenarios for each price element, SMP and REC, to consider the volatility. The LSMC model proposes the optimal PV capacity and investment timing based on nine scenarios. To show the tendency of investment value, a representative of four different PV capacity is shown as a result of our investment model.
The SMP price scenarios project the impact of Dubai oil price cases, presuming that Dubai oil price has a linear correlation with the LNG`s fuel costs. The recent 13 years of Dubai Crude oil price show the lowest level at 26.86 and the highest level at 131.31 dollars per barrel, with an average of 64.55 USD/barrel in 2019. The SMP scenarios are as follows:
SMP-1: Lower fuel case; a case in which fuel costs are considered half of the values in 2019.
SMP-2: Base fuel case; a case in which fuel costs are similar to those in 2019.
SMP-3: Higher fuel case; a case in which fuel costs are twice as high as those in 2019.
The REC price scenarios consider the impact of penalty cost. The scenario schemes cases of the buyers’ action when the penalty costs are higher than fulfilling their mandate.
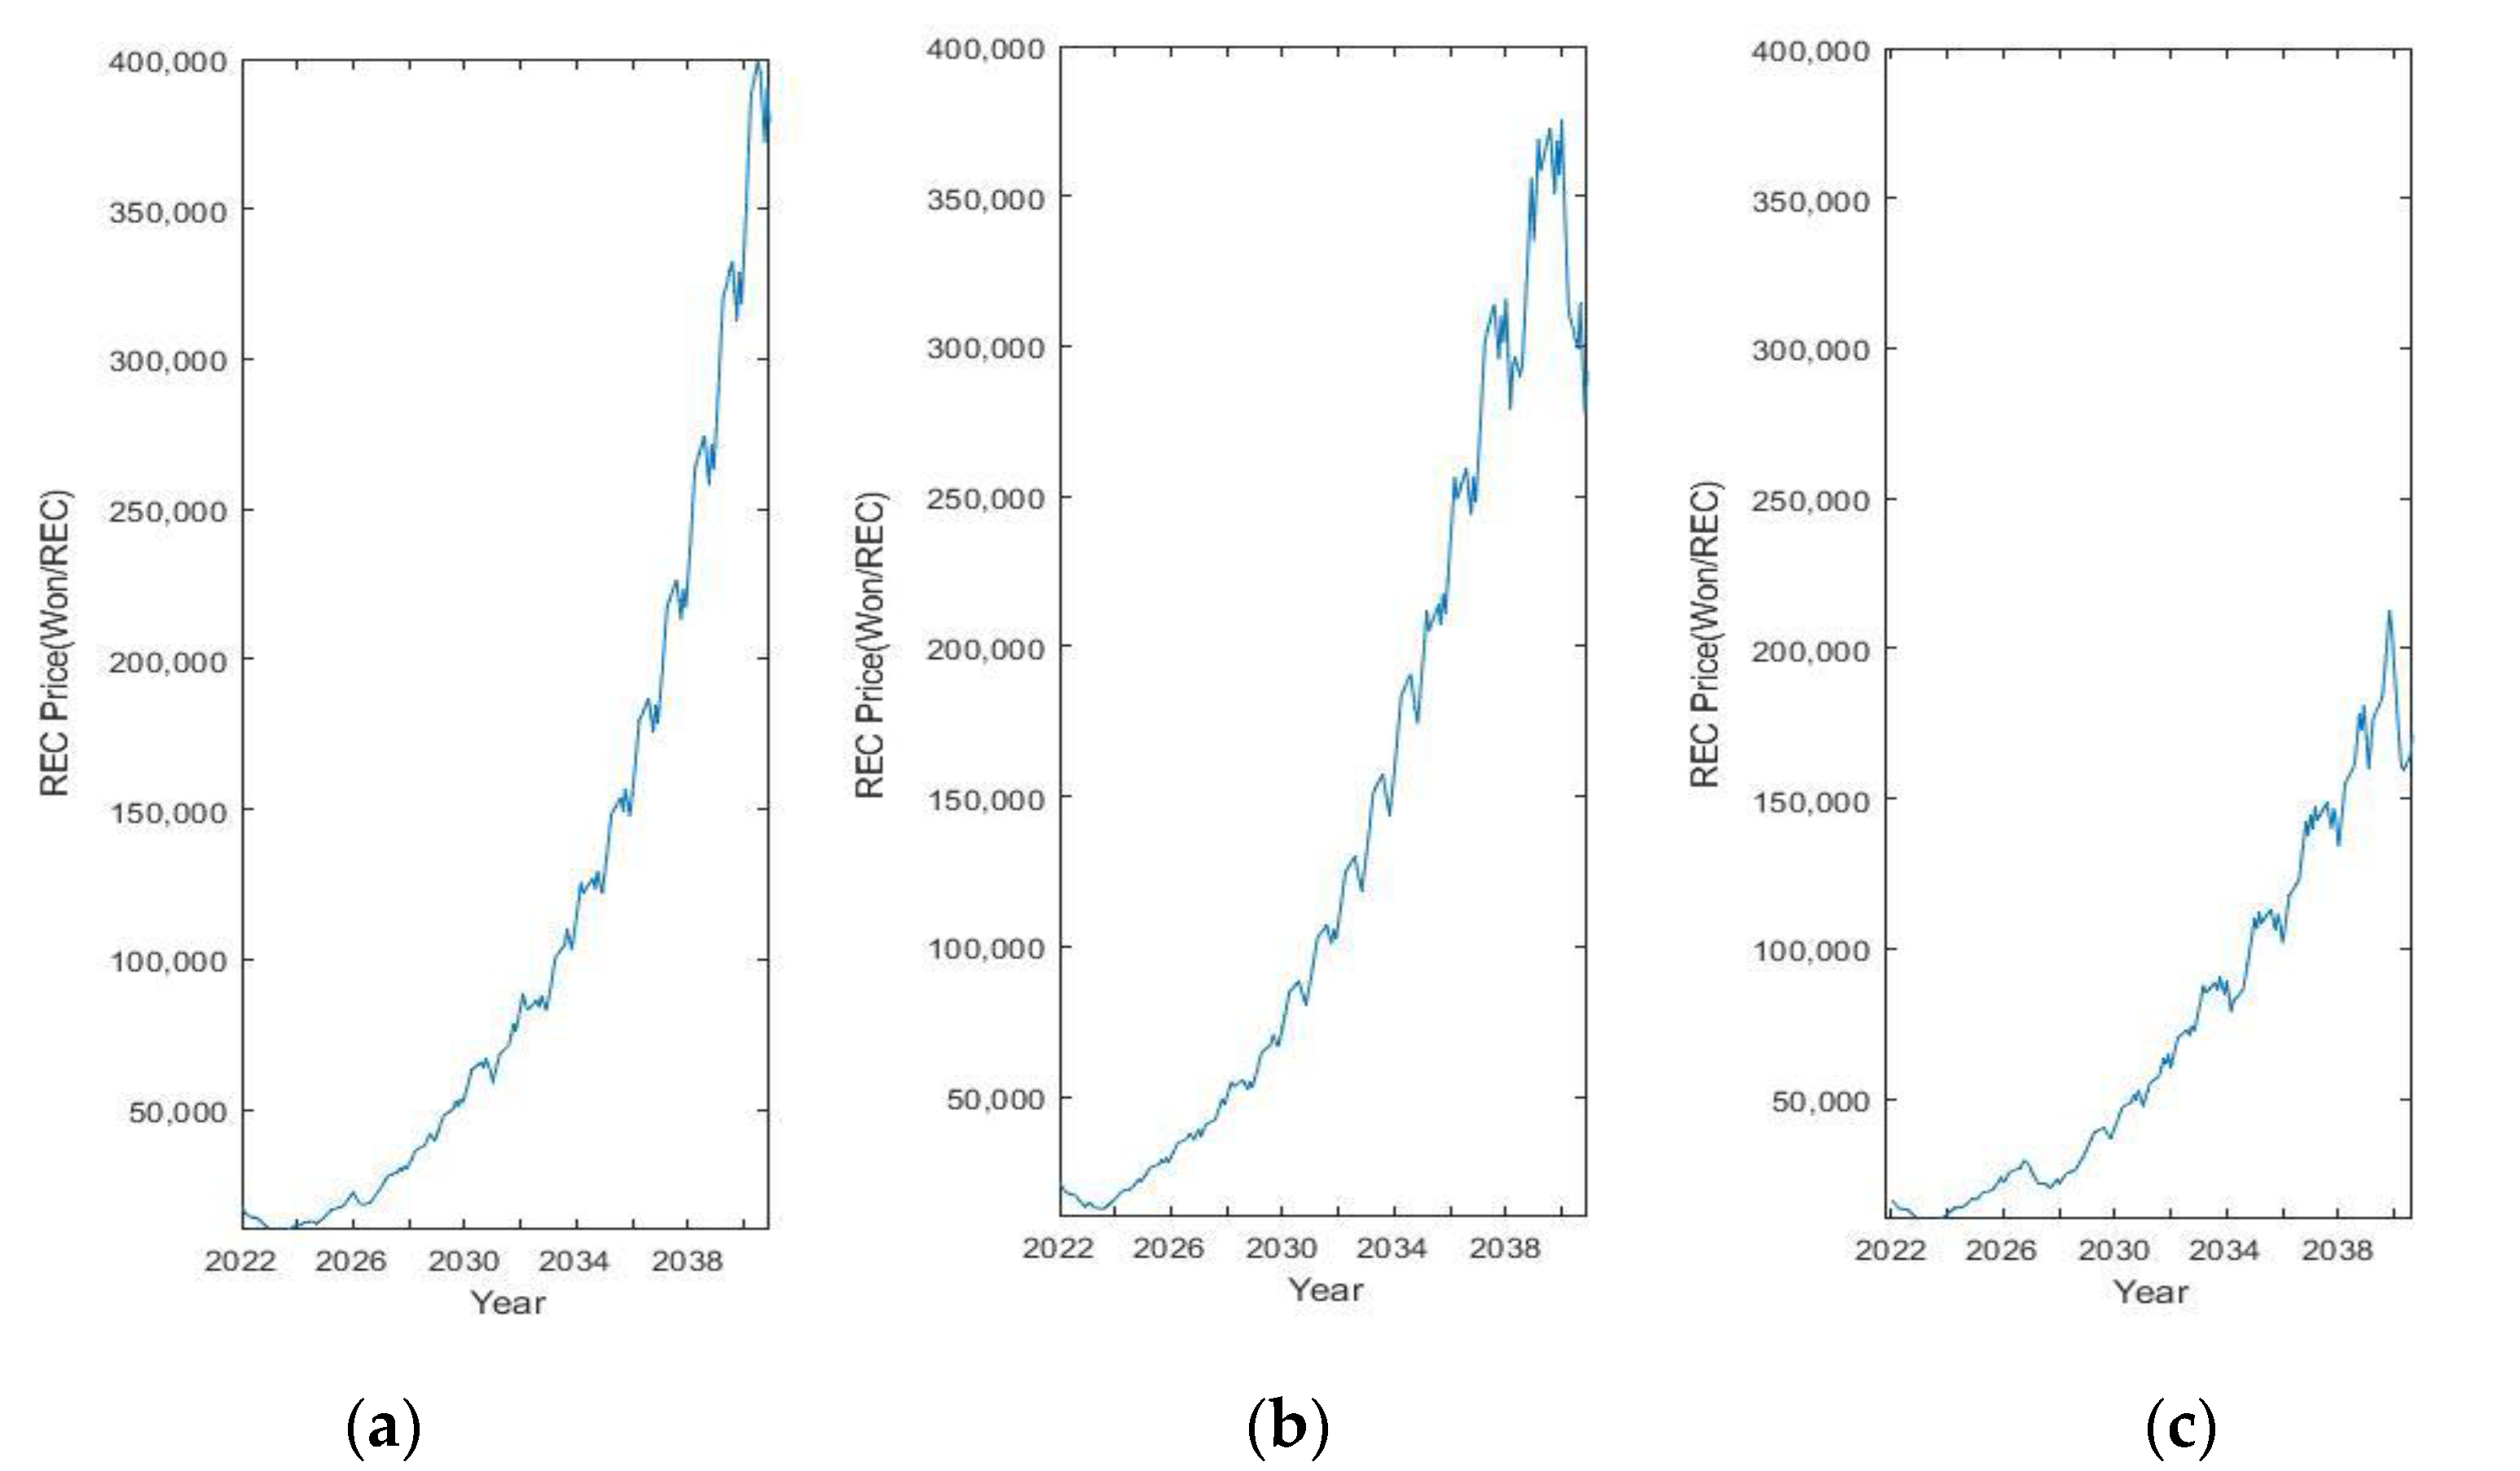
Figure 5 shows the REC price scenarios to demonstrate the PV investment simulation. Although the overall trend of the increase in price was similar for all scenarios, they differed in the final price reached in 2040. The REC scenarios were as follows:
REC-1: Obligate REC duty case. The frequent event of the REC spot market price is higher than the penalty that leads to more REC price volatility.
REC-2: Base case reflecting the current price fluctuation.
REC-3: Pay penalty case. The REC price increases are mitigated as REC buyers pay fines instead of buying their obligated duty REC.
Table 2 presents the optimal value of the total net profit and optimal investment period from all nine cases. The larger the PV plant’s capacity that investors are willing to invest, the faster the investment must start, as the optimal time predicted from the LSMC was 2024 for 3 MW and 2035 for 99 kW. Regarding the base case scenario, the average net profit increased as the capacity grew. The return on investment (ROI) of PV investment decreased as the solar capacity expanded, owing to the increasing cost for keeping solar panels in shape to maintain the performance yield. The return of investment decreased as the capacity of PV increased. The solar capacity of 99 kW reached its highest ROI of 1.72 with an average net profit of 2.1 hundred million KRW, while the 500 kW solar system reached its highest ROI of 1.16 with an average net profit of 0.93 hundred million KRW. As the solar capacity expanded, the ROI drastically fell and reached an average ROI of 0.03 in the PV capacity of 1 MW. The case of solar energy capacity of 3 MW got negative ROI in most scenarios of SMP and REC, the most extreme case reached an ROI of −80.4. It is a poor investment in higher capacity cases, as the profit is not enough to recoup the initial investment.
REC weight had a significant influence on PV profit, as all the three scenarios showed a significant decrease in net profit when PV capacity was 3 MW. The decline in revenue resulted from the significant impact of REC weight on installations greater than 3 MW. REC weight of 0.8 was applied to the PV plant capacity greater than 3 MW, while REC weight of 1.0 was applied to the capacity under 3 MW but larger than 100 kW, and 1.2 to that under 100 kW. This shows that the application of REC weight according to the PV capacity had the greatest impact on the total PV investment profit.
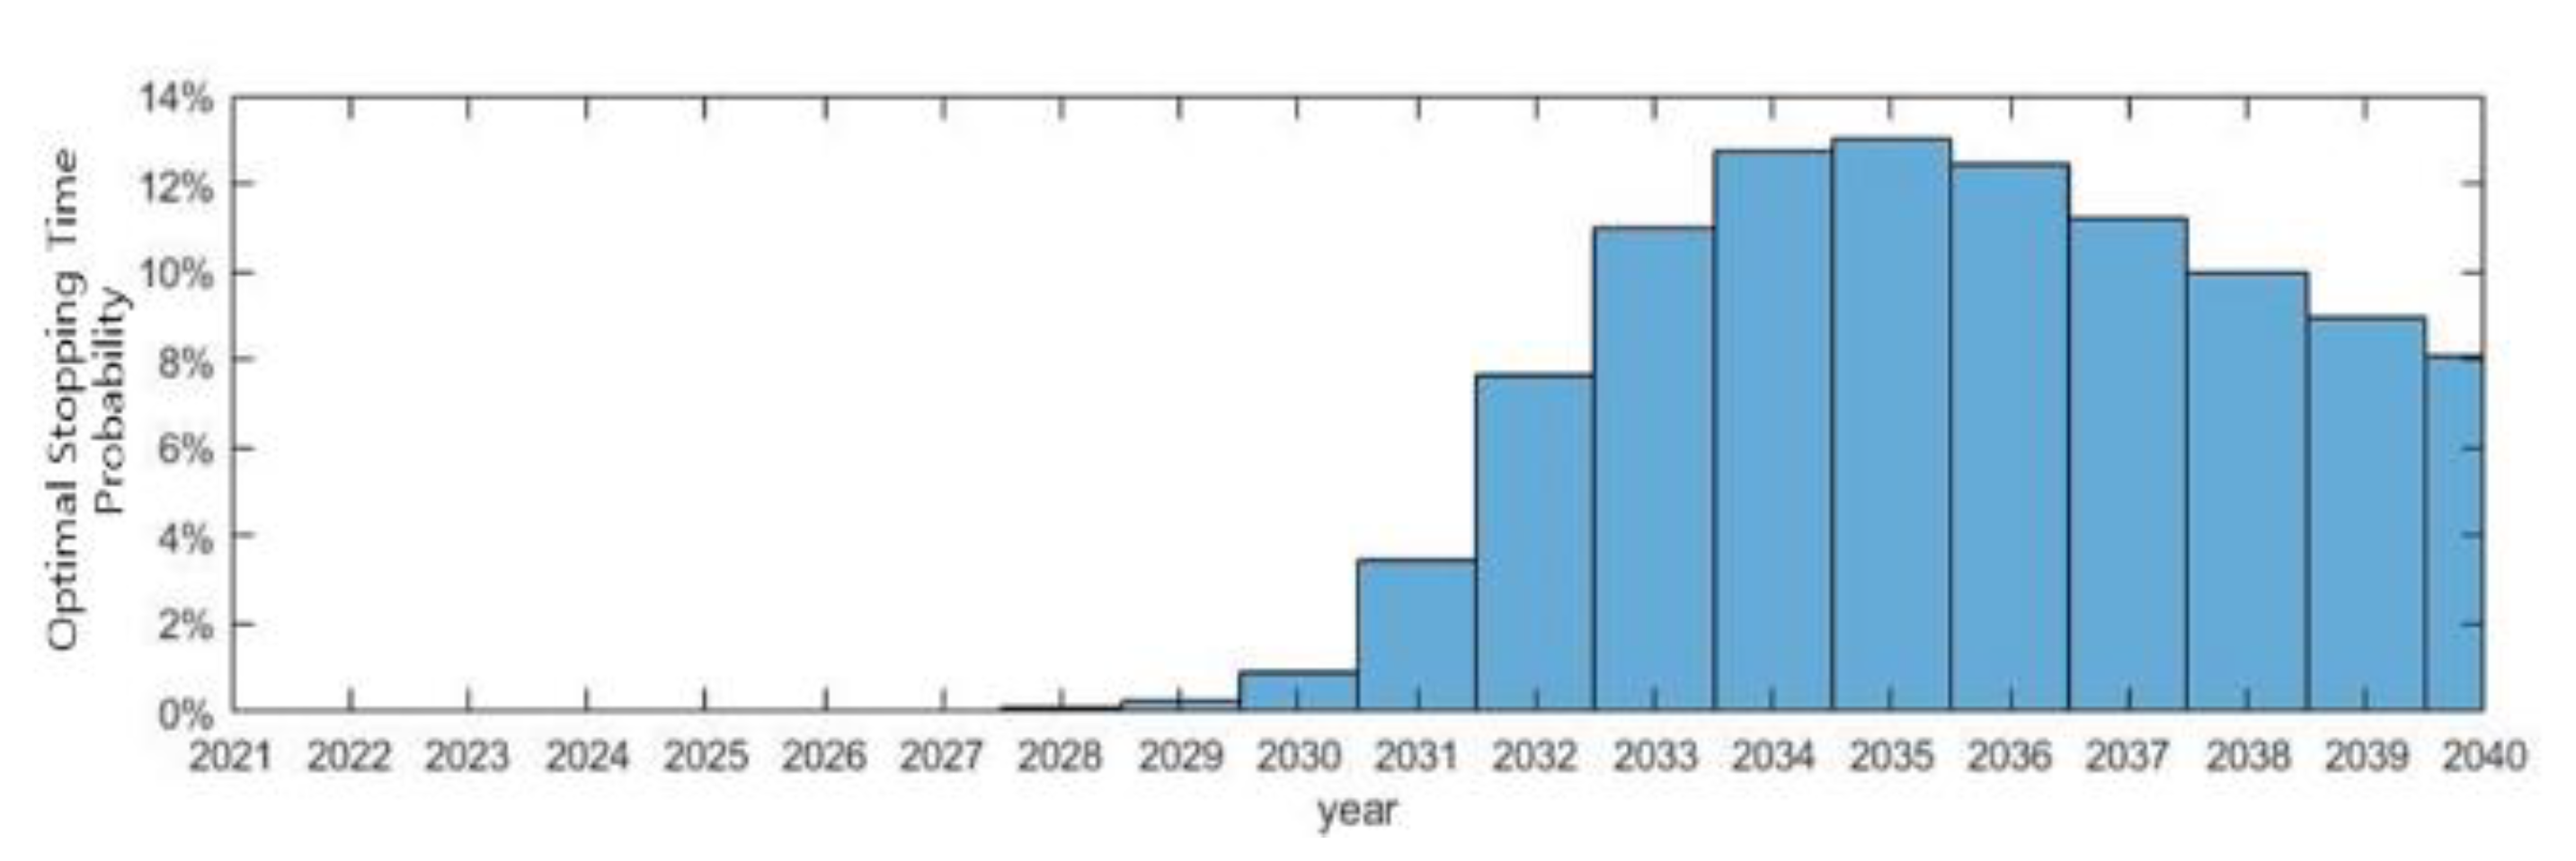
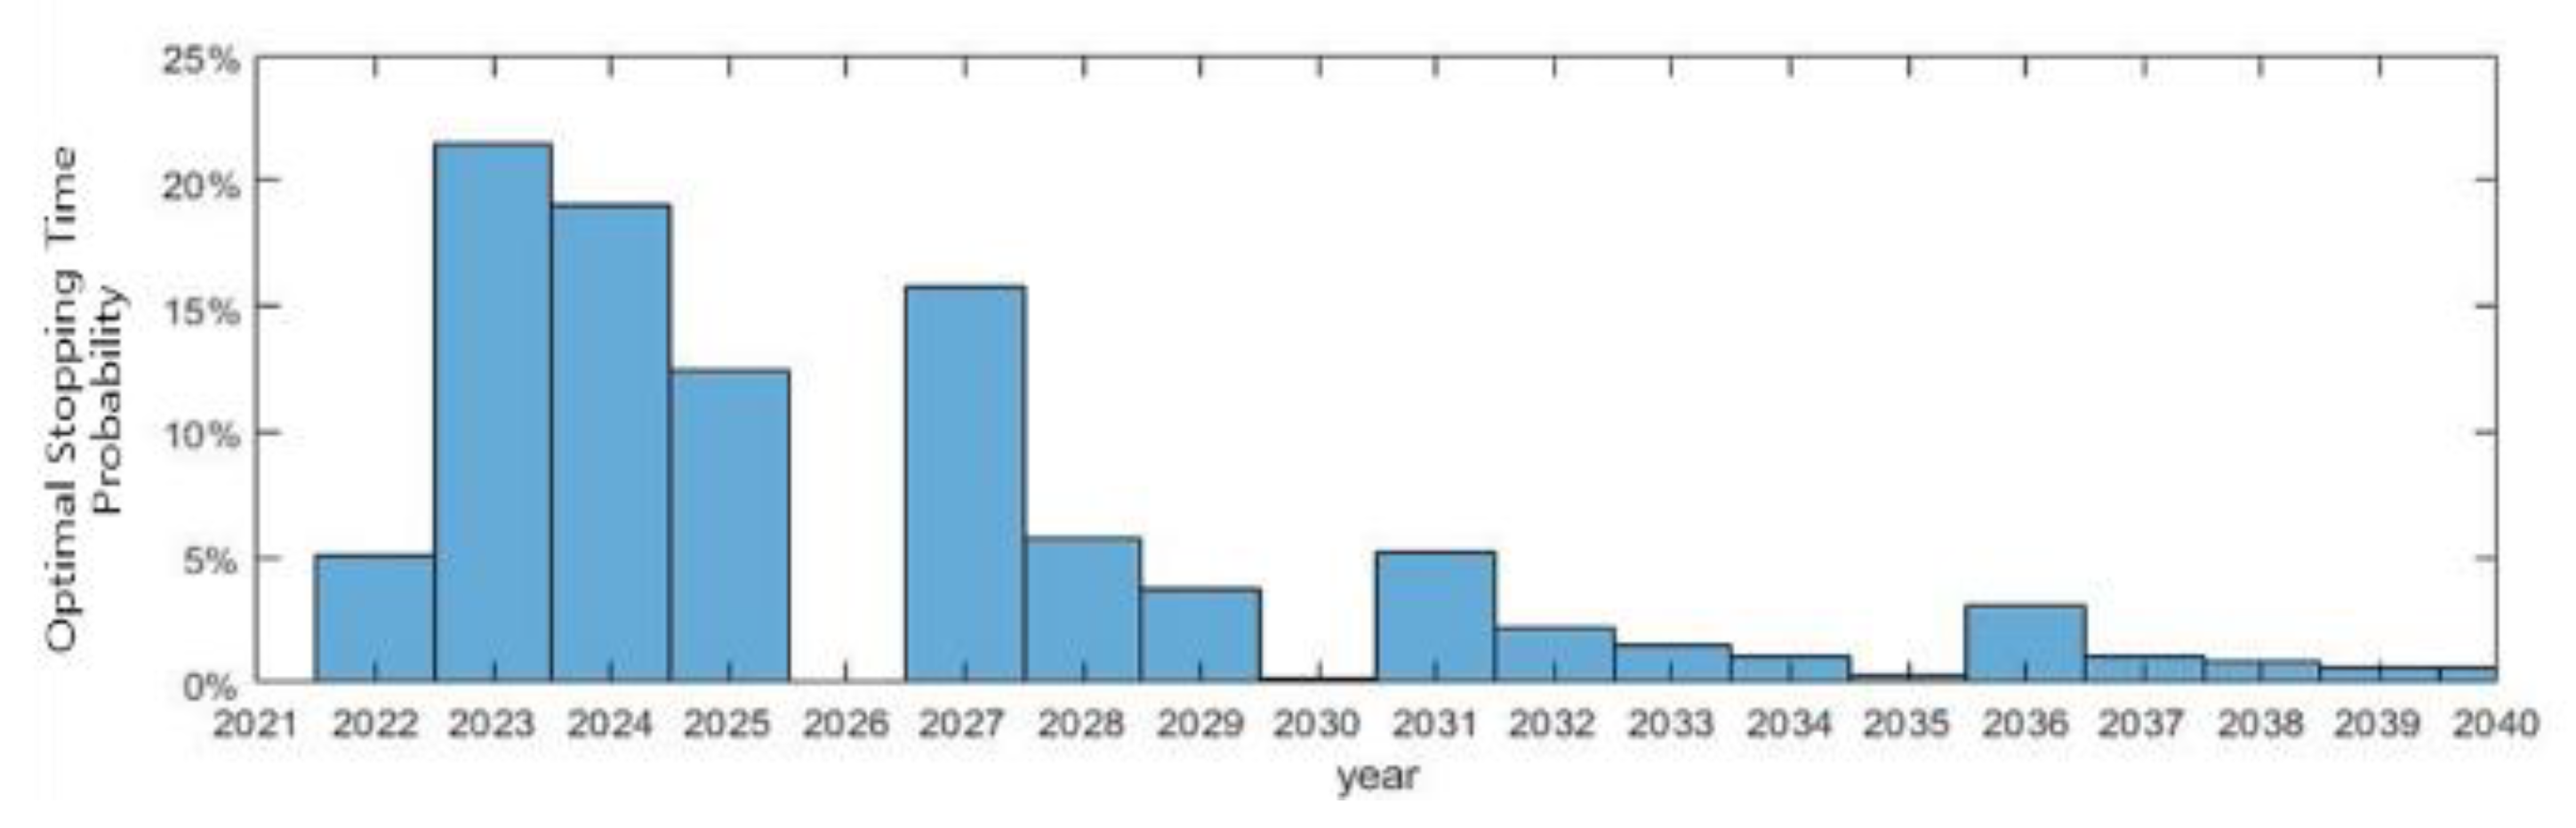
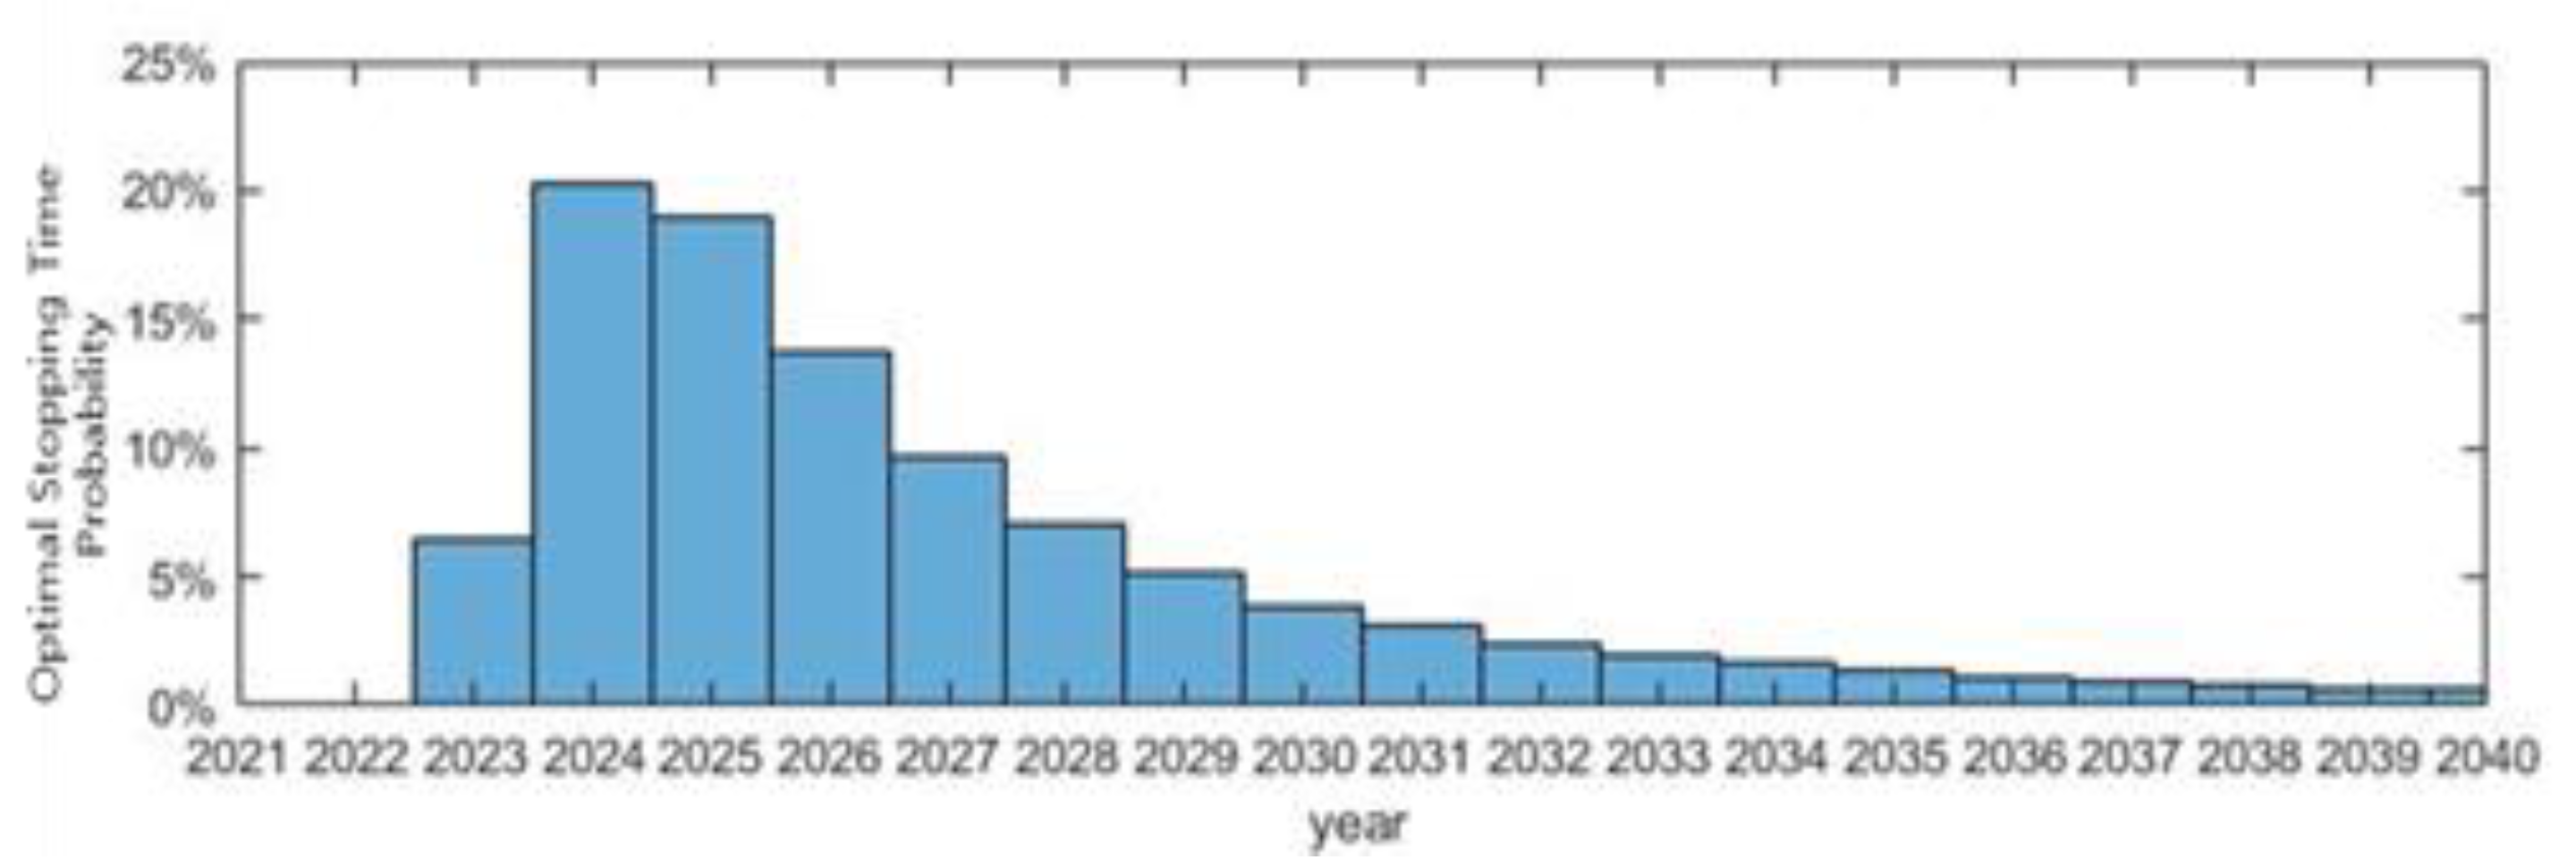
Figure 6,
Figure 7 and
Figure 8 present the best timing for solar investment newbies to enter the REC spot market to yield optimal profit. The histogram results formatted as percentage points with y-axis in each of the four figures mean percentage of the optimal stopping time from 1,000,000 LSMC simulations. Therefore, the frequently pointed year explicates the signal to start investing. The figures only show the results using SMP-3 with REC-1, as they gained the highest profit. However, the overall stopping time trend was similar when simulated in different scenarios. Investors willing to install higher PV capacity must start investing sooner than those intending to install lower PV capacity; the higher the investment, the higher the profit. However, the case of solar capacity near 500 kW showed a trend unusual from others.
Figure 7 shows that the optimal investment time was the year 2023, but starting investing in 2026 was profitless. Therefore, a PV capacity of 500 kW had sparsely distributed overall investment timing and led to another precarious factor in venturing. Therefore, the PV investment analysis method using the LSMC results investment around 2035 with a capacity of 99 kW could achieve optimal returns.
6. Conclusions
The proposed LSMC-based method can be used as a decision-making tool for PV investors to decide whether and when to invest in PV. The decision-making tool enables PV investors to manage the risks associated with PV investments. The LSMC model analyzes the profit of the PV generator in a certain scale of capacity and calculates the optimal investment time when taking part in the REC spot market. Specifically, the work is conducted by administering several scenarios reflecting the RPS market attributes. The model examines the prediction of the PV revenue with the uncertainty of price elements, such as generated solar power, SMP, and REC in advance of examining the investment plan. The expected PV revenue for the performance warranty time is computed by implementing each predicted element.
It is important not only to determine the appropriate investment capacity, but also to determine when to invest. One of the key factors in determining the PV investment timing is the REC weight in the RPS policy. The REC weight affects the price of RECs in the spot market as it determines the number of RECs supplied to the market. For moderate price of REC, more renewable energy can be supplied. To supply sustainable energy, the government should delicately adjust the REC weights of all renewable energy, not just PV. In a future when renewables and conventional generators can compete in terms of LCOE, the REC weight needs to be set to zero.
This study has limitations in a few respects. The revenue earned over the lifetime of the PV is highly dependent on renewable generation curtailment and RPS policies such as changes in REC weights. It is very difficult to accurately estimate the amount of renewable generation curtailment and PRS policy changes over the lifetime of PV. Therefore, it is also difficult to obtain the year-to-year volatility in PV revenues. These limitations can be addressed by estimating the annual amount of renewable generation curtailment and treating future PRS policy changes as multiple scenarios.
Further research is needed on the development of an economic evaluation method for PV investment incorporating renewable generation curtailment. For sustainable energy supply, Korea is promoting policies to expand not only solar power generation but also wind power generation. Thus, the proposed LSMC-based method needs to be extended to handle wind power investment.


