Article

The Economy and Policy Incorporated Computing System for Social Energy and Power Consumption Analysis

1
Smart Grid Research Institute, School of Electrical Engineering and Automation, Wuhan University, Wuhan 430072, China
2
China Electric Power Research Institute, Haidian District, Beijing 100192, China
*
Author to whom correspondence should be addressed.
Sustainability 2021, 13(18), 10473; https://doi.org/10.3390/su131810473
Submission received: 21 August 2021 / Revised: 16 September 2021 / Accepted: 17 September 2021 / Published: 21 September 2021

Abstract

:
Human activities, such as energy consumption and economic development, will significantly affect the natural environment, while changes in the natural environment will also affect the sustainability of human society. Studying the energy consumption changes of human society and forecasting medium and long-term electricity demand will help realize the sustainable development of energy in future society. However, current medium- and long-term electricity consumption forecasts have insufficient data samples and the inability to consider policy impacts. Here, we develop an Economy and Policy Incorporated Computing System (EPICS), which can use artificial intelligence technology to extract the summaries of energy policy texts automatically and calculate the importance index of energy policy. It can also process economic data of different lengths to expand samples of medium- and long-term electricity consumption forecasting effectively. A forecasting method that considers policy factors and mixed-frequency economic data is introduced to estimate future social energy and power consumption. This method has shown good forecasting ability in 27 months. The effect of EPICS can be demonstrated by predicting the medium- and long-term electricity demand.

1. Introduction

Global warming is one of the main threats to human society, so reducing carbon emissions has become the consensus of all countries. The energy and power industries account for a large proportion of carbon emissions and are the main force in energy conservation and emission reduction.
In order to reduce carbon emissions in the power industry, low-carbon power technologies have emerged. Low-carbon power technology mainly includes power system carbon emission analysis, low-carbon power planning, power system low-carbon transportation, etc. Among them, the medium- and long-term electricity consumption forecast in the power industry is the basis for achieving low-carbon power planning and evaluation, which can help the power system achieve economic and low-carbon goals. Statistics in References [1,2,3,4] show that, for every 1% reduction in the error of electricity consumption forecast, the annual operating cost of the power system will be reduced by 10 million pounds. Thus, how to improve the accuracy of power consumption prediction has always been a popular issue for researchers.
The medium- and long-term electricity consumption will be significantly affected by many randomly changeable factors, such as macro-control policy, economy, and weather [5]. Accurately quantifying the “energy policy” for grasping the impact of economic changes and energy policies on the power market is critical for improving the accuracy of medium- and long-term electricity consumption forecasts. However, current research on the effect of policy implementation is mostly based on qualitative analyses, and research on quantitative measurement of energy policy is still lacking. Existing methods [6,7,8] do not take into account the complex non-linear relationship between electricity consumption and policy factors; therefore, they cannot precisely quantify the impact of policy macro-control on regional electricity consumption.
Many scholars have also carried out extensive research on medium- and long-term electricity consumption forecasting considering economic factors. Most of the early studies [9,10,11,12] are based on the qualitative analysis of the causal relationship between economic and power demand data. They use economic data to carry out extensive exploration on load forecasting. It is in line with the current development trend of power consumption forecasting but lacks quantitative empirical analysis. Besides, the medium- and long-term power demand forecasting still has the following problems: (1) the short length of historical data series leads to insufficient data samples, (2) it is difficult to improve the prediction accuracy; (3) and the economic development and climate conditions of different regions are not the same, leading to the prediction method not having a wide range of adaptability.
In this article, we establish the Economy and Policy Incorporated Computing System (EPICS) for social energy and electricity consumption analysis. EPICS incorporates a Bidirectional Encoder Representation from Transformers (BERT)-based [13] energy policy quantitation module and a mixed macroeconomic data processing module. The energy policy quantification module uses a BERT-based abstract extraction network to understand and analyze a large number of power policy texts and then outputs the importance index of each power policy text under the policy evaluation system. The importance index can reflect the impact of different policies and measures on power load in different fields. The mixed-frequency macroeconomic data processing module can work with various economic data of different time dimensions and different influencing factors to carry out a hybrid model for fully reflecting the relationship between economic factors and electricity consumption. Finally, we propose a medium- and long-term electricity consumption forecasting method integrating economic and policy factors. It takes macroeconomic data of different time scales and the quantified energy policies as input.
EPICS innovatively applies artificial intelligence technology to the quantification of energy policy for the first time, and realizes fusion processing of mixed economic data with uneven data quality. Firstly, different from traditional policy evaluation models, which mainly focus on qualitative analyses, the policy quantification module of EPICS can objectively evaluate the implementation effects of energy policies, and dig out the merit and demerit of each policy text with a high degree of accuracy. Secondly, the BERT-based summary extraction model dramatically enhances the data processing ability of the entire system, that a large number of power policy texts can be processed and utilized. It should be noted that this is a novel and unique method, which has not been proposed in the literature. Thirdly, we use the Masking layer in the Keras framework to cover and filter out the vacant time steps, which effectively solves the problem of inconsistent data length caused by different frequencies of macroeconomic indicators.
We also introduce a key application of EPICS in solving social energy and power consumption analysis. Aiming at the problem that the traditional medium- and long-term electricity consumption forecasting has insufficient data samples and only considers a single historical load influencing factor [14,15,16,17,18,19], we use the economic and electricity data of 30 provinces in China to expand the data samples, and we take the policy factors and mixed macroeconomic data as the input of the electricity consumption forecasting model to reduce the prediction error of the model. For economic data with different frequencies, we use the Masking layer under the Keras framework to cover and filter the vacant time steps in the data with different time lengths. We use the Long-Short Term Memory (LSTM) [20,21,22] network to realize the automatic feature extraction of the mixed data and build the feature multi-input fusion model. In the 27-month consumption diction task in three provinces in China, EPICS achieved high forecasting accuracy of 1.386, 0.985, and 1.683, which is 2.415 higher than traditional methods, on average. This proves the effectiveness of the EPICS framework. The list of symbols used in this paper is shown in Appendix A.

2. Materials and Methods

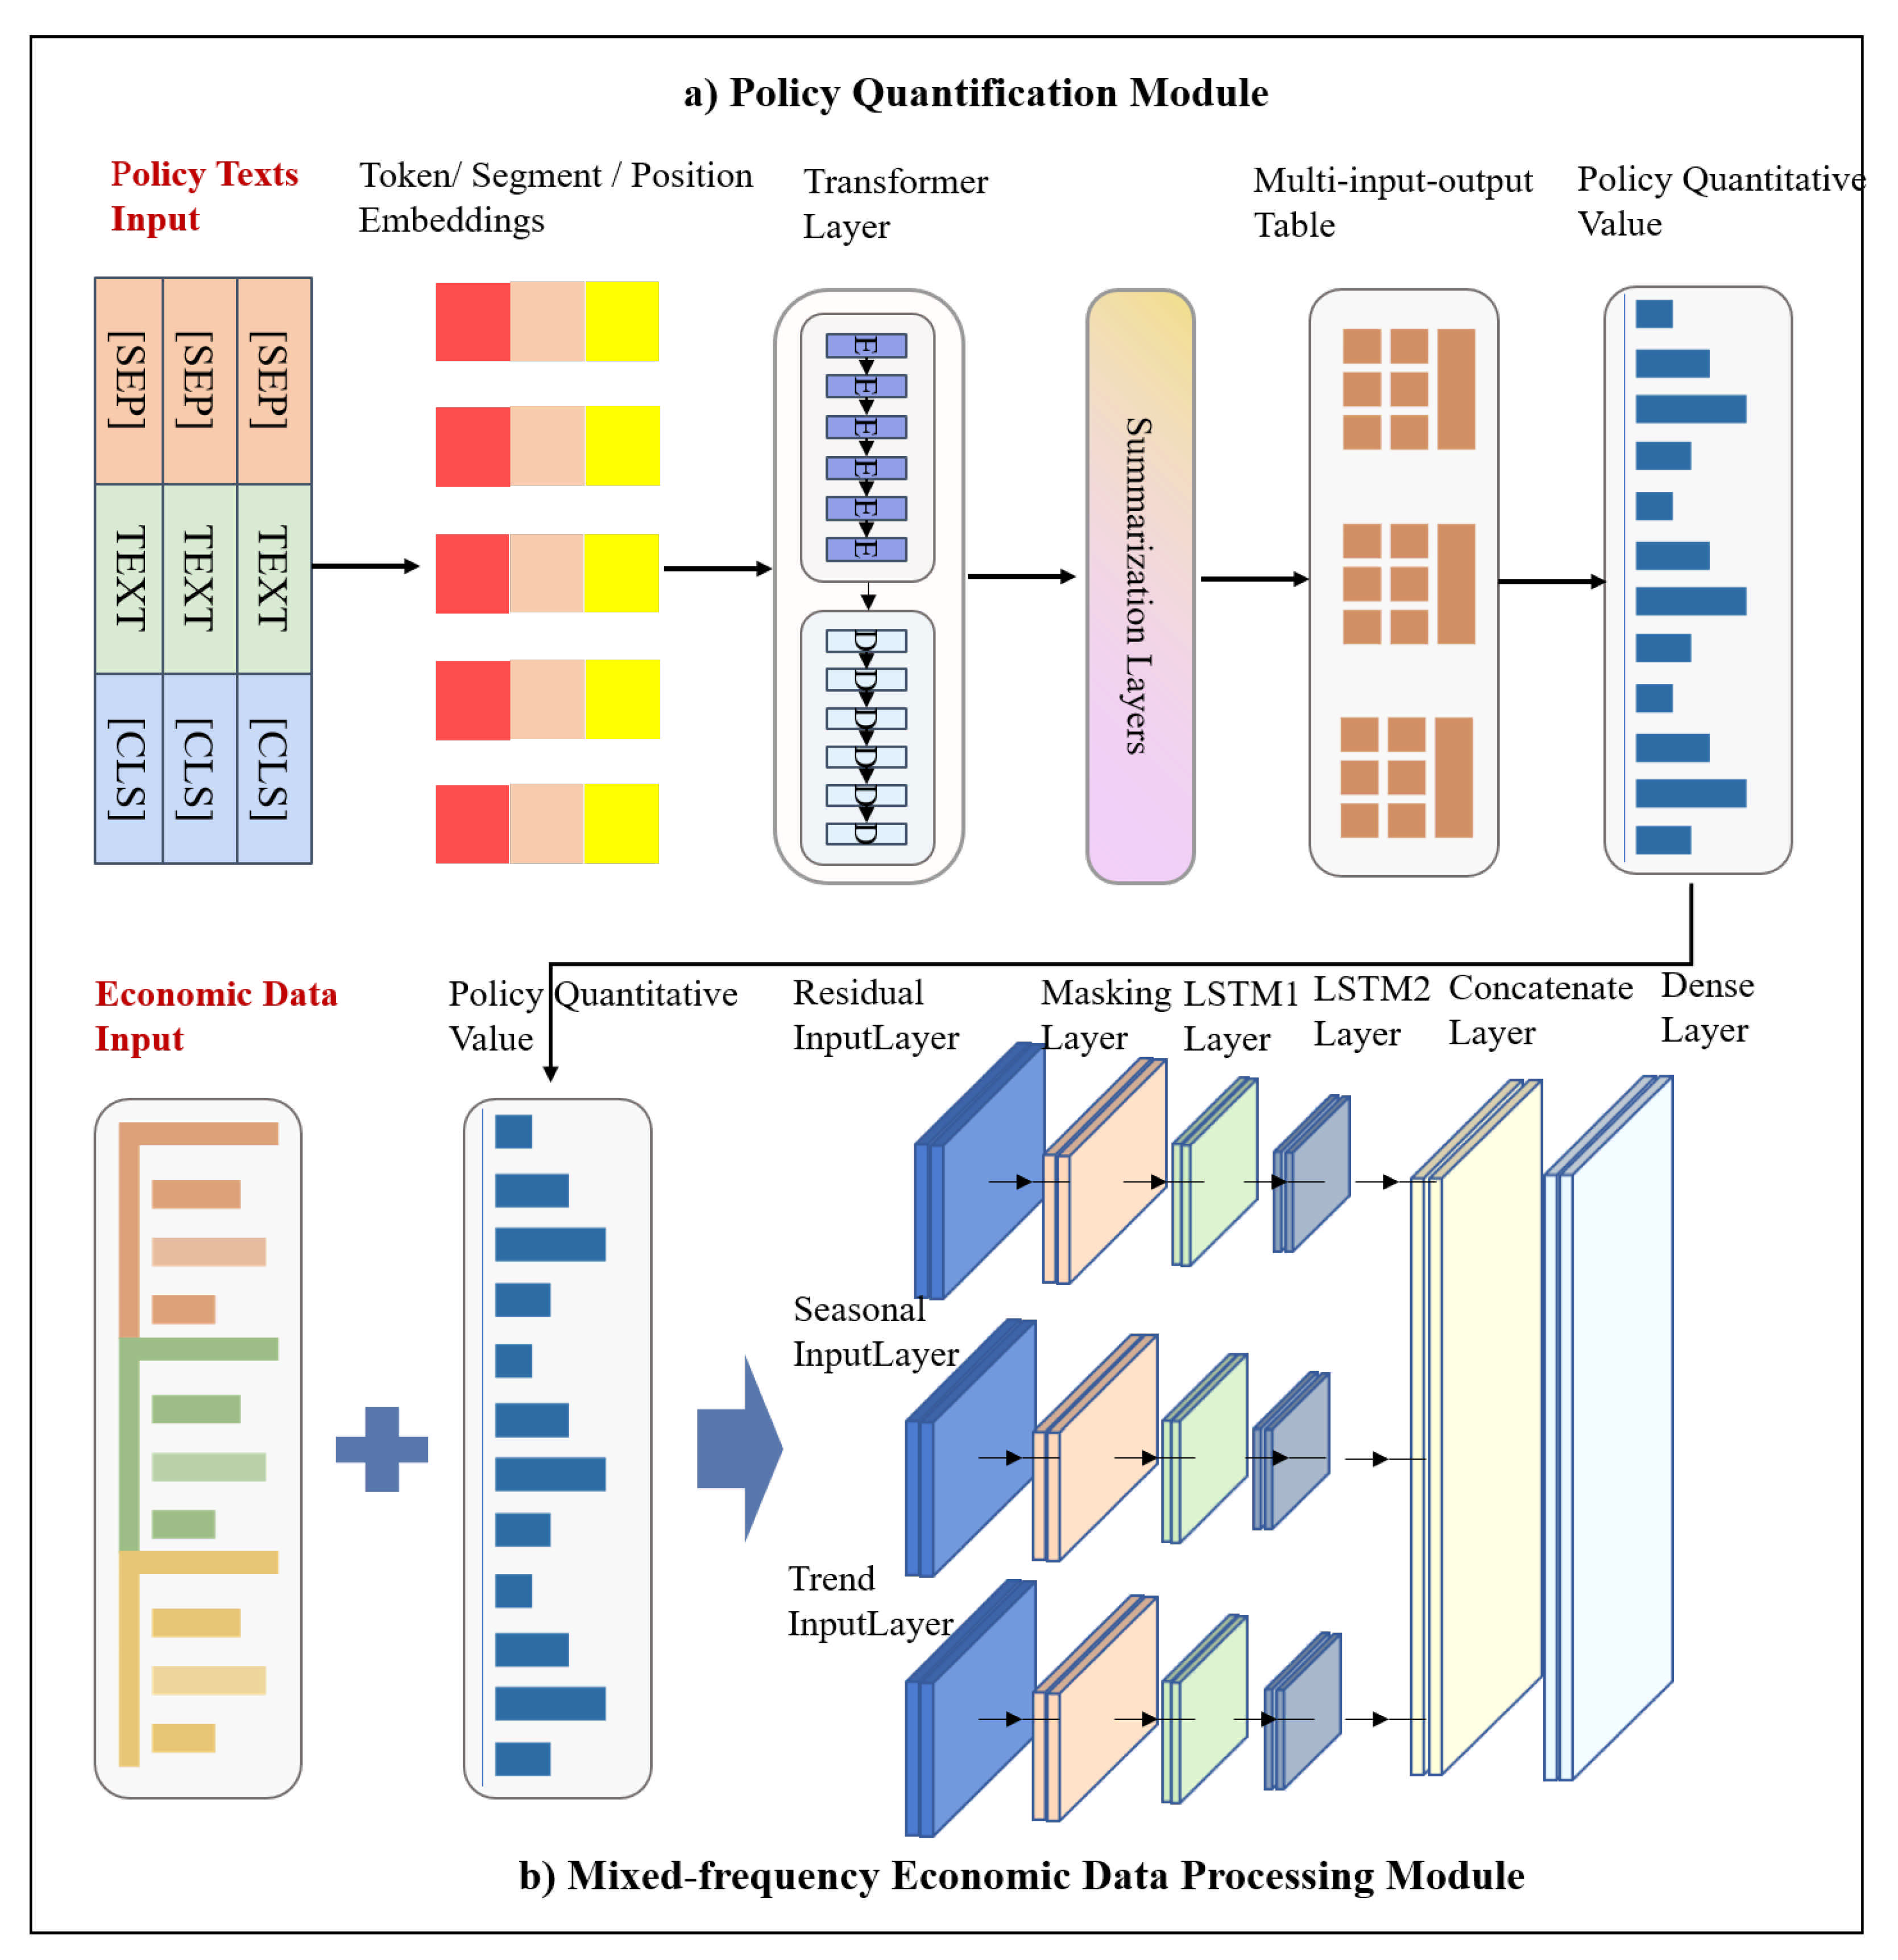
2.1. EPICS Framework

The EPICS framework has two types of input data: policy text data and mixed frequency economic data. Among them, policy text data is unstructured and economic data is structured. In order to jointly process these two kinds of data, the EPICS framework is designed to contain two main modules: policy quantification module and mixed-frequency economic data processing module. The structure is shown in Figure 1.
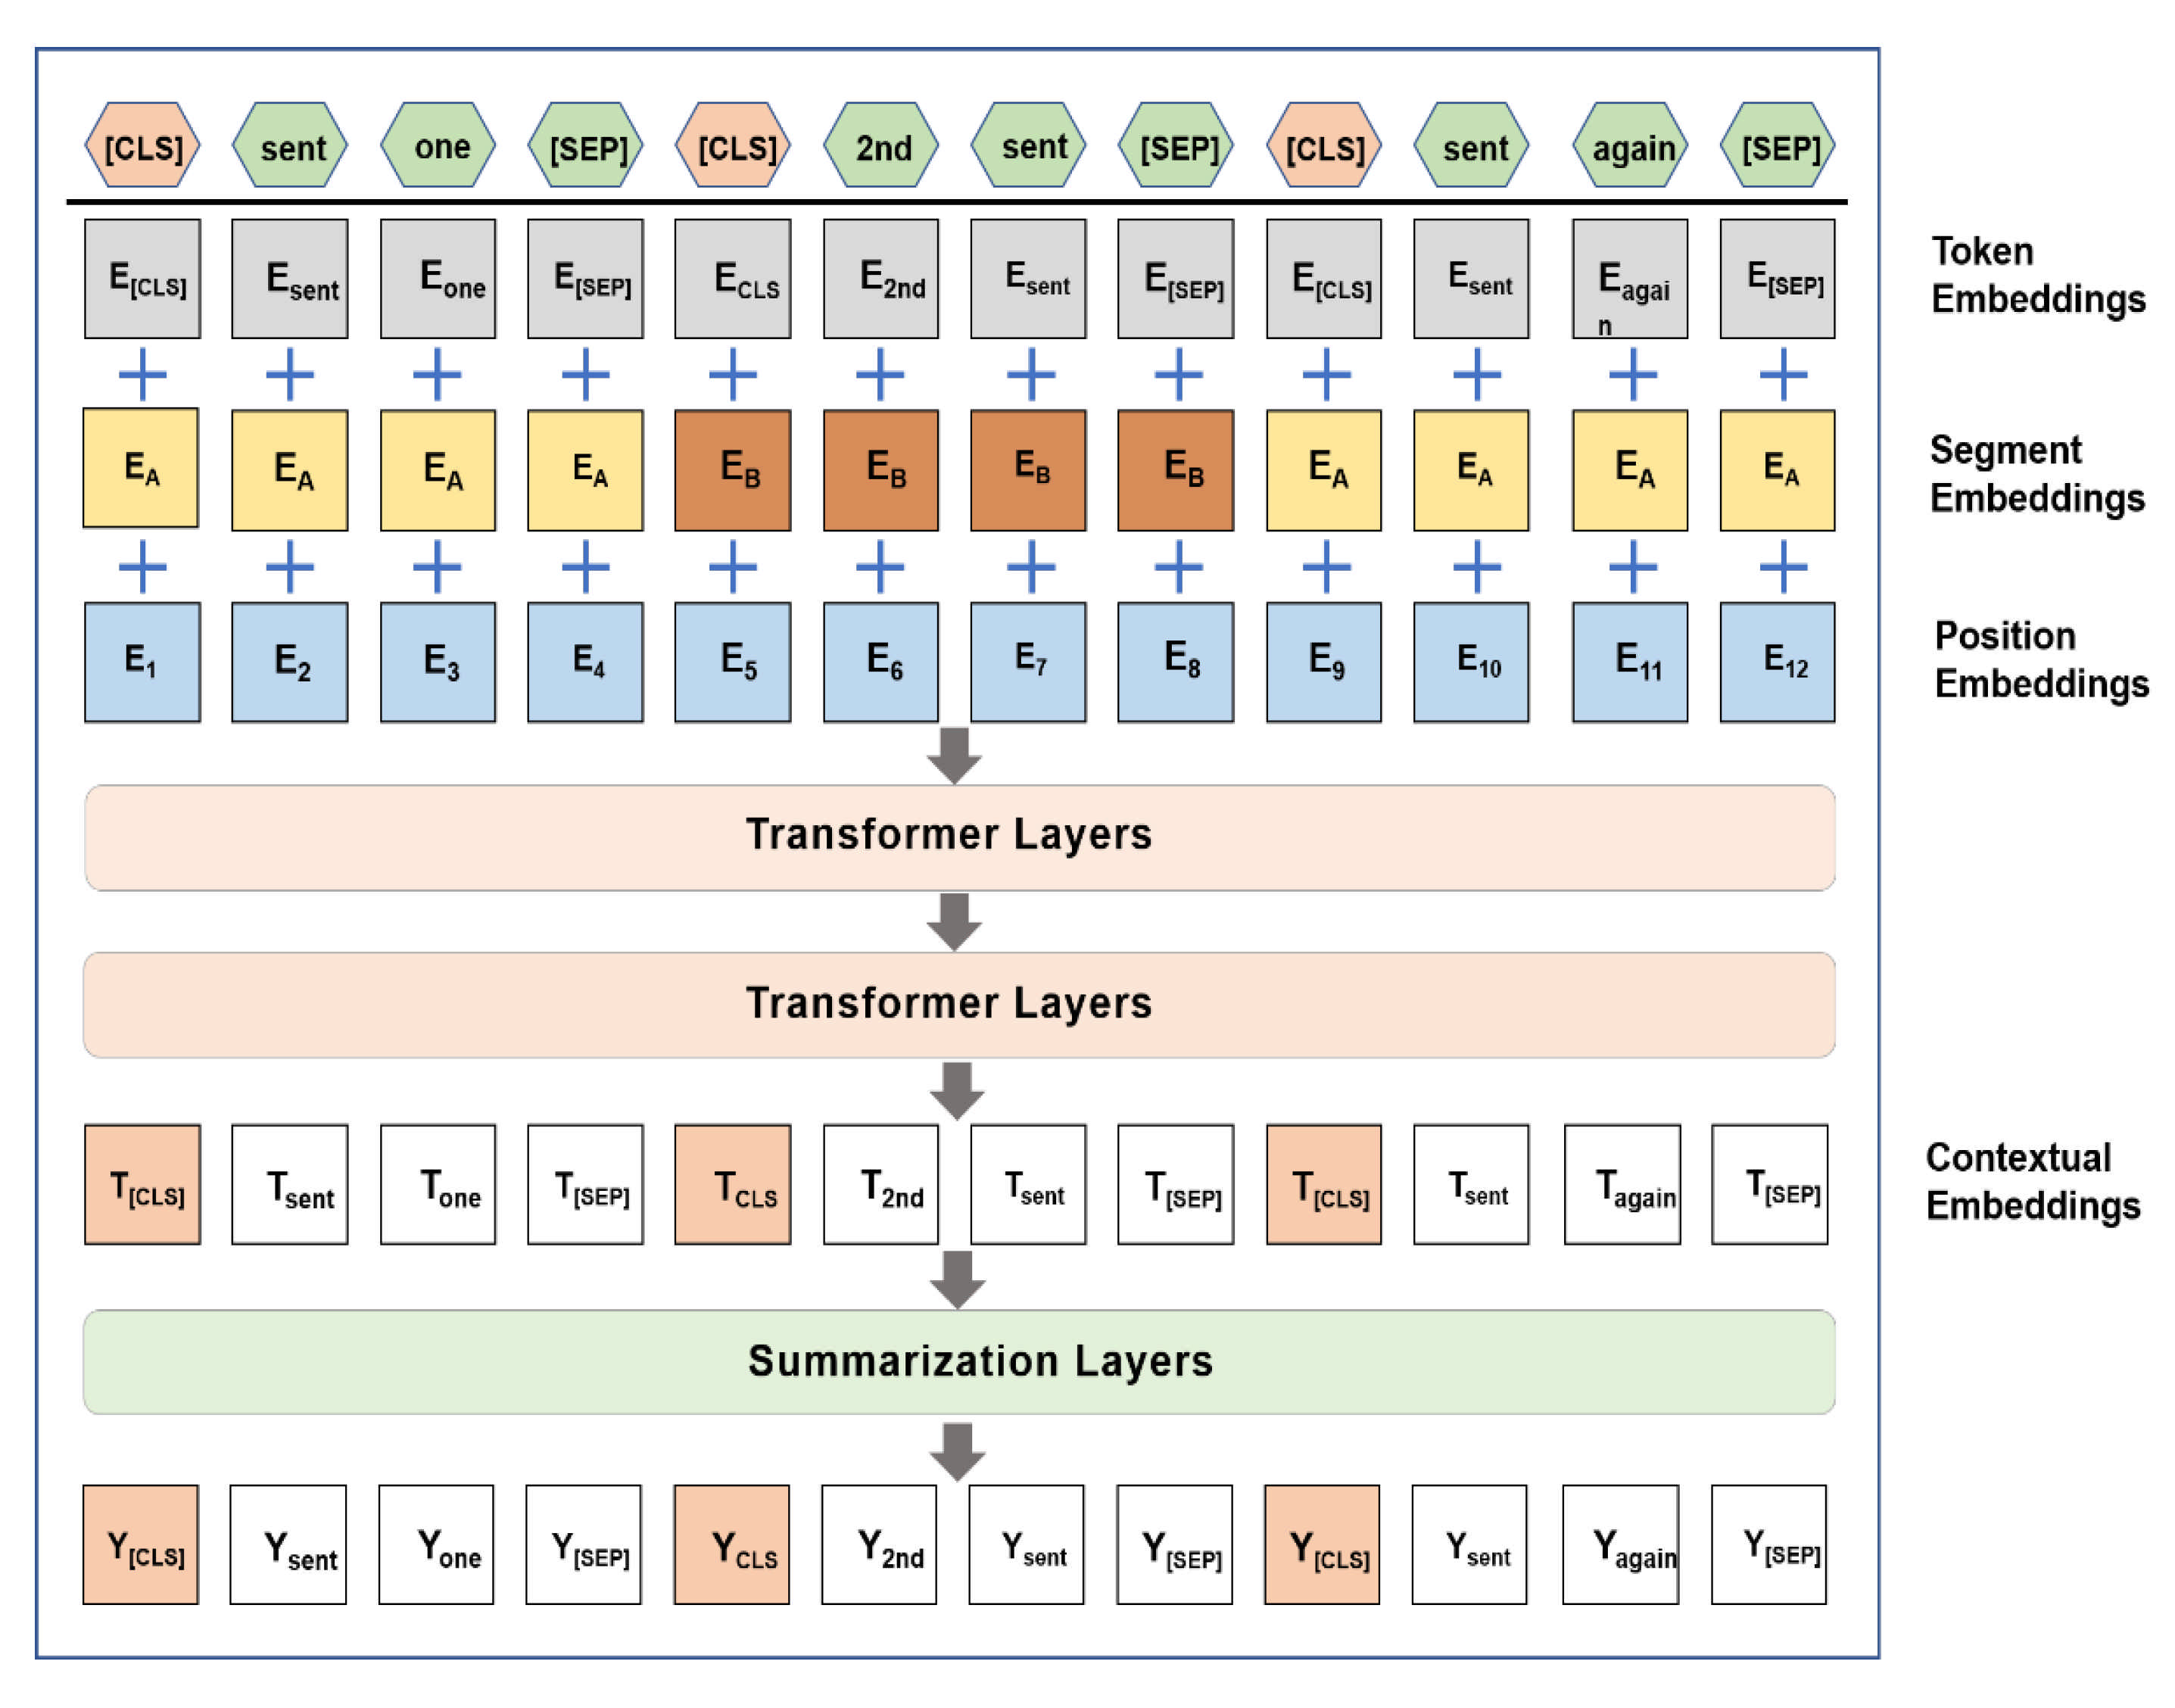
  • First, the policy text data is used as the input of the policy quantification module, which can extract a large amount of power policy text summaries through the automatic text summarization technology based on BERT. In addition, the power policy summary can be quantified based on Policy Modeling Consistency Index (PMC-Index) [23]. This method can summarize the main content of policy measures and improve the efficiency of policy quantification.
  • Second, the output of the policy quantification module (PMC-Index) and mixed frequency economic data are integrated. This step is to implement the joint processing of structured data and unstructured data.
  • Third, the fused data are utilized as the input of the mixed-frequency economic data processing module. The mixing economic data fusion modeling module mainly uses the masking layer of the Keras to cover and filter the vacancy time steps in the data. The masking layer can mask a sequence by using a mask value to skip timesteps. For each timestep in the input tensor, if all values in the input tensor at that timestep are equal to “mask value”, then the timestep will be masked (skipped) in all downstream layers. In addition, this module also uses the LSTM network to realize the automatic feature extraction of the mixed data and constructs the multi-input feature fusion model, which aims to cope with the issue that the data volume of medium- and long-term power consumption is not sufficient for deep network model training.

2.2. EPICS Framework: Policy Quantification Module

Before quantifying policies, a sufficient amount of policy data must be obtained and pre-processed. Electricity policy data usually exists in text, mainly including news information, policy reports, etc. These data can be obtained on government official websites and electric power portals through web crawler technology. However, there are many useless interfering texts in these data. It is challenged to extract useful information from the huge amount of text data by manpower alone. Therefore, it is necessary to use automatic text summarization technology to extract and refine the massive amount of power policy texts and summarize the main content of policy measures.
In order to pre-process of policy text, we propose a BERT-based abstract extraction model. Figure 2 illustrates the structure of the model. The input text is separated by two special symbols [CLS] and [SEP], where [CLS] is located at the beginning of the text, which means that the feature is used for classification models. For non-classification models. [SEP] means clause symbol, which is used to disconnect two sentences in the input corpus.
The processed input text is assigned to three kinds of embedding: token embeddings, segmentation embeddings, and position embeddings. The token embeddings are used to indicate the meaning of each tag. The segmentation embeddings are used to distinguish two sentences. The position embeddings are used to indicate the position of each tag in the text sequence. The input coding vector of BERT is the unit sum of the three embedded features.
Summarization Layers are used to process each sentence vector T i and calculate the gold label Y i of each sentence s e n t i . The loss of the whole model is the binary classification entropy of the yield Y ^ i and the gold label Y i [24]. The calculation process of Y ^ i is as follows:
h ˜ l = L N h l 1 + M H A t t h l 1 ,
h l = L N h ˜ l + F F N h ˜ l ,
where h 0 is equal to P os E m b T i , and T i is the sentence vector output by BERT. P os E m b is the function to add positional embeddings to T i . M H A t t is the Multi-Head Attention operation [25]. L N is the layer normalization operation. The superscript l indicates the depth of the stack layer. The final output still uses the S-type classifier:
Y ^ i = σ W 0 h i L + b 0 ,
where h 0 is the vector for s e n t i from the L - t h layer of the Transformer. W 0 is the weight, and b 0 is the bias.
After pre-processing the policy text through the above steps, we get the power policy summary. Next, a suitable model needs to be established to evaluate and quantify the policy summary. We propose a power policy quantitative model based on PMC-Index.
We establish 9 first-level variables and 33 second-level variables based on the specific characteristics of China’s power policy. The detailed variable design is shown in Table 1. See the Methods section for other calculation steps.
The calculation of the power PMC-Index includes the following steps:
  • Setting policy variables and parameters: We refer to Estrada’s setting of policy evaluation variables and combine the specific characteristics of China’s power policy to establish 9 primary variables and 33 secondary variables. The detailed variable design is shown in Table 1.
  • Establishing a multi-input-output table: Multi-input-output table is a data analysis framework that can store a large amount of data and measure a single variable in multiple dimensions. The multi-input-output table consists of primary variables and secondary variables. Primary variables have no fixed order and are independent of each other. Each primary variable can contain any number of secondary variables. All secondary variables under each primary variable have the same weight, and the value is always 0 or 1. This is because we are concerned about the impact of a policy in a specific field in the process of PMC index modeling.
  • Calculating PMC index: (I) Put 9 first-level variables and 33 second-level variables into the multi-input-output table. (II) Determine the value of second-level variables through text mining. As shown in Formula (4), each second-level variable obeys 0–1 distribution, which means that the value of the second-level variable can be 0 or 1. (III) Calculate the first-level variables according to Formula (5). (IV) Sum up the first-level index value of power policy to calculate PMC index, as shown in Formula (6):
    X t j B 0 ,   1 ,
    X t = j = 1 n X t j T X t j ,
    P M C = t = 1 m X t ,
    where X t j represents the first-level variable, X t represents the second-level variable, and T X t j represents the number of second-level variables.

2.3. EPICS Framework: Mixed-Frequency Economic Data Processing Module

The mixed-frequency economic data processing module of EPICS mainly includes several steps: mixing input, coverage and filtering, feature extraction, feature merging, and multi-layer perception. The mixed data, including the mixed-frequency economic data, the historical power consumption data, and the quantified policy data, are processed by the masking layer to mask missing data points, and they are then fed into the deep neural network for feature extraction. Finally, through the feature merging layer and perception layer, the monthly electricity consumption is predicted.
Macroeconomic indicators of different frequencies contain different characteristic information. Among them, the high-frequency monthly economic data can reflect the short-term fluctuations of the economic market to a certain extent. The low-frequency quarterly annual data is not as real-time as the monthly data due to the long accounting period. However, it is of great significance to accurately describe the long-term trend and overall situation of regional economic operations. The extensive use of regional long-term and short-term economic data for power consumption forecasting modeling helps establish a more comprehensive model of the relationship between economic factors and power consumption.
Low-frequency data in mixed frequency data can be regarded as high-frequency data with missing values. The problem of missing low-frequency data caused by frequency mixing is an inherent characteristic of macroeconomic data and cannot be directly filled by traditional interpolation methods. Traditional econometric models often turn high-frequency data into low-frequency data through accumulation or turn low-frequency data into high-frequency data through interpolation. Then model the economic data of a single frequency. However, this kind of processing method will change the original data, resulting in the loss of important information.
Referring to the network [26] of the multi-input fusion model, we let the mixed data pass the Masking layer to achieve coverage of the vacant time steps. Then let them enter the deep learning network to realize the automatic feature extraction of different frequency economic data. Finally, let the data pass the feature merging layer and the perception layer to realize the prediction of monthly electricity consumption. In order to couple multiple time series information, all variables at any time are concatenated into a vector representation to form a new time series, as shown in the following formula.
X = x 1 , x 2 , , x n = x 1 , x 2 , , x T T T × n ,
x k = x 1 k , x 2 k , , x T k T T ,
x t = x t 1 , x t 2 , , x t n = x 1 , x 2 , , x T T n .
In the above formula, T is the time window size; n is the number of influencing factor variables, in this article n = 53 ; x k is the numerical sequence of the k - t h variable at time T ; and x t is the set of n variable values at time t .

2.4. Electricity Consumption Forecasting Methods Considering Economic and Policy Factors

The mixed-frequency economic data processing module contains a medium- and long-term electricity consumption forecasting model. Next, we will introduce the construction of the forecasting model. The basic idea to construct a medium- and long-term load forecasting model considering economic and policy factors is to use PMC index and mixed frequency economic data as the input of the LSTM electricity consumption forecasting model. At present, the LSTM model is mainly used for short-term forecasting with relatively sufficient data volume and has achieved high forecasting accuracy. However, its application on medium- and long-term forecasting is less due to insufficient data [27]. In order to solve the problem that historical data for medium- and long-term electricity consumption forecasts is insufficient, we used the electricity economic data from 30 provinces in China to achieve data enhancement.
Medium- and long-term electricity consumption is affected by many factors. In order to couple multiple time series information, we concatenate variables at different times into a vector representation.
Considering that the influence of economic and policy factors on medium- and long-term electricity consumption is delayed, we select the historical economic and policy data X and electricity consumption data Y in the previous 24 months as eigenvectors to predict the next monthly electricity value Y T + 1 . The model is a multivariate forecasting problem, and its mathematical expression is:
Y = y 1 , y 2 , , y T T T ,
y ^ T + 1 = F y 1 , , y T , x 1 , , x T ,
In the above formula, T is the time window size. F is the model mapping function, which is the nonlinear mapping relationship to be learned in this article.
In order to reduce the error brought by the Spring Festival to the electricity consumption forecast, we first isolate the Spring Festival effect component in the electricity consumption sequence. Then, we use the X-12-ARIMA seasonal adjustment algorithm to decompose the remaining amount into long-term trend components, seasonal components and irregular components. Finally, we use the model proposed in this article to predict each component separately and sum them up to get the final prediction result. This method can further improve the learning effect of the model.

3. Results

3.1. EPICS Policy Quantitative Results

The policy text data used in this article is obtained from the official websites of China State Grid Corporation of China and China Electricity Council through web crawler technology. We label the original data manually to get the power policy data. In order to construct the original policy text as a data set suitable for the BERT-based abstract extraction model, we use CoreNLP [28] to segment sentences and pre-process the data set according to the method of See et al. [29].
In order to effectively evaluate the effectiveness of the EPICS on the task of extracting power policy abstracts, this article uses the general index ROUGE [30] in the field of automatic text summarization to automatically evaluate the quality of abstracts. This index can count the basic units of overlap between the summary generated by the model and the artificial summary and objectively evaluate the quality of the summary generated by the model. In order to make a comparison, this experiment constructed an untrained Transformer model, LEAD model, and REFRESH model as baselines. Transformer baseline has six layers, a hidden size of 512 and a feedforward filter size of 2048. It uses the same architecture as BERT-based model but has fewer parameters and is randomly initialized. LEAD is a simple summary extraction model that uses the first three sentences of a document as a summary. REFRESH [31] is an abstraction system trained by global optimization of Rouge index through reinforcement learning. In this article, the word overlap ROUGE-1 is used to evaluate the power policy text abstract, and the extraction results of the summary on the power policy data set are shown in Table 2.
The results show that the BERT-based abstract extraction model proposed in this article has significant advantages over Transformer, LEAD, REFRESH, and other models and can improve the Rouge-1 evaluation index of the power policy text abstract extraction task by 1.5–3.4, which provides a reasonable basis for the following policy quantification.
After getting the summary of the policy text, we use word frequency analysis software ROSTCM6 to conduct data mining on the policy text. The software can retrieve the keywords related to the secondary variables in the multi-input-output table, assign values to the secondary variables according to the retrieval results, and, finally, calculate the PMC index values of each policy text.
In addition, we divided the obtained PMC index value into four grades according to the evaluation criteria proposed by Estrada [23]. If the PMC index is between 10 and 9, the policy text is “perfect”. If the PMC index is between 8.99 and 7, the policy text is “good”. If the PMC index is between 6.99 to 5, the policy text is “acceptable”. If the PMC index is between 4.99 and 0, the policy text is “bad”.
Table 3 shows the calculation results of the PMC index of the three policy texts, which are graded according to the policy scoring criteria. As is shown in Table 3, the PMC index of Paper-1 is 4.72, whose grade is “Bad”. Its scores of X7 and X8 are low, indicating that the policy’s focus is not clear, and the content is not rational. The PMC index of Paper-2 is 5.43, with a rating of “Acceptable”. Its scores of X7 and X8 are high, while scores of X1 and X2 are low, indicating that the policy is reasonable but ineffective. The PMC index of Paper-3 is 5.21, with a rating of “Acceptable”. Its scores of X2 and X5 are low, while other first-level variable scores are moderate, indicating that the policy is less effective.

3.2. Mixed-Frequency Economic Data Processing Results

The economic data used in this article is selected from the economic power data of 30 provinces and cities in China from January 2007 to December 2019. Due to the large time span and wide spatial distribution of sample data, we set the ratio of the training set and test set to 8:2 according to the temporal and spatial factors. The types, quantity, and credibility of economic data have been effectively improved and standardized with the continuous improvement of the intelligence of data statistics. Considering that mid-to-long-term electricity consumption forecasting is a complex, multi-dimensional and non-linear problem, we should ensure the comprehensiveness and extensiveness of statistical indicators when selecting economic data. On the other hand, considering the replacement of different indicators and the differences between regions, we should ensure the time continuity and statistical adequacy of the selected economic data.
We introduce the three meteorological factors, temperature, air pressure, and humidity, to characterize the significant influence of meteorological factors on electricity consumption. We obtained a wide range of socio-economic data with various structures through open-source websites, such as the national or local statistical bureau. Then we built a database of macroeconomic meteorological indicators related to electricity demand based on the above principles. The database contains 52 indicators, including 19 monthly indicators, 10 quarterly indicators, and 23 annual indicators. See Table 4 for specific indicators.
A simple list of mixed-frequency economic data is shown in Table 5. Here, we only show the form of data organization in a certain region in a year. Due to large data volume, we do not show the specific values of 4680 rows and 52 columns. We simplify the representation of 19 columns of monthly data, 10 columns of quarterly data, and 23 columns of annual data. In addition, 0s in Table 5 represent the absence of data at those locations, and 1s represent the existence of data at those locations.

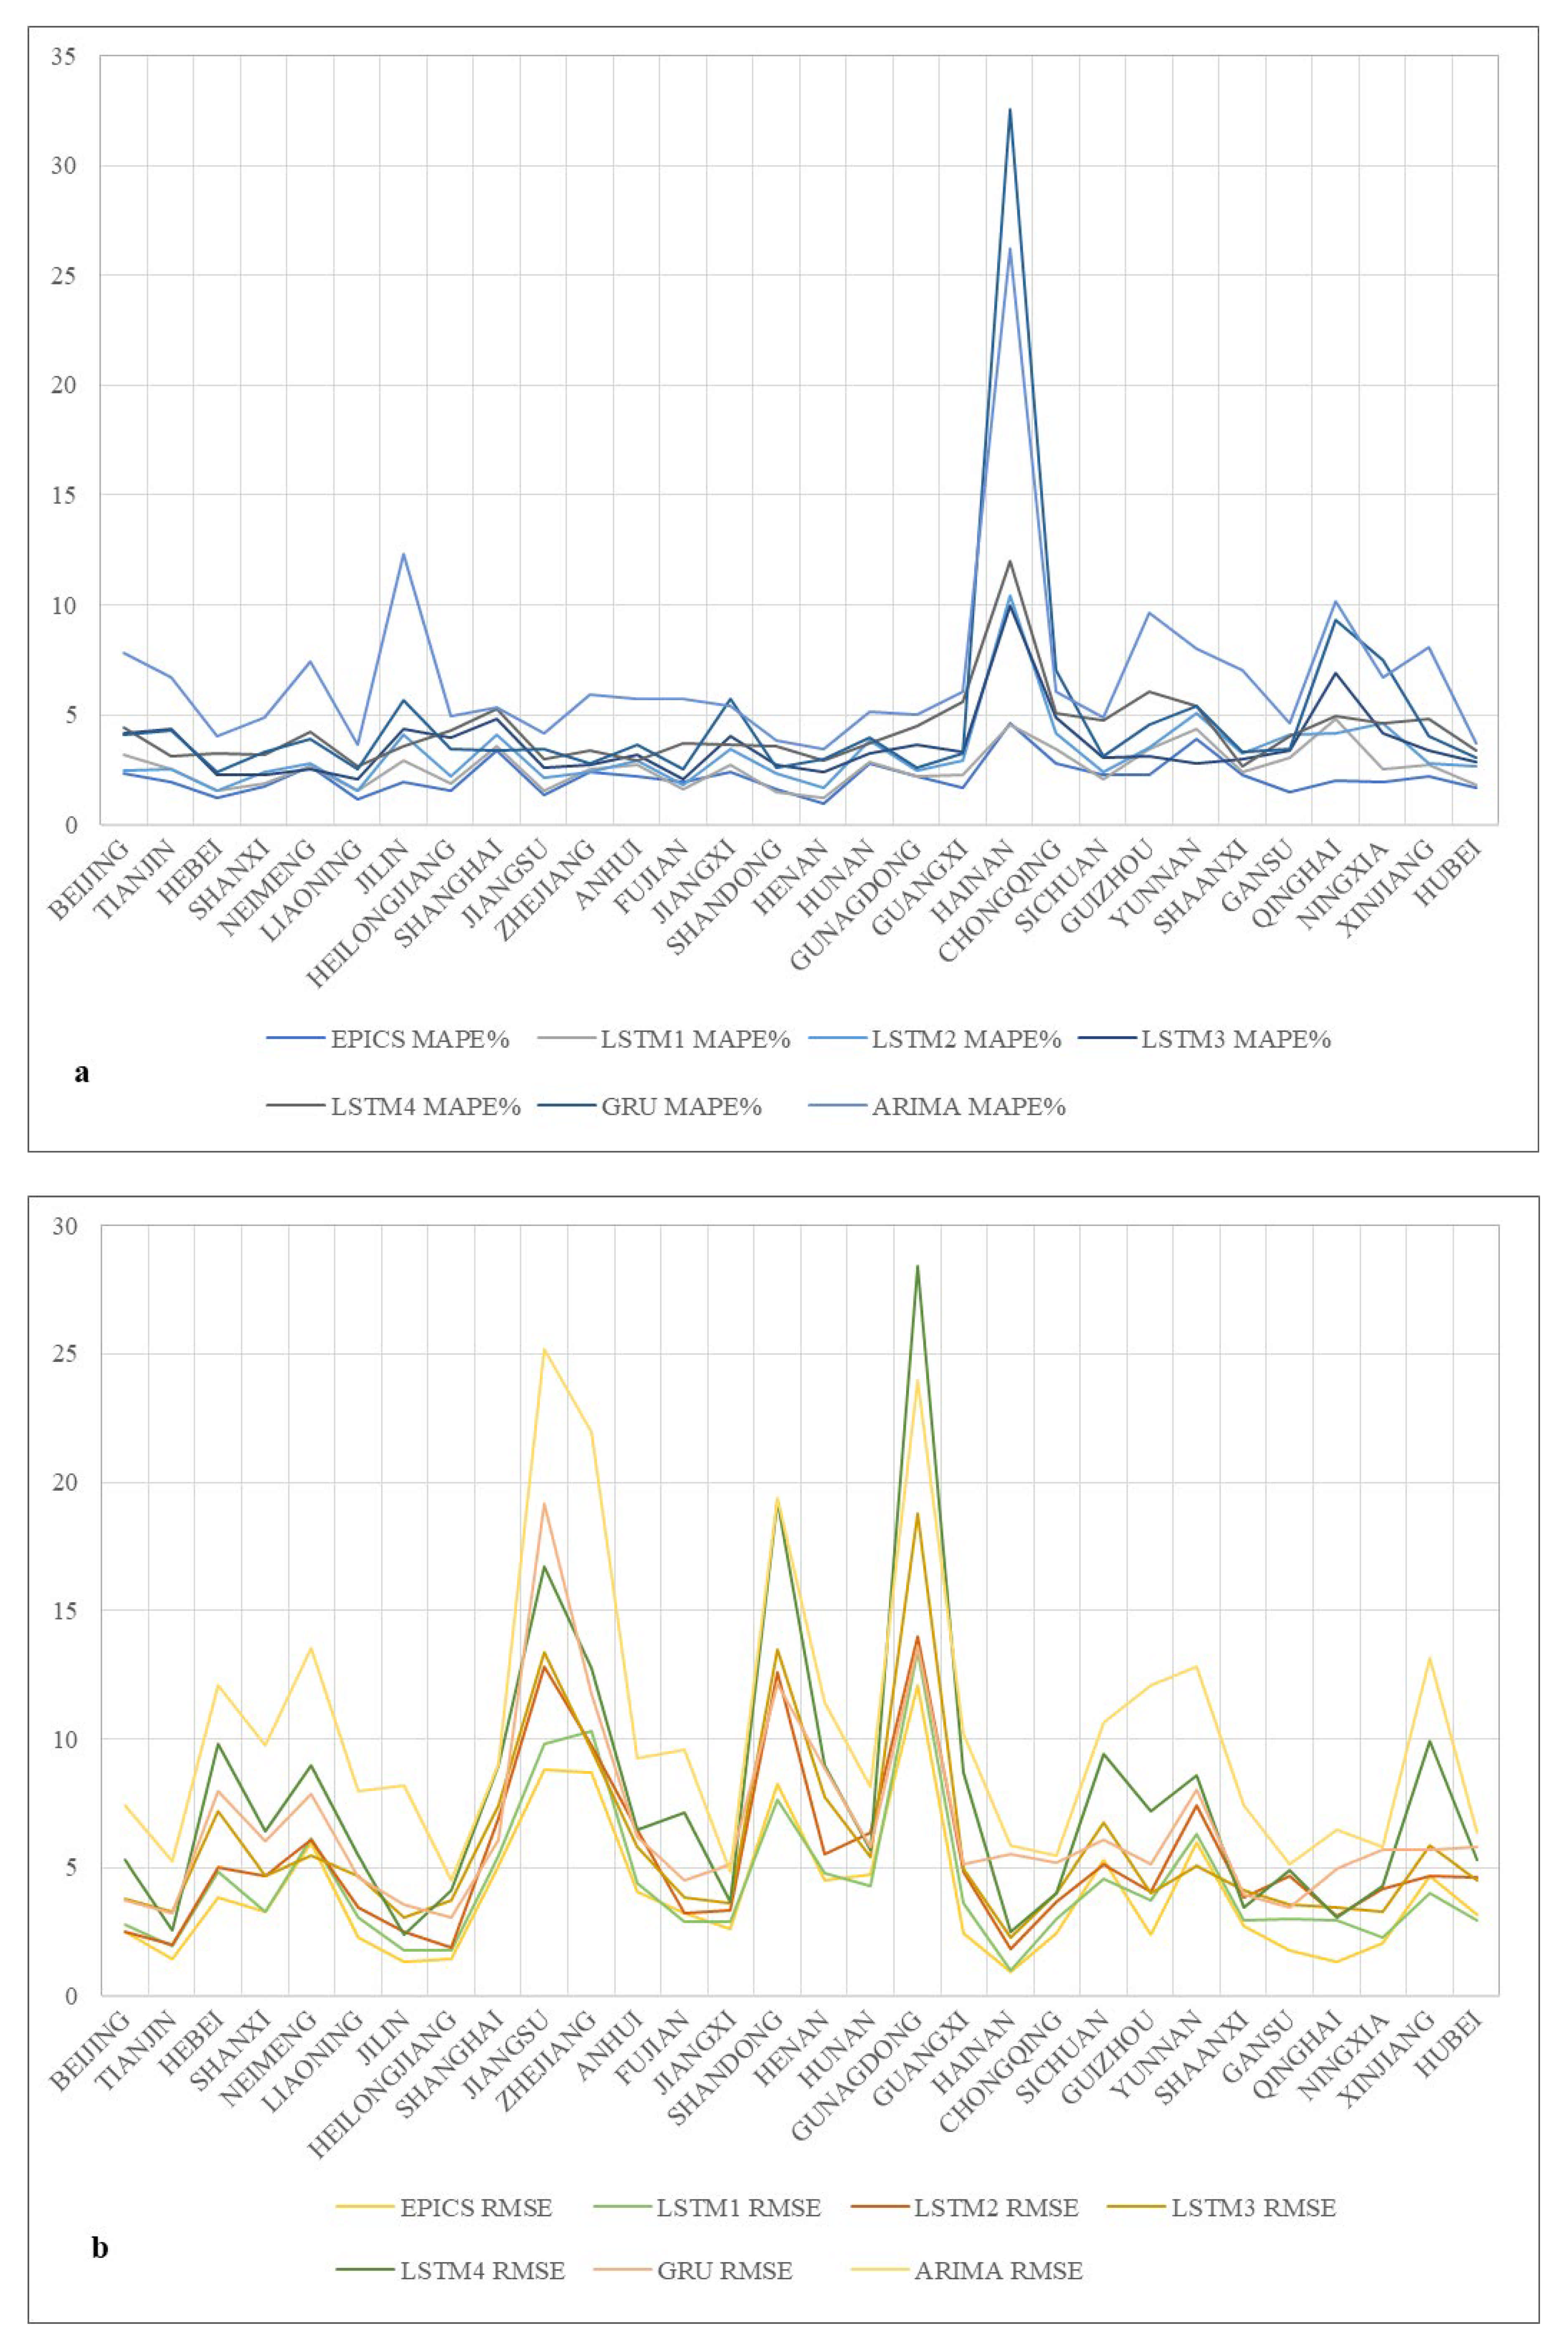
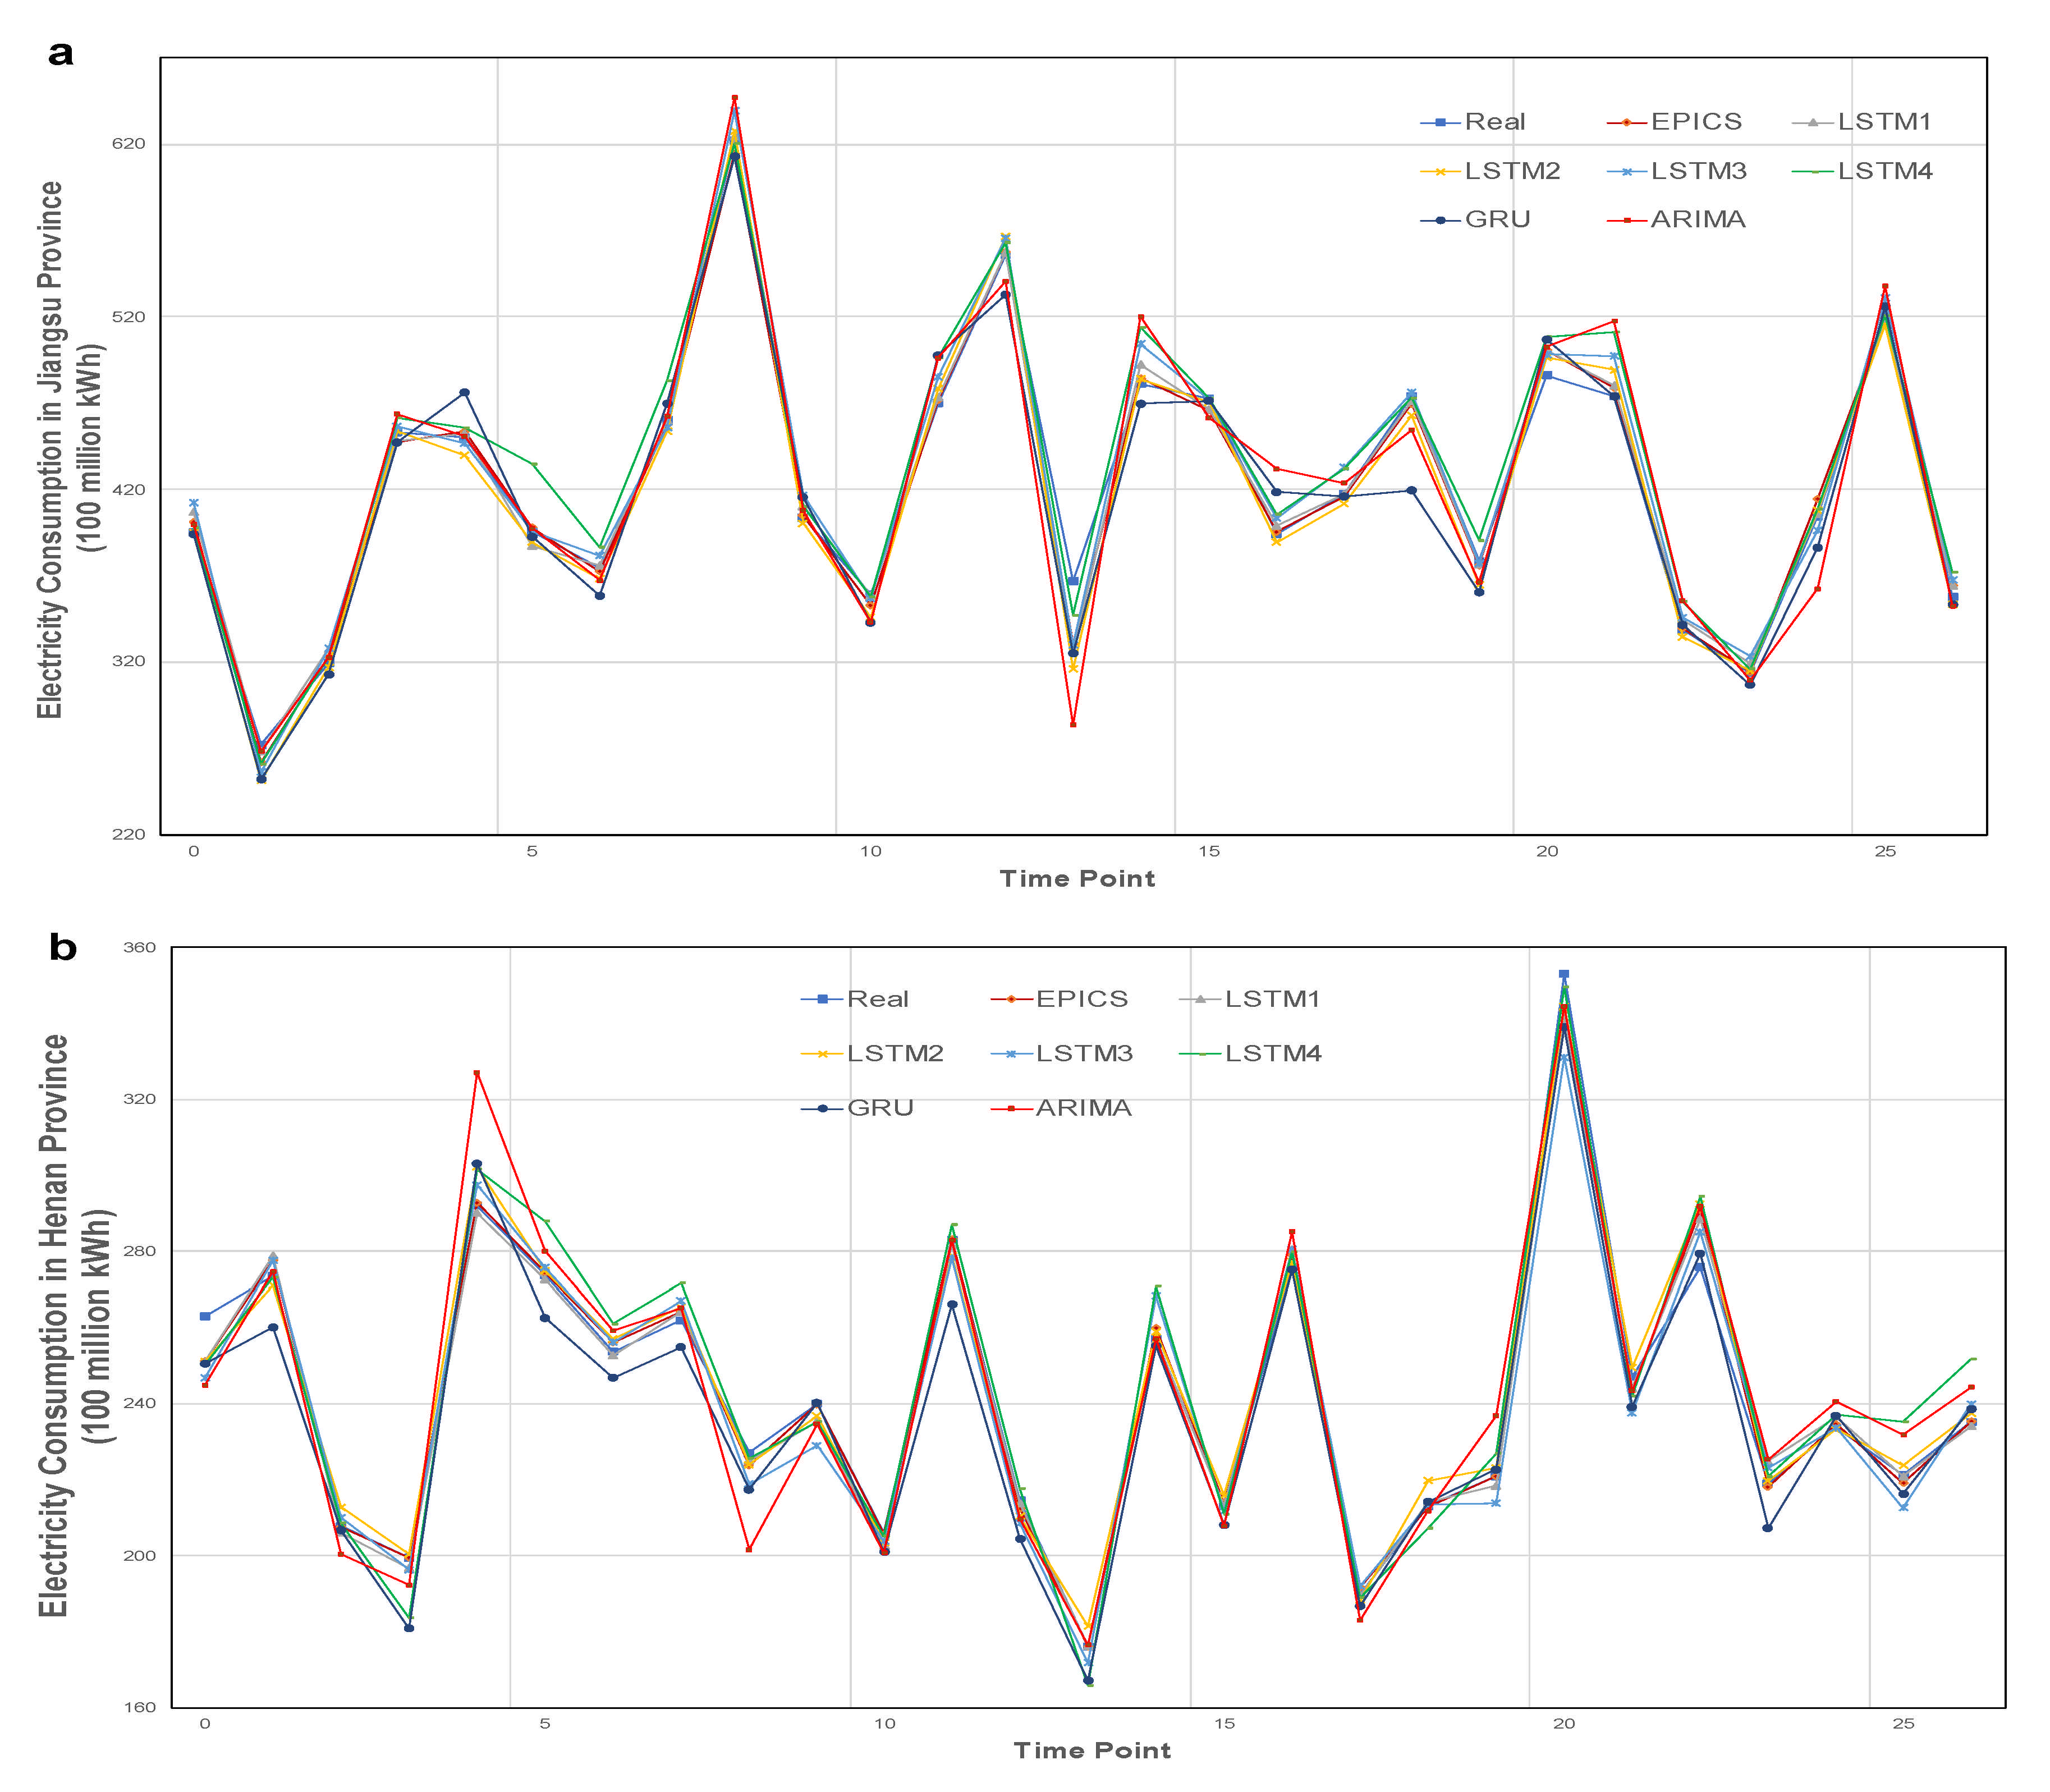
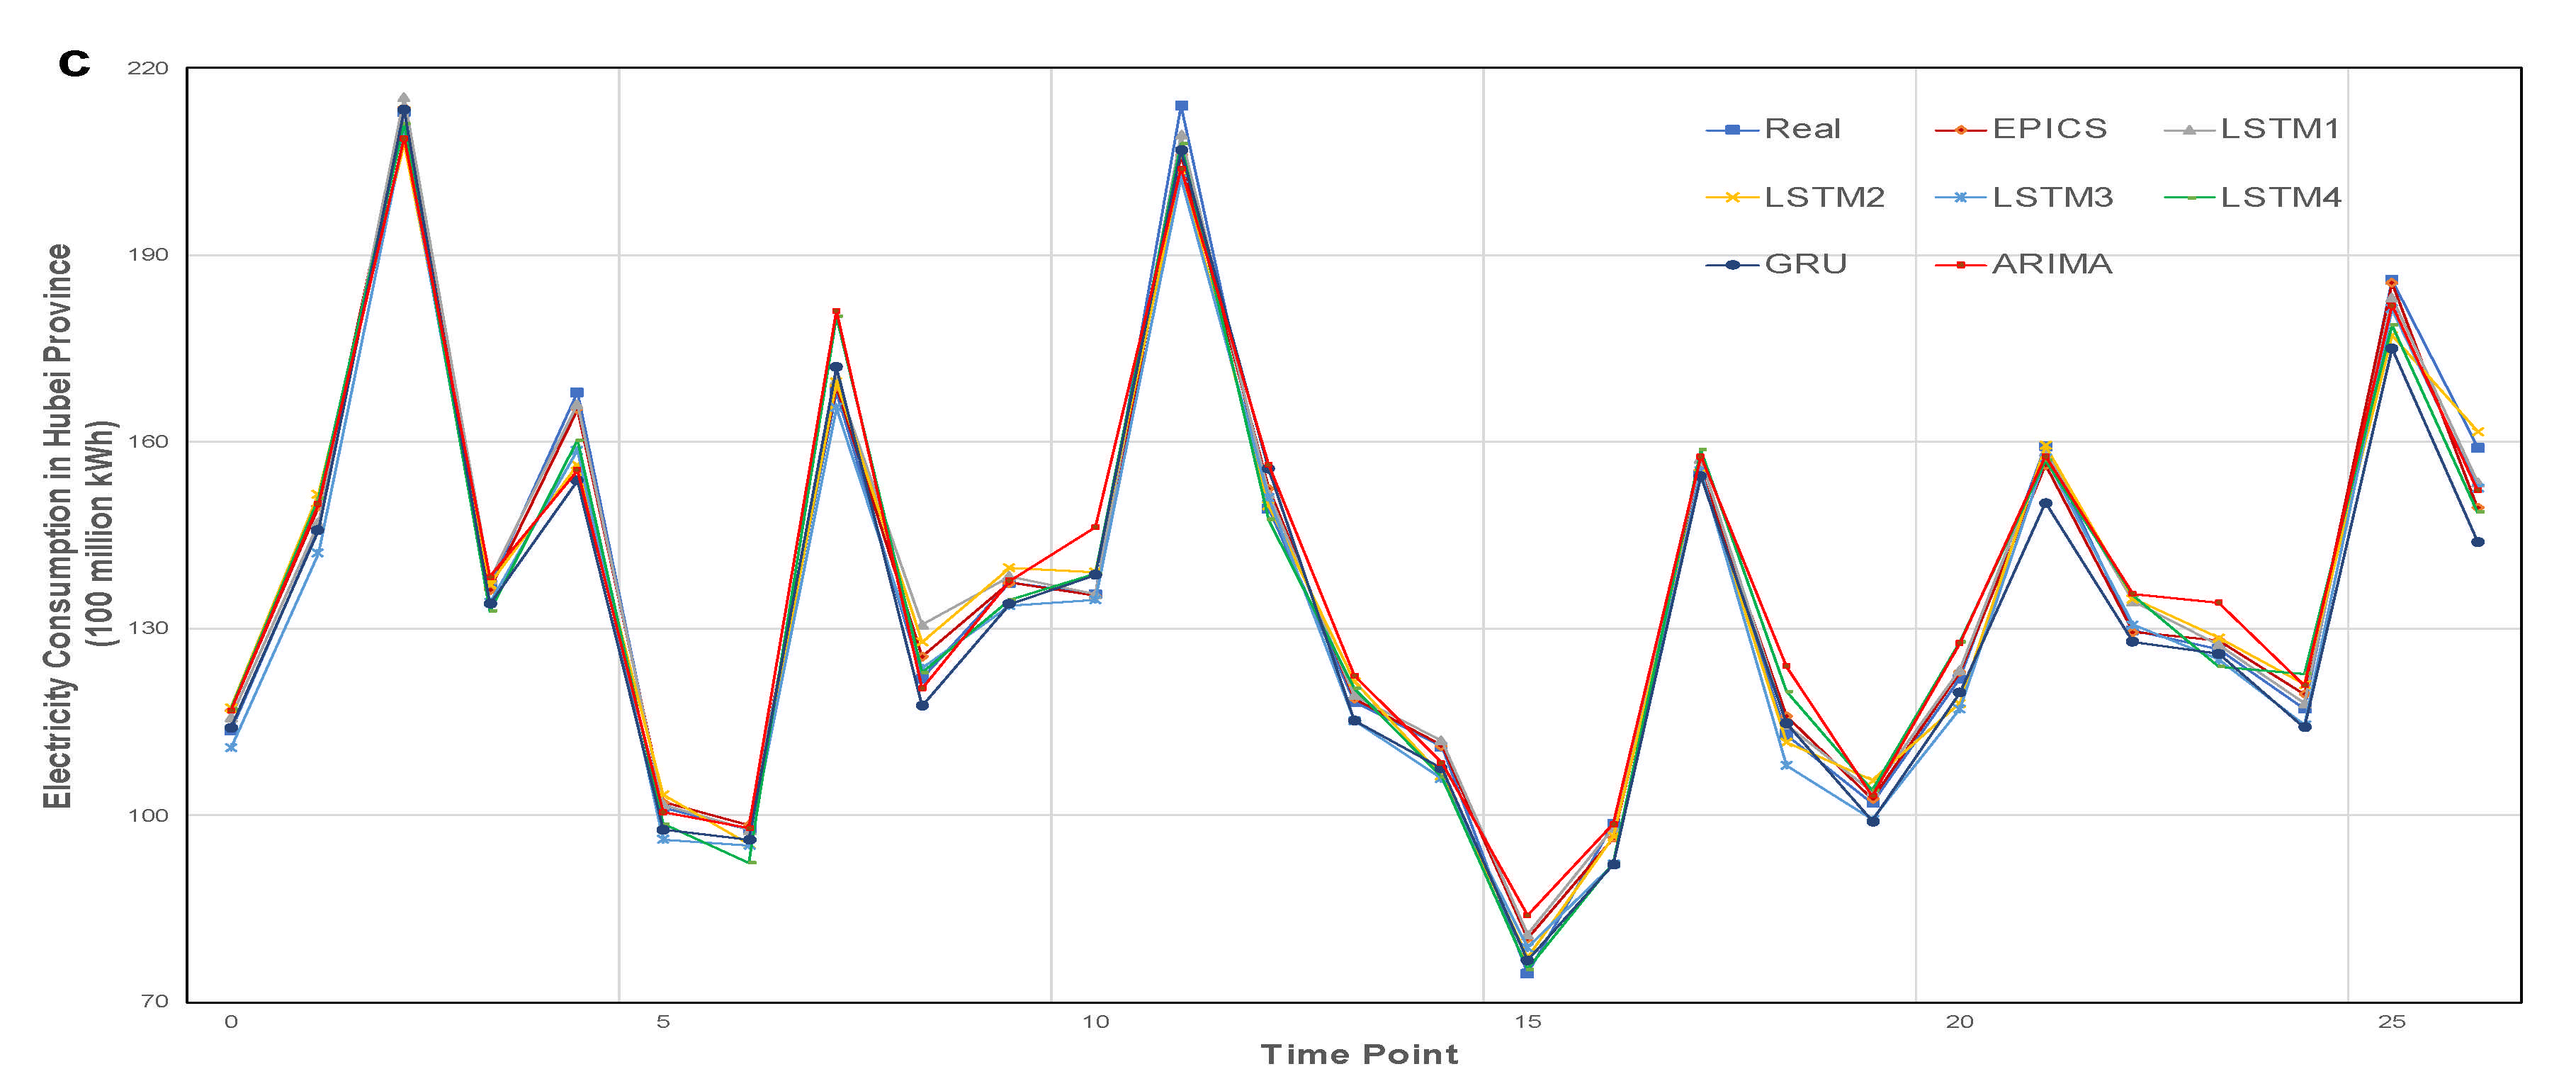
3.3. Electricity Consumption Forecast Results

In order to further verify the effectiveness of the EPICS framework, we input economic and policy data into LSTM power consumption prediction network and conduct control experiments in 30 provinces of China.
In the experiment, the EPICS method proposed in this article contains all the data: mixing economic data, policy quantitative data, and electricity consumption data. LSTM1 uses mixed-frequency economic data and electricity consumption, LSTM2 only uses mixed-frequency economic data, LSTM3 only uses monthly economic data, and LSTM4 only uses electricity consumption data. We also designed two traditional load forecasting methods as a comparison, in which the input of Gate Recurrent Unit (GRU) [32,33] network is electricity consumption data. The Autoregressive Integrated Moving Average (ARIMA) model predicts the power consumption components and then adds up to get the total power consumption, whose input is historical power consumption data.
In order to measure the model training results, we use MAPE and RMSE to evaluate the load forecasting results. The calculation Formulas are given by Formulas (12) and (13), where n represents the number of samples, y i represents the actual value of the training sample, and y ^ i represents the predicted value of the training sample.
M A P E = 1 n i = 1 n y i y ^ i y i × 100 % ,
R M S E = i = 1 n y i y ^ i 2 n .
Table 6 shows the prediction errors of the proposed method and the controlled experiment method in the medium- and long-term electricity consumption of 30 provinces and municipalities in China. Statistics show that the accuracy of the EPICS framework ranked first in 24 provinces and second in the remaining 6 provinces. In these 6 provinces, the gap between EPICS and the first-ranked model was very small. Specifically, the MAPE difference between the two was maintained at 0.2–0.3%, and the RMSE difference between the two was maintained at 0.3–0.6. Overall, the average prediction error of EPICS in 30 provinces in China was much lower than that of other models. The average MAPE of EPICS is 2.16%, and the average RMSE is 3.98. In order to show the generality of the EPICS algorithm in more detail, we show the line chart of prediction error of 7 algorithms in 30 provinces, as shown in Figure 3. It can be seen from the figure that the overall error of the EPICS algorithm is low, which shows that the EPICS method is effective with better performance in most regions.
Observing the prediction results of the control group LSTM1~4, it can be found that compared with LSTM4, which only uses electricity consumption as input to the LSTM network, the MAPE of LSTM3 drops on average by 0.69%, and the RMSE drops on average by 1.92. This is because LSTM3 adds monthly economic data as input, which shows that economic data has a significant improvement effect on electricity consumption forecasts. Compared with the LSTM3 model that only uses monthly economic data, the MAPE of LSTM2 is reduced by an average of 0.37%, and the RMSE is reduced by an average of 0.52. This is because LSTM2 adds quarterly and annual mixing data as input, which indicates that mixed-frequency economic data helps to improve the accuracy of electricity consumption forecasts.
Compared with the electricity consumption forecasting method GRU, the MAPE of the EPICS algorithm has dropped by 2.84%, on average, and the RMSE has dropped by 2.61, on average. Compared with the electricity consumption forecasting method ARIMA, the MAPE of the EPICS algorithm has dropped by 4.59%, on average, and the RMSE has dropped by 6.44, on average. This reflects the advantages of our model EPICS in learning complex nonlinear relationships and long-term dependencies.
Figure 4 shows the comparison between the predicted value and the true value of all methods in Jiangsu, Henan, and Hubei provinces. It can be seen from the figure that the traditional load forecasting methods ARIMA and GRU are not as effective as other models in fitting the trend of electricity consumption in the three provinces, and the error value even reaches 4 billion kWh at some points at some points. EPICS and LSTM1–5 have very close fitting effect on the trend of electricity consumption, but there are large deviations at some specific time points, such as 14 and 21 time points in Jiangsu Province, 4 and 25 time points in Henan Province, and 11 and 24 time points in Hubei Province. At these time points, the EPICS maintains a high prediction accuracy, which shows that policy data and mixed frequency economic data are helpful to improve the robustness of the system.

4. Conclusions

Most of the research on policy evaluation is based on qualitative research, and few people study policy quantification [34]. Objective evaluation of the implementation effect of energy industry policy is of great value for scientific policy-making [35]. Quantifying complex policy texts into specific influence indexes is an important method to reduce the subjectivity of policy evaluation, but its scientificity and rationality have always been suspected. This article verified the effectiveness of the method through scientific experiments. We use the PMC model to obtain the influence index of the policy text, and we then apply it to medium- to long-term electricity consumption forecasting scenarios to observe the effect of the model. The results of the experiment show that the PMC index is helpful to improve the accuracy of electricity consumption forecasting and objectively reflect the influence of the policy text to a certain extent.
Our study also shows that abundant mixing economic data information can not only solve the problem of lack of historical data for medium- and long-term electricity consumption forecasts but also effectively improve forecast accuracy. Traditional econometric models often turn high-frequency data into low-frequency data through accumulation, or turn low-frequency data into high-frequency data through interpolation and filling, and then use single-frequency economic data for modeling. However, such processing methods will change the original information of the data, leading to missing important information of the data or adding useless artificial information, which will increase the error of the prediction result and decrease the accuracy [36,37,38,39,40,41,42]. The economic data fusion input framework proposed by us can fully explore the complex relationship between electricity and economy. This has certain reference value for predicting the development trend of electricity consumption under the background of complex economic situation.
In the future, researchers can use more powerful semantic extraction models to implement generative text summaries and dig out more policy elements. It may improve the comprehensiveness of abstract extraction and the accuracy of policy quantification. At the same time, introducing more policy factors is expected to further enhance the model’s capability of understanding the impact of policy on social activities, such as power consumption, and improve the model’s information processing performance.

Author Contributions

Conceptualization, H.Z.; methodology, H.Z. and J.Z.; software, H.Z., H.Y. and C.H.; validation, H.Z. and H.Y.; resources, J.Y.; writing-original draft preparation, H.Z. and H.Y.; writing-review and editing, J.Z. and X.W.; supervision, J.Z. and T.G.; project administration, J.Z. All authors have read and agreed to the published version of the manuscript.

Funding

The work was funded by the National Key R&D Program of China (grant number 2018AAA0101504) and the Science and technology project of SGCC (State Grid Corporation of China): the fundamental theory of human-in-the-loop hybrid-augmented intelligence for power grid dispatch and control.

Data Availability Statement

The data presented in this study are available on request from the corresponding author.

Conflicts of Interest

The authors declare no conflict of interest.

Appendix A

Table A1. List of symbols used in this article.
SymbolExplanation
EPICSEconomy and Policy Incorporated Computing System
BERTBidirectional Encoder Representation from Transformers
GRUGate Recurrent Unit
LSTMLong-Short Term Memory
PMCPolicy Modeling Consistency
T i Sentence vector of i - t h sentence
Y i Gold label of i - t h sentence
s e n t i Each sentence of i - t h sentence
P os E m b T i Function to add positional embeddings, i represents the i - t h sentence
M H A t t Multi-Head Attention
L N Layer normalization

References

  1. Liu, K.; Subbarayan, S.; Shoults, R.R.; Manry, M.T.; Kwan, C.; Lewis, F.L.; Naccarino, J. Comparison of very short-term load forecasting techniques. IEEE Trans. Power Syst. 1996, 11, 877–882. [Google Scholar] [CrossRef]
  2. Tian, C.J.; Ma, J.; Zhang, C.H.; Zhan, P.P. A Deep Neural Network Model for Short-Term Load Forecast Based on Long Short-Term Memory Network and Convolutional Neural Network. Energies 2018, 11, 3493. [Google Scholar] [CrossRef] [Green Version]
  3. Barman, M.; Choudhury, N.B.D. A similarity based hybrid GWO-SVM method of power system load forecasting for regional special event days in anomalous load situations in Assam, India. Sustain. Cities Soc. 2020, 61, 102311. [Google Scholar] [CrossRef]
  4. Li, Y.Y.; Che, J.X.; Yang, Y.L. Subsampled support vector regression ensemble for short term electric load forecasting. Energy 2018, 164, 160–170. [Google Scholar] [CrossRef]
  5. Porumb, R.; Postolache, P.; Seritan, G.; Vatu, R.; Ceaki, O. Load profiles analysis for electricity market. Comput. Methods Soc. Sci. 2013, 1, 30. Available online: https://www.ceeol.com/search/article-detail?id=416789 (accessed on 15 September 2021).
  6. Hu, M.; Peng, Y.; Huang, Z.; Li, D. Retrieve, Read, Rerank: Towards End-to-End Multi-Document Reading Comprehension. arXiv 2019, arXiv:1906.04618. [Google Scholar]
  7. Zhao, L.N.; Zhou, Z.C.; Zhang, Y.P.; Wu, M.K. Study of applicability of the methods of medium and long term load forecasting in new economy normal state. Adv. Eng. Res. 2016, 115, 525–530. [Google Scholar]
  8. Chen, X.; Qiu, J.; Dong, Z.Y. An Improved Load Forecast Model Using Factor Analysis: An Australian Case Study. In Proceedings of the 2017 IEEE International Conference on Information and Automation (IEEE ICIA 2017), Macau SAR, China, 18–20 July 2017; pp. 903–908. [Google Scholar]
  9. Zhang, C.; Zhou, K.L.; Yang, S.L.; Shao, Z. On electricity consumption and economic growth in China. Renew. Sustain. Energy Rev. 2017, 76, 353–368. [Google Scholar] [CrossRef]
  10. Liu, D.; Ruan, L.; Liu, J.C.; Huan, H.; Zhang, G.W.; Feng, Y.; Li, Y. Electricity consumption and economic growth nexus in Beijing: A causal analysis of quarterly sectoral data. Renew. Sustain. Energy Rev. 2018, 82, 2498–2503. [Google Scholar] [CrossRef]
  11. Jiang, P.; Li, R.R.; Liu, N.N.; Gao, Y.Y. A novel composite electricity demand forecasting framework by data processing and optimized support vector machine. Appl. Energy 2020, 260, 114243. [Google Scholar] [CrossRef]
  12. He, Y.Y.; Qin, Y.; Wang, S.; Wang, X.; Wang, C. Electricity consumption probability density forecasting method based on LASSO-Quantile Regression Neural Network. Appl. Energy 2019, 233, 565–575. [Google Scholar] [CrossRef] [Green Version]
  13. Devlin, J.; Chang, M.-W.; Lee, K.; Toutanova, K. Bert: Pre-training of deep bidirectional transformers for language understanding. arXiv 2019, arXiv:1810.04805. [Google Scholar]
  14. Yalcinoz, T.; Eminoglu, U. Short term and medium term power distribution load forecasting by neural networks. Energy Convers. Manag. 2005, 46, 1393–1405. [Google Scholar] [CrossRef]
  15. Han, L.Y.; Peng, Y.X.; Li, Y.H.; Yong, B.B.; Zhou, Q.G.; Shu, L. Enhanced Deep Networks for short-Term and Medium-Term Load Forecasting. IEEE Access 2019, 7, 4045–4055. [Google Scholar] [CrossRef]
  16. Samuel, O.; Alzahrani, F.A.; Khan, R.J.U.; Farooq, H.; Shafiq, M.; Afzal, M.K.; Javaid, N. Towards Modified Entropy Mutual Information Feature Selection to Forecast Medium-Term Load Using a Deep Learning Model in Smart Homes. Entropy 2020, 22, 68. [Google Scholar] [CrossRef] [Green Version]
  17. Nalcaci, G.; Ozmen, A.; Weber, G.W. Long-term load forecasting: Models based on MARS, ANN and LR methods. Cent. Eur. J. Oper. Res. 2019, 27, 1033–1049. [Google Scholar] [CrossRef]
  18. Bouktif, S.; Fiaz, A.; Ouni, A.; Serhani, M.A. Single and Multi-Sequence Deep Learning Models for Short and Medium Term Electric Load Forecasting. Energies 2019, 12, 149. [Google Scholar] [CrossRef] [Green Version]
  19. Dagdougui, H.; Bagheri, F.; Le, H.; Dessaint, L. Neural network model for short-term and very-short-term load forecasting in district buildings. Energy Build. 2019, 203, 109408. [Google Scholar] [CrossRef]
  20. Hochreiter, S.; Schmidhuber, J. Long short-term memory. Neural Comput. 1997, 9, 1735–1780. [Google Scholar] [CrossRef] [PubMed]
  21. Liu, Y.; Hua, J.; Li, X.G.; Fu, T.; Wu, X.H. Chinese Syllable-to-Character Conversion with Recurrent Neural Network based Supervised Sequence Labelling. In Proceedings of the 2015 Asia-Pacific Signal and Information Processing Association Annual Summit and Conference (APSIPA), Hong Kong, China, 16–19 December 2015; pp. 350–353. [Google Scholar]
  22. Kim, M.; Choi, W.; Jeon, Y.; Liu, L. A Hybrid Neural Network Model for Power Demand Forecasting. Energies 2019, 12, 931. [Google Scholar] [CrossRef] [Green Version]
  23. Estrada, M.A.R. Policy modeling: Definition, classification and evaluation. J. Policy Model. 2011, 33, 523–536. [Google Scholar] [CrossRef]
  24. Liu, Y. Fine-Tune BERT for Extractive Summarization. arXiv 2019, arXiv:1903.10318. [Google Scholar]
  25. Vaswani, A.; Shazeer, N.; Parmar, N.; Uszkoreit, J.; Jones, L.; Gomez, A.N.; Kaiser, L.; Polosukhin, I. Attention Is All You Need. In Proceedings of the 31st Conference on Neural Information Processing Systems (NIPS 2017), Long Beach, CA, USA, 4–9 December 2017; Volume 30, pp. 5998–6008. [Google Scholar]
  26. Bai, Y.; Sun, Z.Z.; Zeng, B.; Deng, J.; Li, C.N. A multi-pattern deep fusion model for short-term bus passenger flow forecasting. Appl. Soft Comput. 2017, 58, 669–680. [Google Scholar] [CrossRef]
  27. Agrawal, R.K.; Muchahary, F.; Tripathi, M.M. Long Term Load Forecasting with Hourly Predictions based on Long-Short-Term-Memory Networks. In Proceedings of the 2018 IEEE Texas Power and Energy Conference (TPEC), College Station, TX, USA, 8–9 February 2018; pp. 1–6. [Google Scholar]
  28. Manning, C.D.; Surdeanu, M.; Bauer, J.; Finkel, J.; Bethard, S.J.; McClosky, D. The Stanford CoreNLP Natural Language Processing Toolkit. In Proceedings of the 52nd Annual Meeting of the Association for Computational Linguistics: System Demonstrations, Baltimore, MD, USA, 22–27 June 2014; pp. 55–60. [Google Scholar]
  29. Klein, G.; Kim, Y.; Deng, Y.T.; Senellart, J.; Rush, A.M. OpenNMT: Open-Source Toolkit for Neural Machine Translation. In Proceedings of the 55th Annual Meeting of the Association for Computational Linguistics (ACL 2017): System Demonstrations, Vancouver, BC, Canada, 30 July–4 August 2017; pp. 67–72. [Google Scholar]
  30. Lin, C.-Y. Rouge: A package for automatic evaluation of summaries. In Text Summarization Branches Out; Moens, M., Szpakowicz, S., Eds.; Association for Computational Linguistics: East Stroudsburg, PA, USA, 2004; pp. 74–81. [Google Scholar]
  31. Narayan, S.; Cohen, S.B.; Lapata, M. Ranking sentences for extractive summarization with reinforcement learning. arXiv 2018, arXiv:1802.08636. [Google Scholar]
  32. Kang, K.; Sun, H.B.; Zhang, C.K.; Brown, C. Short-term electrical load forecasting method based on stacked auto-encoding and GRU neural network. Evol. Intell. 2019, 12, 385–394. [Google Scholar]
  33. Sajjad, M.; Khan, Z.A.; Ullah, A.; Hussain, T.; Ullah, W.; Lee, M.Y.; Baik, S.W. A Novel CNN-GRU-Based Hybrid Approach for Short-Term Residential Load Forecasting. IEEE Access 2020, 8, 143759–143768. [Google Scholar] [CrossRef]
  34. Havas, A.; Schartinger, D.; Weber, M. The impact of foresight on innovation policy-making: Recent experiences and future perspectives. Res. Eval. 2010, 19, 91–104. [Google Scholar] [CrossRef]
  35. Vedung, E. Models of evaluation. In Public Policy and Program Evaluation; Evert, V., Ed.; Routledge: New York, NY, USA, 2017; pp. 101–115. [Google Scholar]
  36. Clements, M.P.; Galvão, A.B. Macroeconomic forecasting with mixed-frequency data: Forecasting output growth in the United States. J. Bus. Econ. Stat. 2008, 26, 546–554. [Google Scholar] [CrossRef]
  37. Kuzin, V.; Marcellino, M.; Schumacher, C. MIDAS vs. mixed-frequency VAR: Nowcasting GDP in the euro area. Int. J. Forecast. 2011, 27, 529–542. [Google Scholar] [CrossRef] [Green Version]
  38. Yan, W.H.; Cheng, L.; Yan, S.J.; Gao, W.; Gao, D.W.Z. Enabling and Evaluation of Inertial Control for PMSG-WTG Using Synchronverter With Multiple Virtual Rotating Masses in Microgrid. IEEE Trans. Sustain. Energy 2020, 11, 1078–1088. [Google Scholar] [CrossRef]
  39. Yan, W.H.; Wang, X.; Gao, W.; Gevorgian, V. Electro-mechanical Modeling of Wind Turbine and Energy Storage Systems with Enhanced Inertial Response. J. Mod. Power Syst. Clean Energy 2020, 8, 820–830. [Google Scholar] [CrossRef]
  40. Sbrana, G.; Silvestrini, A. Temporal aggregation of cyclical models with business cycle applications. Stat. Method Appl. 2012, 21, 93–107. [Google Scholar] [CrossRef]
  41. Angelini, E.; Henry, J.; Marcellino, M. Interpolation and backdating with a large information set. J. Econ. Dyn. Control. 2006, 30, 2693–2724. [Google Scholar] [CrossRef] [Green Version]
  42. Yang, S.C.; Kalnay, E.; Hunt, B.; Bowler, N.E. Weight interpolation for efficient data assimilation with the Local Ensemble Transform Kalman Filter. Q. J. R. Meteorol. Soc. 2009, 135, 251–262. [Google Scholar] [CrossRef]
Figure 1. Structure of EPICS. There are two inputs to the model: (a) policy text data and (b) mixed frequency economic data. The policy quantification module uses BERT-based automatic text summarization technology to refine many power policy texts. The mixed economic data processing module mainly uses the LSTM network to realize the automatic feature extraction of the mixed data and constructs the feature multi-input fusion model.
Sustainability 13 10473 g001
Figure 2. Summary extraction model based on BERT. The processed input text is assigned to three kinds of embedding: token embeddings, segmentation embeddings, and position embeddings. They pass through two transformer layers to become contextual embeddings.
Sustainability 13 10473 g002
Figure 3. Line chart of the errors of different algorithms in 30 provinces in China. (a) MAPE error values of different algorithms. (b) RMSE error values of different algorithms.
Sustainability 13 10473 g003
Figure 4. Comparison of electricity consumption forecasting results with different models. The comparison between the predicted value and the real value of our method and the control experiment in the three provinces. The predicted time length is 27 months. (a) The electricity consumption forecast results of Jiangsu Province. (b) The electricity consumption forecast results of Henan Province. (c) The electricity consumption forecast results of Hubei Province.
Sustainability 13 10473 g004aSustainability 13 10473 g004b
Table 1. China’s power policy evaluation variables.
Primary VariableSecondary Variable
(X1) Nature of policy(X1:1) Predicting
(X1:2) Proposal
(X1:3) Supervise
(X1:4) Support
(X1:5) Guide
(X2) Effect of policy(X2:1) Long term
(X2:2) Medium term
(X2:3) Short term
(X3) Incentives and constraints(X3:1) Governmental subsidies
(X3:2) Special fund
(X3:3) Laws and regulations
(X3:4) Talent incentive
(X4) Area of policy(X4:1) Economy
(X4:2) Society
(X4:3) Environment
(X4:4) Science
(X4:5) Technological
(X5) Level of policy(X5:1) National level
(X5:2) Provincial level
(X5:3) Local level
(X6) Recipients of policy(X6:1) Ministries
(X6:2) Provinces
(X6:3) Autonomous regions
(X6:4) State Grid
(X7) Focus of policy(X7:1) Energy prices
(X7:2) Energy investment
(X7:3) Environmental protection
(X7:4) Electric safety
(X7:5) Electric reform
(X7:6) Energy conservation
(X8) Evaluation of policy(X8:1) Well founded
(X8:2) Clear objectives
(X8:3) Scientific solution
(X8:4) Reasonable planning
(X9) Openness of policyNone
Table 2. Use ROUGE-1 to verify the abstract extraction capabilities of different models.
ModelROUGE-1
Lead31.3
REFRESH33.2
Transformer32.3
BERT-based34.7
Table 3. Calculate the PMC index of 3 policy texts and classify them.
Paper-1Paper-2Paper-3
(X1) Nature of policy0.40.20.4
(X2) Effect of policy0.670.330.33
(X3) Incentives and constraints0.50.50.5
(X4) Area of policy0.40.40.4
(X5) Level of policy0.670.670.33
(X6) Recipients of policy0.50.751.0
(X7) Focus of policy0.330.830.5
(X8) Evaluation of policy0.250.750.75
(X9) Openness of policy1.01.01.0
Total (PMC-Index)4.725.435.21
LevelBadAcceptableAcceptable
Table 4. Economic data of different frequencies obtained from open-source websites.
Index
Monthly dataYear, month, province information, consumer price index, commodity retail price index, power generation, real estate development investment, real estate development enterprise housing construction area, real estate development enterprise housing new construction area, real estate development enterprise housing completion area, general public budget income, financial institutions in foreign currency deposit balance, financial institutions in foreign currency loan balance, value of import, value of export, total value of export import and export, average temperature, average pressure, average relative humidity
Quarterly dataGDP, regional GDP index, total output value of construction industry, completed output value of construction industry, construction area of housing construction, newly started area, labor productivity calculated by total output value, per capita completed output value, completed area of housing construction, fixed asset investment price index
Annual dataGDP, GDP real growth index, per capita GDP, per capita GDP real growth index, added value of primary industry, added value of secondary industry, added value of tertiary industry, real growth index of added value of primary industry, real growth index of added value of secondary industry, real growth index of added value of tertiary industry, industrial added value, consumption level of residents, consumption level of urban residents, consumption level of rural residents, consumption level comparison between urban and rural areas, completed investment in fixed assets of the whole society, investment in fixed assets (excluding farmers), investment in fixed assets (excluding farmers), total retail value of social consumer goods, added value of construction enterprises, resident population, natural growth rate of resident population, total electricity consumption
Table 5. Simplified representation of mixed-frequency economic data.
MonthMonthly Data
(19 Columns)
Quarterly Data
(10 Columns)
Annual Data
(23 Columns)
Jan100
Feb100
Mar110
Apr100
May100
Jun110
Jul100
Aug100
Sep110
Oct100
Nov100
Dec111
Table 6. Electricity consumption prediction error of different models in 30 provinces of China in 27 months.
ProvinceEPICSLSTM1LSTM2LSTM3LSTM4GRUARIMA
MAPE%RMSEMAPE%RMSEMAPE%RMSEMAPE%RMSEMAPE%RMSEMAPE%RMSEMAPE%RMSE
Beijing2.322.503.152.802.452.484.143.774.415.314.073.737.817.39
Tianjin1.911.472.511.932.541.994.333.273.102.564.303.236.685.22
Hebei1.203.821.544.871.585.032.267.203.249.822.427.974.0212.07
Shanxi1.723.281.853.312.424.702.294.663.206.413.296.014.919.73
Neimeng2.675.972.696.112.786.092.545.434.248.993.907.877.4513.52
Liaoning1.152.291.563.061.573.462.084.702.655.462.514.603.637.96
Jilin1.971.332.951.784.082.504.363.063.562.415.683.5412.318.21
Heilongjiang1.571.421.891.802.191.883.933.764.314.133.463.044.954.52
Shanghai3.355.093.565.474.106.904.847.395.298.963.396.095.369.01
Jiangsu1.378.811.559.782.1512.802.5813.383.0016.723.4719.174.1425.17
Zhejiang2.388.692.5410.312.419.772.739.613.4012.742.8011.775.9421.97
Anhui2.174.082.704.402.936.483.185.822.896.453.636.185.729.23
Fujian1.973.221.632.911.823.222.063.843.717.152.564.505.759.61
Jiangxi2.392.612.712.913.463.374.003.633.663.675.735.135.384.85
Shandong1.648.231.467.622.3212.572.7513.503.5719.272.5912.143.8219.40
Henan0.994.521.254.771.665.532.397.732.938.962.978.843.4211.42
Hunan2.794.722.834.313.826.363.235.433.725.703.965.795.178.12
Guangdong2.2312.122.2213.422.4613.963.6118.754.4928.412.5713.625.0023.97
Guangxi1.692.432.253.622.934.833.344.935.638.673.285.126.0810.18
Hainan4.650.924.531.0310.441.839.962.3012.012.4832.585.5426.215.85
Chongqing2.782.473.473.014.193.674.894.005.104.037.045.186.065.44
Sichuan2.255.272.054.582.395.133.046.724.739.423.146.094.8710.63
Guizhou2.252.393.473.713.514.073.094.036.047.184.575.109.6512.08
Yunnan3.905.964.376.305.107.392.785.085.408.585.398.018.0012.82
Shaanxi2.282.712.392.953.243.843.014.102.663.453.283.967.017.42
Gansu1.501.763.063.004.084.703.353.554.034.933.433.474.615.15
Qinghai1.991.364.782.934.153.126.923.464.953.079.324.9810.206.46
Ningxia1.932.052.532.304.644.184.133.314.634.297.495.686.715.79
Xinjiang2.214.692.744.042.794.663.405.874.819.914.035.718.0613.16
Hubei1.683.191.792.972.654.652.864.523.385.313.045.783.726.34
AVERAGE2.163.982.604.403.235.373.605.894.297.815.006.596.7510.42
Publisher’s Note: MDPI stays neutral with regard to jurisdictional claims in published maps and institutional affiliations.

