Abstract
The transport sector has produced numerous carbon emissions in China, and it is important to promote low carbon commuting. As an emerging mode of urban low-carbon transportation in China, shared bicycles have been used by more and more citizens on a daily basis, with advantages of green and low-carbon emissions to environment, flexibility for short trips, and convenience for covering the distance between the normal low-carbon transportation and destinations. However, the imbalanced distribution of shared bicycles along subway lines, especially during the morning peak hours, has directly restricted their performance in urban traffic. In this paper, an integer linear program model (ILPM) is proposed to obtain an optimal low-carbon distribution plan of shared bicycles connecting with the subway line (SBCSL) during the morning peak hours. First, an objective function is built to improve the carbon emission reduction of SBCSL. Second, constraint functions are extracted considering the quantity of bicycles to be distributed to the subway line as well as the distribution limits of each subway station. At last, a case study is conducted on the distribution of shared bicycles in Beijing Subway Line 13 of China during the morning peak hours. The results show that the ILPM is of significance to provide optimal distribution scheme of shared bicycles in subway line with different station types including office-oriented, residential-oriented, and hybrid-oriented stations.
1. Introduction
Since the 1970s, global warming has gradually attracted the attention of the international community. One of the biggest causes of global climate change is anthropogenic greenhouse gas emissions. In order to cope with climate change, the Chinese government proposed to reach the peak of carbon dioxide emissions around 2030 and strive to achieve carbon neutrality by 2060. The transport sector produces numerous carbon emissions in China. The carbon emissions in China’s transportation sector have become the fastest growing field of greenhouse gas emissions. Urban low-carbon transport system (ULCTS) plays an important role in energy conservation and emission reduction.
China is suffering from the severe negative consequences of the high usage taxis and private cars in its large and densely populated cities [1]. As an emerging mode of ULCTS in China, shared bicycles could provide an eco-friendly alternative to taxis and private cars for short-distance trips in urban area. The widespread use of shared bicycles reduces energy consumption and exhaust emissions and also plays an active role in building a green trip system [2]. For example, from 1995 to 2017, the trips entering the New York Central Business District by sustainable mode increased by 32.4%, while the car and truck trips decreased by 22.5% during the same period [3]. Not only that, but shared bicycles can complement the rail transportation connection modes, which not only solve the short-distance trip problem of citizens [4] but effectively relieve traffic congestion.
In view of the advantages of low carbon and convenience, shared bicycles are becoming an essential mode of urban low-carbon transportation connecting with the subway and bus routes. The research shows that about 70% of users in Beijing chose shared bicycles and subways/buses to travel to their destinations, and most of them took subway stations as the starting and ending points of cycling [5]. However, in recent years, there are some problems revealed in the supply and distribution of shared bicycles. For example, during the morning peak hours, excessive bicycles in stations with low demand will result in idle bicycles and lower cycle turnover and cause significant stress to urban governance [6,7]. If there is an insufficient number of shared bicycles, passengers from the subway exit need to transfer to other means of transportation to reach their destinations, which will aggravate the burden on the environment.
The unbalanced distribution of shared bicycles has affected the utilization of bicycles, created a series of resource and environmental problems [8,9]. As a result, it is particularly important to clarify the key elements that affect the distribution of shared bicycles connecting with the subway line (SBCSL) during the morning peak hours and formulate refined distribution strategies. The influence factors mainly involved user attributes, government policies, social economy, the ecological environment, etc. [10]. When it comes to the trip mode of shared bicycles connecting to the subway, subway line construction and surrounding construction were mainly focused on, while few referred to the combination of the two. In order to solve the combination problem of shared bicycles and subway lines, factors such as the demand and supply that affect the distribution of bicycles are considered in this paper, as well as the constraints of the subway lines and subway station capacity. An integer linear programming model (ILPM) is established to maximize carbon emission reduction of SBCSL during the morning peak hours. For one thing, it complements the research on the integration of shared bicycle trips to subways. For another, the refined distribution of shared bicycles can achieve resource savings and emission reduction while solving the problem of disorderly distribution in urban governance.
The rest of the paper is organized as follows: Section 2 summarizes the literature from three aspects of the research on carbon emissions from shared bicycles, the influence factors of shared bicycle distribution, and the distribution model of shared bicycles; Section 3 considers the factors that affect the distribution of shared bicycles, and constructs an ILPM aiming at maximizing carbon emission reduction of the bicycles during the morning peak hours on weekdays; Section 4 conducts a case study on the distribution of shared bicycles at the stations of Beijing subway Line 13 and discusses the results; and Section 5 summarizes the paper and suggests future research directions.
2. Literature Review
As a connection mode of urban transportation, shared bicycles have been studied from various levels and dimensions. This paper summarizes the research from three aspects: the research on carbon emissions from shared bicycles, the influence factors of shared bicycle distribution, and the distribution model of shared bicycles.
2.1. The Research on Carbon Emissions from Shared Bicycles
The detailed analyses of shared bicycles on energy saving and emission reduction were discussed by scholars. Chen et al. [11] aimed to use a life cycle carbon emission assessment to calculate an emission reduction threshold for the shared bicycle industry. The results showed that the whole lifecycle carbon footprint of one bike is 34.56 kg CO2. Zhang and Mi [12] used Mobike’s dataset to evaluate the environmental performance of shared bicycles, calculating that the adoption of a shared bicycle system in Shanghai decreased CO2 and NOX emissions from surface transport by 25,240 tonnes and 64 tonnes per year, respectively. D Almeida et al. [13] found that the use of shared bicycles is saving carbon dioxide equivalent emissions compared to the modes of transport by which its users previously travelled, but it is essential to optimize rebalancing operations and to manufacture bikes as close to the point of use as possible to further reduce carbon emissions. A multi-scenario mixed-integer linear programming model was proposed for optimal rebalancing by Zhang et al. [14], and the results obtained by the proposed method could reduce CO2 emissions by a further 6.4% and 4.4% compared with the results of previous methods. Zhang et al. [15] described the traffic demand as proportional to the carbon emission reduction potential of rail transit and proposed improving the utilization rate was the most effective way to achieve the goals of energy saving and emission reduction.
2.2. The Study on Influence Factors of Shared Bicycle Distribution
The factors that affect the decision making of shared bicycle distribution include demand factors, supply factors, and urban characteristics. Understanding these factors can help decision makers improve the operating efficiency of bicycle sharing systems [9].
The demand factors include the social and economic attributes and the development level around the station. In terms of the socioeconomic attributes, a higher population density has a positive impact on the outbound use of the bicycle sharing system in the morning, and a sufficient number of jobs promotes the inbound flow in the morning [16]. Li and Kamargianni [17] found that there was no significant correlation between the use of shared bicycles and gender, family income, or education level in developing countries. A survey taking Beijing as an example found that the distance between the residence and bus stop of the user is a key factor in the choice of bicycle trip mode, and the number of bus stops also plays a role [4]. During the operation of a new subway line in Nanchang, Yang et al. [18] found that the emergence of new subway stations encouraged cycling activities, and residents took shared bicycles connecting with the subway as the primary way of commuting. In addition, subway stations with a large number of passengers have greater potential demand for shared bicycles [19,20].
Supply factors include infrastructure construction, parking capacity and industry development. As we all know, while changing the choice of trip mode, shared bicycles also complement and influence other transportation modes [21]. The growing use of shared bicycles requires well-built cycling facilities as support; however, the lack of infrastructure will reduce the use of bicycles [22,23]. Moreover, diversified land use near the station, larger station capacity, and more shared bicycle parking spots have a positive impact on the trip demand [24,25].
The urban characteristics include urban natural factors and urban social factors. Among the urban natural conditions, weather and temperature have a statistical impact on riding, and people are less likely to use bicycles during rainy and humid periods [26]. As for urban social factors, the use of bicycles largely depends on different time features, among which the time of day and the day of the week are important factors [27].
In the research on the factors affecting the distribution of shared bicycles, scholars not only considered social, economic, and natural conditions but considered factors such as urban infrastructure and layout as well. Based on the summary of the literature, only by comprehensively considering various factors can we formulate a reasonable strategy for the distribution of shared bicycles.
2.3. The Study on the Distribution Model of Shared Bicycles
Based on the influence factors, operators can choose appropriate models to calculate the number of shared bicycles and distribute resources reasonably. In this part, the demand forecast, capacity distribution, and location layout of shared bicycles are summarized.
In the aspect of demand forecasting, forecasting models are set up based on user trip data, cycling history data, and other data. When predicting the number of bicycles required at a specific time, Sathishkumar et al. [28] used weather information and date data to forecast the hourly bicycle rental demand. Sohrabi et al. [29] considered time, weather, and infrastructure and established a generalized extreme value counting model, and the shared bicycle demand in the Washington-Arlington-Alexandria area proved the the model can optimize the rebalancing decision.
In terms of shared bicycle distribution capacity, the calculation method is quite innovative. Based on location-based social network data, the ordinary least square, geographically weighted regression (GWR), and semiparametric geographically weighted regression (SGWR) methods were used to estimate the number of shared bicycle trips [30]. Zhao et al. [31] used the Zero-inflated negative binomial model to estimate the redistribution count of shared bicycles, Yu et al. [32] used mobile phone data to identify the potential demand for shared bicycles, and Guidon et al. [33] used the reservation data of electric bicycles to estimate the demand for shared bicycles. Similarly, Hua et al. [34] estimated the parking demand of the bicycle sharing system with the trip data and calculated the distribution scale from the parking spaces.
When it comes to site selection and layout, the methods are diverse. On the basis of considering the cost and service level, Frade and Ribeiro [35] proposed a location optimization model and linked the determined sites with the demand estimated through the maximum coverage model. In order to solve the problem of dynamic bicycle relocation, Zhang et al. [36] took into account the prediction of user dissatisfaction, bicycle route selection and relocation, and established a spatiotemporal network flow model.
According to the above-mentioned studies, in the shared bicycle distribution model, the demand and supply are mainly calculated by relevant data, which provides a reference direction for this article to estimate the demand and supply of shared bicycles. The goal of distribution is focused on minimizing scheduling costs, maximizing service capabilities, environmental benefits, and social welfare, while there are fewer studies on resource utilization.
2.4. Literature Summary
By summarizing the studies on the carbon emissions from shared bicycles, the influence factors, and bicycle distribution models, it can be found that scholars have made some detailed analyses on whether shared bicycles can achieve energy saving and emission reductions and have discussed how to achieve such outcomes from different aspects. The studies on shared bicycles mostly focus on the socioeconomic factors and the built environment factors. In addition, there are few studies on the connection between shared bicycles and low-carbon transportation, such as bus routes and subway lines. Therefore, the distribution model of SBCSL is studied in the rest of the paper.
3. Optimal Model for Distribution of SBCSL
3.1. Problem Description
In the morning peak hours of weekdays, the subway is an important way for citizens to commute, and the distribution of shared bicycles at various subway stations not only affects the convenience of users but affects the goals of resource saving and emission reduction as well. Therefore, the distribution strategy of shared bicycles in different types of subway stations should be changed from the extensive to the more refined. The factors affecting the distribution of shared bicycles include natural environmental conditions, industry development status, delivery environment, policy preferences, the level of transportation development, infrastructure construction, and user trip choices. In view of the characteristics of influence factors and the availability of data, this paper considers the demand elements and supply constraints, and constructs a distribution model of shared bicycles to solve the problem of unbalanced distribution of SBCSL and achieve the carbon emission reduction.
The assumptions for the optimization model of shared bicycles distribution are as follows:
- Choose a working day when weather, temperature, wind direction, and air quality are suitable for passengers to ride and there are no major incidents.
- Assume that the demand for bicycles at a station is not affected by other stations or lines. The passengers’ borrowing behavior only occurs in the cycling buffer area around the subway station without considering the impact of stations on other lines within the service area of the SBCSL.
- Passengers within the service area of the station only choose bicycles or buses. In the morning peak hours, passengers within the service area of the SBCSL only choose the bus, public bicycle, or shared bicycle without considering walking.
- Passengers follow the proximity principle to select stations. When there is a crossover in service area between stations, each demand point is only covered by the nearest subway station.
- Assume that carbon emission reduction only considers the replacement of shared bicycles for taxis and private cars and does not consider the replacement of buses.
According to the types of buildings around the station, subway stations are divided into residential-oriented stations, office-oriented stations, and hybrid-oriented stations [5], the passenger flow of these subway stations have different effects on the flow of shared bicycles during the morning peak hours, as shown in Table 1.

Table 1.
Station type, coverage area, and features.
In order to explain the distribution model of shared bicycles, Table 2 shows the symbols of the variables and parameters.
Table 2.
Variables and parameters.
3.2. Objective Function of SBCSL
The motivation is the subjective factors that affect the distribution of shared bicycles, including economic goals, environmental goals, and resource utilization goals. The purpose of environmental goals is to encourage the public to use shared bicycles so as to speed up bicycle turnover and increase carbon emission reduction. The objective function Equation (1) maximizes the carbon emission reduction of shared bicycles distributed on subway lines. Cem,re is the carbon emission reduction factor, wi is the utility coefficient of the station, and qi is the number of shared bicycles put into the station. Equations (1) and (2) are expressed as follows:
The utility coefficient is the ratio of the potential demand of shared bicycles to the bicycles supply in the subway station, reflecting the efficiency of the use of bicycles. Improving the utilization rate is the most effective way to achieve the goals of carbon emission reduction [5]. The higher the bicycles meet the potential needs, the greater the utilization rate, and the greater the carbon emission reduction.
Equation (3) is the calculation method of the utility coefficient, where Di is the potential demand for shared bicycles at station i and Si is the supply of shared bicycles at subway station i during the morning peak hours of weekdays [24].
Demand elements include socioeconomic attributes, surrounding land use, and construction around stations, as shown in Table 3. Socioeconomic attributes refer to the density of the regional population, the land use index is the construction area of the demand station, and the built indicator around the station is the number of low-carbon transport stations.
Table 3.
Demand elements and description.
In addition, the service area of the SBCSL is determined as a circular area with a radius of 500 m to 2 km centering on subway stations [38,39]. The walking distance for outbound passengers is 500 m, that is, the cycling buffer zone is 500 m. Exits at subway station are used to represent bicycle parking spots in the cycling buffer.
The demand points for shared bicycles are companies, office buildings, hospitals, and high schools within the service area of the SBCSL [31,40]. Equation (4) considers user attributes, characteristics of demand points, and types of subway stations, where di is the regional population density [24], si is the total area of the demand point, and αi is the morning peak outbound hour coefficient [17]. The number of potential users of the station is calculated by multiplying di and si.
Equation (5) is the formula of sharing rate of SBCSL, where qsi and qbi are the number of shared bicycle parking spots and low-carbon transportation stations, respectively [5].
The actual number of bicycles supplied by subway stations and the proportion of shared bicycles are as follows:
Equations (6) and (7) are formulas for the number of shared bicycles supplied by the station and the per capita share of bicycles in the city. θ is the per capita ownership rate of shared bicycles, R is the number of permanent residents in cities and towns, and Q is the total number of shared bicycles in the city.
3.3. Distribution Quantity Constraints of SBCSL
3.3.1. Line Distribution Constraint
Formula (8) is the constraint on the number of bicycles on the subway line. Taking into account the supply capacity, the regional distribution ratio, and the social benefits of the distribution strategy, there is a maximum limit on the total amount of shared bicycles in a certain area, expressed as follows:
Equation (9) is the total number of shared bicycles placed in the line. Among them, μ is the proportion of residents’ commuting trip, λ is the proportion of shared bicycles in the service area of the subway station, and fj is the average passenger flow of the line from Monday to Friday. It is calculated as follows:
3.3.2. Constraint of the Maximum Distribution Quantity at Station
Formula (10) is the upper limit distribution constraint on the station. When placing shared bicycles, taking into account the land, facility conditions, and parking regulations, there is a highest distribution quantity constraint:
Supply elements include parking capacity and road conditions, as shown in Table 4. Parking capacity refers to the number of parking spots, and the road conditions include length of parking section and the construction of bike lanes.
Table 4.
Supply elements and description.
Equation (11) is the formula for the maximum bicycle distribution at the station. Ei is the number of exits of the subway station [41], l is the longest distance to park shared bicycles [24], β is the turnover rate of shared bicycles [42], and b is the space width required for parking shared bicycles:
3.3.3. Constraint of the Minimum Distribution Quantity at Station
The number of shared bicycles is also constrained by policy requirements, including the minimum number of shared bicycles in the parking spots so as to guide the shared bicycles’ distribution, operation strategies, and maintenance modes.
Formula (12) is the lower limit that bicycles can be put in each subway station. Due to policy regulations, the least amount of shared bicycles will be put on each station, which is expressed as follows:
Equation (13) is the formula for the minimum number of bicycles on the station considering policy constraints, where c is the minimum number of bicycles parking at each exit specified by the policy [10]:
3.4. Model Algorithm
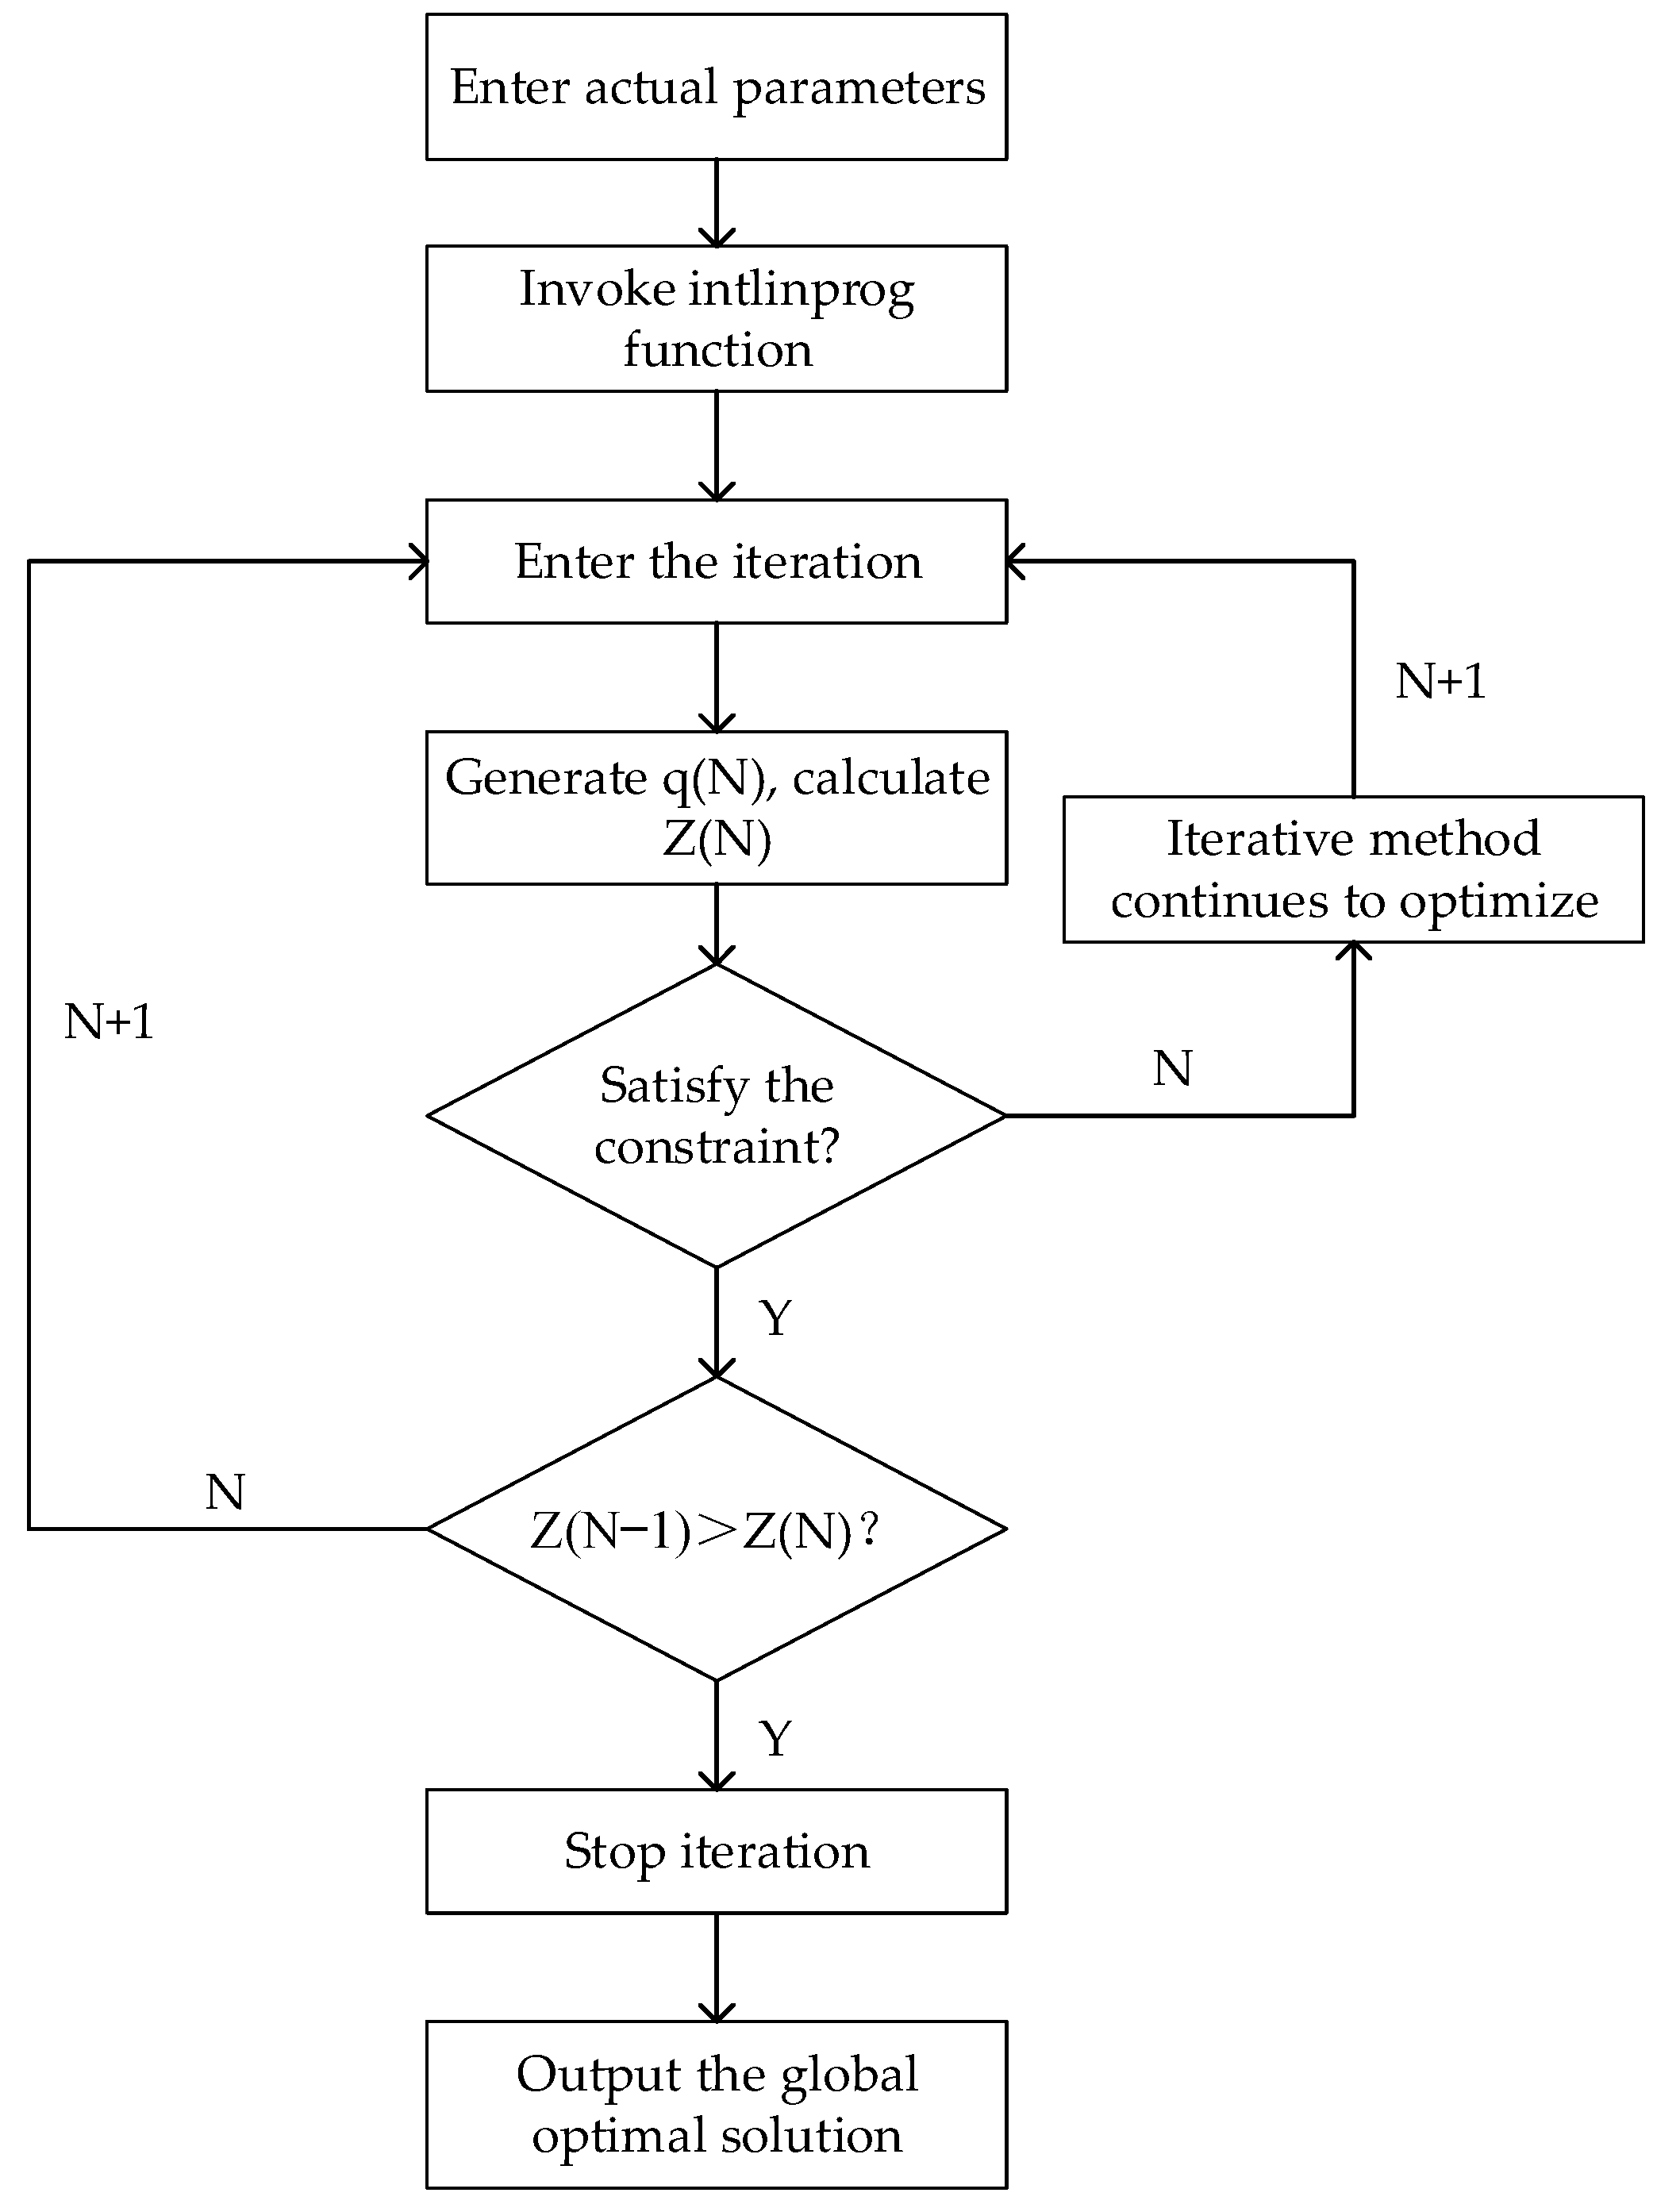
The model established in this paper takes into account the amount of shared bicycles at all stations of the subway line, with many constraints, and is an ILPM. Therefore, the intlinprog function is applied to solve the model by MATLAB, and the algorithm flow is as shown in Figure 1.
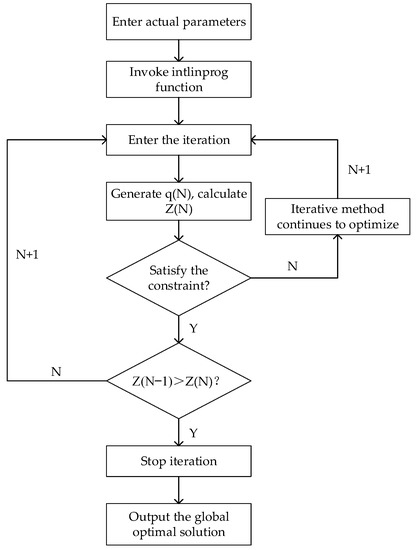
Figure 1.
Algorithm flow of SBCSL model.
- Input the actual parameters required in the model and invoke the intlinprog function.
- Enter the iteration, generate the array q (N), and calculate the utility value Z (N).
- If the array q (N) does not meet the constraints, return (2) and continue the iteration.
- If the array q (N) satisfies the constraints, continue to (5).
- If Z (N − 1) ≤ Z (N), return to (2) and continue the iteration.
- If Z (N − 1) >Z (N), the iteration ends and the global optimal solution is output.
4. Case Study
4.1. Case Overview
At the end of 2019, the permanent population of urban residents in Beijing was 18.65 million. In view of the population and geographical conditions of Beijing, citizens have a huge demand for urban low-carbon transportation, and the subway serves the main commuter. The SBCSL is an important way to solve the problem of citizens’ short trip during the morning peak hours on weekdays. However, the imbalanced distribution of shared bicycles is also more prominent. Therefore, the SBCSL issue in Beijing is selected as a case study.
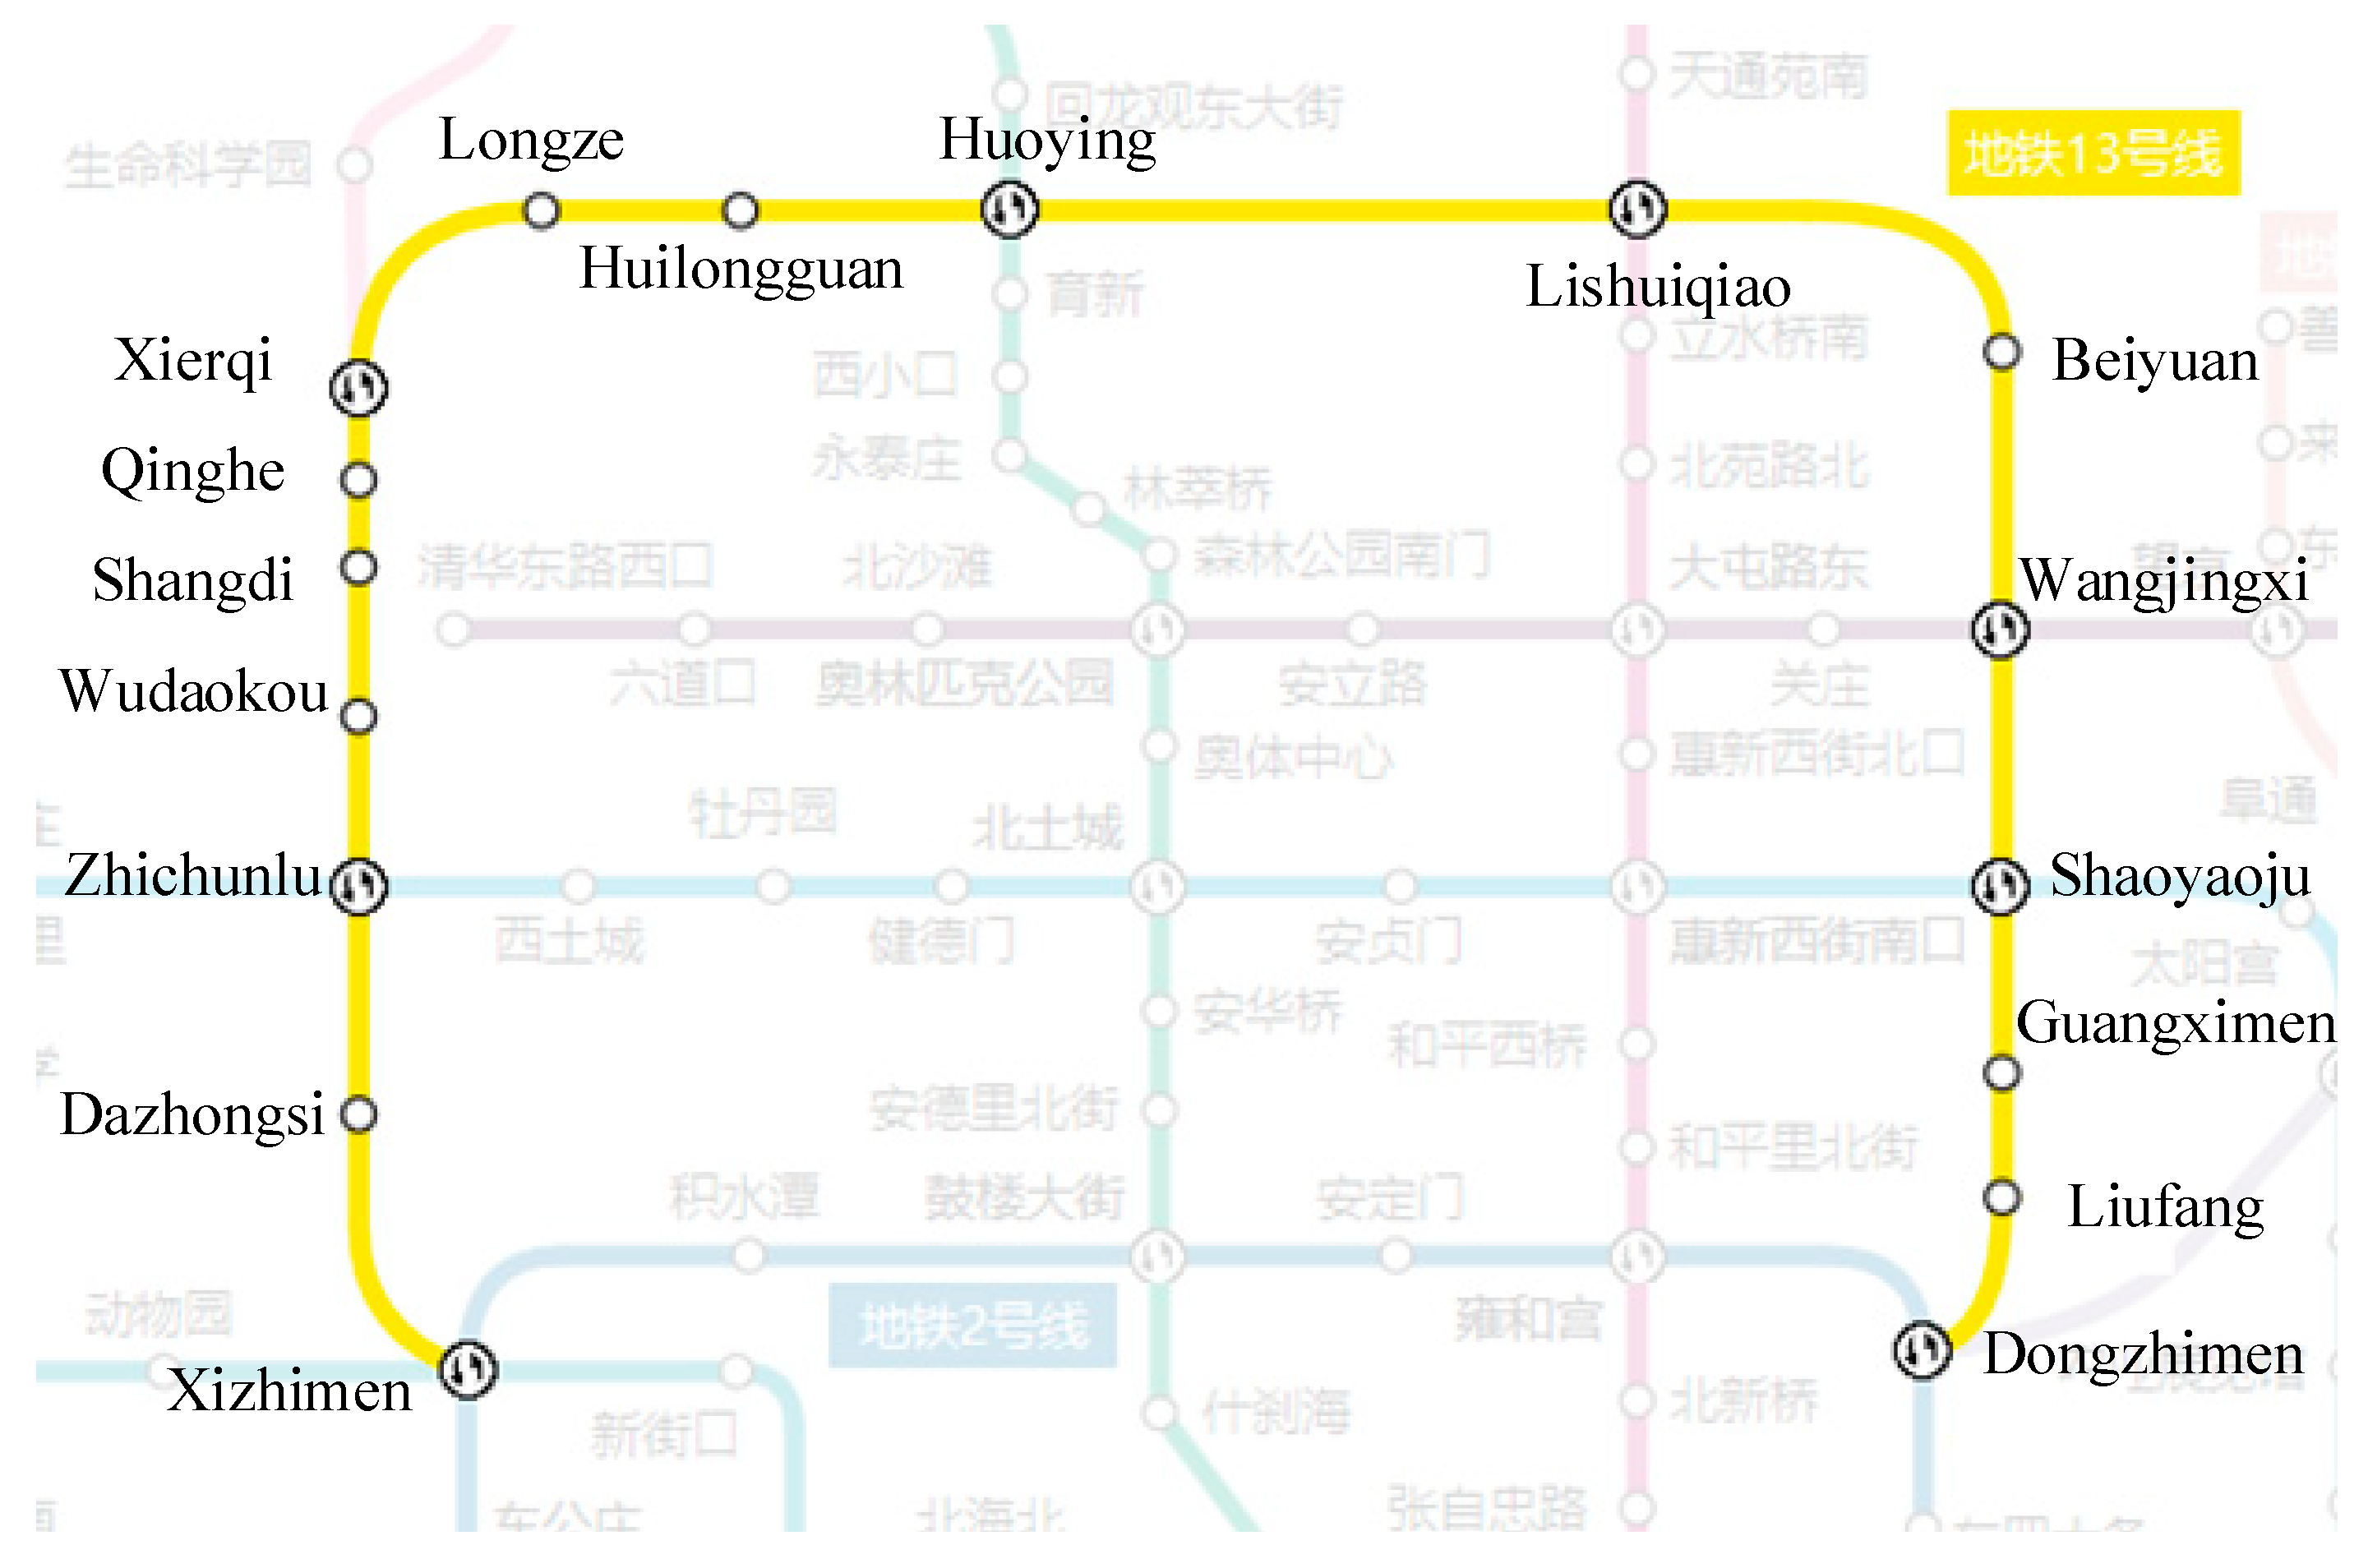
As an essential connection way for shared bicycles, subway line construction and the surrounding construction conditions affect trip choices and distribution decisions. Beijing subway Line 13 is located in the northern part of Beijing. It connects the two major transportation interchange hubs of Xizhimen and Dongzhimen, as well as scientific research institutions, residential communities, national new technology development zones, and urban areas. The quantity and types of stations are abundant, which creates good conditions for encouraging the SBCSL and also brings challenges to the reasonable distribution of shared bicycles. Therefore, Beijing subway Line 13 is selected as the target site for shared bicycles. The urban rail transportation network of Beijing is shown in Figure 2 and the route map of Beijing subway Line 13 is shown in Figure 3. The station number, station name, station’s type, and area of each station of Line 13 are from Beijing Subway, as shown in Table 5.
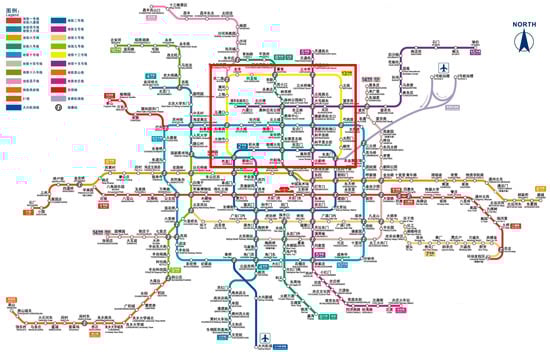
Figure 2.
Beijing Rail Transportation Lines.
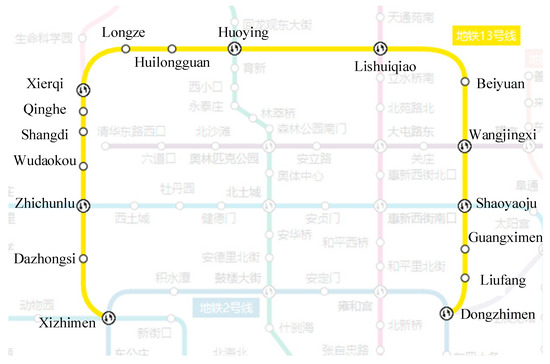
Figure 3.
Beijing subway Line 13 Route Map.
Table 5.
Station number, station name, station type, and area.
4.2. Data Collection
In this paper, the time span of the passenger flow data for each subway line during weekdays is from 29 March to 2 April 2021. These five days were all cloudy and had no major events and were thus suitable for shared bicycle trips. The land and population data are from the Beijing Municipal Commission of Planning and Natural Resources, the Beijing Municipal Bureau of Statistics, and the Beijing Transport Institute. The location information of demand points and traffic heat map come from Baidu maps.
The input parameters such as population density, the morning peak outbound hour coefficient [17], the number of shared bicycle parking spots and low-carbon transportation stations (bus stops and public bicycle rental points) are shown in Table 6, while the other basic parameters used in the case study are shown in Table 7, including the cycling turnover of shared bicycles, the number of permanent residents, the number of bicycles in Beijing, the percentage of commuting trip, the proportion of shared bicycles, the average passenger flow of the line, the longest distance to park shared bicycles, the width of the space to park shared bicycles, and the minimum amount of bicycle parking at each exit. In addition, the carbon emission reduction factor is 0.14145 kg CO2e/km [11].
Table 6.
Station parameters.
Table 7.
Other basic parameters of the case study.
4.3. Solution Result
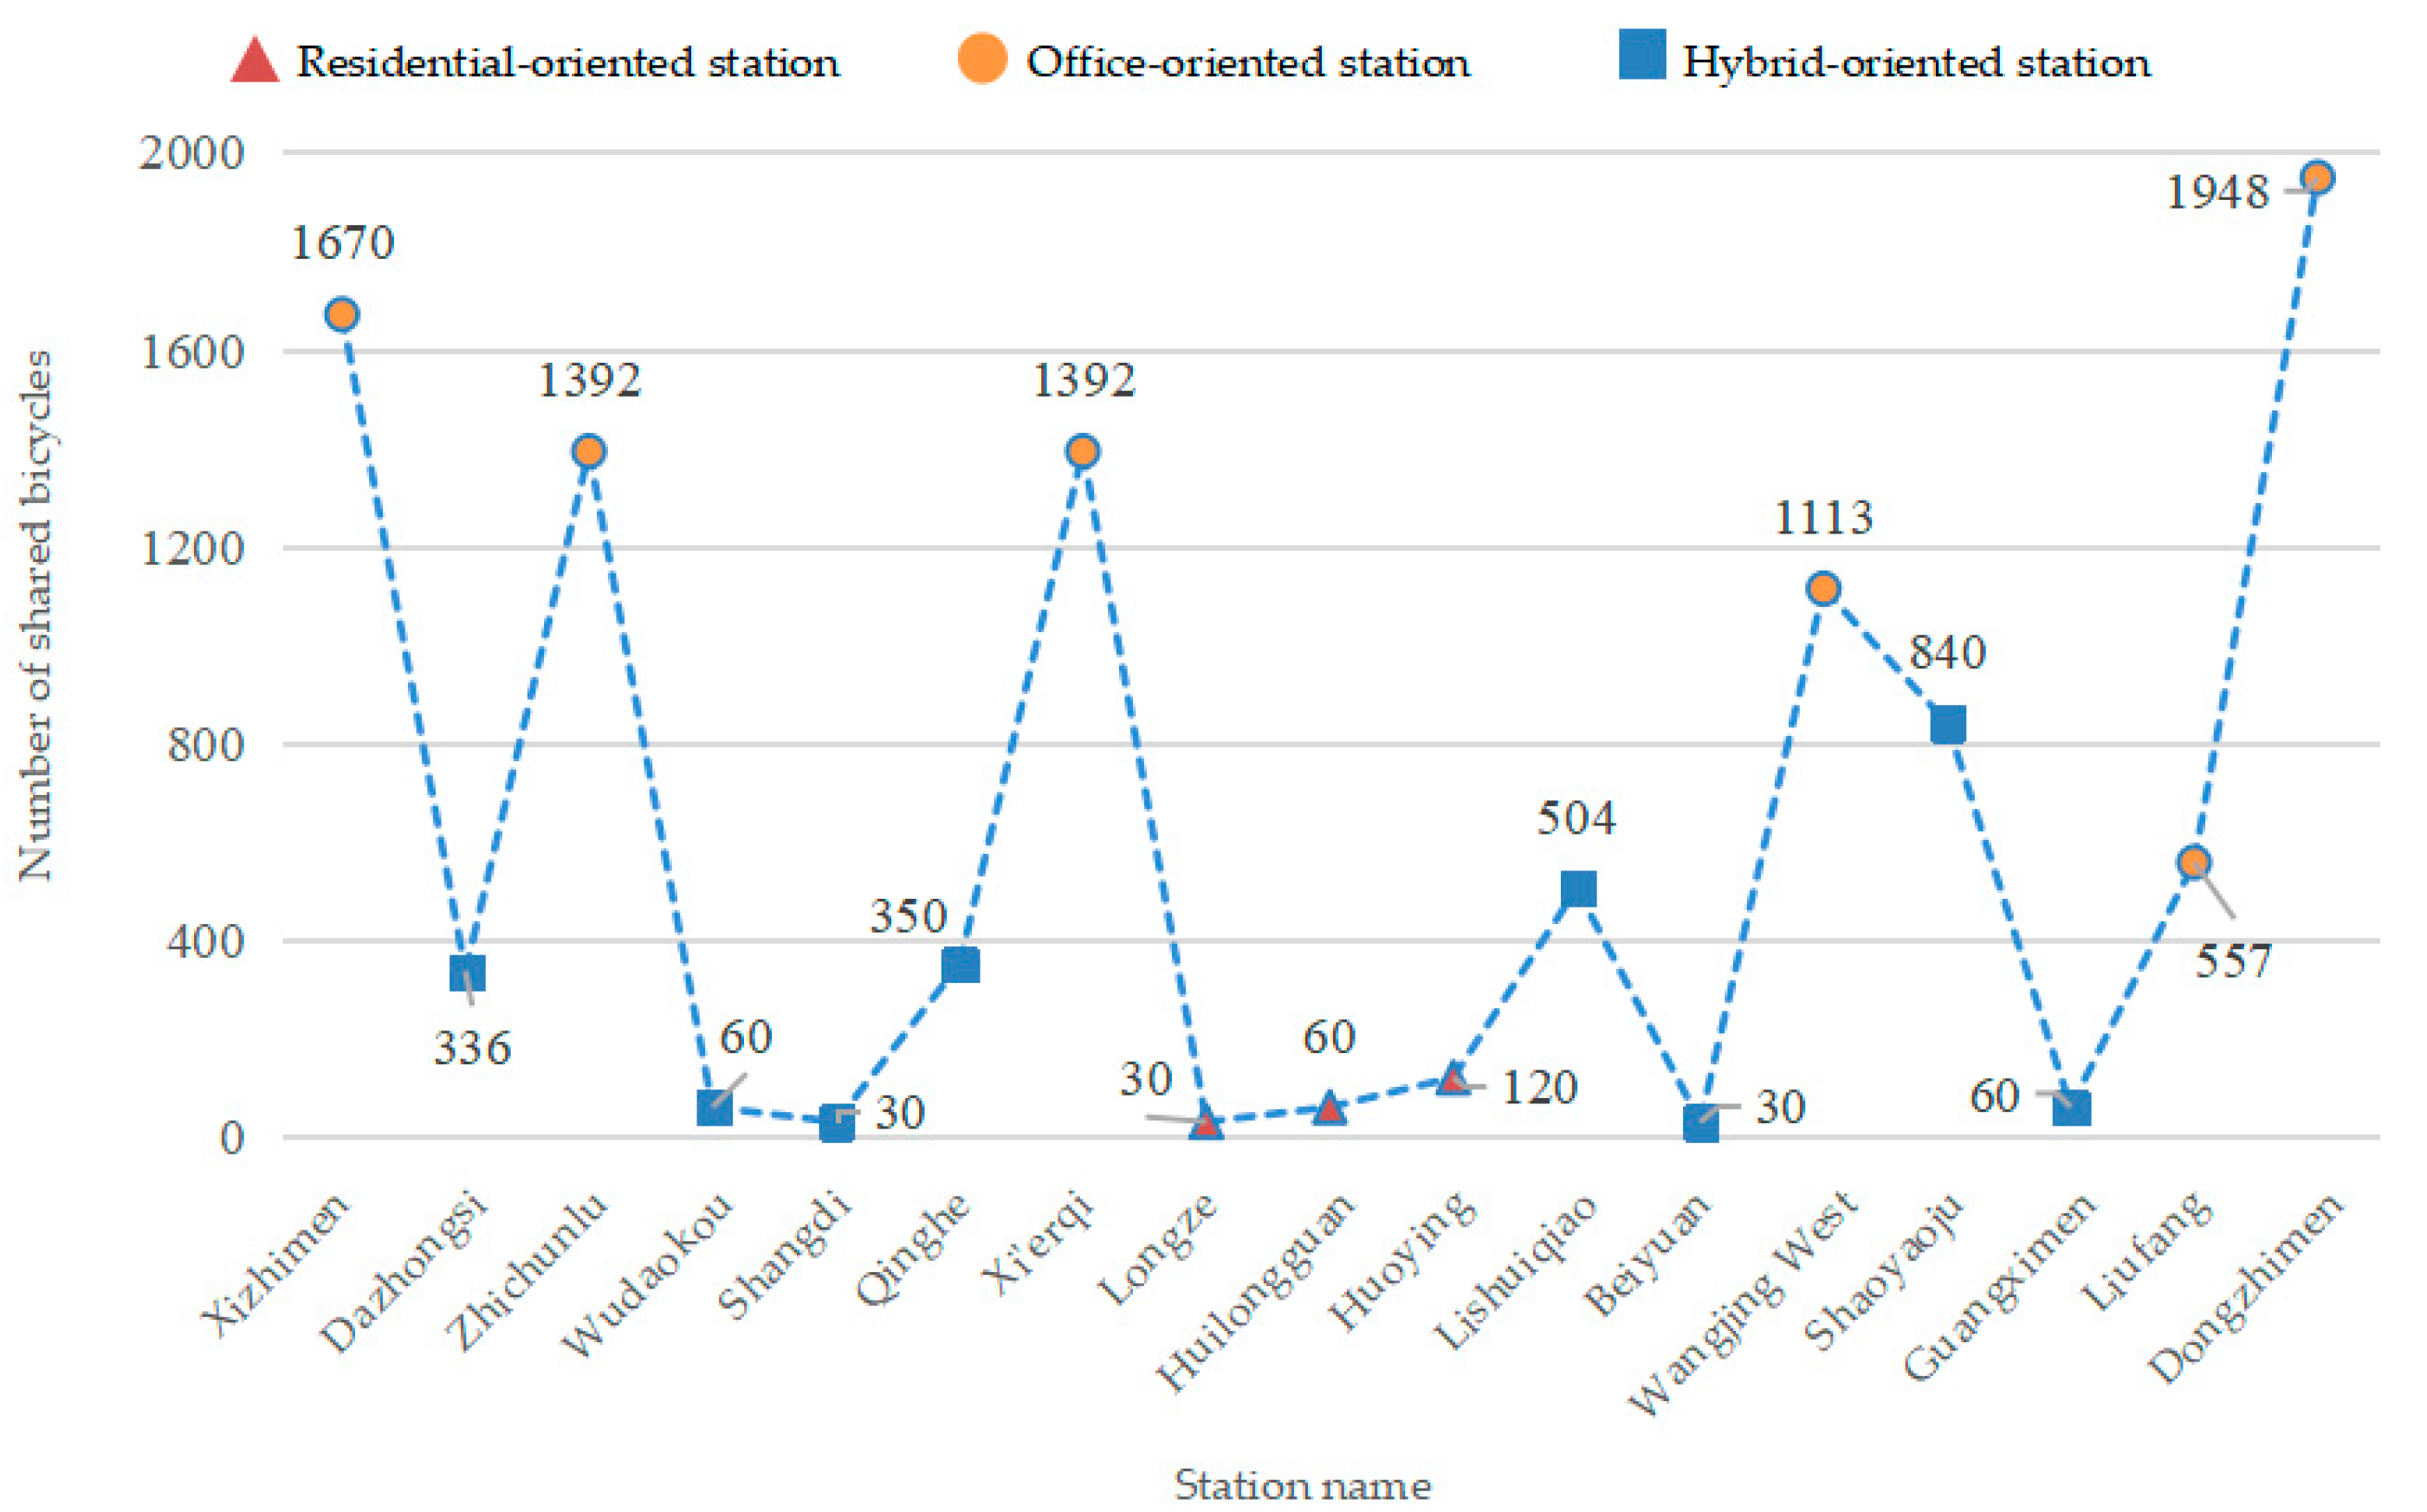
MATLAB is used to solve the example, and the carbon emission reduction of shared bicycles put on the Subway Line 13 is 3643.99 kg CO2e/km. Figure 4 shows the number of shared bicycles that should be distributed at each subway station. It can be found that shared bicycles put into each station is different. Dongzhimen station has the largest number with 1948 shared bicycles, Xizhimen Station has 1670 shared bicycles, while Shangdi, Longze, and Beiyuan stations have only 30.

Figure 4.
Number of bicycles placed at each subway station.
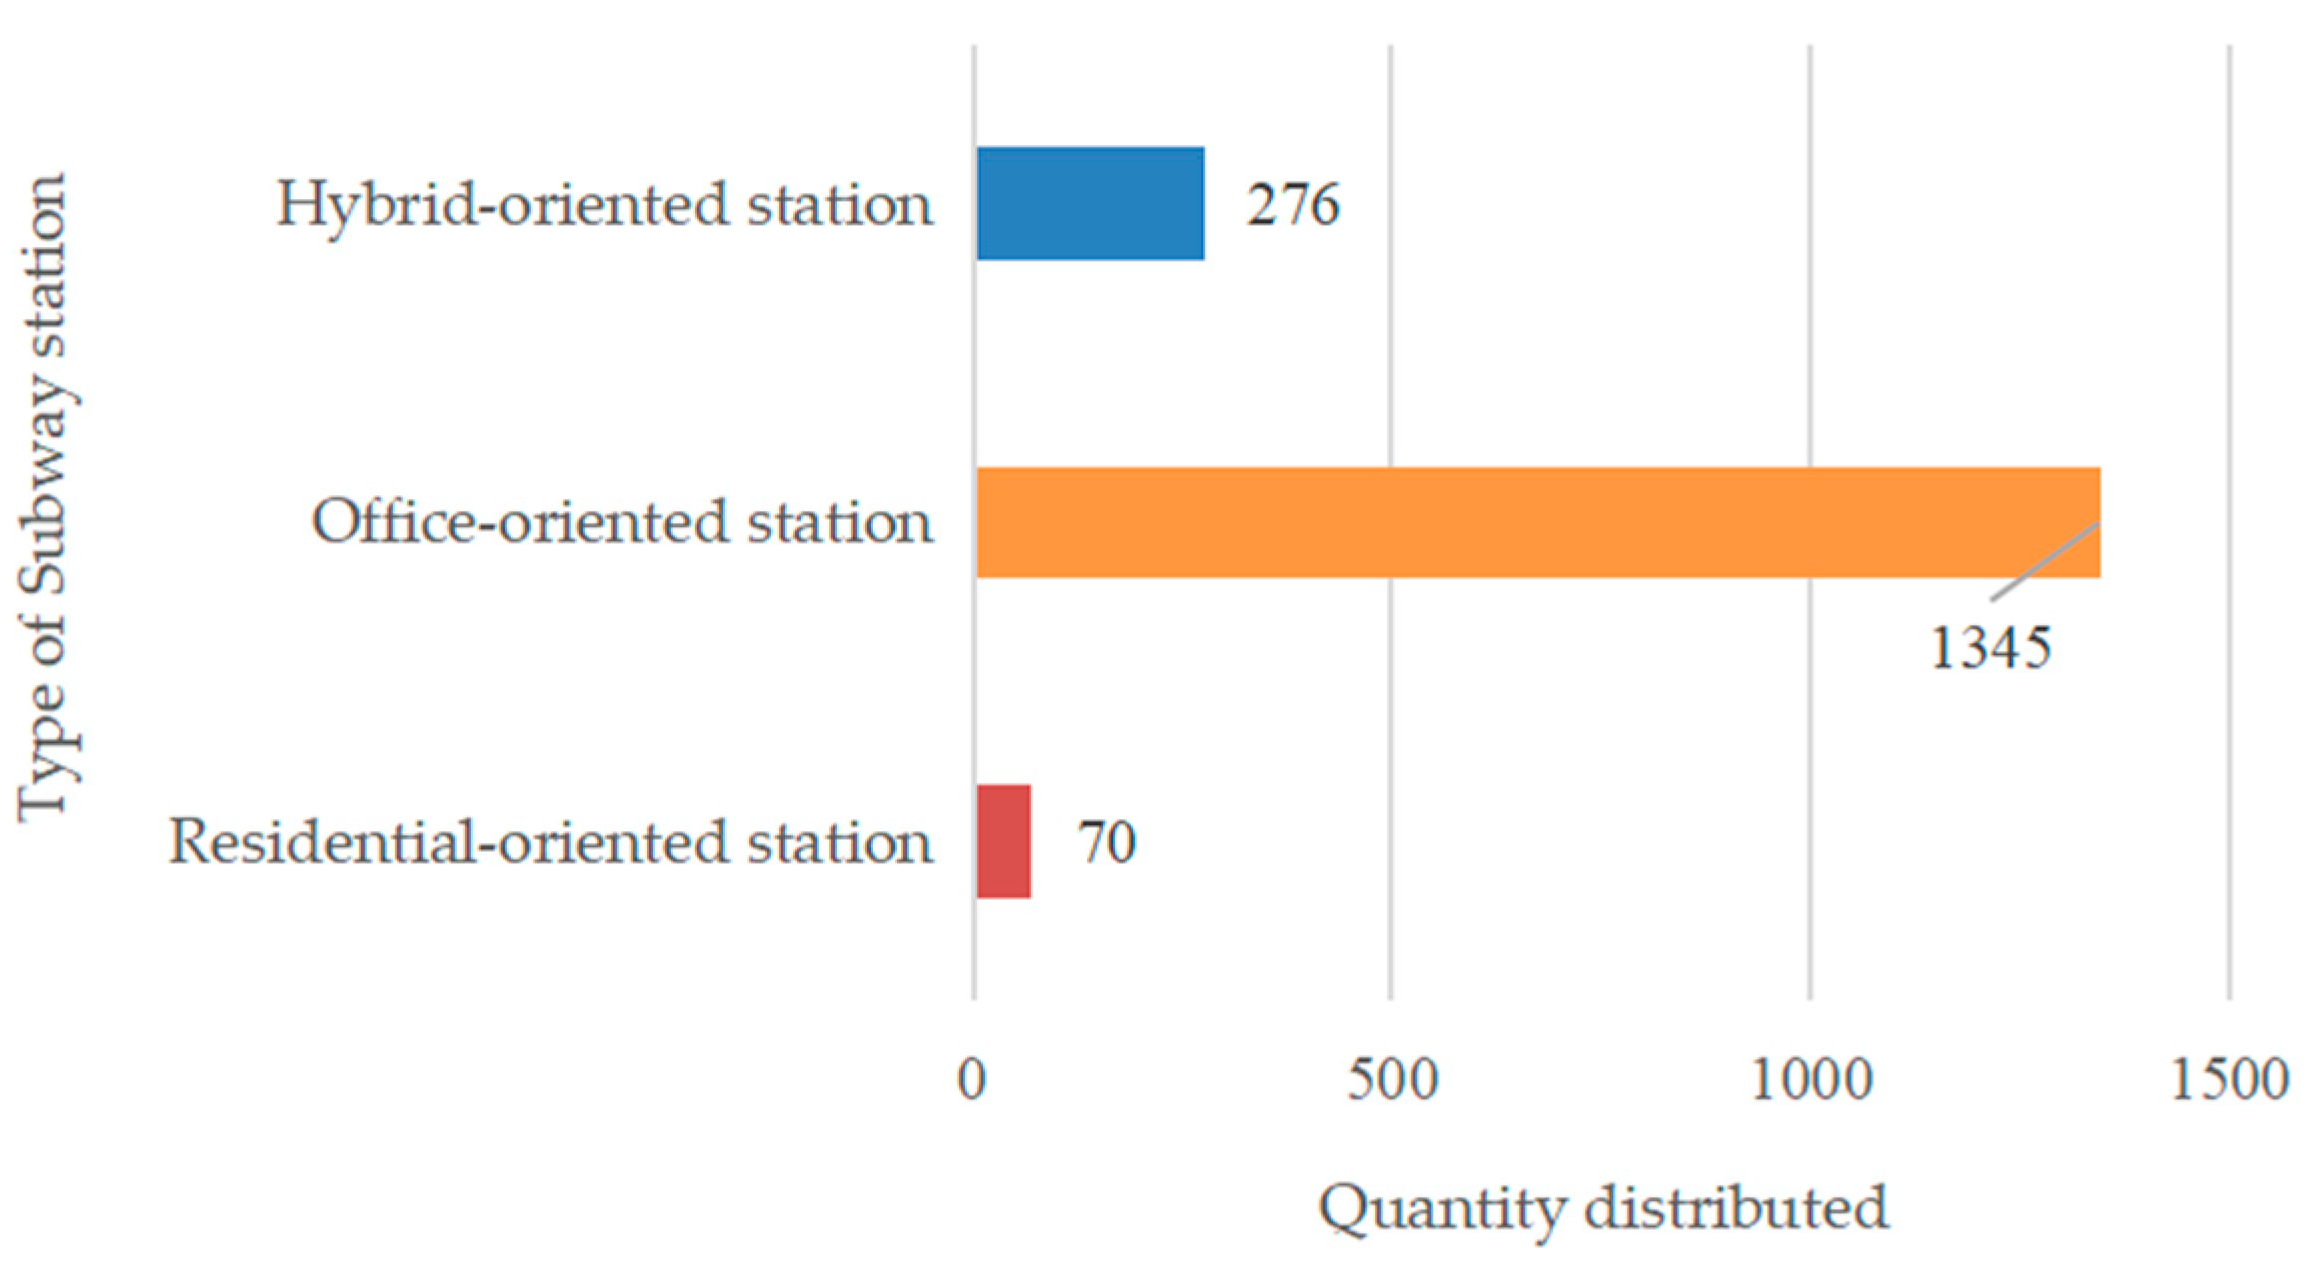
Figure 5 shows the average shared bicycles in the three types of subway stations. Among them, the office-oriented stations’ average number of shared bicycles is the highest, which is 1345, and the unit distribution at hybrid-oriented stations is the second highest, with 276. The unit distribution quantity of residential-oriented stations is the least, with only 70.

Figure 5.
Unit distribution quantity of different types of stations.
4.4. Results Discussion
4.4.1. Model Validation
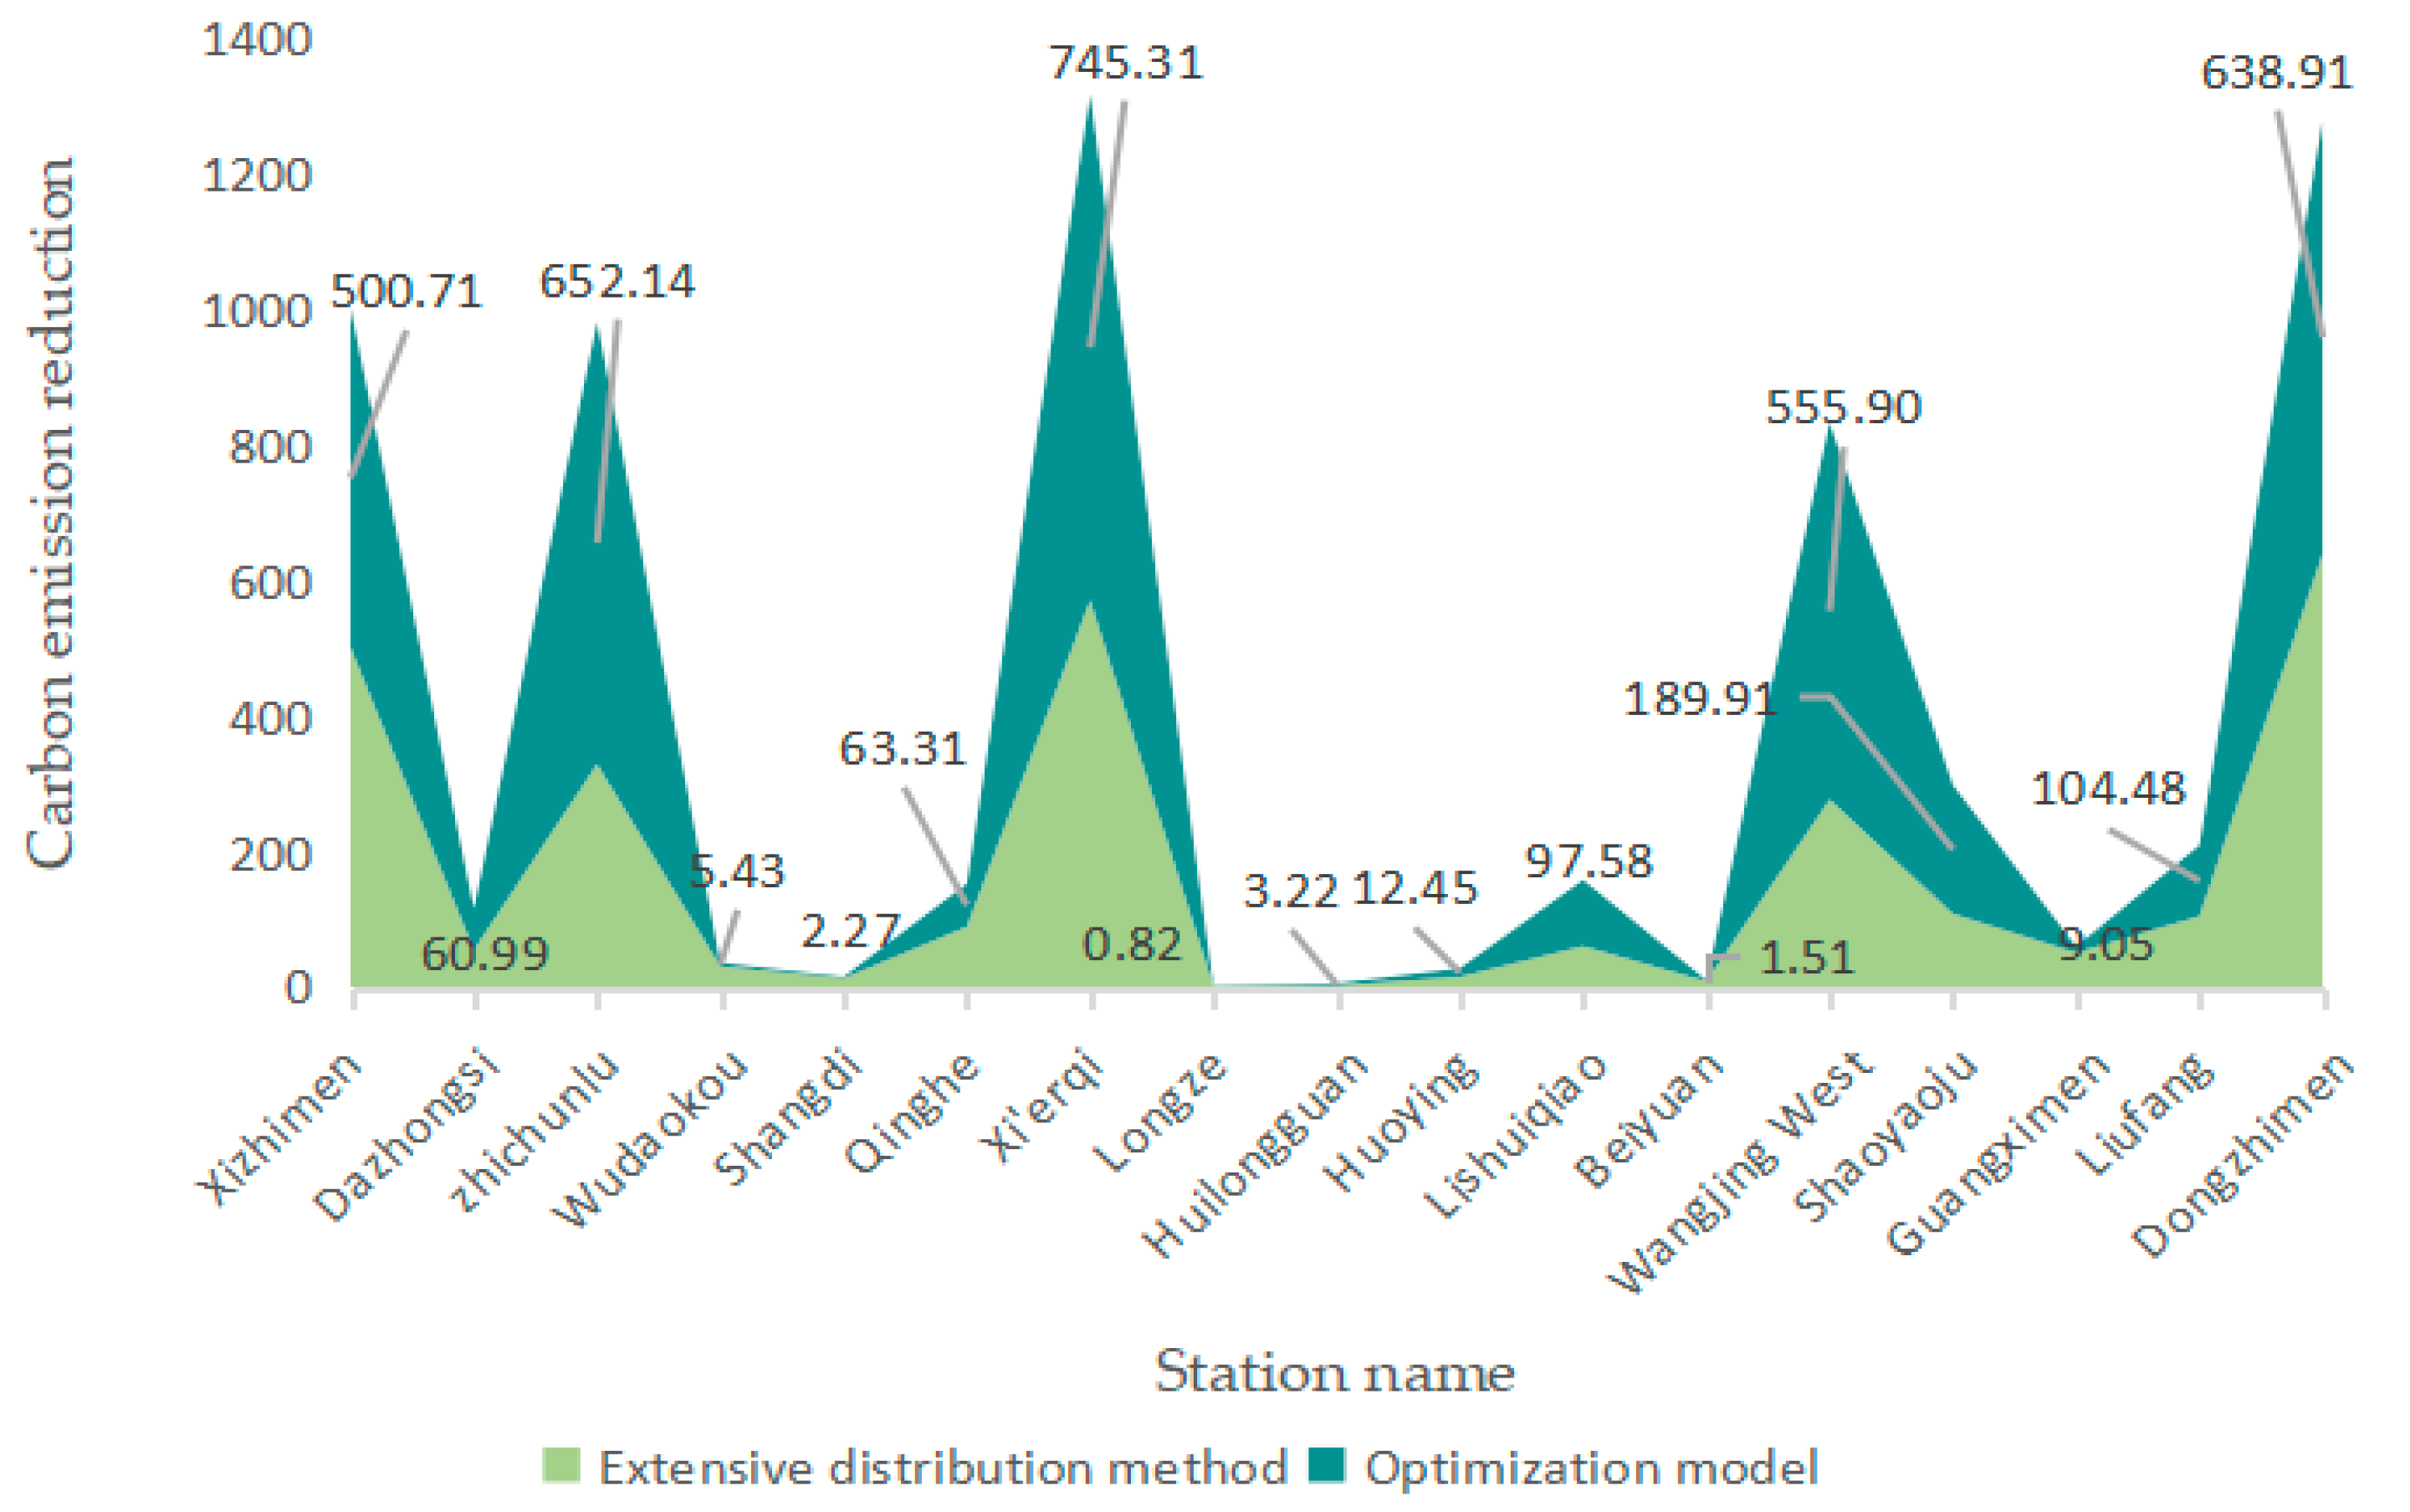
The extensive distribution strategy is to determine shared bicycles at each station based on the ratio of the potential users of each station to the potential users of the line. The carbon emission reduction of using extensive distribution method to solve the case is 2853.85 kg CO2e/km. Figure 6 shows the solution result, and Figure 7 shows the carbon emission reduction of the shared bicycles by using the extensive distribution method and optimized model. It can be seen that number of shared bicycles at Dongzhimen Station is 1211, 2537 at Xizhimen Station, and Longze Station reached 179, but there is only 40 at Huilongguan Station. The comparison results show that compared with the extensive distribution method, the optimization model not only meets the distribution constraints and conditions in the actual distribution process but increases the carbon emission reduction by 28%. Therefore, it can be considered that the optimization model of shared bicycle delivery can improve the utility of bicycle distribution. Compared with the extensive distribution method, the optimization model is more practical, accurate, and superior.
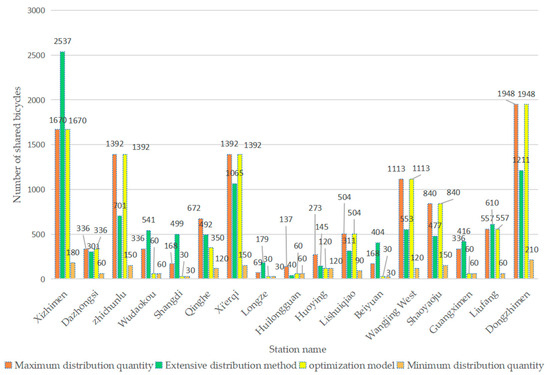
Figure 6.
Limited quantity and extensive distribution quantity.
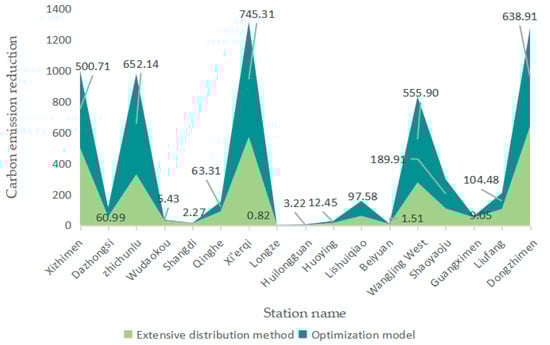
Figure 7.
Carbon emission reduction based on extensive distribution method and optimization model.
4.4.2. Results Analysis
Through the optimization model of shared bicycles, the optimal distribution of shared bicycles at each subway station is obtained, and combined with the actual situation, the distribution of shared bicycles is analyzed.
- The distribution strategy of SBCSL is greatly affected by the distribution goal.
The paper aims at the carbon emission reduction of shared bicycle distribution and sets a utility coefficient. It is clearly shown that the utility coefficient of each station is mainly positively correlated with a station’s morning peak outbound coefficient and the sharing rate of SBCSL. In addition, it can be noted that the greater the utility coefficient of the station, the greater the number of shared bicycles distributed in general, and thus a greater the carbon emission reduction will be obtained. Taking Lishuiqiao Station, Beiyuan Station, and Wangjing West Station as examples, they are all located in Chaoyang District. However, the utility coefficients of Lishuiqiao Station and Beiyuan Station are lower than that of Wangjing West Station, and the number of shared bicycles is 504, 30 and 1113, respectively. Therefore, the carbon emission reduction of these stations is much lower than that of Wangjing West Station.
- 2.
- There are significant differences in shared bicycle number distributed to each station.
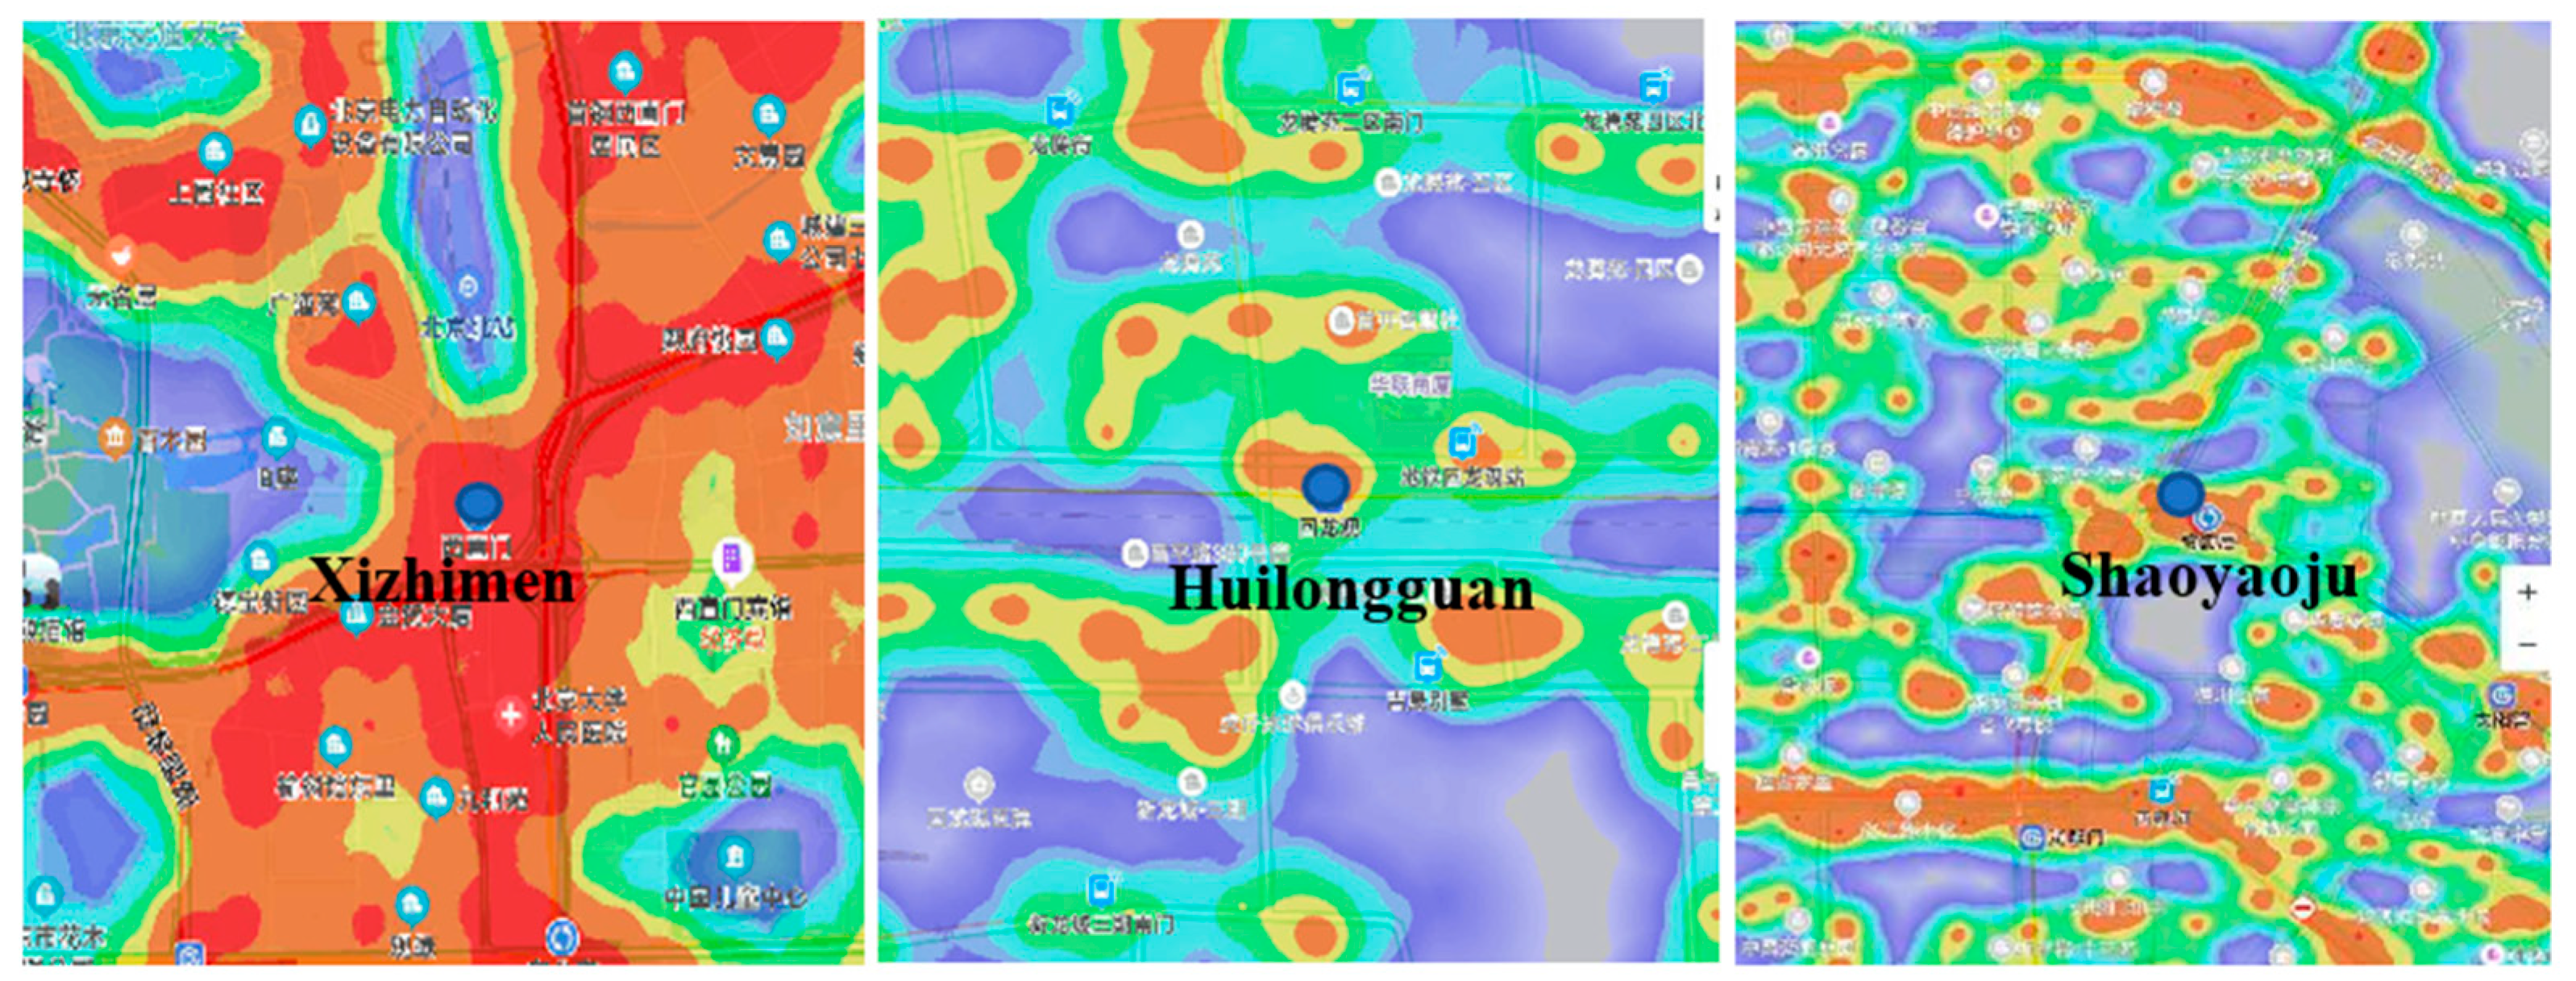
For stations with large-scale demand points, the demand by passengers leaving the station during the morning peak hour is more concentrated. Therefore, sufficient distribution of shared bicycles can meet the needs of passengers. At stations where the potential demand for shared bicycles is small, it only need meet the potential demand to obtain high carbon emission reduction. When the passenger’s demand is moderate, putting in a proper number of shared bicycles can achieve the purpose of improving the carbon emission reduction. For example, Figure 8 show the passenger flow in the morning peak hours (The flow density is indicated by red, orange, and green, from most to least) around Xizhimen Station, Huilongguan Station, and Shaoyaoju Station, respectively. The shared bicycles number placed in these three stations is 1670, 60, and 840 respectively.

Figure 8.
Traffic around the station during the morning peak hour.
- 3.
- The shared bicycle distribution modes are particular in different types of stations.
Although the office-oriented stations have a high limit on the number of bicycles, bicycles distributed to the stations are generally close to the upper limit and is greater than other types of stations. Residential-oriented stations have a small number of outbound passengers during the morning peak hours, and shared bicycles only need reach the minimum amount of distribution constraints. The composition of the passenger flow of the hybrid-oriented stations is diversified. Although the results are not regular, they are all in the feasible range and can meet the basic bicycle demand. In addition, the results of the average shared bicycles number in the three types of subway stations show that the number of office-oriented stations is the highest, followed by the hybrid-oriented stations, and the residential-oriented stations are the lowest. It is worth noting that not all office-oriented stations have the highest number of bicycles. For example, the number of bicycles in Liufang Station is 557, which is lower than the 840 bicycles in Shaoyaoju Station, which is a hybrid station. It shows the bicycle distribution decision from the perspective of carbon emission reduction can not only rely on the demand of the station but should combine the constraints to carry out refined distribution.
4.4.3. Suggestions
To sum up, in order to make the shared bicycles of subway stations better serve commuters and improve the carbon emission reduction during the morning peak hours of weekdays, this paper combines the results of case study and puts forward the following suggestions.
- Refined distribution strategy
For office-oriented stations in the morning peak hours, the shared bicycles should be satisfied on the premise of ensuring that the number of distributed units does not exceed the capacity of the stations. For residential-oriented stations with less demand, operators should allocate bicycles in an appropriate amount. Though residents have less demand for bicycles during morning peak hours, shared bicycles should be distributed timely, locally, and in appropriate amounts.
- 2.
- Timely scheduling of bicycles
Dispatchers complete the scheduling of bicycles before the morning peak hours in the city, so as to maximize the impact of shared bicycles on sustainability. In the morning peak hours, the passengers of office-oriented stations have a greater demand for bicycles, and operators should do a good job of parking bicycles before peak demand comes. At the same time, for residential-oriented stations, it is necessary to sort and maintain bicycles near the exit of the station, so as to prevent disorderly parking caused by the instantaneous increase of bicycles from the residential area to the subway station.
- 3.
- Reasonable layout of the distribution area
The government should deeply cooperate with enterprises to determine the distribution area and quantity of shared bicycles. Transportation authorities and enterprises use intelligent devices to monitor the actual shared bicycle riding behavior and then analyze the riding characteristics of subway passengers in the morning peak hours according to the data information. Furthermore, the distribution area of shared bicycles shall be rationally arranged so as to better play the relevant and complementary role of shared bicycles to urban traffic.
5. Conclusions
The concept of “low carbon, environmental protection, green life” has attracted more and more attention in recent years. Accordingly, the advantages of shared bicycles have become increasingly obvious. Aiming at the severe challenges that SBCSL brings to cities, this paper constructs a distribution model with the goal of maximizing the reduction of carbon emissions and provides examples of bicycles distributed on the Beijing subway Line 13. The results are consistent with the actual situation and solve the problem of the unbalanced distribution of shared bicycles.
- The utility coefficient is defined by combining citizens’ demand and shared bicycles’ supply, which lays a foundation for the follow-up innovative research. With the goal of maximizing carbon emission reductions and comprehensively considering the resource and station constrains in the distribution process, a shared bicycle distribution optimization model is constructed to solve the problem of imbalanced distribution.
- The formula of potential demand is fully considered. The morning peak hours coefficient is used to express the proportion of residents commuting by subway during the morning peak hours. At the same time, the probability of passengers choosing to use shared bicycles is considered to ensure the rationality of measuring the potential demand for shared bicycles at stations.
- The research results provide support to formulate refined distribution strategies. Based on innovative research, combined with the results, it can be found in order to maximize the carbon emission reduction of the shared bicycles, the subway station types and the use features of bicycles need to be considered. Under the premise of not exceeding the constrains, it should distribute as many bicycles as possible to office-oriented stations, and only needs to comply with the minimum distribution constrains for residential-oriented stations.
The research on shared bicycle scheduling is complex and systematic. This paper still has certain limitations and needs further research. In the paper, the model does not consider the impact of transfer stations and the correlation between stations on the distribution of shared bicycles. In future studies, a large number of historical cycling data of shared bicycles can be obtained to analyze the temporal and spatial features of riding and the correlation of subway stations to formulate a more accurate distribution plan. In addition, the model does not involve the relationship between shared bicycles and other urban low-carbon transportation, which can be combined in subsequent research to determine the number of bicycles.
Author Contributions
Introduction, S.Z. and L.C.; literature review, S.Z., L.C. and Y.L.; materials and methods, S.Z. and L.C.; case study, S.Z., L.C. and Y.L.; conclusions, S.Z. and L.C.; data curation, Y.L.; validation, S.Z.; writing—original draft, L.C. All authors have read and agreed to the published version of the manuscript.
Funding
This research was supported by the national key research and development program of China (No. 2020YFB1707801), National Natural Science Foundation of China (Nos. 71601078, 71874053), Social Science Funds of Beijing (No. 18GLC061), the Fundamental Research Funds for the Central Universities (Nos. 2019MS056, 2020MS067), the National Social Science Fund of China (No. 19ZDA081), and the 2018 Key Projects of Philosophy and Social Sciences Research, Ministry of Education, China (No. 18JZD032).
Institutional Review Board Statement
Not applicable.
Informed Consent Statement
Not applicable.
Data Availability Statement
Data is contained within the article. The stations of Line 13 are from Beijing Subway (https://www.bjsubway.com). The land and population data are from the Beijing Municipal Commission of Planning and Natural Resources and the Beijing Municipal Bureau of Statistics, respectively. The location information of demand points and traffic heat map come from Baidu map.
Conflicts of Interest
The authors declare no conflict of interest.
References
- Chen, X.; Qu, Q.; Chen, M.; Fang, S.; Cheng, Y. The Sustainable Existence of China’s Bicycle-Sharing Market: To Oversupply or to Disappear. Sustainability 2018, 10, 4214. [Google Scholar] [CrossRef] [Green Version]
- Bullock, C.; Brereton, F.; Bailey, S. The economic contribution of public bike-share to the sustainability and efficient functioning of cities. Sustain. Cities Soc. 2017, 28, 76–87. [Google Scholar] [CrossRef]
- NYC Department of Transportation. Mobility Report; NYC Department of Transportation: New York, NY, USA, 2019.
- Zhang, L.; Zhang, J.; Duan, Z.; Bryde, D. Sustainable bike-sharing systems: Characteristics and commonalities across cases in urban China. J. Clean. Prod. 2015, 97, 124–133. [Google Scholar] [CrossRef]
- Zhao, P.; Li, S. Bicycle-metro integration in a growing city: The determinants of cycling as a transfer mode in metro station areas in Beijing. Transp. Res. Part A Policy Pract. 2017, 99, 46–60. [Google Scholar] [CrossRef]
- Ma, Y.; Lan, J.; Thornton, T.; Mangalagiu, D.; Zhu, D. Challenges of collaborative governance in the sharing economy: The case of free-floating bike sharing in Shanghai. J. Clean. Prod. 2018, 197, 356–365. [Google Scholar] [CrossRef]
- Jia, L.; Liu, X.; Liu, Y. Impact of Different Stakeholders of Bike-Sharing Industry on Users’ Intention of Civilized Use of Bike-Sharing. Sustainability 2018, 10, 1437. [Google Scholar] [CrossRef] [Green Version]
- Zhang, S.; Wang, H.; Zhang, Y.; Li, Y. A novel two-stage location model of charging station considering dynamic distribution of electric taxis. Sustain. Cities Soc. 2019, 51, 101752. [Google Scholar] [CrossRef]
- Chen, H.; Zhu, T.; Huo, J.; Andre, H. Sustainable co-governance of smart bike-sharing schemes based on consumers’ perspective. J. Clean. Prod. 2020, 260, 120949. [Google Scholar] [CrossRef]
- Eren, E.; Uz, V.E. A review on bike-sharing: The factors affecting bike-sharing demand. Sustain. Cities Soc. 2020, 54, 101882. [Google Scholar] [CrossRef]
- Chen, J.; Zhou, D.; Zhao, Y.; Wu, B.; Wu, T. Life cycle carbon dioxide emissions of bike sharing in China: Production, operation, and recycling. Resour. Conserv. Recycl. 2020, 162, 105011. [Google Scholar] [CrossRef]
- Zhang, Y.; Mi, Z. Environmental benefits of bike sharing: A big data-based analysis. Appl. Energ. 2018, 220, 296–301. [Google Scholar] [CrossRef]
- D’Almeida, L.; Rye, T.; Pomponi, F. Emissions assessment of bike sharing schemes: The case of Just Eat Cycles in Edinburgh, UK. Sustain. Cities Soc. 2021, 71, 103012. [Google Scholar] [CrossRef]
- Zhang, H.; Song, X.; Long, Y.; Xia, T.; Fang, K.; Zheng, J.; Huang, D.; Shibasaki, R.; Liang, Y. Mobile phone GPS data in urban bicycle-sharing: Layout optimization and emissions reduction analysis. Appl. Energ. 2019, 242, 138–147. [Google Scholar] [CrossRef]
- Zhang, L.; Long, R.; Chen, H. Carbon emission reduction potential of urban rail transit in China based on electricity consumption structure. Resour. Conserv. Recycl. 2019, 142, 113–121. [Google Scholar] [CrossRef]
- Tran, T.D.; Ovtracht, N.; Arcier, B.F.D. Modeling Bike Sharing System using Built Environment Factors. Procedia CIRP 2015, 30, 293–298. [Google Scholar] [CrossRef]
- Li, W.; Kamargianni, M. Providing quantified evidence to policy makers for promoting bike-sharing in heavily air-polluted cities: A mode choice model and policy simulation for Taiyuan-China. Transp. Res. Part A Policy Pract. 2018, 111, 277–291. [Google Scholar] [CrossRef]
- Yang, Y.; Heppenstall, A.; Turner, A.; Comber, A. A spatiotemporal and graph-based analysis of dockless bike sharing patterns to understand urban flows over the last mile. Comput. Environ. Urban Syst. 2019, 77, 101361. [Google Scholar] [CrossRef]
- Guo, Y.; He, S.Y. Built environment effects on the integration of dockless bike-sharing and the metro. Transp. Res. Part D Transp. Environ. 2020, 83, 102335. [Google Scholar] [CrossRef]
- van Goeverden, C.D.; De Almeida Correia, G.H. Potential of peer-to-peer bike sharing for relieving bike parking capacity shortage at train stations: An explorative analysis for the Netherlands. J. Transp. 2019, 18. [Google Scholar] [CrossRef]
- Shao, P.; Liang, J. An Analysis of the Factors Influencing the Sustainable Use Intention of Urban Shared Bicycles in China. Sustainability 2019, 11, 2721. [Google Scholar] [CrossRef] [Green Version]
- Lu, M.; Hsu, S.; Chen, P.; Lee, W. Improving the sustainability of integrated transportation system with bike-sharing: A spatial agent-based approach. Sustain. Cities Soc. 2018, 41, 44–51. [Google Scholar] [CrossRef]
- Leister, E.H.; Vairo, N.; Sims, D.; Bopp, M. Understanding bike share reach, use, access and function: An exploratory study. Sustain. Cities Soc. 2018, 43, 191–196. [Google Scholar] [CrossRef]
- Zhang, Y.; Thomas, T.; Brussel, M.; van Maarseveen, M. Exploring the impact of built environment factors on the use of public bikes at bike stations: Case study in Zhongshan, China. J. Transp. Geogr. 2017, 58, 59–70. [Google Scholar] [CrossRef]
- Wang, K.; Akar, G.; Chen, Y. Bike sharing differences among Millennials, Gen Xers, and Baby Boomers: Lessons learnt from New York City’s bike share. Transp. Res. Part A Policy Pract. 2018, 116, 1–14. [Google Scholar] [CrossRef]
- Faghih-Imani, A.; Eluru, N. Incorporating the impact of spatio-temporal interactions on bicycle sharing system demand: A case study of New York CitiBike system. J. Transp. Geogr. 2016, 54, 218–227. [Google Scholar] [CrossRef]
- McBain, C.; Caulfield, B. An analysis of the factors influencing journey time variation in the cork public bike system. Sustain. Cities Soc. 2018, 42, 641–649. [Google Scholar] [CrossRef]
- Sathishkumar, V.E.; Park, J.; Cho, Y. Using data mining techniques for bike sharing demand prediction in metropolitan city. Comput. Commun. 2020, 153, 353–366. [Google Scholar]
- Sohrabi, S.; Paleti, R.; Balan, L.; Cetin, M. Real-time prediction of public bike sharing system demand using generalized extreme value count model. Transp. Res. Part A Policy Pract. 2020, 133, 325–336. [Google Scholar] [CrossRef]
- Yang, F.; Ding, F.; Qu, X.; Ran, B. Estimating Urban Shared-Bike Trips with Location-Based Social Networking Data. Sustainability 2019, 11, 3220. [Google Scholar] [CrossRef] [Green Version]
- Zhao, D.; Ong, G.P.; Wang, W.; Hu, X.J. Effect of built environment on shared bicycle reallocation: A case study on Nanjing, China. Transp. Res. Part A Policy Pract. 2019, 128, 73–88. [Google Scholar] [CrossRef]
- Yu, Q.; Zhang, H.; Li, W.; Sui, Y.; Song, X.; Yang, D.; Shibasaki, R.; Jiang, W. Mobile phone data in urban bicycle-sharing: Market-oriented sub-area division and spatial analysis on emission reduction potentials. J. Clean. Prod. 2020, 254, 119974. [Google Scholar] [CrossRef]
- Guidon, S.; Reck, D.J.; Axhausen, K. Expanding a(n) (electric) bicycle-sharing system to a new city: Prediction of demand with spatial regression and random forests. J. Transp. Geogr. 2020, 84, 102692. [Google Scholar] [CrossRef] [Green Version]
- Hua, M.; Chen, X.; Zheng, S.; Cheng, L.; Chen, J. Estimating the parking demand of free-floating bike sharing: A journey-data-based study of Nanjing, China. J. Clean. Prod. 2020, 244, 118764. [Google Scholar] [CrossRef]
- Frade, I.; Ribeiro, A. Bike-sharing stations: A maximal covering location approach. Transp. Res. Part A Policy Pract. 2015, 82, 216–227. [Google Scholar] [CrossRef]
- Zhang, D.; Yu, C.; Desai, J.; Lau, H.Y.K.; Srivathsan, S. A time-space network flow approach to dynamic repositioning in bicycle sharing systems. Transp. Res. Part B Methodol. 2017, 103, 188–207. [Google Scholar] [CrossRef]
- Zhang, J.; Li, W.; Wang, G.; Yu, J. Feasibility Study of Transferring Shared Bicycle Users with Commuting Demand to Flex-Route Transit—A Case Study of Nanjing City, China. Sustainability 2021, 13, 6067. [Google Scholar]
- Wang, Z.; Sun, Y.; Zeng, Y.; Wang, B. Substitution effect or complementation effect for bicycle travel choice preference and other transportation availability: Evidence from US large-scale shared bicycle travel behaviour data. J. Clean. Prod. 2018, 194, 406–415. [Google Scholar] [CrossRef]
- Jin, H.; Jin, F.; Wang, J.E.; Sun, W.; Dong, L. Competition and Cooperation between Shared Bicycles and Public Transit: A Case Study of Beijing. Sustainability 2019, 11, 1323. [Google Scholar] [CrossRef] [Green Version]
- Ma; Zhou; Yu; Zhang College Students’ Shared Bicycle Use Behavior Based on the NL Model and Factor Analysis. Sustainability 2019, 11, 4538.
- Lin, D.; Zhang, Y.; Zhu, R.; Meng, L. The analysis of catchment areas of metro stations using trajectory data generated by dockless shared bikes. Sustain. Cities Soc. 2019, 49, 101598. [Google Scholar] [CrossRef]
- Yuan, M.; Zhang, Q.; Wang, B.; Liang, Y.; Zhang, H. A mixed integer linear programming model for optimal planning of bicycle sharing systems: A case study in Beijing. Sustain. Cities Soc. 2019, 47, 101515. [Google Scholar] [CrossRef]


Publisher’s Note: MDPI stays neutral with regard to jurisdictional claims in published maps and institutional affiliations. |
© 2021 by the authors. Licensee MDPI, Basel, Switzerland. This article is an open access article distributed under the terms and conditions of the Creative Commons Attribution (CC BY) license (https://creativecommons.org/licenses/by/4.0/).