Abstract
This study deals with the flood-hazard assessment and mapping in the catchment of Megalo Rema (East Attica, Greece). Flood-hazard zones were identified utilizing Multi-Criteria Decision Analysis (MCDA) integrated with Geographic Information System (GIS). Five factors were considered as the most influential parameters for the water course when high storm-water runoff exceeds drainage system capacity and were taken into account. These factors include slope, elevation, distance from stream channels, geological formations in terms of their hydro-lithological behavior and land cover. To obtain the final weights for each factor, rules of the Analytic Hierarchy Process (AHP) were applied. The final flood-hazard assessment and mapping of the study area were produced through Weighted Linear Combination (WLC) procedures. The final map showed that approximately 26.3 km2, which corresponds to 22.7% of the total area of the catchment, belongs to the high flood risk zone, while approximately 25 km2, corresponding to ~15% of the catchment, is of very high flood risk. The highly and very highly prone to flooding areas are located mostly at the southern and western parts of the catchment. Furthermore, the areas on both sides of the channel along the lower reaches of the main stream are of high and very high risk. The highly and very highly prone to flooding areas are relatively low-lying, gently sloping and extensively urbanized, and host the densely populated settlements of Rafina-Pikermi, Penteli, Pallini, Peania, Spata, Glika Nera, Gerakas and Anthousa. The accuracy of the flood-hazard map was verified by correlating flood events of the last 30 years, the Hydrologic Engineering Center’s River Analysis System (HEC–RAS) simulation and quantitative geomorphological analysis with the flood-hazard level. The results of our approach provide decision makers with important information for land-use planning at a regional scale, determining safe and unsafe areas for urban development.
1. Introduction
Floods are among the most frequent and dangerous natural hazards and the leading cause of natural disaster fatalities worldwide [1]. They represent approximately one-third of all global hazardous events, and the number of extreme flood incidences has significantly increased over the past few decades [2]. Every year this type of hazard causes a significant loss of life and property [3] and severely affects the natural and human environment as well as the development of an area [4].
Floods in urban and peri-urban areas are caused by the complex combination of both natural and human-induced factors [5,6]. Among the most important physical factors are extreme precipitation events and the “organization” of the drainage network, as well as the geological and geomorphological conditions of the catchment [7]. Moreover, human causes of flooding include rapid urbanization. Urbanization results in a decrease in surface permeability, caused by the coverage of the surface with materials (such as concrete and asphalt) which decrease infiltration and at the same time increase surface runoff. Population growth, uncontrolled building construction and lack of urban planning can disturb the drainage system function by blocking or modifying the water flows in stream channels. Similarly, deforestation and poor land use practices lead to a decrease in infiltration [8,9].
Climate predictions reveal that the number and the severity of extreme precipitation events seem to increase despite the reduction in total annual and seasonal rainfall [10]. At the same time, rising urbanization and economic development negatively affect hydrological processes, causing floods in areas of the catchment where they would not occur under normal circumstances. The combination of the aforementioned facts is expected to make river floods more frequent, intense and damaging in terms of human casualties and financial losses [11,12,13]. Therefore, there is an increasing demand for flood risk management policies for the protection of human communities in urban and peri-urban areas.
Flood risk management is the operation of corrective and preventative measures for reducing flood damage and includes four phases, namely: mitigation, preparedness, response and recovery. It is obvious that flood management strategies and action plans at a catchment scale require the identification and classification of flood-prone areas [14]. Flood-hazard assessment along with flood-hazard mapping is an essential step to identify potential flood-hazard areas under extreme rainfall events. Flood-hazard assessments conducted through easily read and rapidly accessible charts and maps aid in the identification of areas at risk of flooding. Hazard maps can also be adopted in land use and development planning, as part of a holistic approach for flood preparedness that can promote future land developments and community awareness. In addition, flood-hazard mapping can help prioritize mitigation and response efforts in order to decrease the impact of possible flood events in the future [15,16,17].
Multi-Criteria Decision Analysis (MCDA) is a decision-making tool developed for the solution of complex-decision problems. In the case where a plethora of criteria are involved, confusion can arise unless a logical and well-structured decision-making process is followed [18]. After the criteria are ranked according to their relative importance, the weight of each criterion is usually defined following the Analytical Hierarchical Process (AHP). AHP is a semi-quantitative, flexibly structured technique designed for hierarchical representation of a decision-making problem, where a large number of interrelated objectives or criteria are involved [19,20]. Geographic Information System (GIS) is, similarly, an important tool which provides the capacity to design geospatial identities and analyzes and manipulates spatial information. This information can be managed and organized through attribute tables. The tabulated data, which are linked to geographic features, can contain qualitative and quantitative information. Calculations can be conducted to reveal spatial trends and relationships between overlaid data, retrieving important information for decision making [21]. The results can be visualized and presented via maps. MCDA, when integrated with Geographic Information System (GIS), results in GIS-based MCDA, which is one of the most useful and robust methods that combines and converts the input criteria map layers into a final map that is a spatial decision tool, and very useful for policy makers [18,22]. GIS-based MCDA methods along with AHP have become quite popular for spatial planning and management issues. Such approaches are also quite common in the geoscience fields, such as landslide susceptibility analyses [23,24], landscape neotectonic deformation assessment [25,26] and soil erosion [27], as well as in flood-hazard assessment studies [15,28,29]. Approaches that combine the use of GIS-based MCDA in flood-hazard assessment were applied in urban areas in Belgrade, Serbia [30], in arid and semi-arid areas in Riyadh, Saudi Arabia [31], in the coastal area of Maharashtra, India [32] and in the fast-urbanizing area of Eldoret Municipality in Kenya [33].
In Greece, several researchers use GIS-based MCDA methods to assess potential flood-prone areas, e.g., in Kassandra Peninsula (northern Greece) [34], in Rhodope-Evros region (northern Greece) [15], in Thessaly (central Greece) [35], in northeastern Peloponnese (southern Greece) [36] and in the drainage basin of the Pinios River (western Greece) [37]. Additionally, GIS-based MCDA methods have been applied for flood-hazard assessment and mapping in the broader Attica Region [38], in the metropolitan urban area of Athens, the capital of Greece [8], as well as in the burned urban area of the northeastern part of Attica Prefecture [17].
This paper aims to assess and map the flood-hazard in the catchment of the Megalo Rema River, a flood-prone peri-urban area in the greater southeast Mesogeia region of Eastern Attica, Greece. For this purpose, a methodology based on the application of a GIS-based MCDA was conducted and applied for the first time in this study area. The GIS-based MCDA involved various factors such as slope, distance from stream channels, land cover, elevation and geology, which were selected by the experts as the most critical factors contributing to flood-hazard. The weight of each factor/criterion was defined following the AHP [39,40] after they were ranked according to their relative importance based on the experts’ experience in flood-hazard analysis. Morpho-climatic characteristics of the basin were also taken into account. Thus, this study tries to address the implications of GIS-based MCDA on flood-hazard assessment by setting the factors influencing the specific basin and the determination of the pairwise importance values in a different manner from other similar studies. Flood-hazard assessment and mapping lead to the identification of areas at risk of flooding, and consequently provide a tool for the improvement of flood risk management and disaster risk reduction actions in the study area.
2. Study Area
The Megalo Rema River, located in East Attica, Greece, is an ephemeral stream and drains an area of approximately 115 km2 (Figure 1). The drainage basin reaches a maximum elevation of 950 m at its northeastern border (Penteli Mt.). The catchment includes the residential areas of the Rafina, Pikermi, Ntaou Penteli, Pallini, Gerakas, Anthousa and Glika Nera regions with a total population coverage of ~117,000 residents. The sixth order (according to Strahler’s [41] ordering system) main stream channel has a length of 25 km and follows a WSW–ENE flow direction. It discharges into the South Evoikos Gulf where the town of Rafina is located, with a population of ~13,000 inhabitants.
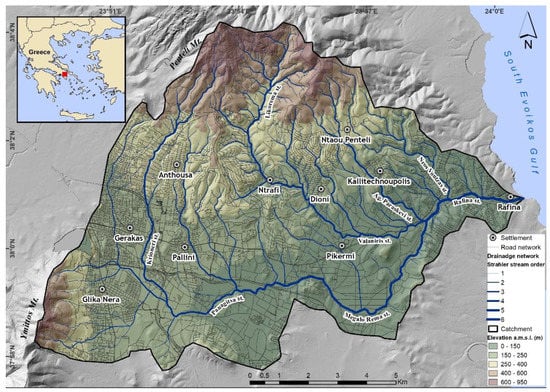
Figure 1.
Shaded Digital Elevation Model map of the Megalo Rema drainage network and catchment. Inset map shows the location of the study area.
In the asymmetric Megalo Rema basin the drainage system is well developed north of the main channel, whereas to the south a few channels of low order exist (Figure 1) [42]. The catchment can be divided geomorphologically into two areas: (a) the relatively mountainous northern part of rough relief consisting mainly of metamorphic rocks (schists and marbles) from the Mesozoic age belonging to the autochthonous Almyropotamos geotectonic unit, and (b) the southern area of lower elevations, gentle slopes and a generally smoother relief that is composed mainly of lacustrine marls, silts, marly limestones and conglomerates of the Upper Miocene age [43,44].
The climate of the study area is typically subtropical Mediterranean, with prolonged hot and dry summers succeeded by considerably mild and wet winters. The mean annual precipitation ranges from 362 mm at the mouth of the river to 473 mm in the SW part of the catchment at Mount Ymittos, while the mean annual air temperature is 17.2 °C. The rainy period begins in October and ends in March.
The Megalo Rema drainage network is part of the GR06RAK0003 potentially significant flood risk (PSFR) zone, which was defined by the Greek Special Secretariat for Water (SSW) [45] under the European Council (EC) Floods Directive 2007/60/EC [46]. The Megalo Rema catchment is an area greatly prone to flash flooding. It is estimated that over the last twenty-seven years, one flash-flood event occurred every 2.7 years [47]. In addition, more than thirty-two flood events have affected the area between 2004 and 2014, with eighteen of these characterized as significant flood episodes based on the hydrological response intensity of the study catchment. The application of a system based on the coupling between the Weather Research and Forecasting (WRF) numerical weather prediction model and its hydrological extension package (WRF-Hydro) by Giannaros et al. [48] showed that the majority of the flash flood events in Megalo Rema catchment took place during the wet period of the hydrological year and were associated with typical, for the study area, wet-season cyclonic activity [49]. This is due to the global atmospheric circulation during the autumn and winter, which interacts with the complex geomorphology and land-sea temperature contrast in the Eastern Mediterranean region, favoring the development of cyclonic atmospheric conditions [50]. In particular, the flood episodes of the study area were driven by low-pressure systems, which, in most cases, affected the catchment while moving from the west towards the east [49]. However, the recent extreme flood events in Europe, caused by an abnormality in cyclonic seasonal activity, show an increase in rainfall intensity and a rise in frequency of flood rates due to climate change [51]. In Greece, even though the precipitation levels are predicted to decline an average of 17% annually, the flood hazard is expected to rise, thus increasing the cost of direct damage from floods up to 10% annually [52]. This means that flood rates and the period of occurrence of past events may not be reliable in the future due to climate change. Moreover, large wildfire-burn territories, increased urbanization, mild topographic slopes and the absence of efficient inundation protection make the catchment greatly prone to flash-flooding [42,49].
3. Materials and Methods
3.1. Flood-Hazard Criteria
For the flood-hazard assessment, a GIS-based MCDA was implemented (Figure 2). The analysis was based on five factors relevant to flood-hazard as documented in the literature [53]. The selected factors include slope, elevation, distance from the channels of the higher order streams, hydro-lithological characteristics of the geological formations and land cover. These factors control the water route when drainage system capacity is exceeded by high runoff and have been proved effective when included in flood-hazard assessment studies and applications [8,15,17,38].
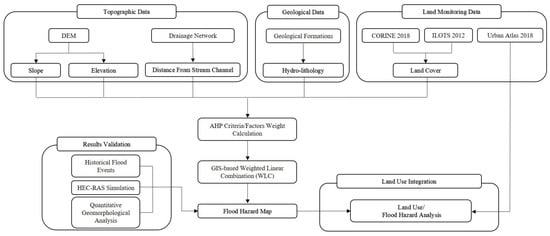
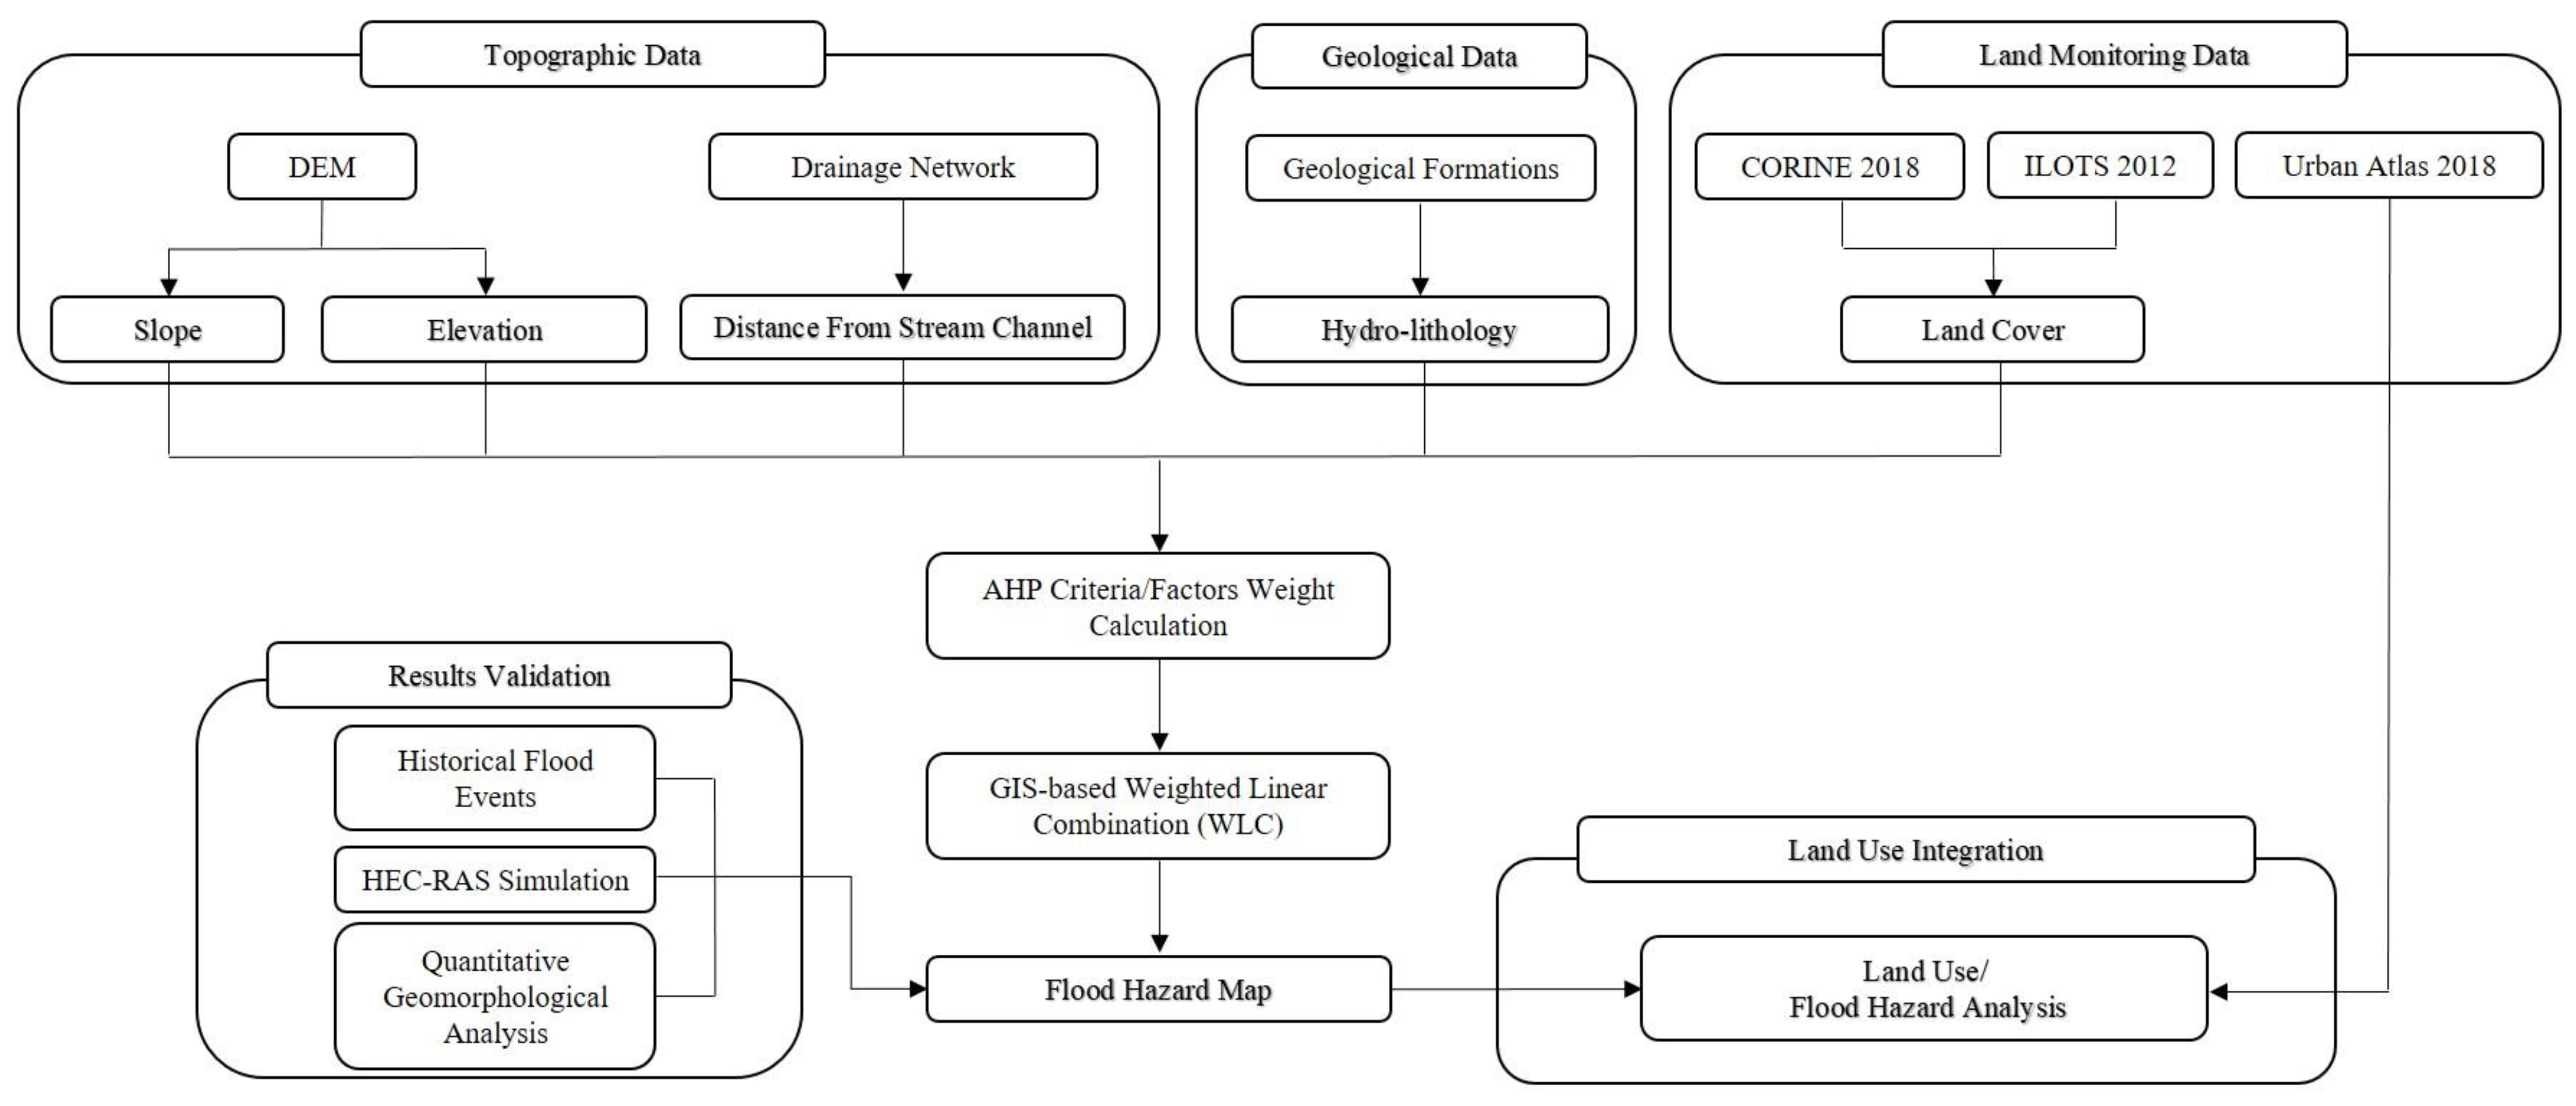
Figure 2.
Flow diagram of the methodology for the present study.
A crucial step in the flood-hazard assessment methodology was the classification of all of the factors. Hence, each factor was divided into classes with specific boundary values. The classes of the involved factors have to be standardized to a uniform suitability rating scale. The standardization method used in the analysis was consistently based on a five- and three-grade scale, according to the hazard level each criterion contributes to the total flood-hazard. Integer numbers, ranging from 0 to 4 and 1 to 3, were assigned to every class of the five- or three-grade scaled criteria, respectively. The class which was rated as 0 represented no hazard level whereas the one rated as 4 represented a very high hazard level. Thus, each of the five factors involved in the flood-hazard assessment is represented by a spatial distribution map of the classified values, reclassified to a regular scale, and then by a thematic map of the spatial distribution of the standardized values.
3.1.1. Slope
Surface runoff and the water accumulation process in any geomorphic setting relies upon its surface slope appropriation [54]. Water flows from higher to lower elevations, which therefore means that slope influences the amount of surface runoff and infiltration. Flat and gently sloping areas (0–18°) in low elevations are more prone to flooding [55]. In these areas, the surface water runoff is usually accumulated easier and, as a result, intense precipitation can flood these low-slope areas faster than areas in higher elevation with a steeper slope.
The slope of the study area was computed utilizing ArcGIS/ArcMap ESRI® by inputting elevation data derived from the detailed 5 m resolution DEM of the catchment, obtained from the Hellenic Cadastre (Ktimatologio S.A.). The resulting slope map consists of a 5 m resolution raster layer which was then converted to a vector layer, which represents the steepness of the terrain of the study area in degrees. The slope values were classified into five classes, based on the correlation of the slope with previous flood events. The classes were assigned a value from 0 to 4. Therefore, the gently sloping parts (≤2°, 2–6°, and 6–12°) of the catchment are considered as prone to flooding areas and were assigned the rating of 4, 3 and 2, respectively (see Table 4). Steeper parts of the area with a slope between 12 and 20° and >20° were assigned the ratings of 1 and 0.
3.1.2. Distance from Stream Channels
River-overflows are crucial for the initiation of a flood event. According to Predick and Turner [56], proximity to the stream channel critically increases the possibility of experiencing a riverine flood event. During extreme rainfalls, high discharges often cause a rapid rise in river level, leading to an overflow of water from the riverbed and inundating the surroundings. Hence, regions situated near rivers endure frequent flooding [57]. In contrast, areas far from stream channels generally have a lower probability of flooding, since the likelihood of being within the flood-induced riverbed is lower.
Areas near the stream channels are considered to have a high flood-hazard, whereas the effect of this parameter decreases with distance from the channels. It is obvious that there is no universal agreement on the critical distance that can have higher susceptibility, and this distance changes from river to river. In this study, the distance from the stream channel was taken into account in an analogical manner, by comparing the distances which were used in similar studies in correlation with the catchment size (see [8,15]).
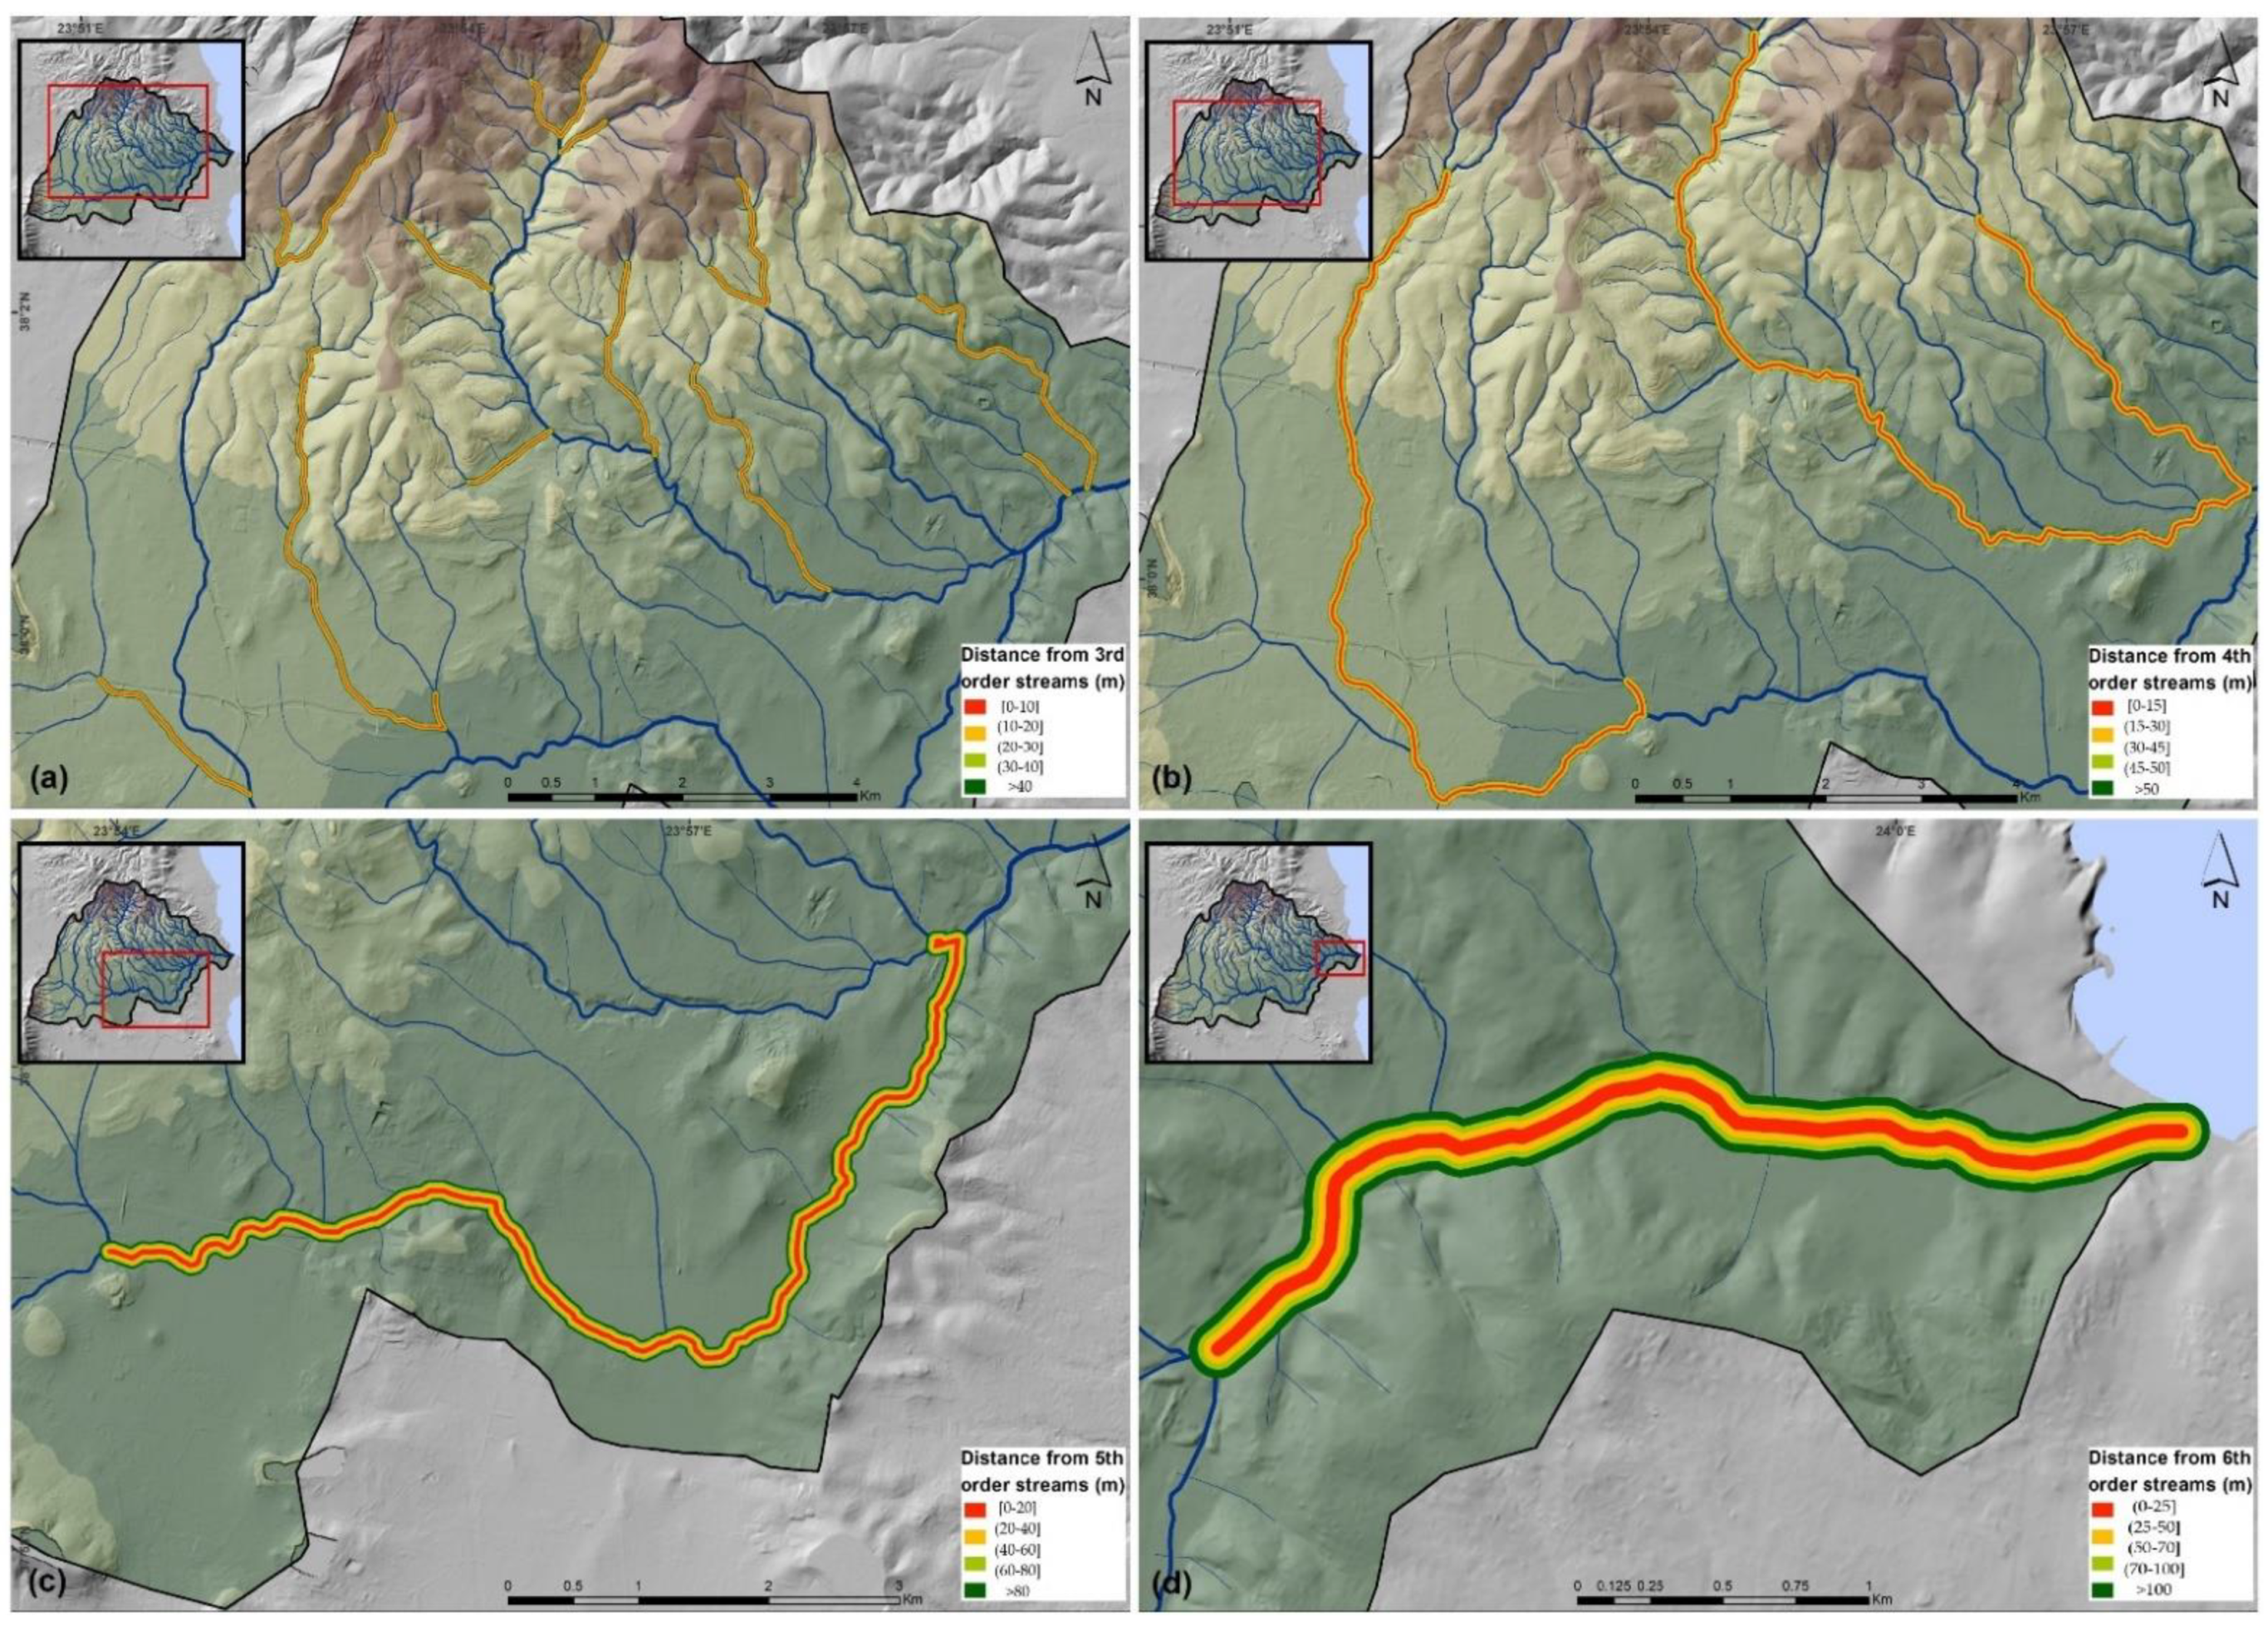
The drainage network was acquired from the 1:5000 scale topographic maps of the Hellenic Military Geographical Service. This factor was calculated by imposing buffer zones within the ArcMap interface, by creating polygons enclosing the area on either side of the higher order stream channels, for each given distance from the channel. Records of historical floods in the study area [49] as well as the results of the simulation of the river hydraulics’ behavior—using the Hydrologic Engineering Center’s River Analysis System (HEC–RAS) developed by U.S. Army Corps of Engineers Hydrologic Engineering Center in GIS Environment—for the last 4 km before the river mouth [47], were particularly useful in defining the classes of this criterion. For the third order stream channels of the drainage network, 10, 20, 30, 40 and >40 m buffer zones were generated. Around the fourth order stream channels, buffer zones at the distances of 15, 30, 45, 50 and >50 m were created. For the fifth order streams, buffer zones at distances of 20, 40, 60, 80 and >80 m from the channels were considered, whereas buffer zones at the distances of 25, 50, 70, 100 and >100 m from the sixth order main channel of Megalo Rema were imposed. The shorter the distance, the higher the hazard level and the assigned value, and the longer the distance, the lower the hazard level and the assigned value.
3.1.3. Land Cover
Several hydrological processes such as surface runoff, infiltration rate and evapotranspiration, as well as interrelationship between surface and groundwater, are being significantly controlled by the land cover pattern of an area. As a result, land cover is considered an important parameter in flood-hazard assessment [58].
An integrated land cover layer of the drainage basin was created by the information obtained from CORINE Land Cover (CLC 2018) of Copernicus Land Monitoring Service and Agricultural Blocks (ILOTS 2012) of the Ministry of Rural Development and Food. The land cover type was classified into five categories: (i) densely urbanized areas, (ii) sparsely urbanized areas, (iii) agricultural land, (iv) land covered by sparse vegetation and (v) forests. Densely and sparsely urbanized areas that support the overland flow of water were assigned the highest ratings of 4 and 3, respectively, whereas forests have been assigned the lower rating of 0 since they favor infiltration.
3.1.4. Elevation
According to several relevant research studies and applications, elevation is one of the dominating factors that control flood occurrence [59,60,61]. Because of the gravitational force, water moves rapidly from upland to lowland areas and the water gets spread over the lower elevated plains, causing inundation [62]. However, it is not possible for a widely agreed flood elevation threshold to be set due to the various morphological/morphometric characteristics of each catchment. The relationship between elevation and flood events in the Megalo Rema catchment shows that almost 82% of the past events occurred in elevations lower than 200 m, while areas of elevations higher than 500 m have not been affected by floods.
The elevation grid of the study area was produced by the 5 m resolution DEM, and elevation values were divided into five categories by evaluating the elevation of the historical flood events in the study area catchment. The low-lying areas, with elevation ≤50 m, were assigned the highest rating 4, since they were considered as more prone to flooding.
3.1.5. Geological Formations
The hydro-lithological characteristics of the geological formations of an area are an important criterion, because they may amplify or extenuate the magnitude of flood events. The presence of permeable formations favors water infiltration while impermeable rocks favor surface runoff.
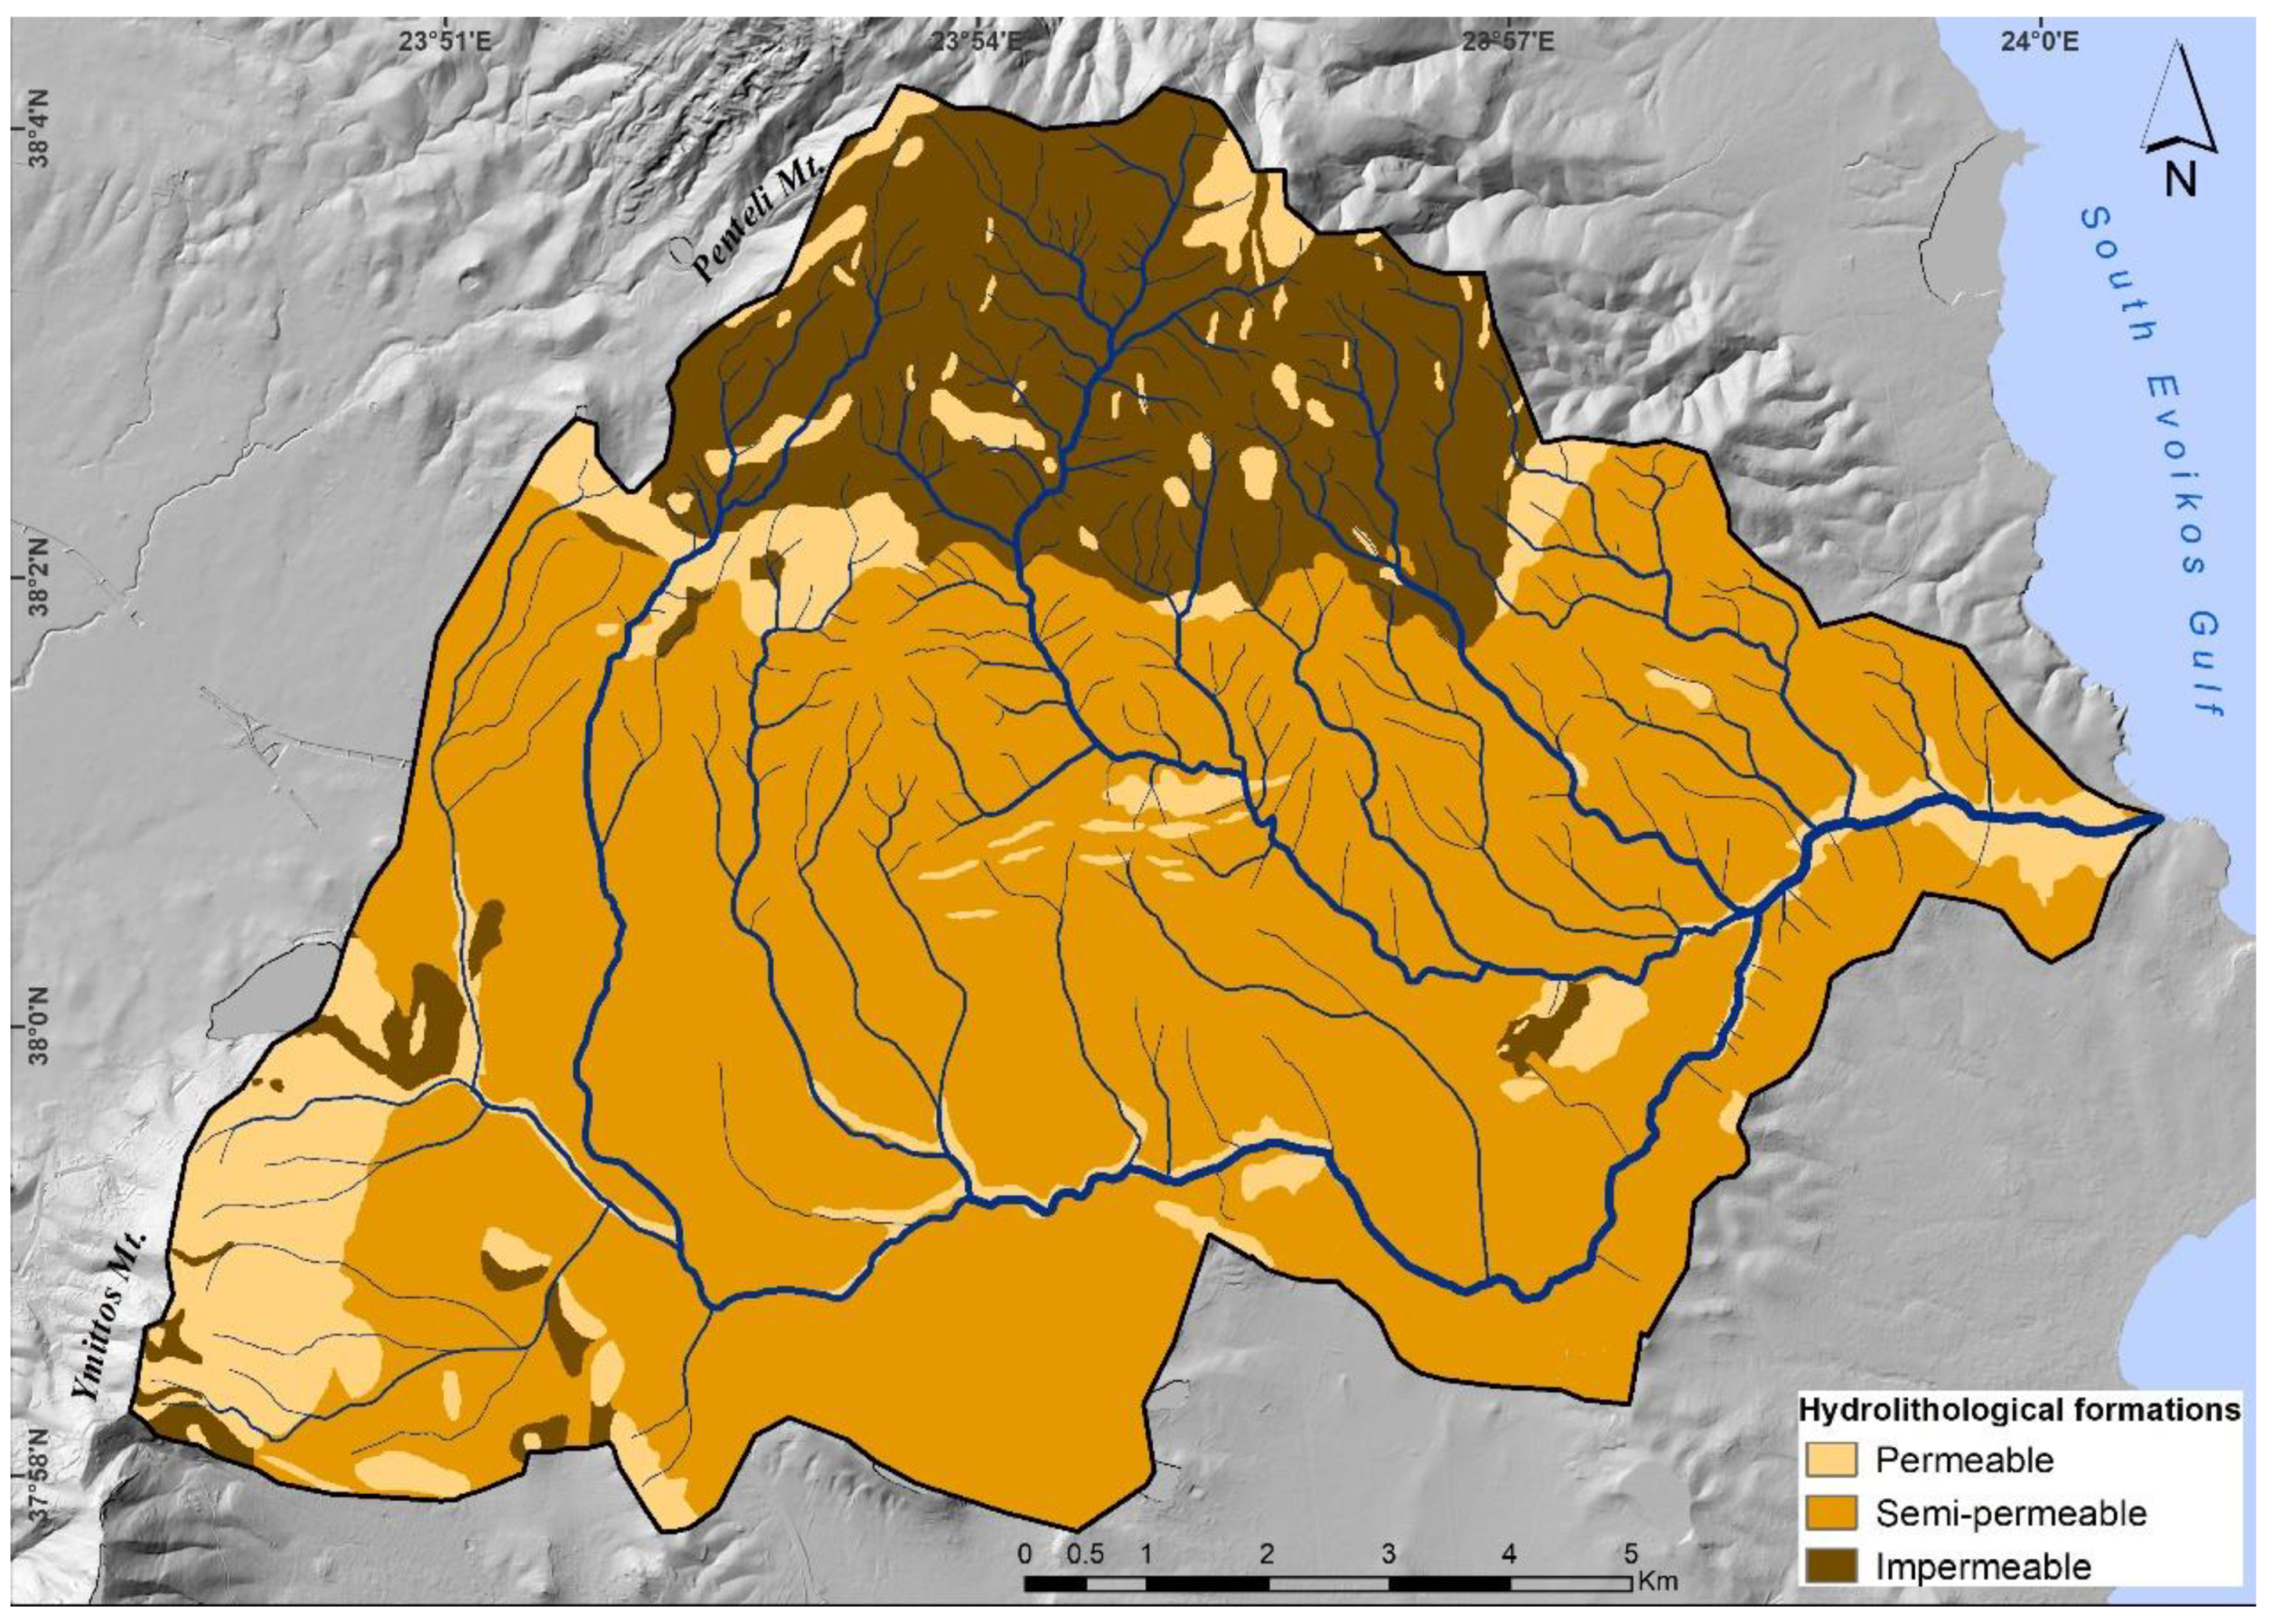
The geological formations of the catchment were derived from the corresponding 1:50,000 geological map of the Institute of Geology and Mineral Exploration [43,44], and were classified according to their hydro-lithological behavior into three categories: permeable, semi-permeable and impermeable. Permeable geological formations include tectonically fractured and karstified limestone and marbles, sandstones and alluvial deposits [63,64]. Marls, conglomerates and silts are considered semi-permeable formations while schist is considered impermeable rock, since the fine-grained material produced by their weathering blocks their fracture system [63]. Higher rating 3 has been assigned to impermeable geological formations due to their lower infiltration capacity.
3.2. Analytical Hierarchy Process (AHP)
The final weights of each factor were defined following the AHP [39,40]. The first step in the AHP was the computation of the pair-wise comparison matrix, where each entry represents the relative significance of each factor/criterion to the others. The method of comparisons per pair is the most commonly used process for the calculation of criteria weight coefficients. AHP is based on the allocation of weights to the criteria used, according to their importance. The relative importance between two factors was measured according to a numerical scale from 1 to 9. The correlation between the numerical values and the intensity of importance was as follows: 1 = equal, 2 = weak or slight, 3 = moderate, 4 = moderate plus, 5 = strong, 6 = strong plus, 7 = very strong, 8 = extremely strong and 9 = of extreme importance. Inversely, less important variables were rated between 1 and 1/9 [19,20]. Completion of the degree of significance between two factors requires field experience, knowledge of the subject and/or the opinion of the experts, who assign the value aij according to their judgment for the relative importance of one criterion over the other [65]. If a criterion has equal importance with the one it is being compared with, then the preference value (aij) is equal to one. If the relative importance of a criterion is higher than the criterion it is being compared with, then aij > 1 and the reciprocal property is aji = 1/aij. When comparing a criterion with itself, the assumption is that aii = 1 for all the n criteria. In this way, a preference table is created (Table 1).

Table 1.
Pairwise comparison matrix of the criteria (preference value: aij = wi/wj, where wi/wj is the relative importance of factor i to factor j).
After assigning the preference values (αij), the columns of Table 1 are summed to Sum_j and then the preference values of each column (αij) in Table 1 are divided by the sum of the corresponding column (Sum_j) and the values are summed again, in rows this time (Row_sumi) (Table 2). Finally, the set of each line (Row_sumi) is divided by the number of variables (n) and the result equals the weighting coefficient (Wi) of each criterion.
Table 2.
Preference values (aij) are divided by the column Sum_i (aij/Sum_j), sum of matrix rows (Row_sumi) and calculation of the weights (row sum divided by n) (Weighting coefficient (Wi)) [66].
AHP requires normalization of all factor weights, which was achieved using the following equation:
After the calculation of the weight values, it is important to verify the consistency of each table matrix. The implication of each one was checked with the Consistency Ratio (CR). This ratio is used to avoid the creation of any incidental judgment in the matrix. When CR < 0.1, an acceptable level of consistency has been achieved, while judgments are tolerated if 0.1 < CR < 0.2 and rejected if CR > 0.2. CR is given by the following equation:
where RI is the Random Index: a constant which depends on the order of the matrix (see Saaty, 1987; p. 171) [67], and CI is the Consistency Index calculated by the equation:
where n is the number of items compared in the matrix and λmax is the maximum value of the eigenvalue that is obtained by the equation:
where = vector coherence (C), Wi = the weighting coefficient estimated according to Table 2 and WVi = weighted sum vector (calculated according to Table 3).
3.3. Weighted Linear Combination (WLC)
The total score of the basic flood-hazard assessment for the study area was calculated with the linear combination of the selected factors/parameters, taking into account the relative weights. This involves superimposing the thematic maps with different weights in a vector-based GIS environment. The inclusion of the estimated factors was performed using the Weighted Linear Combination method, according to the following mathematical formula:
where H is hazard degree, n is the number of factors, Wi is the weight of factor i and Xi is the rating of factor i, as shown in Table 4.
Table 4.
Matrix assigned rate classes for individual factors.
The flood-hazard level scores of the study area were then classified into five classes using the quantile classification method, and the final basic flood-hazard map was created. Class 1 of the lower values corresponds to areas of very low flood susceptibility, class 2 corresponds to parts of the catchment with low flood susceptibility, class 3 to moderate susceptibility, class 4 to high susceptibility and, finally, class 5 of the highest values corresponds to extremely flood-prone areas.
The influence of the uncertainty of the adopted factor weights on the flood-hazard assessment was estimated using the following formula [8,68]:
where ΔS is the error produced by independent errors ΔWi in the weighting coefficient values and Xi is the rating of factor i.
Equation (6) was applied to calculate the error (ΔS). The independent errors (ΔWi) were set as 20% of each original factor weight for all the factors at the same time [8,69]. After, it was multiplied by 1.96 in order to compute 95% confidence level in the suitability values S. The map created by this process was used to calculate the upper and lower S values at 95% confidence level, once by adding it and once by subtracting it from the basic flood-hazard map. The two resulting maps represent the scenarios of maximum and minimum S values for the catchment.
3.4. Verification of the Flood-Hazard Assessment
For verification of the flood-hazard assessment, the spatial distribution of the past 45 severe flood events that occurred in the Megalo Rema River catchment was used, as shown in Figures 7a,b and 8. The geographic distribution of the 45 flood events was produced by plotting, as a map layer, the points referring to the sites affected by severe flood incidences. These flood events, which occurred during the last 30 years, were retrieved from the archives of the Region of Attica, the Hellenic Fire Service, the Hellenic Agricultural Insurance Organization and the Ministry of Environment and Energy. The verification was performed by applying a frequency ratio statistical analysis. For this purpose, firstly, the frequency distribution of flood events was calculated for each hazard level zone of the basic flood-hazard map (see Table 9). Then, the ratio of each flood-hazard level zone area (from very low to very high) to the total area of the catchment was computed. The frequency ratio for each flood-hazard level zone was calculated by dividing the percentage of the events (out of the total 45 events) which appear in each hazard level zone by the area percentage of each hazard level zone area, which is presented in Table 7.
The accuracy of the basic flood-hazard map was also examined, taking into consideration the results of the delineation of the potentially flooded area on both sides of the main channel of the river performed by Andreou et al. [47], by simulating the river hydraulics behavior using HEC–RAS Model in GIS Environment for the main stream channel for about 4 km before the river mouth. Detection of the potentially flooded areas was performed for three different high discharge values that correspond to the peak discharges of the storm events on 22 February 2013, as well as to the discharge values over return periods of 25 and 50 years, respectively. Furthermore, the results of the quantitative geomorphological analysis regarding irregularities in the hierarchical drainage by stream order performed for the Megalo Rema (Rafina) drainage network by Karymbalis et al. [42] were considered.
Finally, to obtain a preliminary assessment of the impacts of the flash flood events on the socio-economic activities of the study area, land use of the catchment was identified utilizing the Urban Atlas 2018 data of Copernicus Land Monitoring Service (see Table 8). Initially, twenty-one land use types were recognized and further grouped into eight categories according to the density of the urban fabric, the sector of economy and the vegetation density. The percentage of each one of these socio-economically and environmentally important land use classes that occupy each flood-hazard level zone of the final map was estimated by overlaying the layer of land use to the basic flood-hazard map.
4. Results and Discussion
4.1. Factor Classification
Thematic maps in Figure 3, Figure 4 and Figure 5a illustrate the spatial distribution of the parameters’ values of slope, distance from stream channels and land cover in the catchment after their classification into five groups according to their impact on flooding.
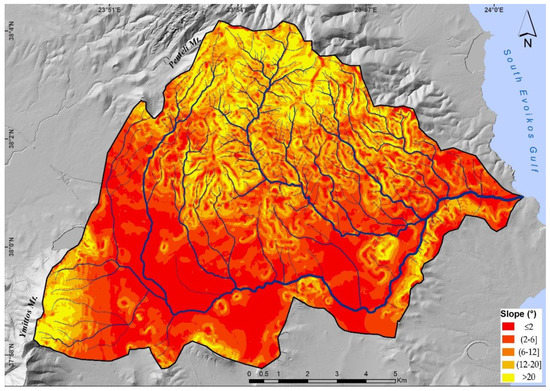
Figure 3.
Thematic map showing the five classes of slopes. According to the rating adopted in the methodology, the five classes of slope were assigned the rating values as shown in Table 4.
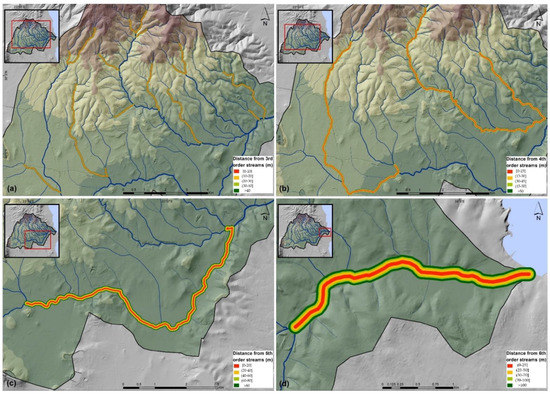
Figure 4.
Thematic maps showing the distance from the stream channels for the third order streams (a), the fourth order streams (b), the fifth order streams (c), and the sixth order stream (d). The classes were assigned to the five-grade rating scale according to Table 4.
Figure 5.
Thematic maps showing the five classes of the land cover type (a) and the elevation (b) that were assigned to the five-grade scale according to Table 4.
Regarding “slope”, the range of the slope values lie between 0 and 44°. The thematic map of this criterion shows that a significant part of the study area (approximately 54% of the total catchment area) belongs to the highly and very highly susceptible to flooding gently sloping zone, since it is characterized by low (≤2°) and very low (2°–6°) slope values (Figure 3). On the contrary, about 10% of the catchment area has slope values >20° and is characterized as having very low susceptibility to flooding. The classes were assigned these rating values as depicted in Table 4. The highest slopes are found at the northern, and southwestern parts of the study area where the mountainous landscapes of Penteli and Ymittos Mountain exist, as well as at the hilly area along the southeastern water divide.
According to the ranking followed for the criterion “distance from the stream channels”, riparian areas in immediate proximity to the channel bed of the higher Strahler’s steam order of the drainage network are highly and very highly susceptible to flooding. These areas are located along the main channels of Megalo Rema and its major tributaries Valanaris and Krioneri (Figure 4).
Dense and sparse urban areas, which are highly and very highly susceptible to flooding, primarily dominate the western and eastern parts of the catchment, while the southern part of the study area along the main stream channel mainly hosts agricultural activities (Figure 5a). The mountainous parts of the catchment are less susceptible to floods, in terms of the land cover parameter, since they are covered by forests and sparse natural vegetation.
The elevation of the catchment ranges from 0 to 950 m. High-elevation (between 200 m and 500 m, as well as higher than 500 m) appears in the northern and western mountainous parts of the catchment. On the contrary, the lower elevation zones more susceptible to flooding (≤50 m and 50–100 m) are located on both sides of the main stream channel at the eastern and southern portions of the catchment (Figure 5b).
The classification of the geological formations of the catchment into three groups according to their hydrogeological behavior showed that the prevailing geological formations belong to the semi-permeable group (Figure 6). The northern part of the catchment is dominated by impermeable rocks, whereas the westernmost part, as well as the broader area of the river mouth, is covered by permeable geological formations.

Figure 6.
Thematic maps showing the classes of the hydrological formations that were assigned to the three-grade scale according to Table 4.
4.2. Multi-Criteria Decision Analysis (MCDA)—Flood-Hazard Assessment
The thematic maps of the spatial distribution of the five factors (Figure 3, Figure 4, Figure 5 and Figure 6) were used as inputs in the MCDA. All values of all the parameters involved are classified into five classes and assigned to a uniform suitability five-grade rating scale. Higher classified ranking values correspond to areas more susceptible to floods, while lower values correspond to less flood-prone areas. Table 4 includes the factors/parameters, their classes and their ratings. All the parameters are assigned with ratings from 0 to 4, whereas the geological formation classes are assigned with ratings of 1 to 3, since there are no ideally permeable or impermeable geological formations. For this reason, the ratings 0 and 4 were not selected.
The results of the AHP procedure, the extraction of criteria weights and the calculation of the CR are shown in Table 5.
Table 5.
Values of the pairwise comparisons were obtained according to experts’ judgments based on their experience in flood-hazard analysis. The values in the table represent the mode of the values suggested by the experts. The table continues with the calculation of weighting coefficients and calculation of CR. (F1: Slope, F2: Distance from stream channel, F3: Land cover, F4: Elevation, F5: Geological formations, W: weights, WV: vector of weighted sum, C: coherence vector, λ: maximum value of eigenvalue, CI: consistency index, CR: consistency ratio).
The calculated CR (Table 5) in this study is 0.019 (lower than the threshold 0.1) within the range for the acceptance of the consistency of judgments in the pairwise comparison matrix. Consequently, the weights’ consistency is affirmed.
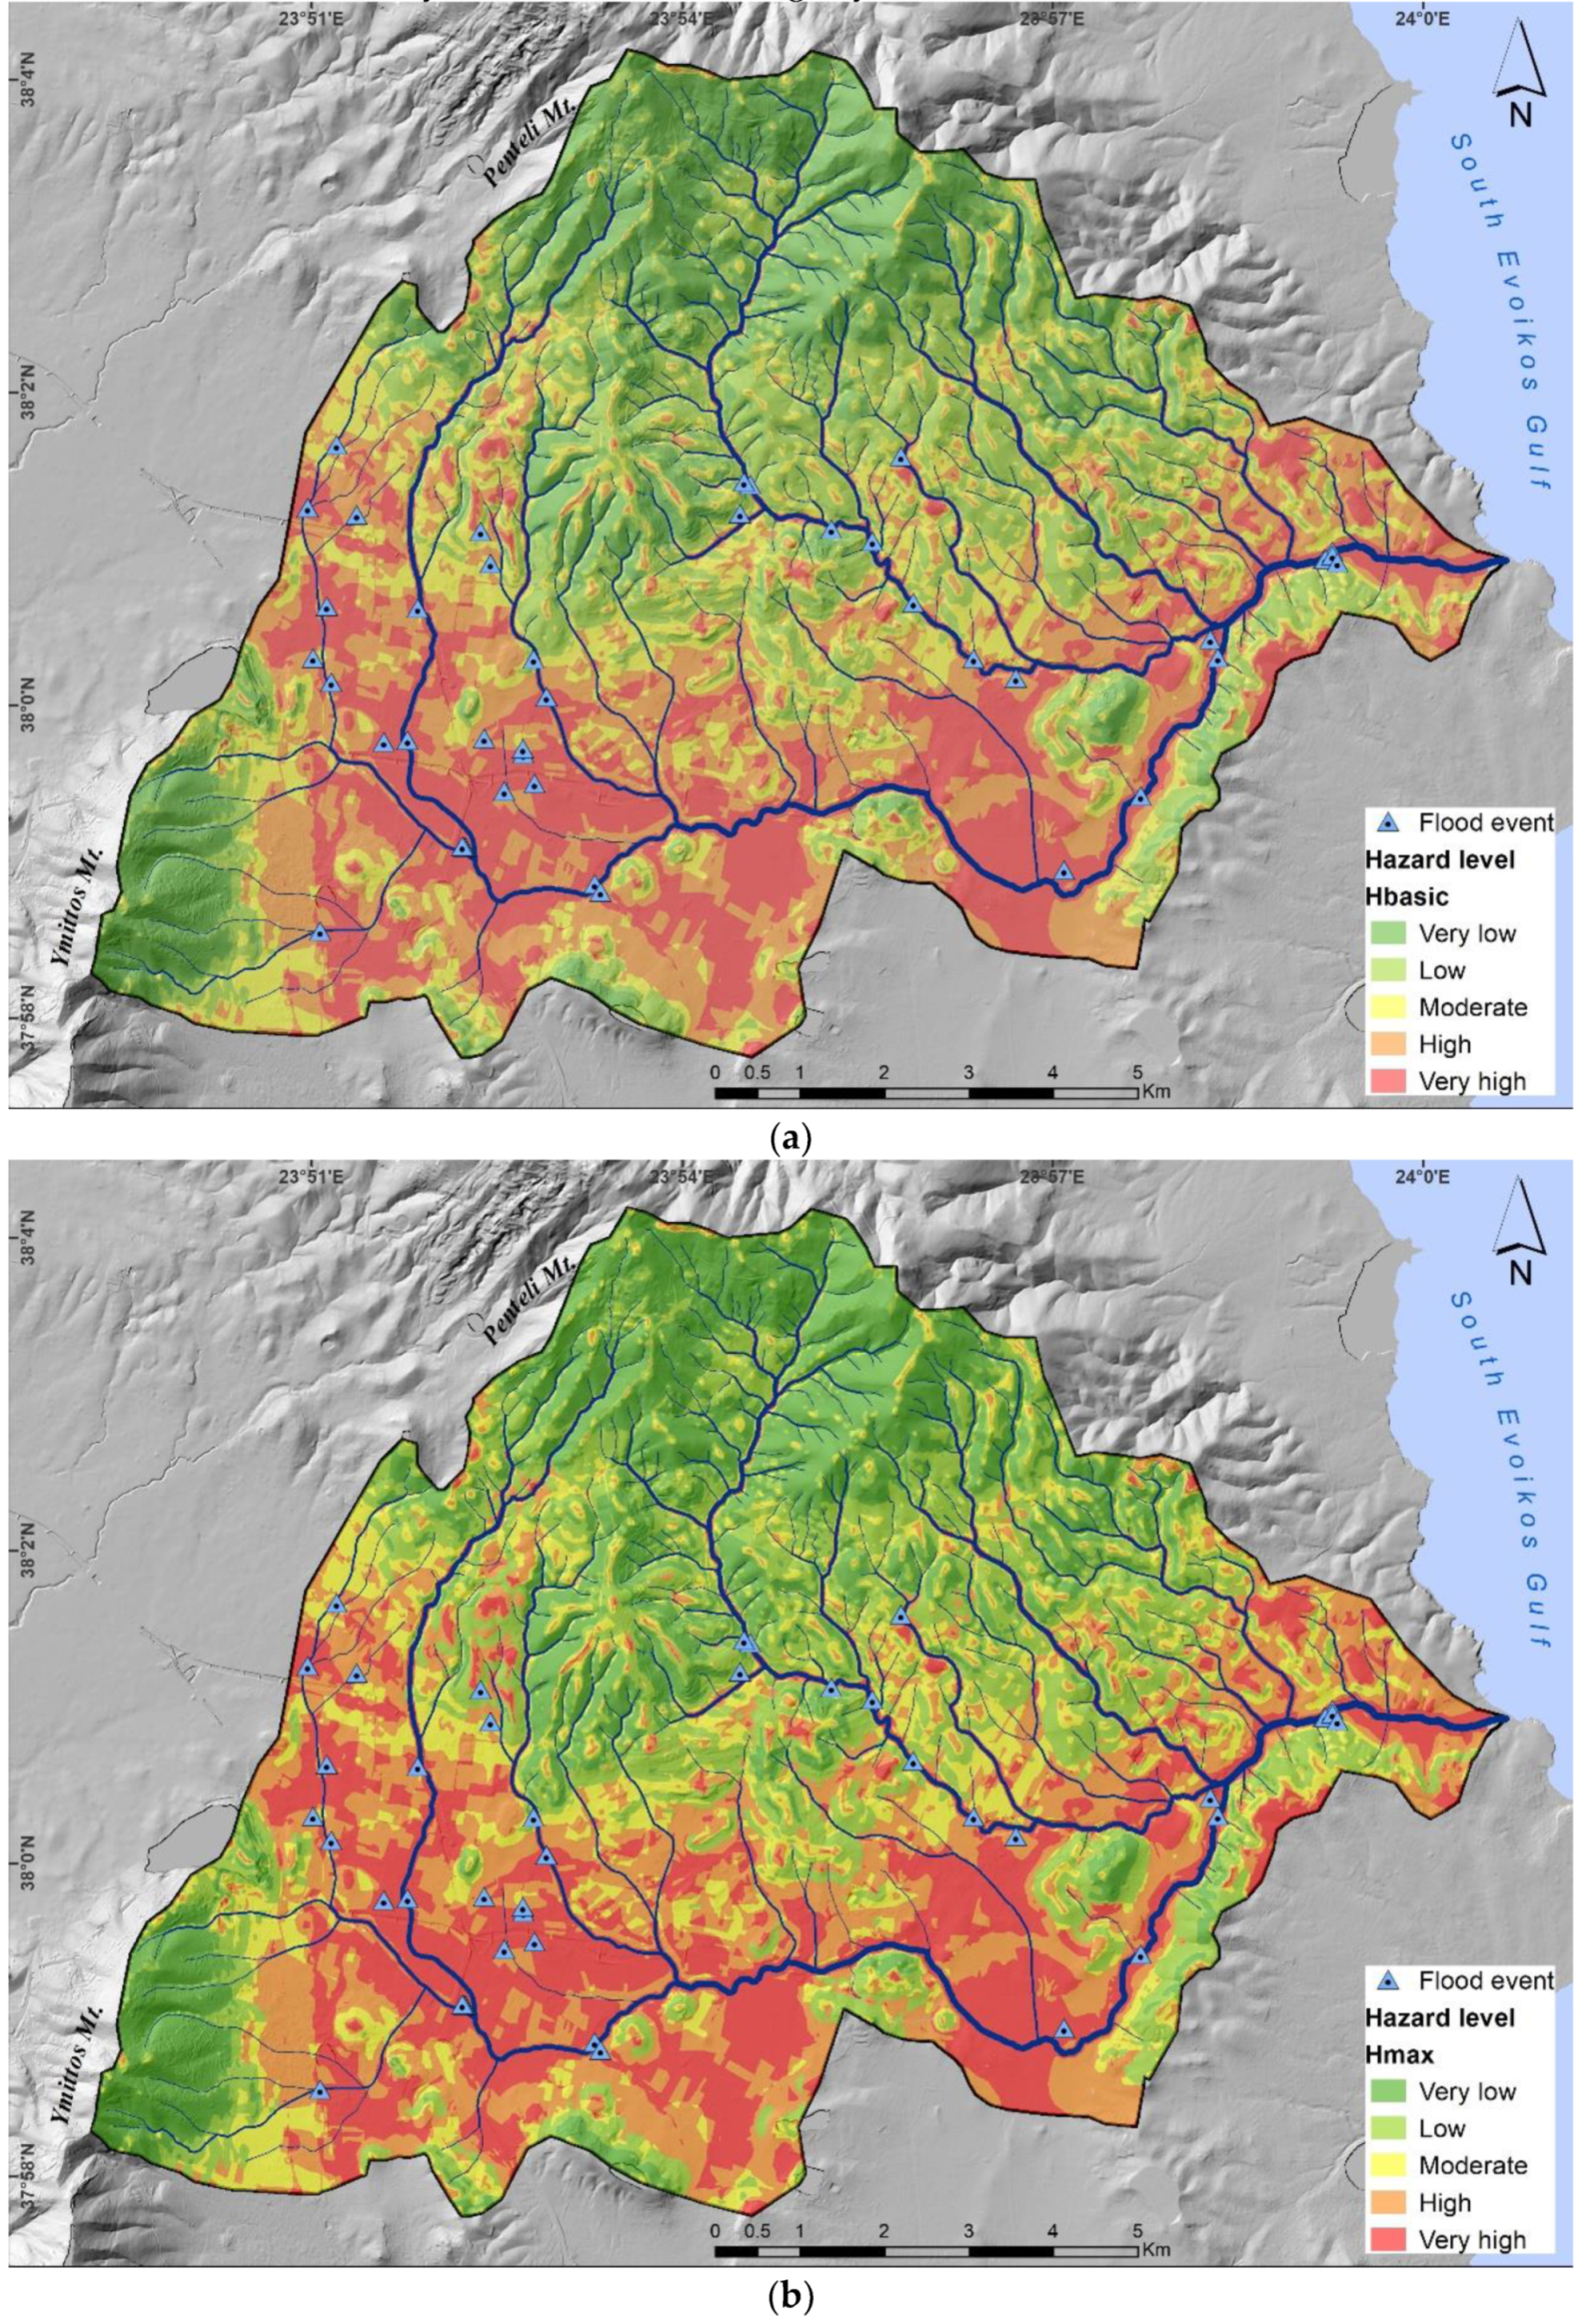
As described in the methodology, the flood-hazard level values were calculated following the WLC procedure, using the classified and normalized values of the five criteria involved and their weighting coefficients (Table 4 and Table 5). The final basic flood-hazard assessment map (Hbasic) is presented in Figure 7a. It was produced after the reclassification of the flood-hazard level values into five categories (from very low to very high) with the quantile classification method. In addition, two other maps characterizing the maximum (Hmax = Hbasic + ΔS) and minimum (Hmin = Hbasic + ΔS) flood-hazard level values were produced (Figure 7b and Figure 8) after the examination of the influence of uncertainty of the adopted factor weights on the flood-hazard assessment. This was necessary since uncertainty plays an important role in natural hazard evaluation [70,71] and can bias the outcome of every hazard assessment. The uncertainties of the weighting coefficient for each factor (ΔWi) are shown in Table 6.

Figure 7.
Maps illustrating (a) the basic flood-hazard (Hbasic) assessment map and (b) the higher (Hmax) values of the flood-hazard assessment.
Figure 8.
The lower (Hmin) values of the flood-hazard assessment.
Table 6.
The uncertainties (ΔWi) of the weighting coefficient for each factor.
Regarding the spatial development of the five flood-hazard zones, the percentages corresponding to the area of each hazard zone for the three flood-hazard assessment maps (Hbasic, Hmax and Hmin) of Figure 7 and Figure 8 are included in Table 7. An area of 26.3 km2, which corresponds to the 22.7% of the total catchment, belongs to the high flood-hazard zone, while 24.7 km2 (some 21.3% of the catchment) is very highly prone to flooding. The areas of the high flood-hazard zones of the maximum flood-hazard assessment value map (Hmax) are negligibly increased compared to the corresponding zones of the basic map (Hbasic), whereas the areas of the very high flood zone are negligibly lower. This similar comparison proves that the spatial extents of moderate hazard zones decrease, while the moderate, low and very low hazard zone increase. Comparing the zones of the map of the minimum value of the flood-hazard assessment (Hmin) to those of the basic map (Hbasic), the areas of high and very high flood-hazard zones decrease, whereas the moderate, low and very low hazard areas slightly increase.
The resultant flood-hazard assessment maps indicate that the areas of very high and high flood-hazard are distributed mostly on the lower reaches of the Megalo Rema River, along the main stream channel and around the mouth of the River (Figure 7a,b and Figure 8). Additionally, an extensive low-lying area at the southern and western parts of the catchment belongs to the zones of high and very high flood-hazard risk. The flood-hazard map shows that the urban areas on both sides of the main channels of the drainage network are more prone to flooding. It is evident that these parts of the catchment are relatively low-lying, of gentle slope and densely populated. They include residential areas of the Rafina-Pikermi, Penteli, Pallini, Peania, Spata, Glika Nera, Gerakas and Anthousa settlements, with a total population of ~85,000 residents. This high population density is directly associated with the urbanization of this area, which increases the surface runoff during extreme rainfall events and contributes to an increased human exposure and social vulnerability to the flood-hazard. The northern and the southwestern mountainous parts of the study area are low and very low flood-hazard areas. Limited regions at the central part of the catchment are classified as being of high and very high flood risk; those that are include the settlements of Dion, Kallitechnoupolis and Drafi.
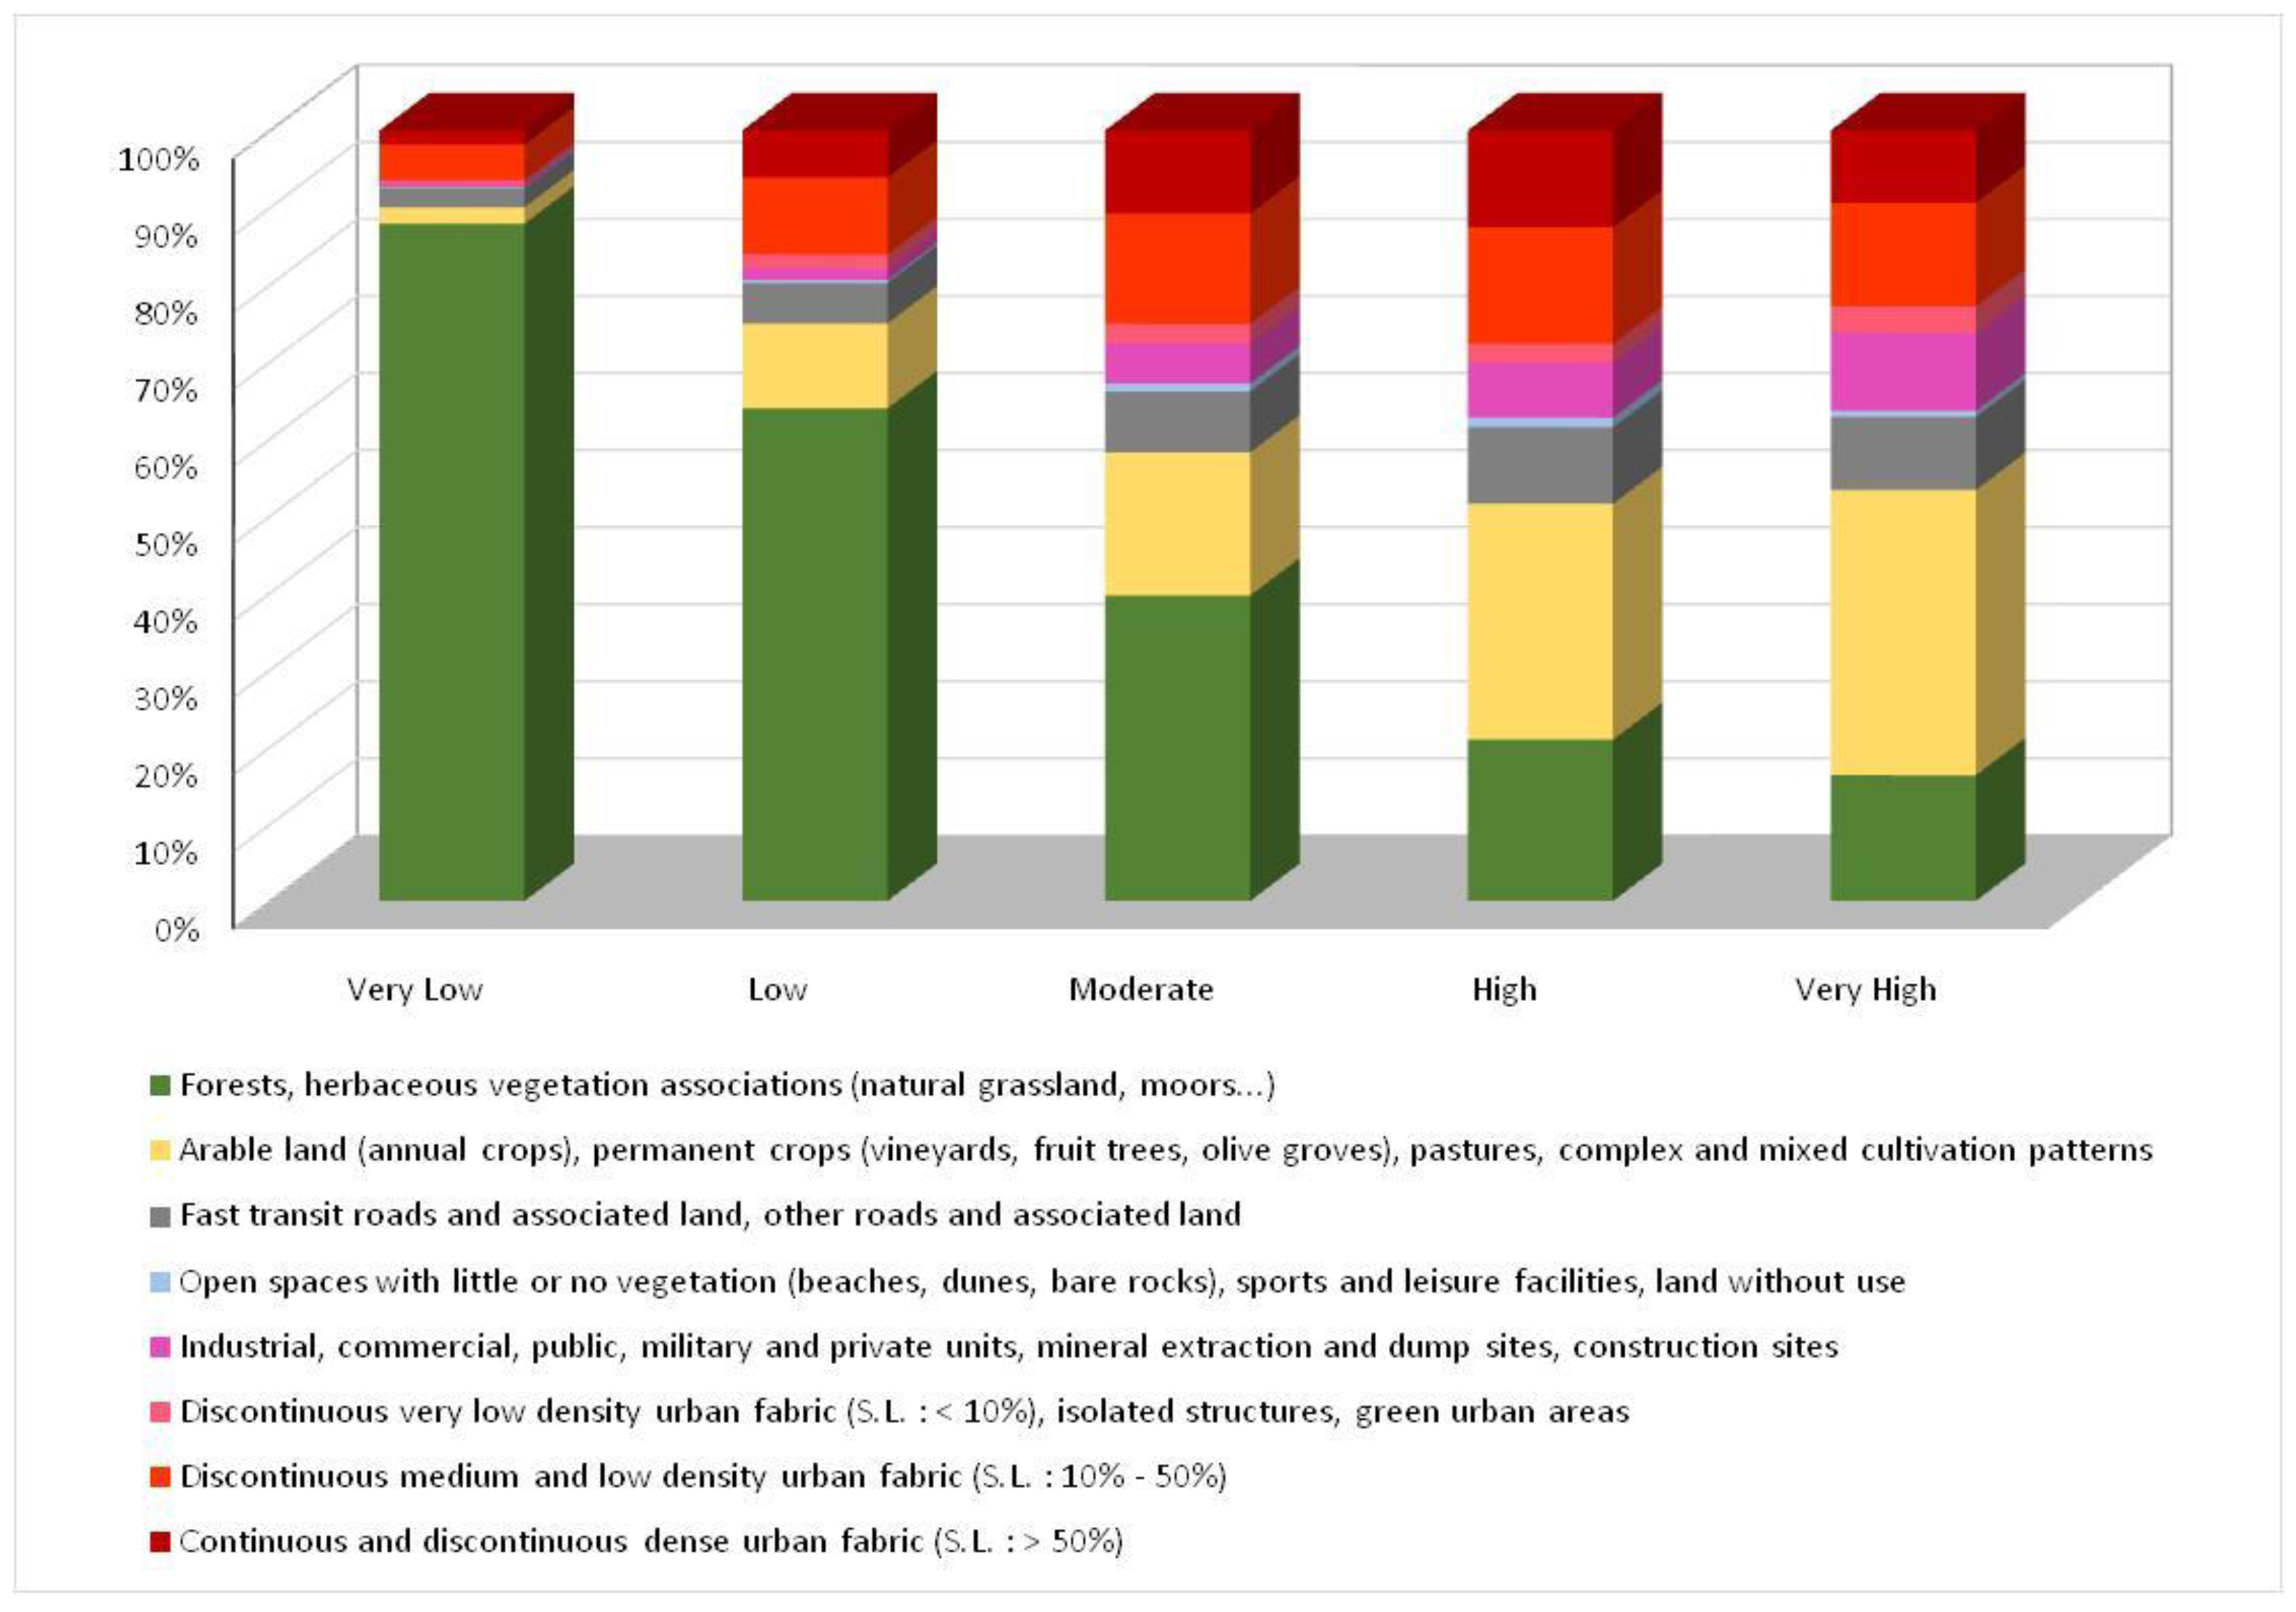
The distribution of land use in the susceptible to flooding zones of the Hbasic flood hazard map is illustrated in the bar charts of Figure 9. Accordingly, 30.6% and 37.0% of the high and very high flood-hazard zones are occupied by agricultural land and related activities. Significant parts of the highly prone to flooding areas correspond to continuous and discontinuous dense urban fabric (12.6%), discontinuous medium- and low-density urban fabric (15.1%) and industrial, commercial, public and private units and construction sites (7.2%). Similarly, dense urban fabric, medium- to low-density urban fabric and industrial, commercial, public and private units and construction sites constitute 9.4%, 13.5% and 10.1% of the very high flood risk zone, respectively. It is worth noting that some 9.9% and 9.5% of the high and very high flood-prone areas, respectively, consist of road network and associated land. Very low to moderate prone areas appear mainly at forests and areas covered by natural vegetation (see Table 8).
Figure 9.
Distribution of land use according to flood-hazard level.
Table 8.
Area of each land use type in Megalo Rema catchment, according to Urban Atlas 2018 data of Copernicus Land Monitoring Service.
The analysis performed by Giannaros et al. [48] in an attempt to introduce an operational impact-based warning system in the area, coupling a state-of-the-art numerical weather prediction model with an advanced, spatially explicit hydrological model, provided some preliminary discharge thresholds in terms of flash flooding’s socioeconomic impacts. Minimal impact was reported when the peak discharge in the mouth of Megalo Rema was lower than 20 m3/s, whereas maximum stream discharges that ranged from 20 m3/s to 40 m3/s were associated with major impact. Significant impact was induced by events that were characterized by peak stream flows higher than 40–60 m3/s. These thresholds are considered as preliminary since their reliability is mainly moderated due to the lack of discharge data along the entire length of the Megalo Rema stream [48].
The flood-hazard assessment map provides valuable information for land-use planning at a regional scale, leading to the determination of safe and unsafe areas for urban development [72,73]. Even though hazard maps represent a snapshot situation regarding flood-hazard level variation within the catchment, they could still support policy makers with knowledge for future planning. This is very important, particularly for the study area, since the land cover properties are constantly changing. This can be attributed primarily to two factors: forest fires that devastated a significant part of the forested land of the area and the increased urbanization rate of the area, especially during the last 40 years. The increase in the population of the Municipality of Rafina-Pikermi and Penteli for the period between 1981 and 2011 was estimated up to 70% and 60%, respectively (Source: Hellenic Statistical Authority). One of the main reasons for this positive population growth is the construction of several public works in this area (i.e., the new international airport of Athens in Spata, the Attiki Odos motorway and the developing Rafina port), which contribute to a significant increase in private building activity in the neighboring settlements and Municipalities [74].
4.3. Verification of the Flood-Hazard Map’s Accuracy
The accuracy of the basic flood-hazard map was verified by means of the frequency ratio and flood events which affected the study area over the past 30 years. The findings established that the vast majority of the flood events, almost 89% (40 out of 45 incidents), occurred within the limits of the high and very high flood-hazard zones (Table 9). The frequency ratio is higher than one in the high and very high flood-hazard zones, which is indicative of the strong positive correlation between the hazard zones and the flood occurrences, since the flood-hazard intensity raises as the frequency ratio values increase (Table 9).
Table 9.
Frequency ratio values of flood events in the flood-hazard zones of the basic map (Hbasic).
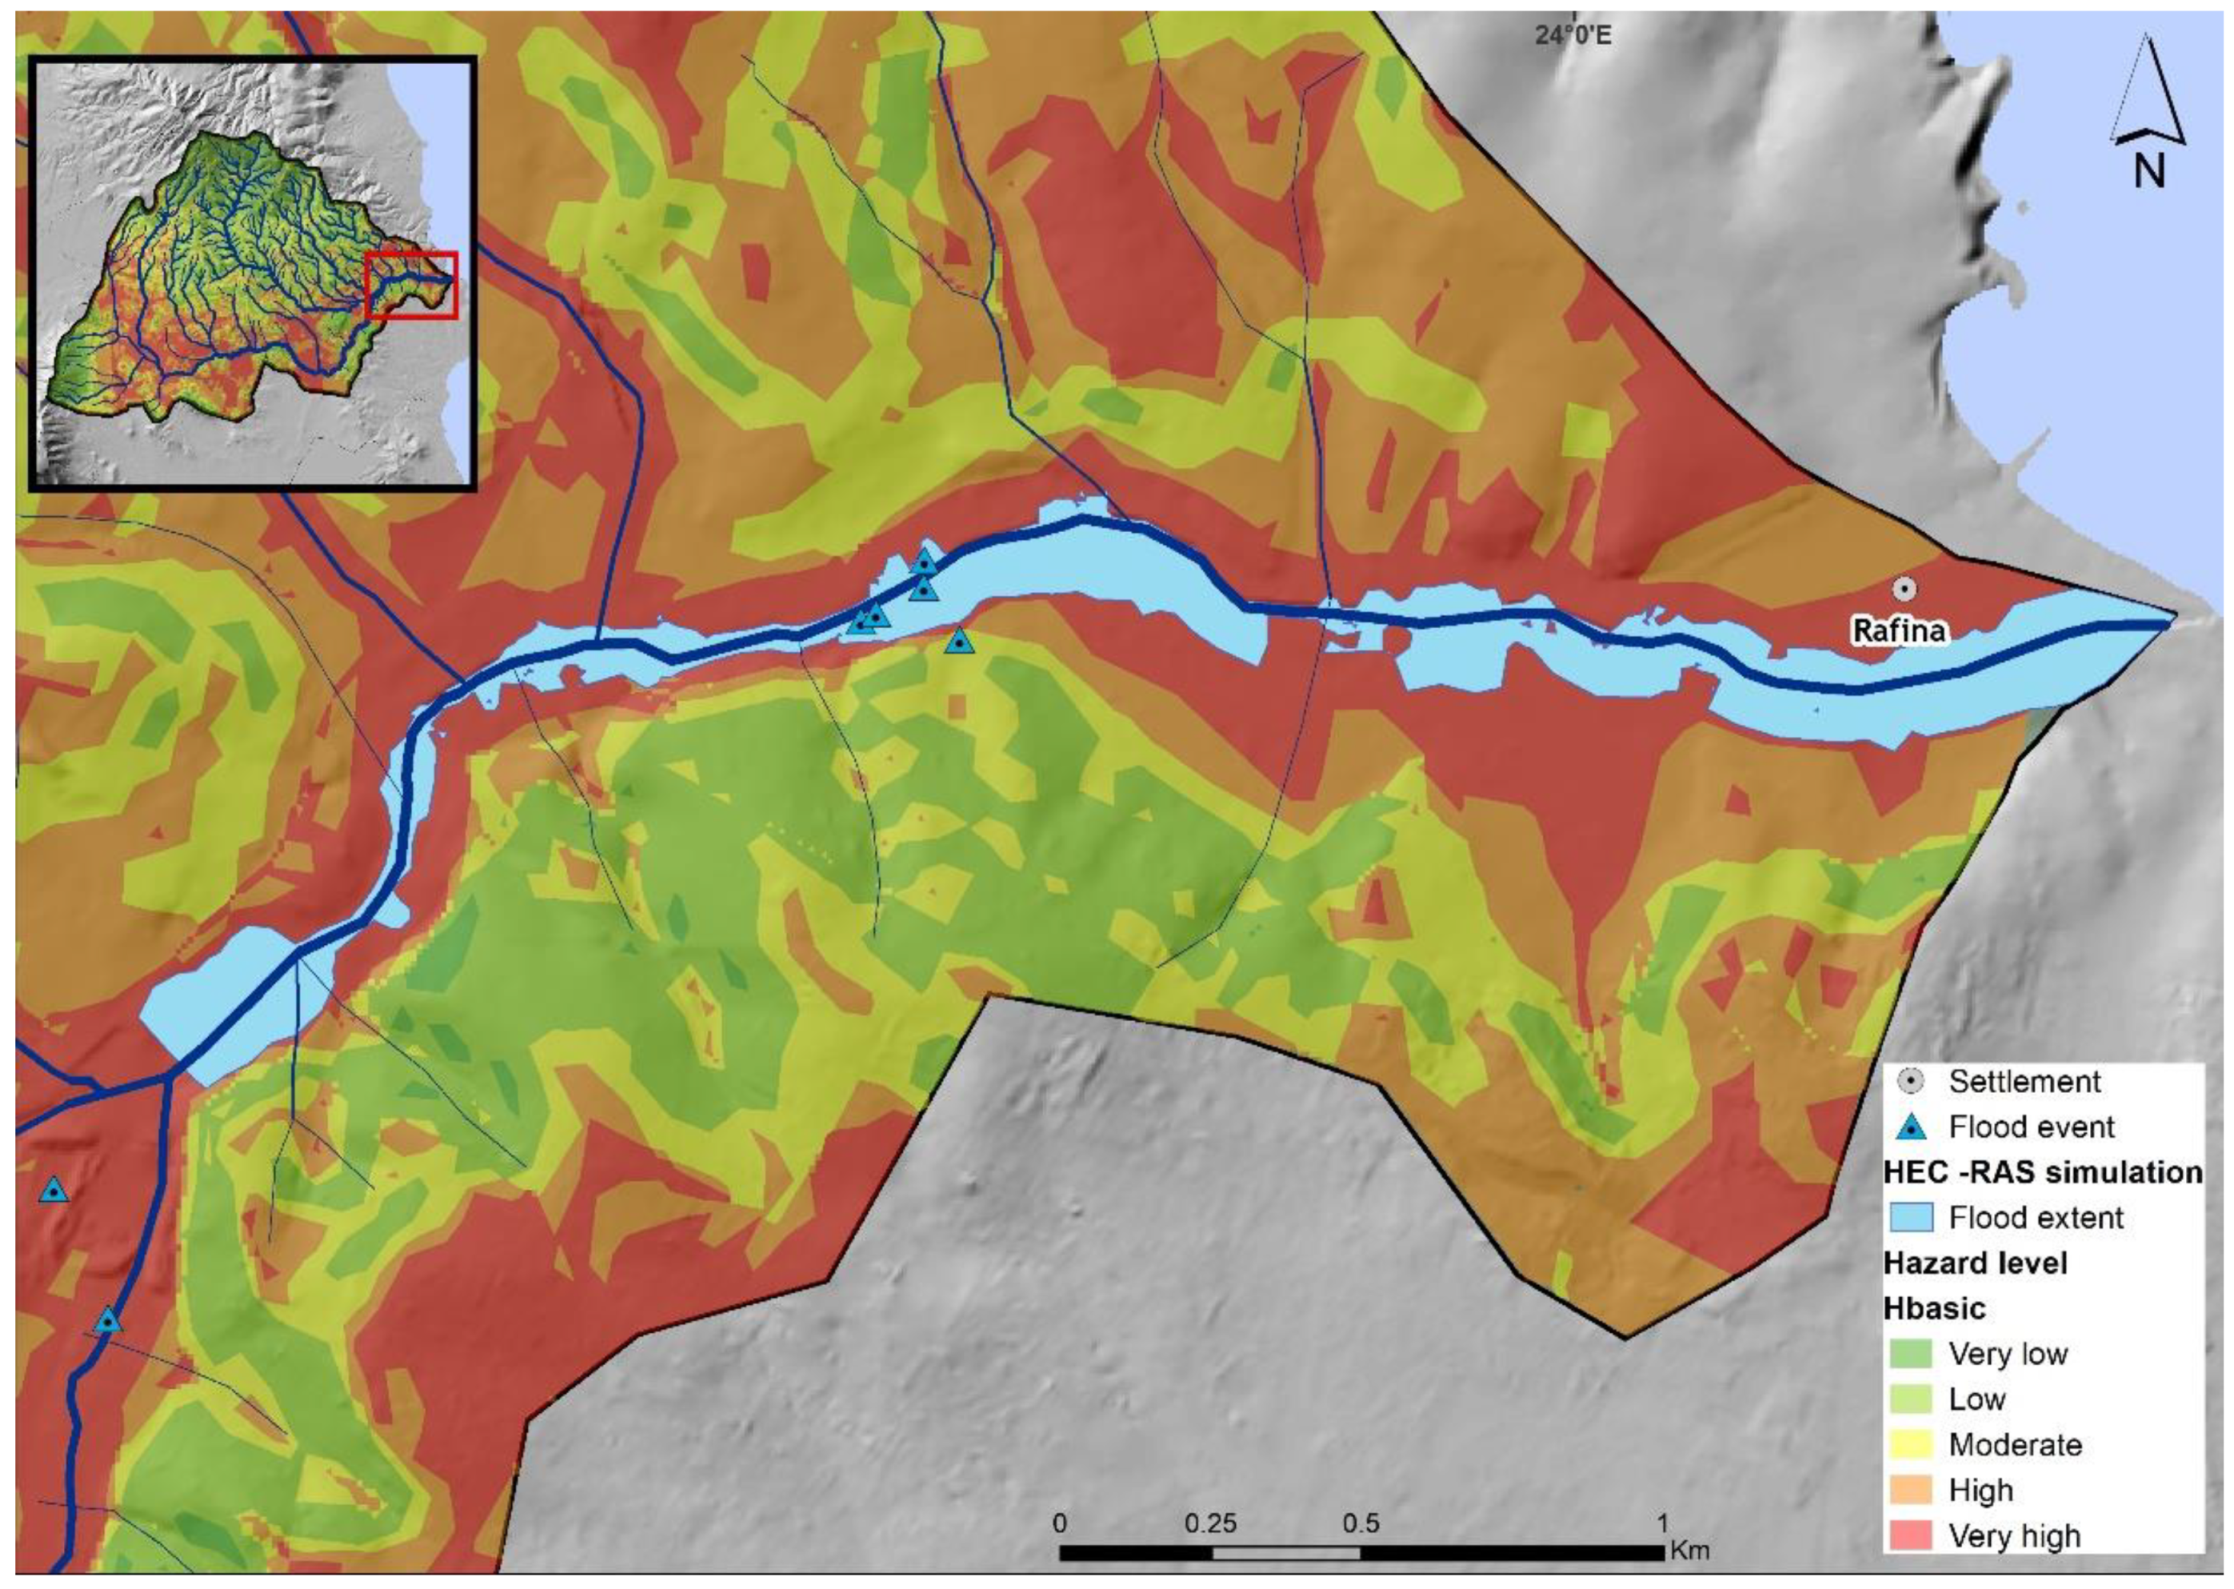
Another way of validating the results of the final flood-hazard map is by overlaying the outcome results of the application of the one-dimensional steady flow hydraulic model HEC–RAS and comparing the potentially flooded areas with the borders of the high and very high flood-hazard zone. The flood-hazard mapping is in accordance with the results of the delineation of the potentially flooded area on both sides of the main stream channel, by simulating the river hydraulics’ behavior using the HEC–RAS Model in a GIS environment for the last 4 km of its course before the river mouth (Figure 10) [47]. The detection of potentially flooded areas was performed for three different high discharge values that correspond to the peak discharges of the storm events on 22 February 2013, as well as to the discharge values over return periods of 25 and 50 years, respectively. According to the results of the hydraulic model, the potentially flooded areas coincide with the highly and very highly flood-hazard prone areas, as mapped in this study. The results of a HEC–RAS simulation, taking into account higher discharges (i.e., a 100-year return period), would show that more of the high and very high flood-hazard zone could be included in the flood’s extent, possibly including the flood event that lies in the moderate flood-hazard zone and outside the flooding extent of the simulation results in Figure 10.

Figure 10.
Map depicting flood extent according to the HEC–RAS simulation of the 50-year return period in relation to the Hbasic map for the last 4 km of the river course (based on Andreou et al. [47]).
The resultant flood-hazard map is also in line with the quantitative geomorphological analysis performed for the Megalo Rema drainage network by Karymbalis et al. [42]. The results of the aforementioned geomorphological analysis show irregularities in the hierarchical drainage by stream order that enhance flash floods. The most significant among them concerns the fourth order streams that drain directly into the sixth order main stream channel of the Megalo Rema (Rafina). The reason for this is the Neos Voutzas stream which joins the main channel at its lower reaches, enhancing its discharge when high precipitation events occur at the upper reaches of this tributary. This assumption is supported by the flood-hazard map of the present study, in which the broader area of the confluence of these two streams belongs to the very highly prone to flooding zone.
5. Conclusions
The aim of the present paper was the development of a catchment scale methodology to identify and map the zones prone to flooding in the fast-growing urban catchment of Megalo Rema in East Attica, Greece. The proposed methodology was based on MCDA integrated with GIS (GIS-based MCDA) using AHP and took into account various critical factors such as slope, distance from stream channels, land cover, elevation and geology.
The flood-hazard assessment map produced showed that 51 km2, which corresponds to 44% of the total catchment area, belong to the high and very high flood-hazard classes. The areas most prone to flooding are the low-lying, gently sloping and densely urbanized southern and western parts of the catchment, as well as the area of the river mouth. The areas highly prone to flooding host socioeconomically significant land uses such as continuous and discontinuous dense urban fabric (12.6%), discontinuous medium- and low-density urban fabric (15.1%) and industrial, commercial, public and private units and construction sites (7.2%). Similarly, the zone of very high flood risk is occupied by dense urban fabric (9.4%), medium- to low-density urban fabric (13.5%) and industrial, commercial, public and private units and construction sites (10.1%). In addition, 9.9% and 9.5% of the high and very high flood-prone zones of the catchment consist of the road network and its associated land, while 30.6% and 37.0% of these zones are occupied by agricultural land and related activities.
A significant correlation between the flood-hazard zones and the spatial distribution of past flood phenomena was detected, calculating the frequency ratio of the flood events as shown in Table 9. The flood-hazard map is also in accordance with the results of the quantitative geomorphological analysis of the Megalo Rema drainage network, as well as with the potentially flooded areas delineated by simulating the hydraulic behavior of the lower reaches of the river using the HEC–RAS Model. These verifications demonstrated the reliable results and high accuracy achieved by the created flood-hazard map.
The proposed methodology is simple and provides a tool for the improvement of flood risk management strategies and action plans, while it can also be useful in land use planning projects at a catchment scale.
Author Contributions
Conceptualization, E.K., M.A., D.-V.B., K.T. and S.K.; methodology, E.K., M.A., D.-V.B. and K.T.; software, M.A. and D.-V.B.; validation, E.K., M.A., D.-V.B. and S.K.; formal analysis, E.K., M.A., D.-V.B., K.T. and S.K.; investigation, M.A.; resources, M.A. and D.-V.B.; data curation, M.A. and D.-V.B.; writing—original draft preparation, E.K., M.A., D.-V.B., K.T. and S.K.; writing—review and editing, E.K., M.A., D.-V.B., K.T. and S.K.; visualization, M.A. and D.-V.B.; supervision, E.K.; project administration, K.T. All authors have read and agreed to the published version of the manuscript.
Funding
This research received no external funding.
Institutional Review Board Statement
Not applicable.
Informed Consent Statement
Not applicable.
Data Availability Statement
Publicly available datasets were analyzed in this study: Copernicus Urban Atlas 2018 (https://land.copernicus.eu/local/urban-atlas/urban-atlas-2018; accessed on 8 September 2021), Copernicus CORINE Land Cover (https://land.copernicus.eu/pan-european/corine-land-cover/clc2018; accessed on 8 September 2021). The data presented in this study are available on request from the corresponding author.
Acknowledgments
The authors would like to thank the Guest Editor of the special issue and the anonymous reviewers for their recommendations that significantly improved the paper.
Conflicts of Interest
The authors declare no conflict of interest.
References
- Keller, E.A.; Blodgett, R.H. Natural Hazards: Earth’s Processes as Hazards, Disasters and Catastrophes; Pearson Prentice Hall: Hoboken, NL, USA, 2006; p. 395. [Google Scholar]
- Tsatsaris, A.; Kalogeropoulos, K.; Stathopoulos, N.; Louka, P.; Tsanakas, K.; Tsesmelis, D.E.; Krassanakis, V.; Petropoulos, G.P.; Pappas, V.; Chalkias, C. Geoinformation Technologies in Support of Environmental Hazards Monitoring under Climate Change: An Extensive Review. ISPRS Int. J. Geo-Inf. 2021, 10, 94. [Google Scholar] [CrossRef]
- Koks, E.E.; Thissen, M.; Alfieri, L.; De Moel, H.; Feyen, L.; Jongman, B.; Aerts, J.C.J.H. The macroeconomic impacts of future river flooding in Europe. Environ. Res. Lett. 2019, 14, 084042. [Google Scholar] [CrossRef]
- Smith, K.; Ward, R. Floods: Physical Processes and Human Impacts; John Wiley: Chichester, UK, 1998; p. 382. [Google Scholar]
- Karymbalis, E.; Katsafados, P.; Chalkias, C.; Gaki-Papanastassiou, K. An integrated study for the evaluation of natural and anthropogenic causes of flooding in small catchments based on geomorphological and meteorological data and modeling techniques: The case of the Xerias torrent (Corinth, Greece). Zeitscrift für Geomorphol. 2012, 56, 45–67. [Google Scholar] [CrossRef]
- Tsanakas, K.; Gaki-Papanastassiou, K.; Kalogeropoulos, K.; Chalkias, C.; Katsafados, P.; Karymbalis, E. Investigation of flash flood natural causes of Xirolaki Torrent, Northern Greece based on GIS modeling and geomorphological analysis. Nat. Hazards 2016, 84, 1015–1033. [Google Scholar] [CrossRef]
- Kalogeropoulos, K.; Karalis, S.; Karymbalis, E.; Chalkias, C.; Chalkias, G.; Katsafados, P. Modeling Flash Floods in Vouraikos River Mouth, Greece. In Proceedings of the MEDCOAST Conference Proceedings 2013, Marmaris, Turkey, 30 October–3 November 2013; Volume II, pp. 1135–1146. [Google Scholar]
- Bathrellos, G.; Karymbalis, E.; Skilodimou, H.; Gaki-Papanastassiou, K.; Baltas, E. Urban flood hazard assessment in the basin of Athens Metropolitan city, Greece. Environ. Earth Sci. 2016, 75, 319. [Google Scholar] [CrossRef]
- Varlas, G.; Anagnostou, M.N.; Spyrou, C.; Papadopoulos, A.; Kalogiros, J.; Mentzafou, A.; Michaelides, S.; Baltas, E.; Karymbalis, E.; Katsafados, P. A multi-platform hydrometeorological analysis of the flash flood event of 15 November 2017 in Attica, Greece. Remote Sens. 2019, 11, 45. [Google Scholar] [CrossRef] [Green Version]
- Seneviratne, S.I.; Nicholls, N.; Easterling, D.; Goodess, C.M.; Kanae, S.; Kossin, J.; Luo, Y.; Marengo, J.; McInnes, K.; Rahimi, M.; et al. Changes in climate extremes and their impacts on the natural physical environments. In Managing the Risks of Extreme Events and Disasters to Advance Climate Change Adaptation. A Special Report of Working Goups I and II of the Intergovernmental Panel on Climate Change; Cambridge University Press: Cambridge, NY, USA, 2012; pp. 109–230. [Google Scholar]
- Alfieri, L.; Burek, P.; Feyen, L.; Forzieri, G. Global warming increases the frequency of river floods in Europe. Hydrol. Earth Syst. Sci. 2015, 19, 2247–2260. [Google Scholar] [CrossRef] [Green Version]
- Winsemius, H.C.; Aerts, J.C.J.H.; Van Beek, L.P.H.; Bierkens, M.F.P.; Bouwman, A.; Jongman, B.; Kwadijk, J.C.J.; Ligtvoet, W.; Lucas, P.L.; Van Vuuren, D.P.; et al. Global drivers of future river flood risk. Nat. Clim. Chang. 2016, 6, 381–385. [Google Scholar] [CrossRef]
- Dottori, F.; Szewczyk, W.; Ciscar, J.C.; Zhao, F.; Alfieri, L.; Hirabayashi, Y.; Bianchi, A.; Mongelli, I.; Frieler, K.; Betts, R.A.; et al. Increased human and economic losses from river flooding with anthropogenic warming. Nat. Clim. Chang. 2018, 8, 781–786. [Google Scholar] [CrossRef]
- Tehrany, M.S.; Pradhan, B.; Jebur, M.N. Spatial prediction of flood susceptible areas using rule based decision tree (DT) and a novel ensemble bivariate and multivariate statistical models in GIS. J. Hydrol. 2013, 504, 69–79. [Google Scholar] [CrossRef]
- Kazakis, N.; Kougias, I.; Patsialis, T. Assessment of flood hazard areas at a regional scale using an index-based approach and Analytical Hierarchy Process: Application in Rhodope-Evros region, Greece. Sci. Total Environ. 2015, 538, 555–563. [Google Scholar] [CrossRef]
- Stathopoulos, N.; Kalogeropoulos, K.; Polykretis, C.; Skrimizeas, P.; Louka, P.; Karymbalis, E.; Chalkias, C. Introducing Flood Susceptibility Index Using Remote-Sensing Data and Geographic Information Systems: Empirical Analysis in Sperchios River Basin, Greece. In Remote Sensing of Hydrometeorological Hazards; Petropoulos, G., Islam, T., Eds.; CRC Press: Boca Raton, FL, USA, 2018. [Google Scholar]
- Skilodimou, H.D.; Bathrellos, G.D.; Alexakis, D.E. Flood Hazard Assessment Mapping in Burned and Urban Areas. Sustainability 2021, 13, 4455. [Google Scholar] [CrossRef]
- Malczewski, J. GIS-based multicriteria decision analysis: A survey of the literature. Int. J. Geogr. Inf. Sci. 2006, 20, 703–726. [Google Scholar] [CrossRef]
- Saaty, T.L. A scaling method for priorities in hierarchical structures. J. Math. Psychol. 1977, 15, 234–281. [Google Scholar] [CrossRef]
- Saaty, T.L. Decision making—the analytic hierarchy and network processes (AHP/ANP). J. Syst. Sci. Syst. Eng. 2004, 13, 1–35. [Google Scholar] [CrossRef]
- Awange, J.; Kiema, J. Fundamentals of GIS. In Environmental Geoinformatics. Environmental Science and Engineering, 2nd ed.; Springer: Cham, Switzerland, 2019; pp. 203–212. [Google Scholar]
- Drobne, S.; Lisec, A. Multi-attribute Decision Analysis in GIS: Weighted Linear Combination and Ordered Weighted Averaging. Informatica 2009, 33, 459–474. [Google Scholar]
- Ayalew, L.; Yamagishi, H.; Ugawa, N. Landslide susceptibility mapping using GIS-based weighted linear combination, the case in Tsugawa area of Agano River, Niigata Prefecture, Japan. Landslides 2004, 1, 73–81. [Google Scholar] [CrossRef]
- Rozos, D.; Bathrellos, G.D.; Skilodimou, H.D. Comparison of the implementation of Rock Engineering System (RES) and Analytic Hierarchy Process (AHP) methods, based on landslide susceptibility maps, compiled in GIS environment. A case study from the Eastern Achaia County of Peloponnesus, Greece. Environ. Earth Sci. 2011, 63, 49–63. [Google Scholar] [CrossRef]
- Argyriou, A.V.; Teeuw, R.M.; Rust, D.; Sarris, A. GIS multi-criteria decision analysis for assessment and mapping of neotectonic landscape deformation: A case study from Crete. Geomorphology 2016, 253, 262–274. [Google Scholar] [CrossRef] [Green Version]
- Valkanou, K.; Karymbalis, E.; Papanastassiou, D.; Soldati, M.; Chalkias, C.; Gaki-Papanastassiou, K. Assessment of Neotectonic Landscape Deformation in Evia Island, Greece, Using GIS-Based Multi-Criteria Analysis. ISPRS Int. J. Geo-Inf. 2021, 10, 118. [Google Scholar] [CrossRef]
- Arabameri, A.; Pradhan, B.; Pourghasemi, H.R.; Rezaei, K. Identification of erosion-prone areas using different multi-criteria decision-making techniques and GIS. Geomat. Nat. Hazards Risk 2018, 9, 1129–1155. [Google Scholar] [CrossRef] [Green Version]
- Elsheikh, R.F.A.; Ouerghi, S.; Elhag, A.R. Flood Risk Map Based on GIS, and Multi Criteria Techniques (Case Study Terengganu Malaysia). J. Geogr. Inf. Syst. 2015, 7, 348–357. [Google Scholar] [CrossRef] [Green Version]
- Das, S. Flood susceptibility mapping of the Western Ghat coastal belt using multi-source geospatial data and analytical hierarchy process (AHP). Remote. Sens. Appl. Soc. Environ. 2020, 20, 100379. [Google Scholar] [CrossRef]
- Gigović, L.; Pamučar, D.; Bajić, Z.; Drobnjak, S. Application of GIS-Interval Rough AHP Methodology for Flood Hazard Mapping in Urban Areas. Water J. 2017, 9, 360. [Google Scholar] [CrossRef] [Green Version]
- Radwan, F.; Alazba, A.A.; Mossad, A. Flood risk assessment and mapping using AHP in arid and semiarid regions. Acta Geophys. 2019, 67, 215–229. [Google Scholar] [CrossRef]
- Das, S. Geographic information system and AHP-based flood hazard zonation of Vaitarna basin, Maharashtra, India. Arab. J. Geosci. 2018, 11, 1–13. [Google Scholar] [CrossRef]
- Ouma, Y.O.; Tateishi, R. Urban flood vulnerability and risk mapping using integrated multi-parametric AHP and GIS: Methodological overview and case study assessment. Water 2014, 6, 1515–1545. [Google Scholar] [CrossRef]
- Stefanidis, S.; Stathis, D. Assessment of flood hazard based on natural and anthropogenic factors using analytic hierarchy process (AHP). Nat. Hazards 2013, 68, 569–585. [Google Scholar] [CrossRef]
- Papaioannou, G.; Vasiliades, L.; Loukas, A. Multi-criteria analysis framework for potential flood prone areas mapping. Water Resour. Manag. 2015, 29, 399–418. [Google Scholar] [CrossRef]
- Bathrellos, G.D.; Skilodimou, H.D.; Chousianitis, K.; Youssef, A.M.; Pradhan, B. Suitability estimation for urban development using multi-hazard assessment map. Sci. Total Environ. 2017, 575, 119–134. [Google Scholar] [CrossRef]
- Skilodimou, H.D.; Bathrellos, G.D.; Chousianitis, K.; Youssef, A.M.; Pradhan, B. Multi-hazard assessment modeling via multicriteria analysis and GIS: A case study. Environ. Earth Sci. 2019, 78, 47. [Google Scholar] [CrossRef]
- Feloni, E.; Mousadis, I.; Baltas, E. Flood vulnerability assessment using a GIS-based multi-criteria approach–The case of Attica region. J. Flood Risk Manag. 2020, 13, e12563. [Google Scholar] [CrossRef] [Green Version]
- Saaty, T.L. An exposition of the ahp in reply to the paper remarks on the analytic hierarchy process. Manag. Sci. 1990, 36, 259–268. [Google Scholar] [CrossRef]
- Saaty, T.L. How to make a decision: The analytic hierarchy process. Eur. J. Oper. Res. 1990, 48, 9–26. [Google Scholar] [CrossRef]
- Strahler, A.N. Quantitative analysis of watershed geomorphology. Eos Trans. Am. Geophys. Union 1957, 38, 913–920. [Google Scholar] [CrossRef] [Green Version]
- Karymbalis, E.; Gaki-Papanastassiou, K.; Maroukian, H. Contribution of geomorphological features of the drainage network of Megalo Rema (Rafina) and human interference in occurrence of flood events. Bull. Geol. Soc. Greece 2005, 38, 171–181. [Google Scholar]
- IGME. Geological Map of Greece, Scale 1:50.000. Kifissia, Sheet; Institute of Geology and Mineral Exploration: Athens, Greece, 2002. [Google Scholar]
- IGME. Geological Map of Greece, Scale 1:50.000. Rafina Sheet; Institute of Geology and Mineral Exploration: Athens, Greece, 1991. [Google Scholar]
- Special Secretariat of Water, Ministry of Environment and Energy, Greece. Flood Risk Management Plan for the Attica Hydrological Region River Basins, Stage I, 1st Phase—Deliverable 1, Analysis of the Areas’ Features and Flood Mechanisms; The Hellenic Government: Athens, Greece, 2017.
- The European Parliament and the Council of the European Union. Directive 2007/60/EC on the assessment and management of flood risks. Off. J. Eur. Union 2007, 288, 27–34. [Google Scholar]
- Andreou, M.; Karalis, S.; Batzakis, D.V.; Karymbalis, E. Floodplain mapping using hydraulic simulation Hec-RAS in GIS: A case study for Rafina basin (Attica, Greece) based on February 2013 storm event. Bull. Geol. Soc. Greece Sp. Pub 2019, 7, GSG2019-141. [Google Scholar]
- Giannaros, C.; Galanaki, E.; Kotroni, V.; Lagouvardos, K.; Oikonomou, C.; Haralambous, H.; Giannaros, T.M. Pre-Operational Application of a WRF-Hydro-Based Fluvial Flood Forecasting System in the Southeast Mediterranean. Forecasting 2021, 3, 437–446. [Google Scholar] [CrossRef]
- Giannaros, C.; Kotroni, V.; Lagouvardos, K.; Oikonomou, C.; Haralambous, H.; Papagiannaki, K. Hydrometeorological and Socio-Economic Impact Assessment of Stream Flooding in Southeast Mediterranean: The case of Rafina Catchment (Attica, Greece). Water 2020, 12, 2426. [Google Scholar] [CrossRef]
- Michaelides, S.; Karacostas, T.; Sánchez, J.L.; Retalis, A.; Pytharoulis, I.; Homar, V.; Romero, R.; Zanis, P.; Giannakopoulos, C.; Bühl, J.; et al. Reviews and perspectives of high impact atmospheric processes in the Mediterranean. Atmos. Res. 2018, 208, 4–44. [Google Scholar] [CrossRef]
- Holguin, N.; Mugica, A.; Ukar, O. How Is Climate Change Included in the Implementation of the European Flood Directive? Analysis of the Methodological Approaches of Different Countries. Water 2021, 13, 1490. [Google Scholar] [CrossRef]
- Zerefos, C.; Repapis, C.; Giannakopoulos, C.; Kapsomenakis, J.; Papanikolaou, D.; Papanikolaou, M.; Poulos, S.; Vrekoussis, M.; Philandras, C.; Tselioudis, G.; et al. The climate of the Eastern Mediterranean and Greece: Past, present and future. In The Environmental, Economic and Social Impacts of Climate Change in Greece; Climate Change Impacts Study Committee, Bank of Greece: Athens, Greece, 2011; pp. 1–126. [Google Scholar]
- Haan, C.T.; Barfield, B.J.; Hayes, J.C. Design Hydrology and Sedimentology for Small Catchments; Elsevier: San Diego, CA, USA, 1994; p. 608. [Google Scholar]
- Fernandez, D.S.; Lutz, M.A. Urban flood hazard zoning in Tucuman Province, Argentina, using GIS and multicriteria decision analysis. Eng. Geol. 2010, 111, 90–98. [Google Scholar] [CrossRef]
- Termeh, S.V.R.; Kornejady, A.; Pourghasemi, H.R.; Keesstra, S. Flood susceptibility mapping using novel ensembles of adaptive neuro fuzzy inference system and metaheuristic algorithms. Sci. Total. Environ. 2018, 615, 438–451. [Google Scholar] [CrossRef]
- Predick, K.I.; Turner, M.G. Landscape configuration and flood frequency influence invasive shrubs in floodplain forests of the Wisconsin River (USA). J. Ecol. 2007, 96, 91–102. [Google Scholar] [CrossRef]
- Pham, B.T.; Avand, M.; Janizadeh, S.; Phong, T.V.; Al-Ansari, N.; Ho, L.S.; Das, S.; Le, H.V.; Amini, A.; Bozchaloei, S.K.; et al. GIS based hybrid computational approaches for flash flood susceptibility assessment. Water 2020, 12, 683. [Google Scholar] [CrossRef] [Green Version]
- Komolafe, A.A.; Herath, S.; Avtar, R. Methodology to assess potential flood damages in urban areas under the influence of climate change. Nat. Hazards Rev. 2018, 19, 05018001. [Google Scholar] [CrossRef]
- Mojaddadi, H.; Pradhan, B.; Nampak, H.; Ahmad, N.; Ghazali, A.H.B. Ensemble machine learning-based geospatial approach for flood risk assessment using multisensor remote-sensing data and GIS. Geomatics Nat. Hazards Risk 2017, 8, 1080–1102. [Google Scholar] [CrossRef] [Green Version]
- Grimm, M.M.; Wohl, E.E.; Jarrett, R.D. Coarse-sediment distribution as evidence of an elevation limit for flash flooding, Bear Creek, Colorado. Geomorphology 1995, 3, 199–210. [Google Scholar] [CrossRef]
- Souissi, D.; Zouhri, L.; Hammami, S.; Msaddek, M.H.; Zghibi, A.; Dlala, M. GIS-based MCDM–AHP modeling for flood susceptibility mapping of arid areas, southeastern Tunisia. Geocarto Int. 2020, 35, 991–1017. [Google Scholar] [CrossRef]
- Das, S. Geospatial mapping of flood susceptibility and hydro-geomorphic response to the floods in Ulhas basin, India. Rem. Sens. Appl. Soc. Environ. 2019, 14, 60–74. [Google Scholar] [CrossRef]
- Stamatis, G.; Lambrakis, N.; Alexakis, D.; Zagana, V. Groundwater quality in Mesogea basin in eastern Attica (Greece). Hydrol. Process. 2006, 20, 2803–2818. [Google Scholar] [CrossRef]
- Champidi, P.; Stamatis, G.; Parpodis, K.; Kyriazis, D. Estimation of Hydrological Balance of “Rafina’s Megalo Rema” basin (Eastern Attica) and diachronic change of the surface water quality characteristics. In Advances in the Research of Aquatic Environment; Lambrakis, N., Stournaras, G., Katsanou, K., Eds.; Environmental Earth Sciences Springer: Berlin/Heidelberg, Germany, 2011; pp. 365–372. [Google Scholar]
- Samal, D.R.; Gedam, S.S.; Nagarajan, R. GIS based drainage morphometry and its influence on hydrology in parts of Western Ghats region, Maharashtra, India. Geocarto Int. 2015, 30, 755–778. [Google Scholar] [CrossRef]
- Mu, E.; Pereyra-Rojas, M. Practical Decision Making: An Introduction to the Analytic Hierarchy Process (AHP) Using Super Decisions V2; Springer: Cham, Switzerland, 2016; p. 111. [Google Scholar]
- Saaty, R.W. The analytic hierarchy process—What it is and how it is used. Math. Model. 1987, 9, 161–176. [Google Scholar] [CrossRef] [Green Version]
- Burrough, P.; McDonnell, R.A.; Lloyd, C.D. Principles of Geographical Information Systems, 3rd ed.; Oxford University Press: New York, NY, USA, 1998; p. 352. [Google Scholar]
- Chen, Y.; Yu, J.; Khan, S. Spatial sensitivity analysis of multi-criteria weights in GIS-based land suitability evaluation. Environ. Model. Softw. 2010, 25, 1582–1591. [Google Scholar] [CrossRef]
- Youssef, A.M.; Sefry, S.A.; Pradhan, B.; Al Fadail, E.A. Analysis on causes of flash flood in Jeddah city (Kingdom of Saudi Arabia) of 2009 and 2011 using multi-sensor remote sensing data and GIS. Geomat. Nat. Haz. Risk 2016, 7, 1018–1042. [Google Scholar] [CrossRef]
- Van Westen, C.; Kappes, M.S.; Luna, B.Q.; Frigerio, S.; Glade, T.; Malet, J.P. Medium-scale multi-hazard risk assessment of gravitational processes. In Mountain Risks: From Prediction to Management and Governance; Springer: Dordrecht, The Netherlands, 2014; pp. 201–231. [Google Scholar]
- Nunes Correia, F.; Da Graca Saraiva, M.; Nunes Da Silva, F.; Ramos, I. Floodplain management in urban developing areas Part I Urban growth scenarios and land-use controls. Water Res. Manag. 1999, 13, 1–21. [Google Scholar] [CrossRef]
- Ologunorisa, T.E.; Abawua, M.J. Flood risk assessment: A review. J. Appl. Sci. Environ. Manag. 2005, 9, 57–63. [Google Scholar]
- Papathanasiou, C.; Pagana, V.; Varela, V.; Eftychidis, G.; Makropoulos, C.; Mimikou, M. Floods and Fire Risk Assessment and Management; LIFE11 ENV GR 975, Action A2: Identification of the Current Status of the Study Area; LIFE Public Database: Brussels, Belgium, 2013. [Google Scholar]


Publisher’s Note: MDPI stays neutral with regard to jurisdictional claims in published maps and institutional affiliations. |
© 2021 by the authors. Licensee MDPI, Basel, Switzerland. This article is an open access article distributed under the terms and conditions of the Creative Commons Attribution (CC BY) license (https://creativecommons.org/licenses/by/4.0/).