


The Contribution of Natural Resource Producing Sectors to the Economic Development of the Sakha Republic
Abstract
:1. Introduction
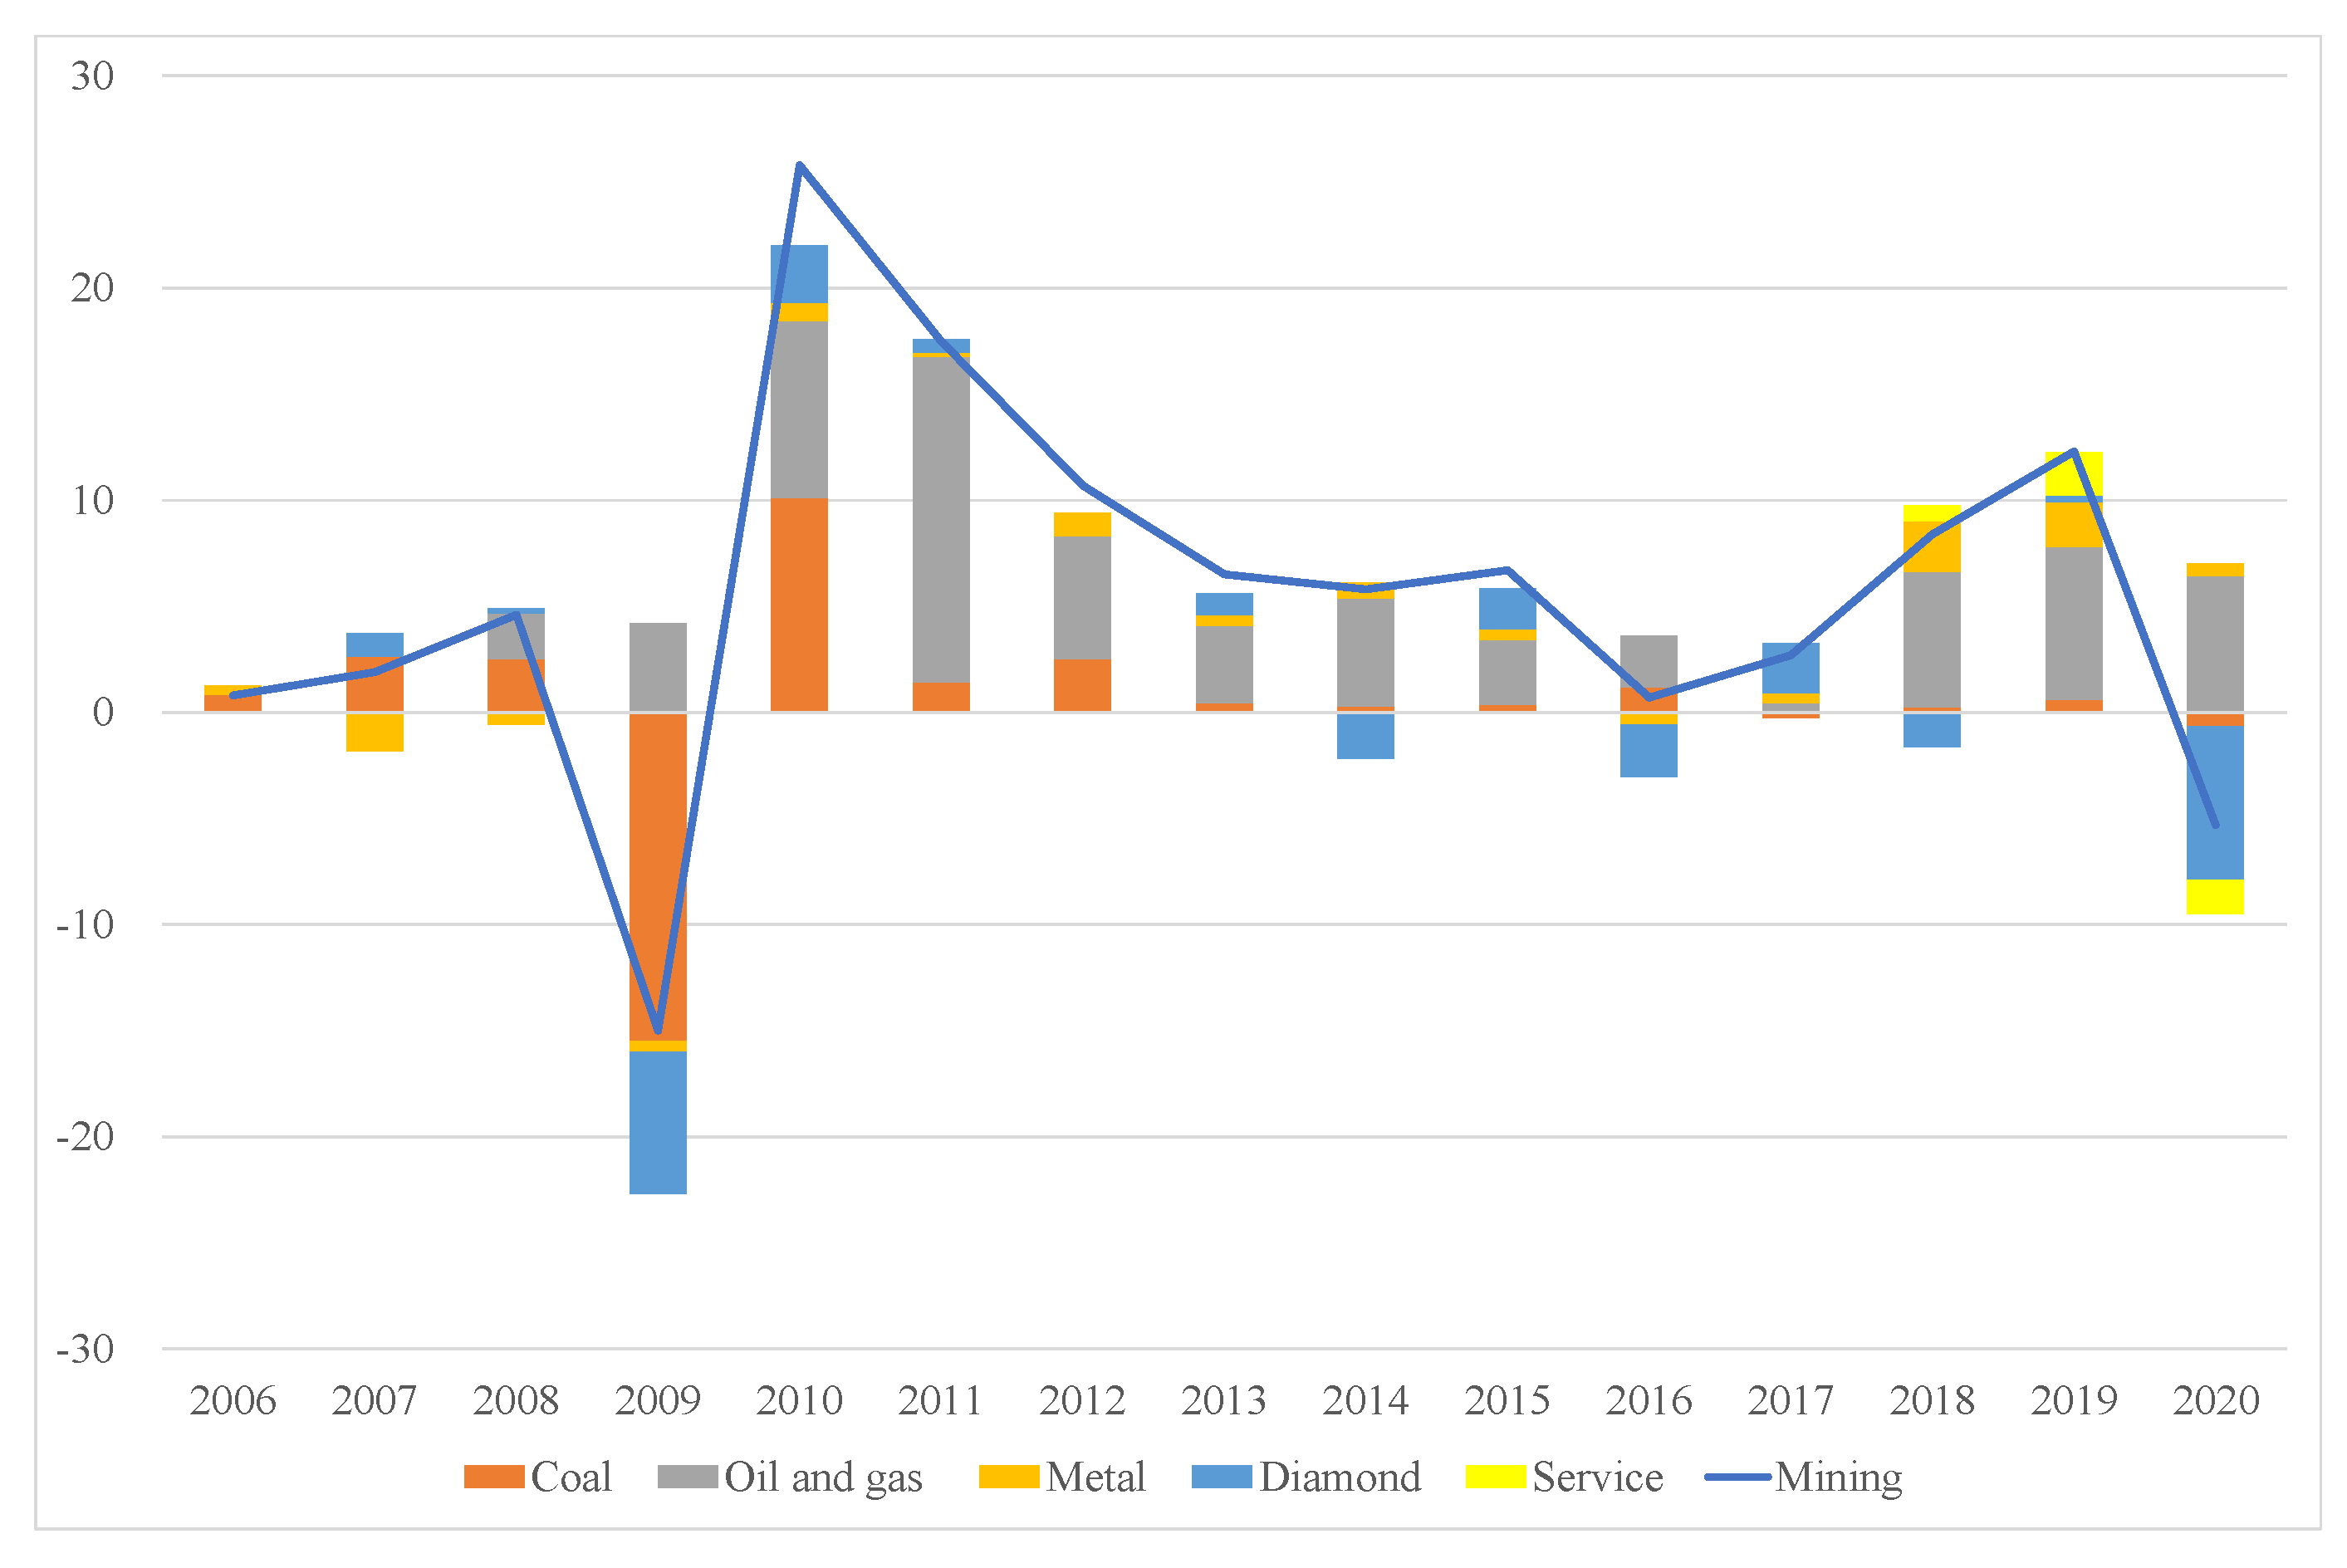
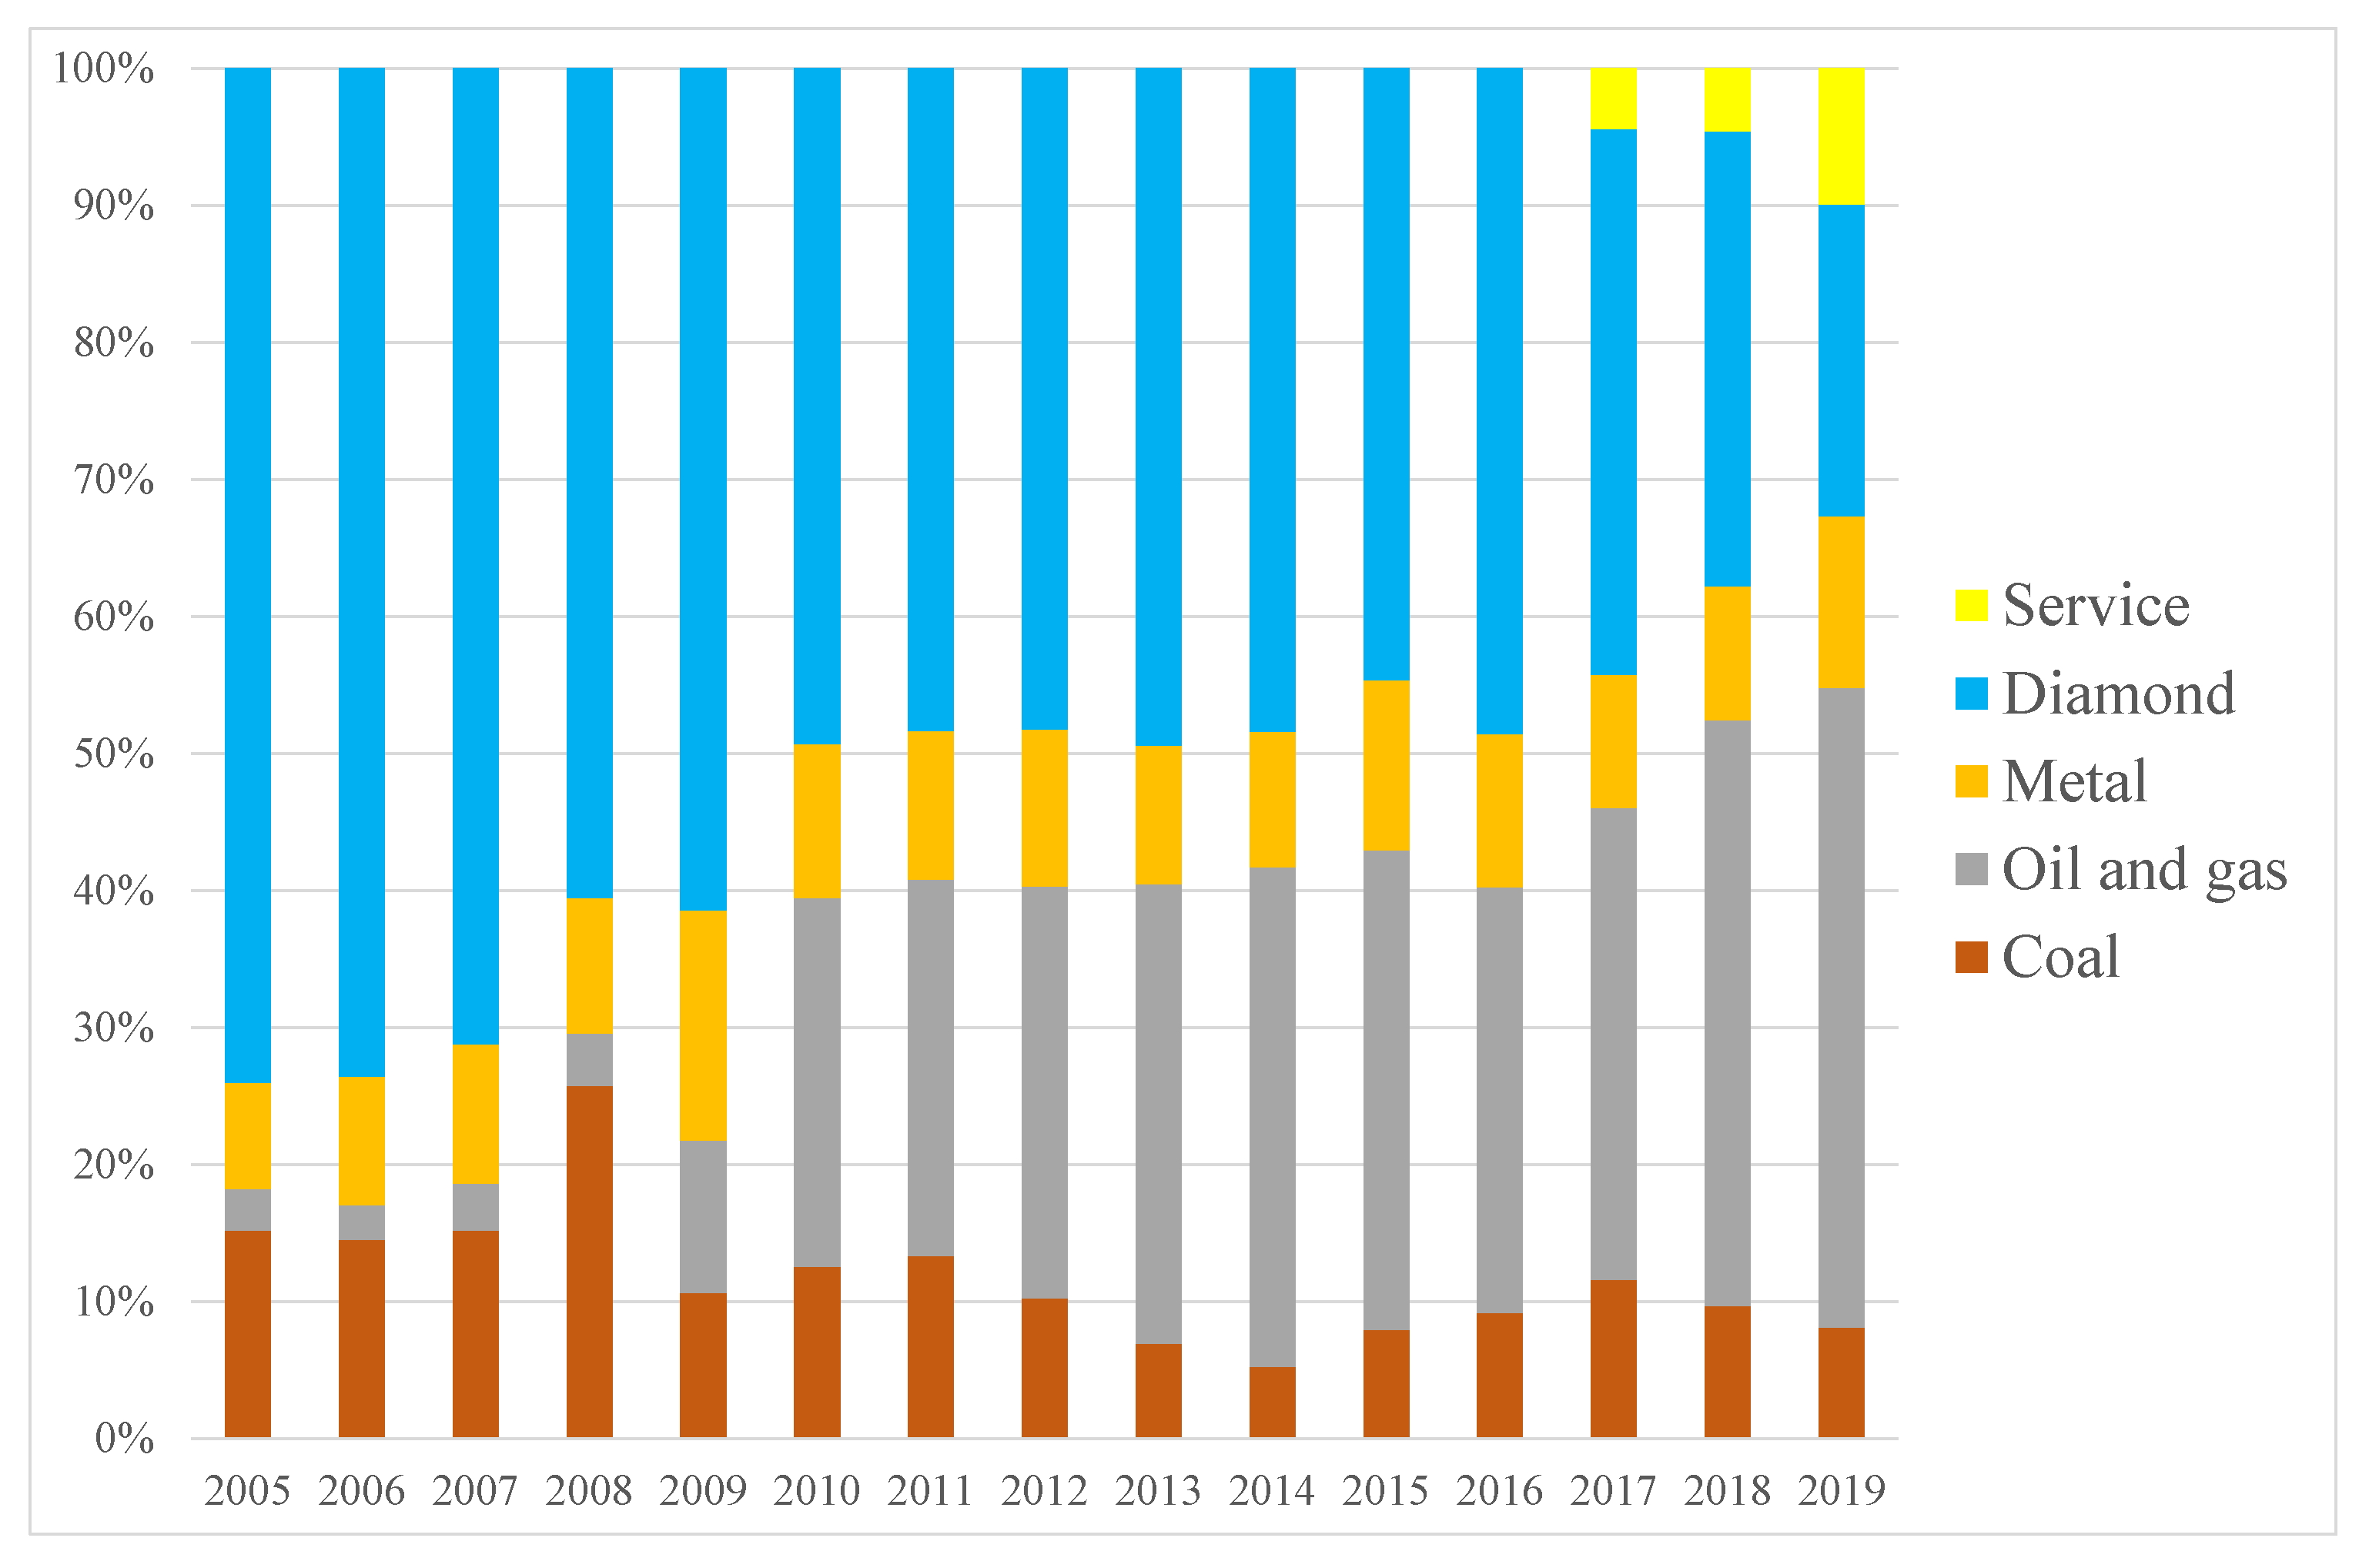
2. Contribution of the Mining Industry to Economic and Industrial Growth in Sakha
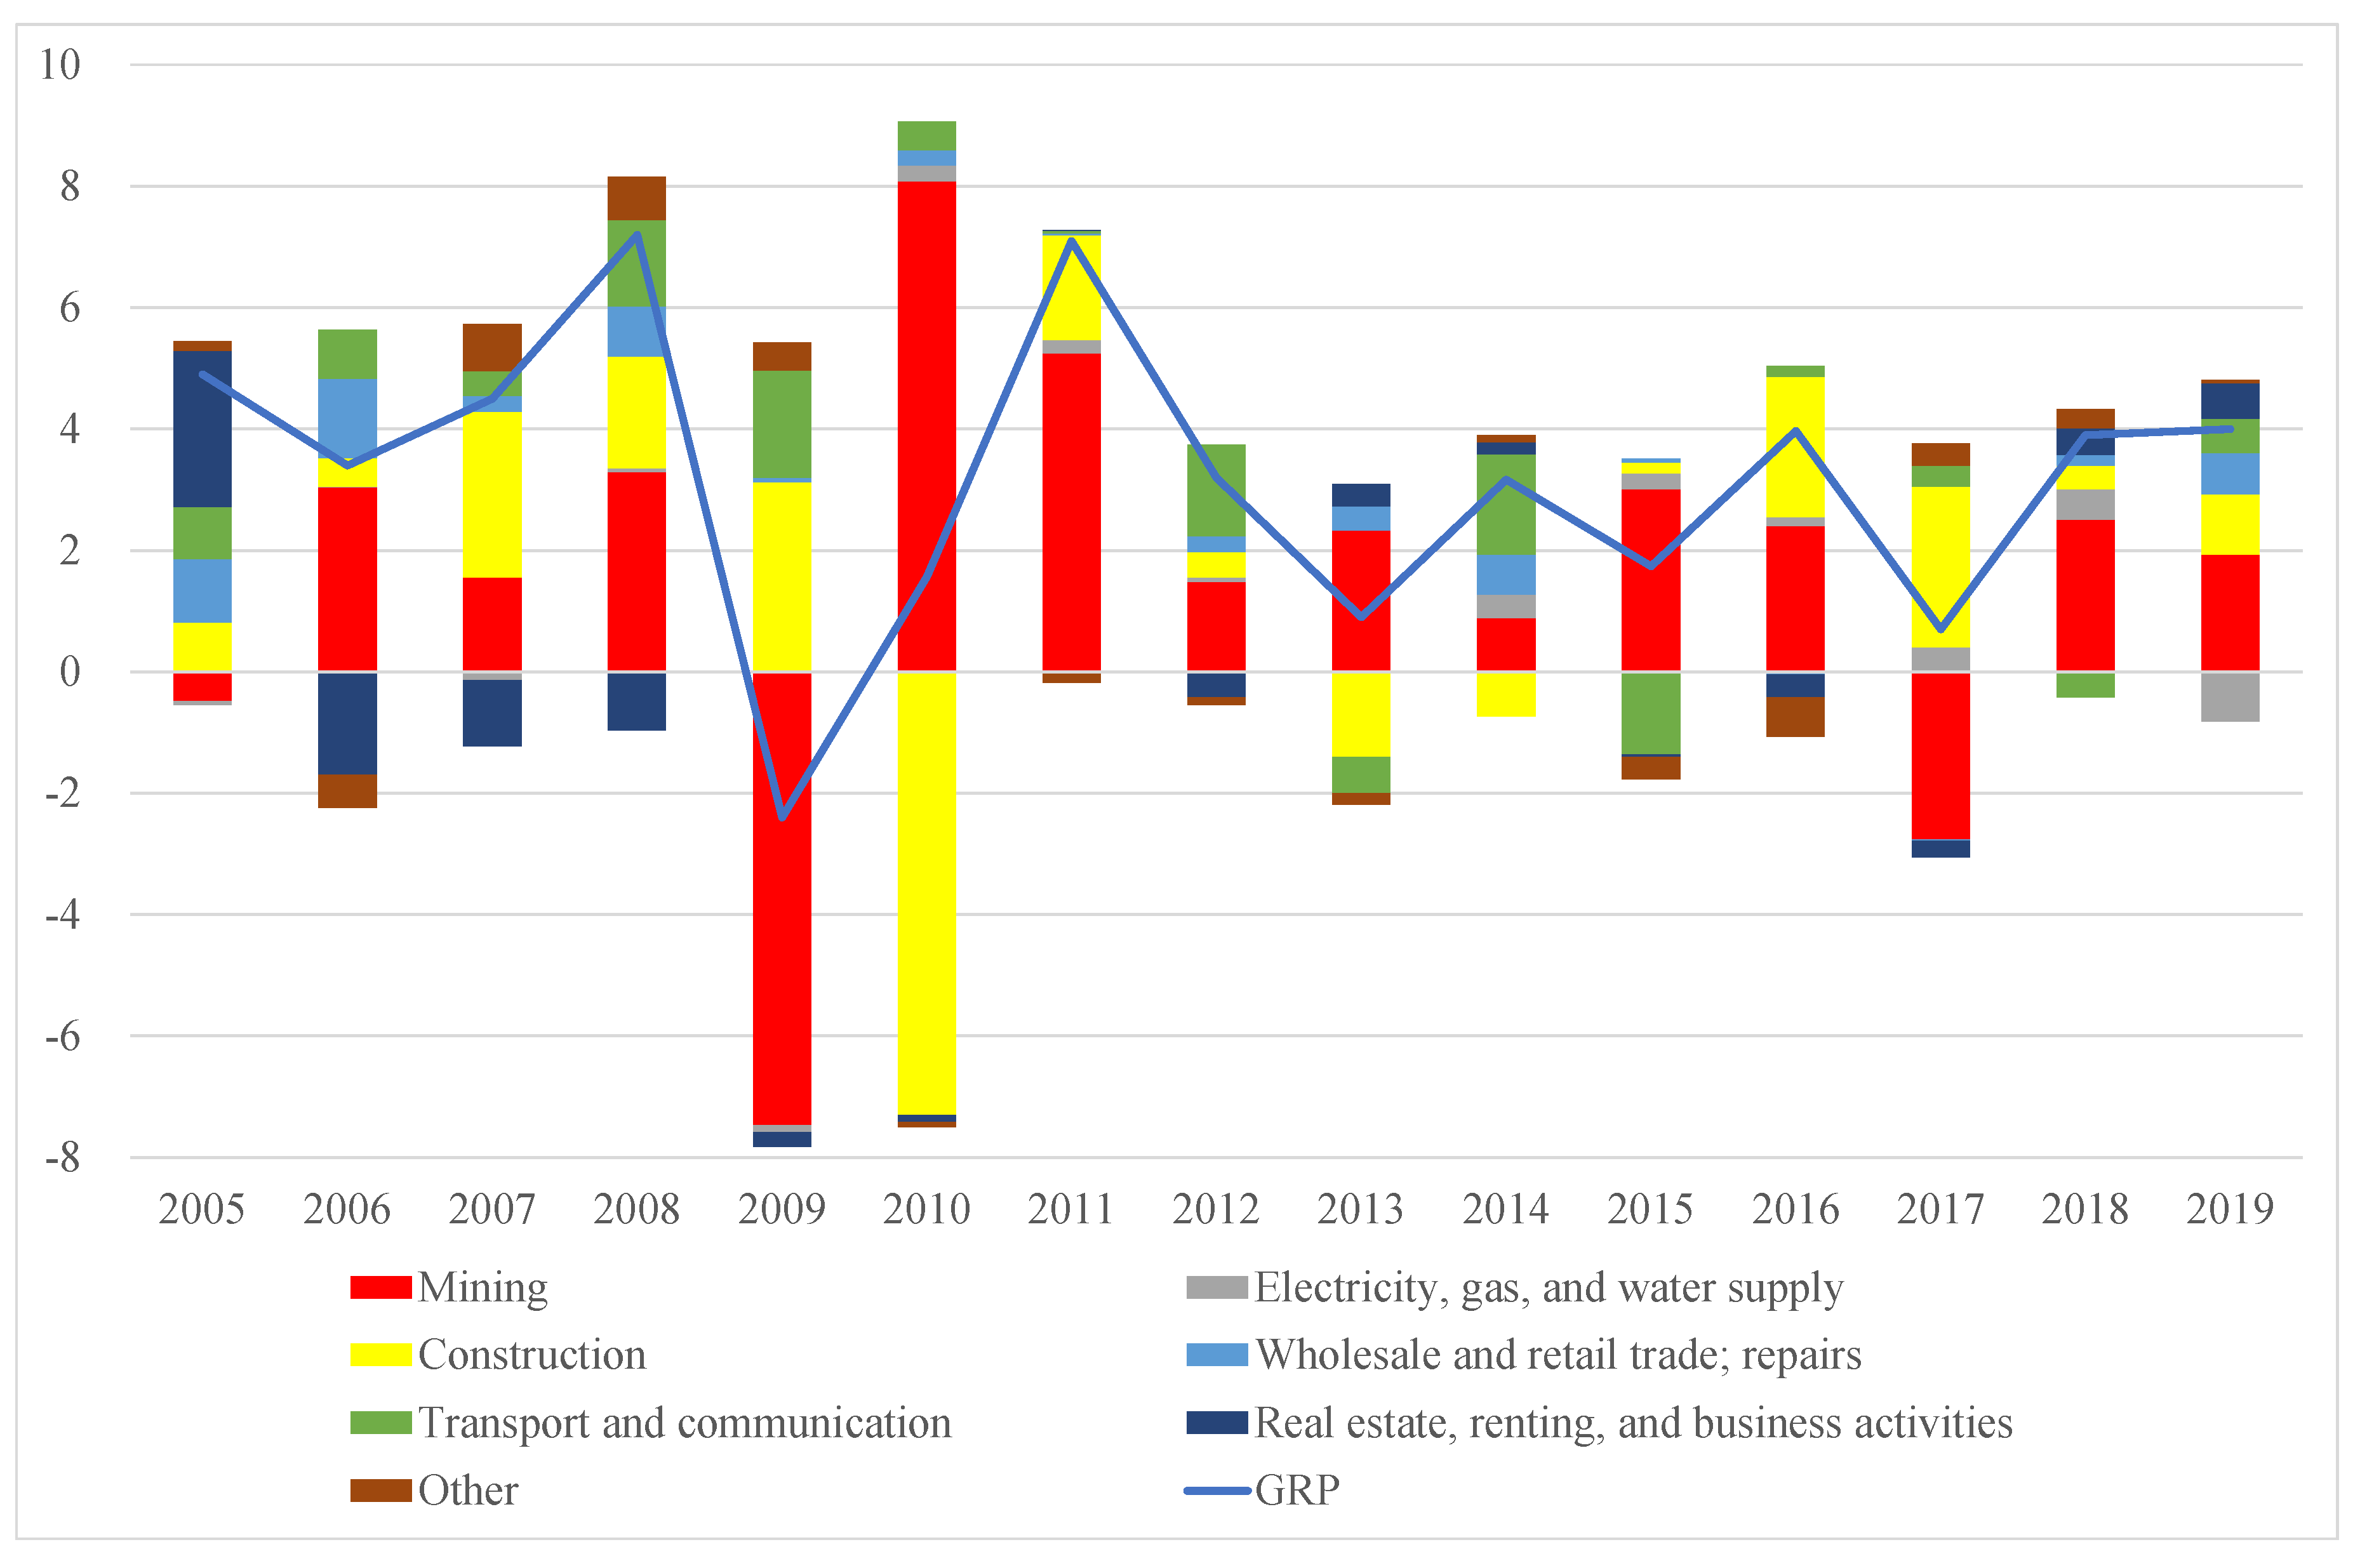
2.1. Contribution to Republican Economy
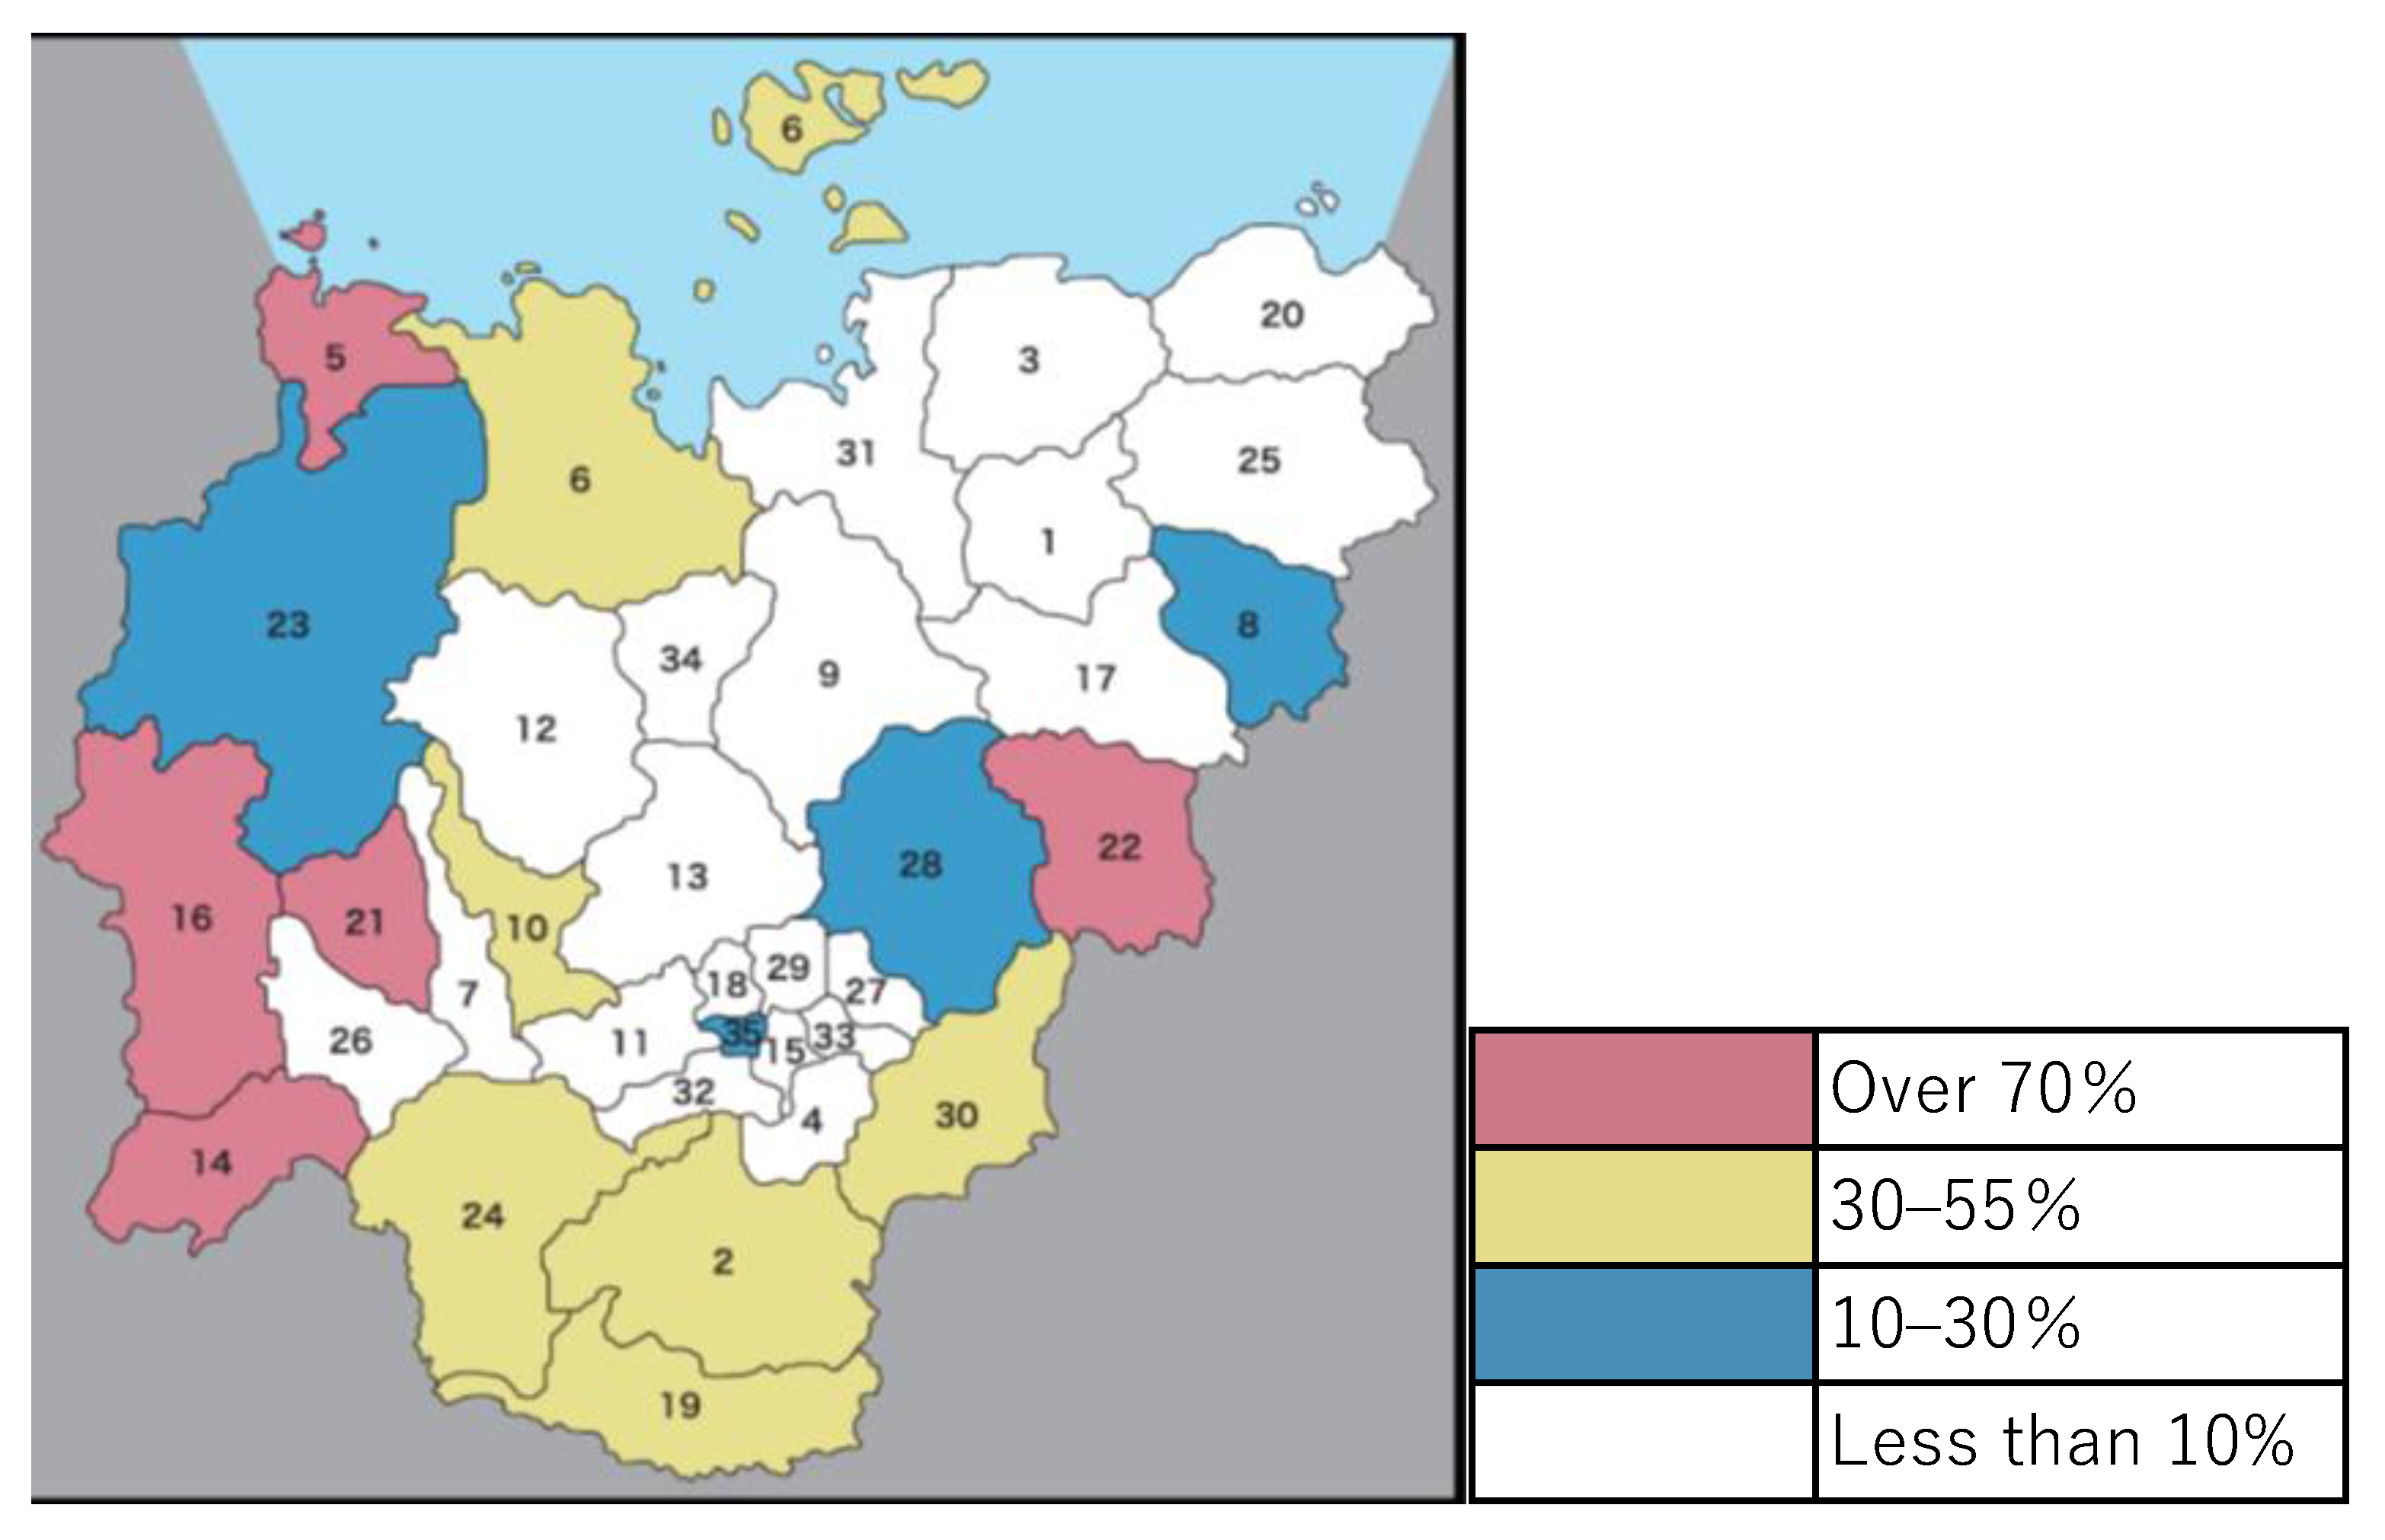
2.2. Contribution to Local Economy
3. Contribution of the Mining Industry to Government Budgets in Sakha
3.1. Contribution to the Federal and Republican Budgets
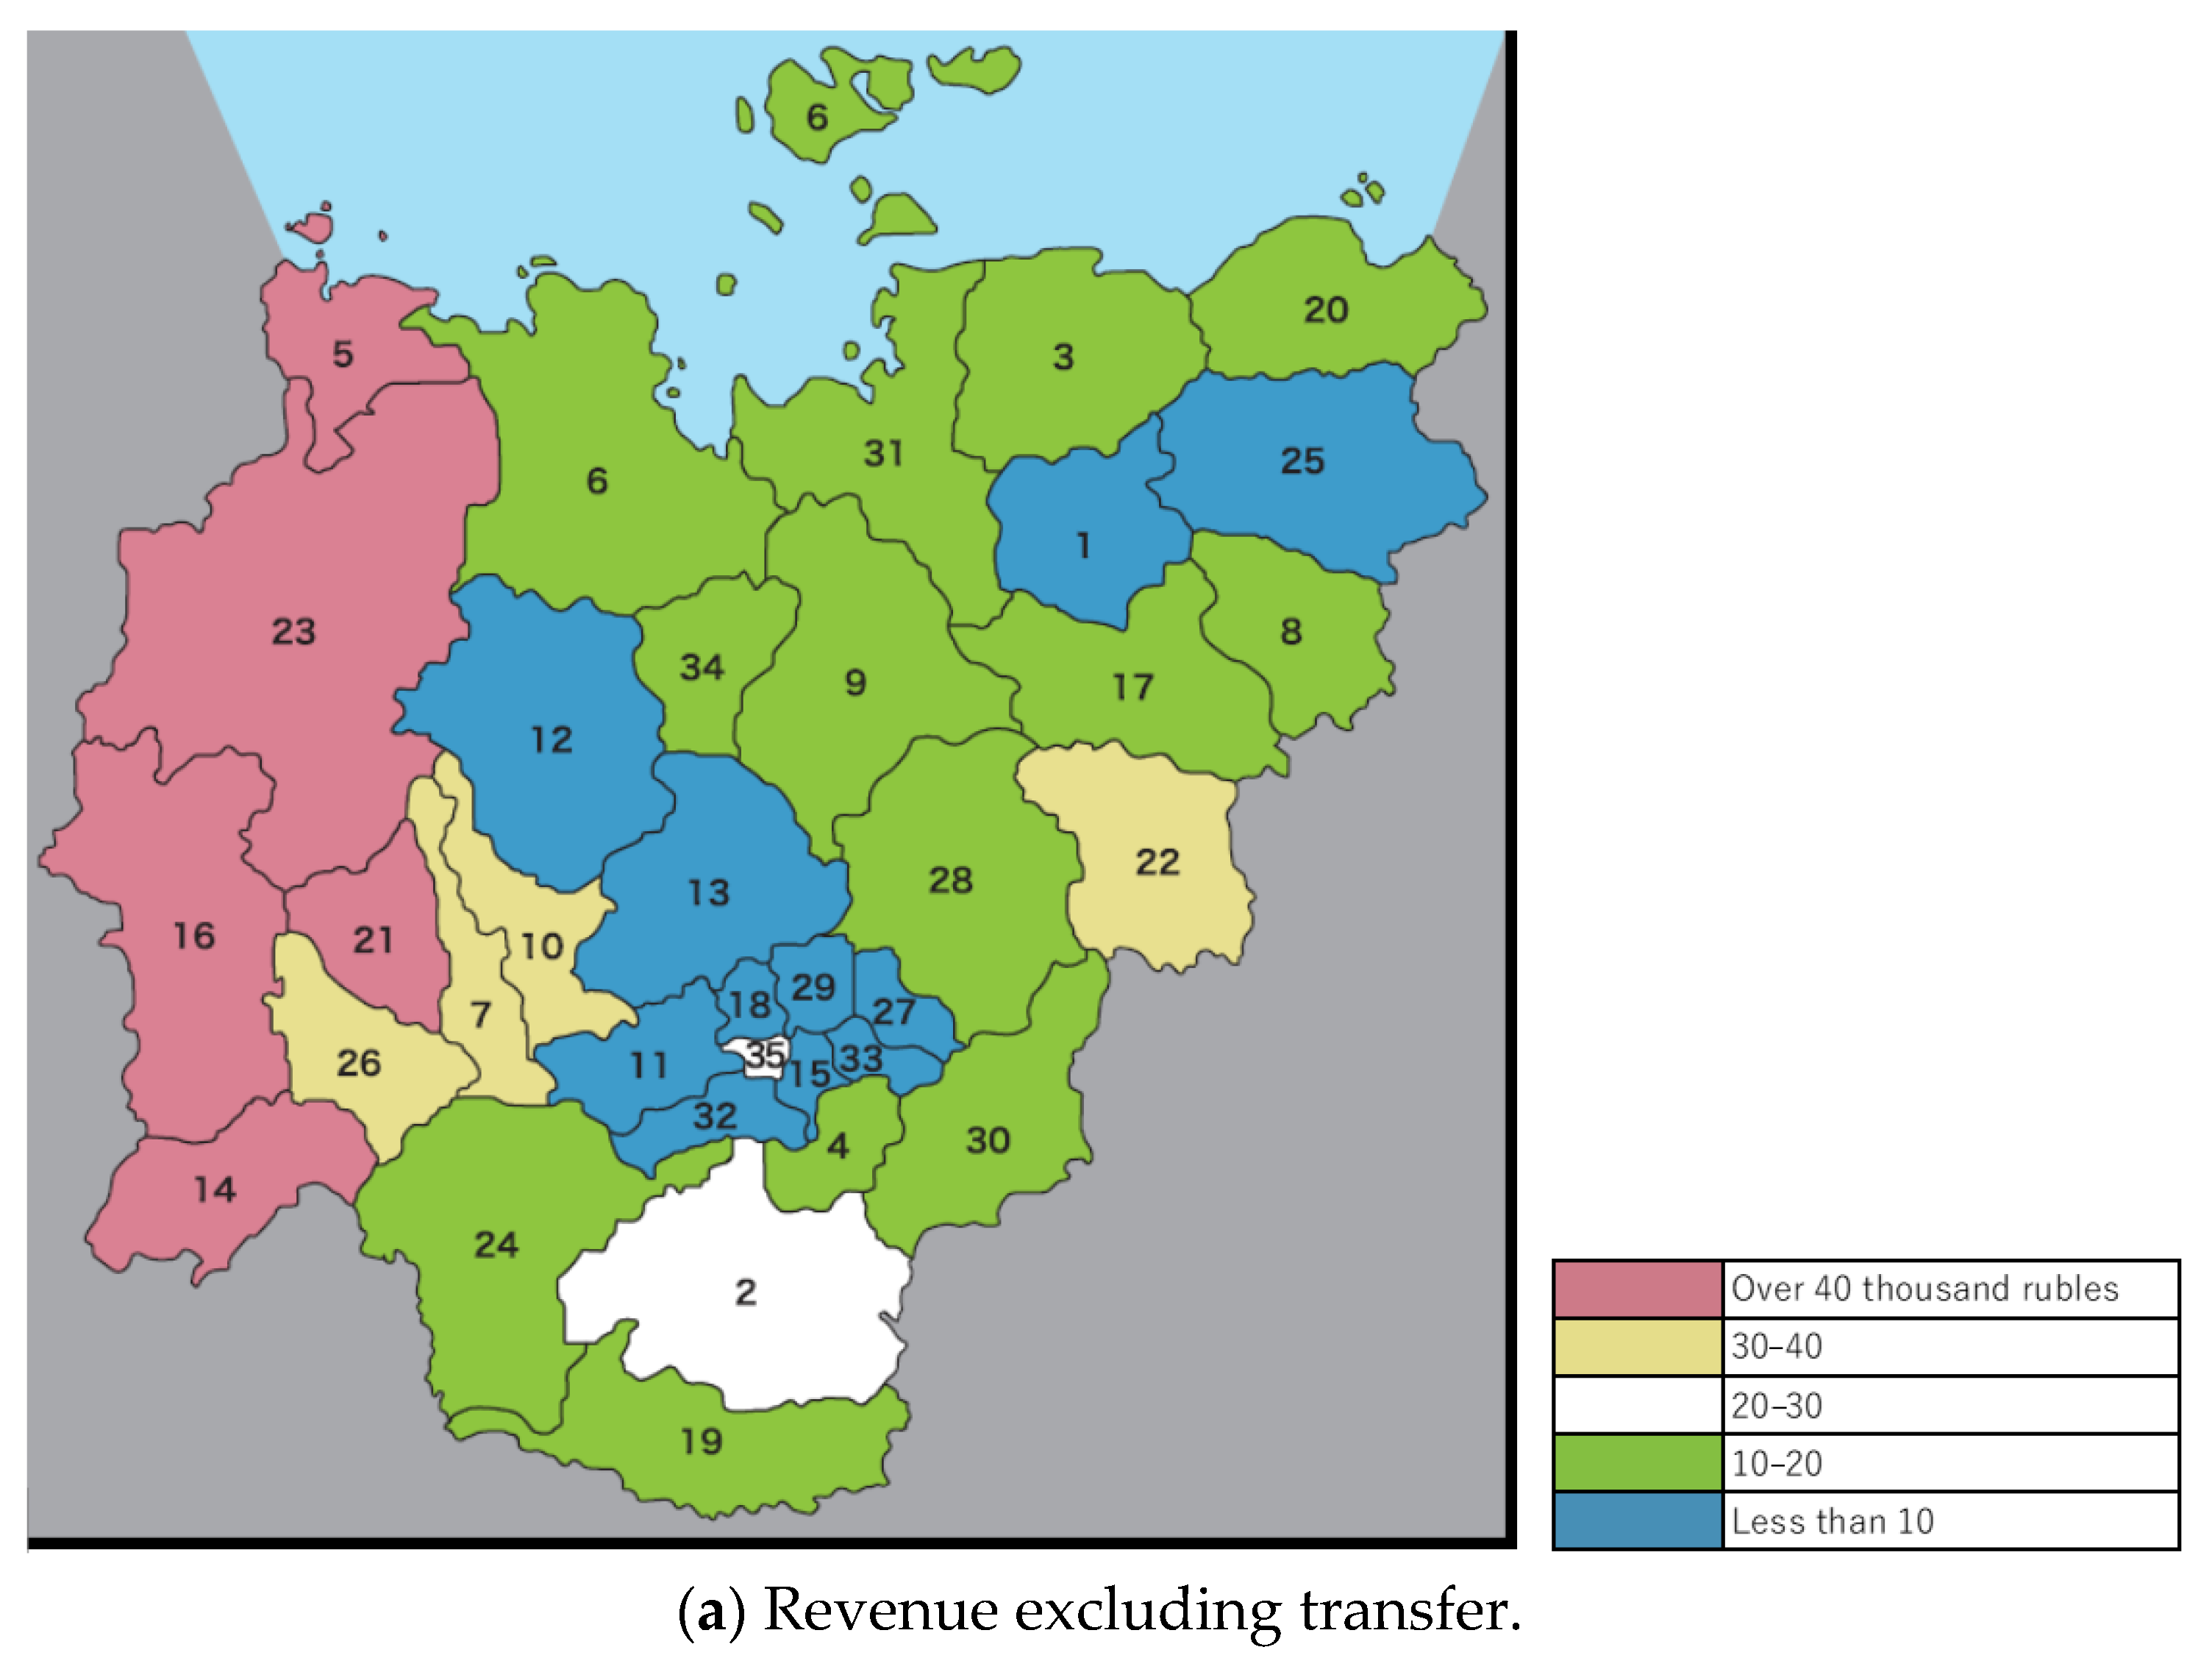
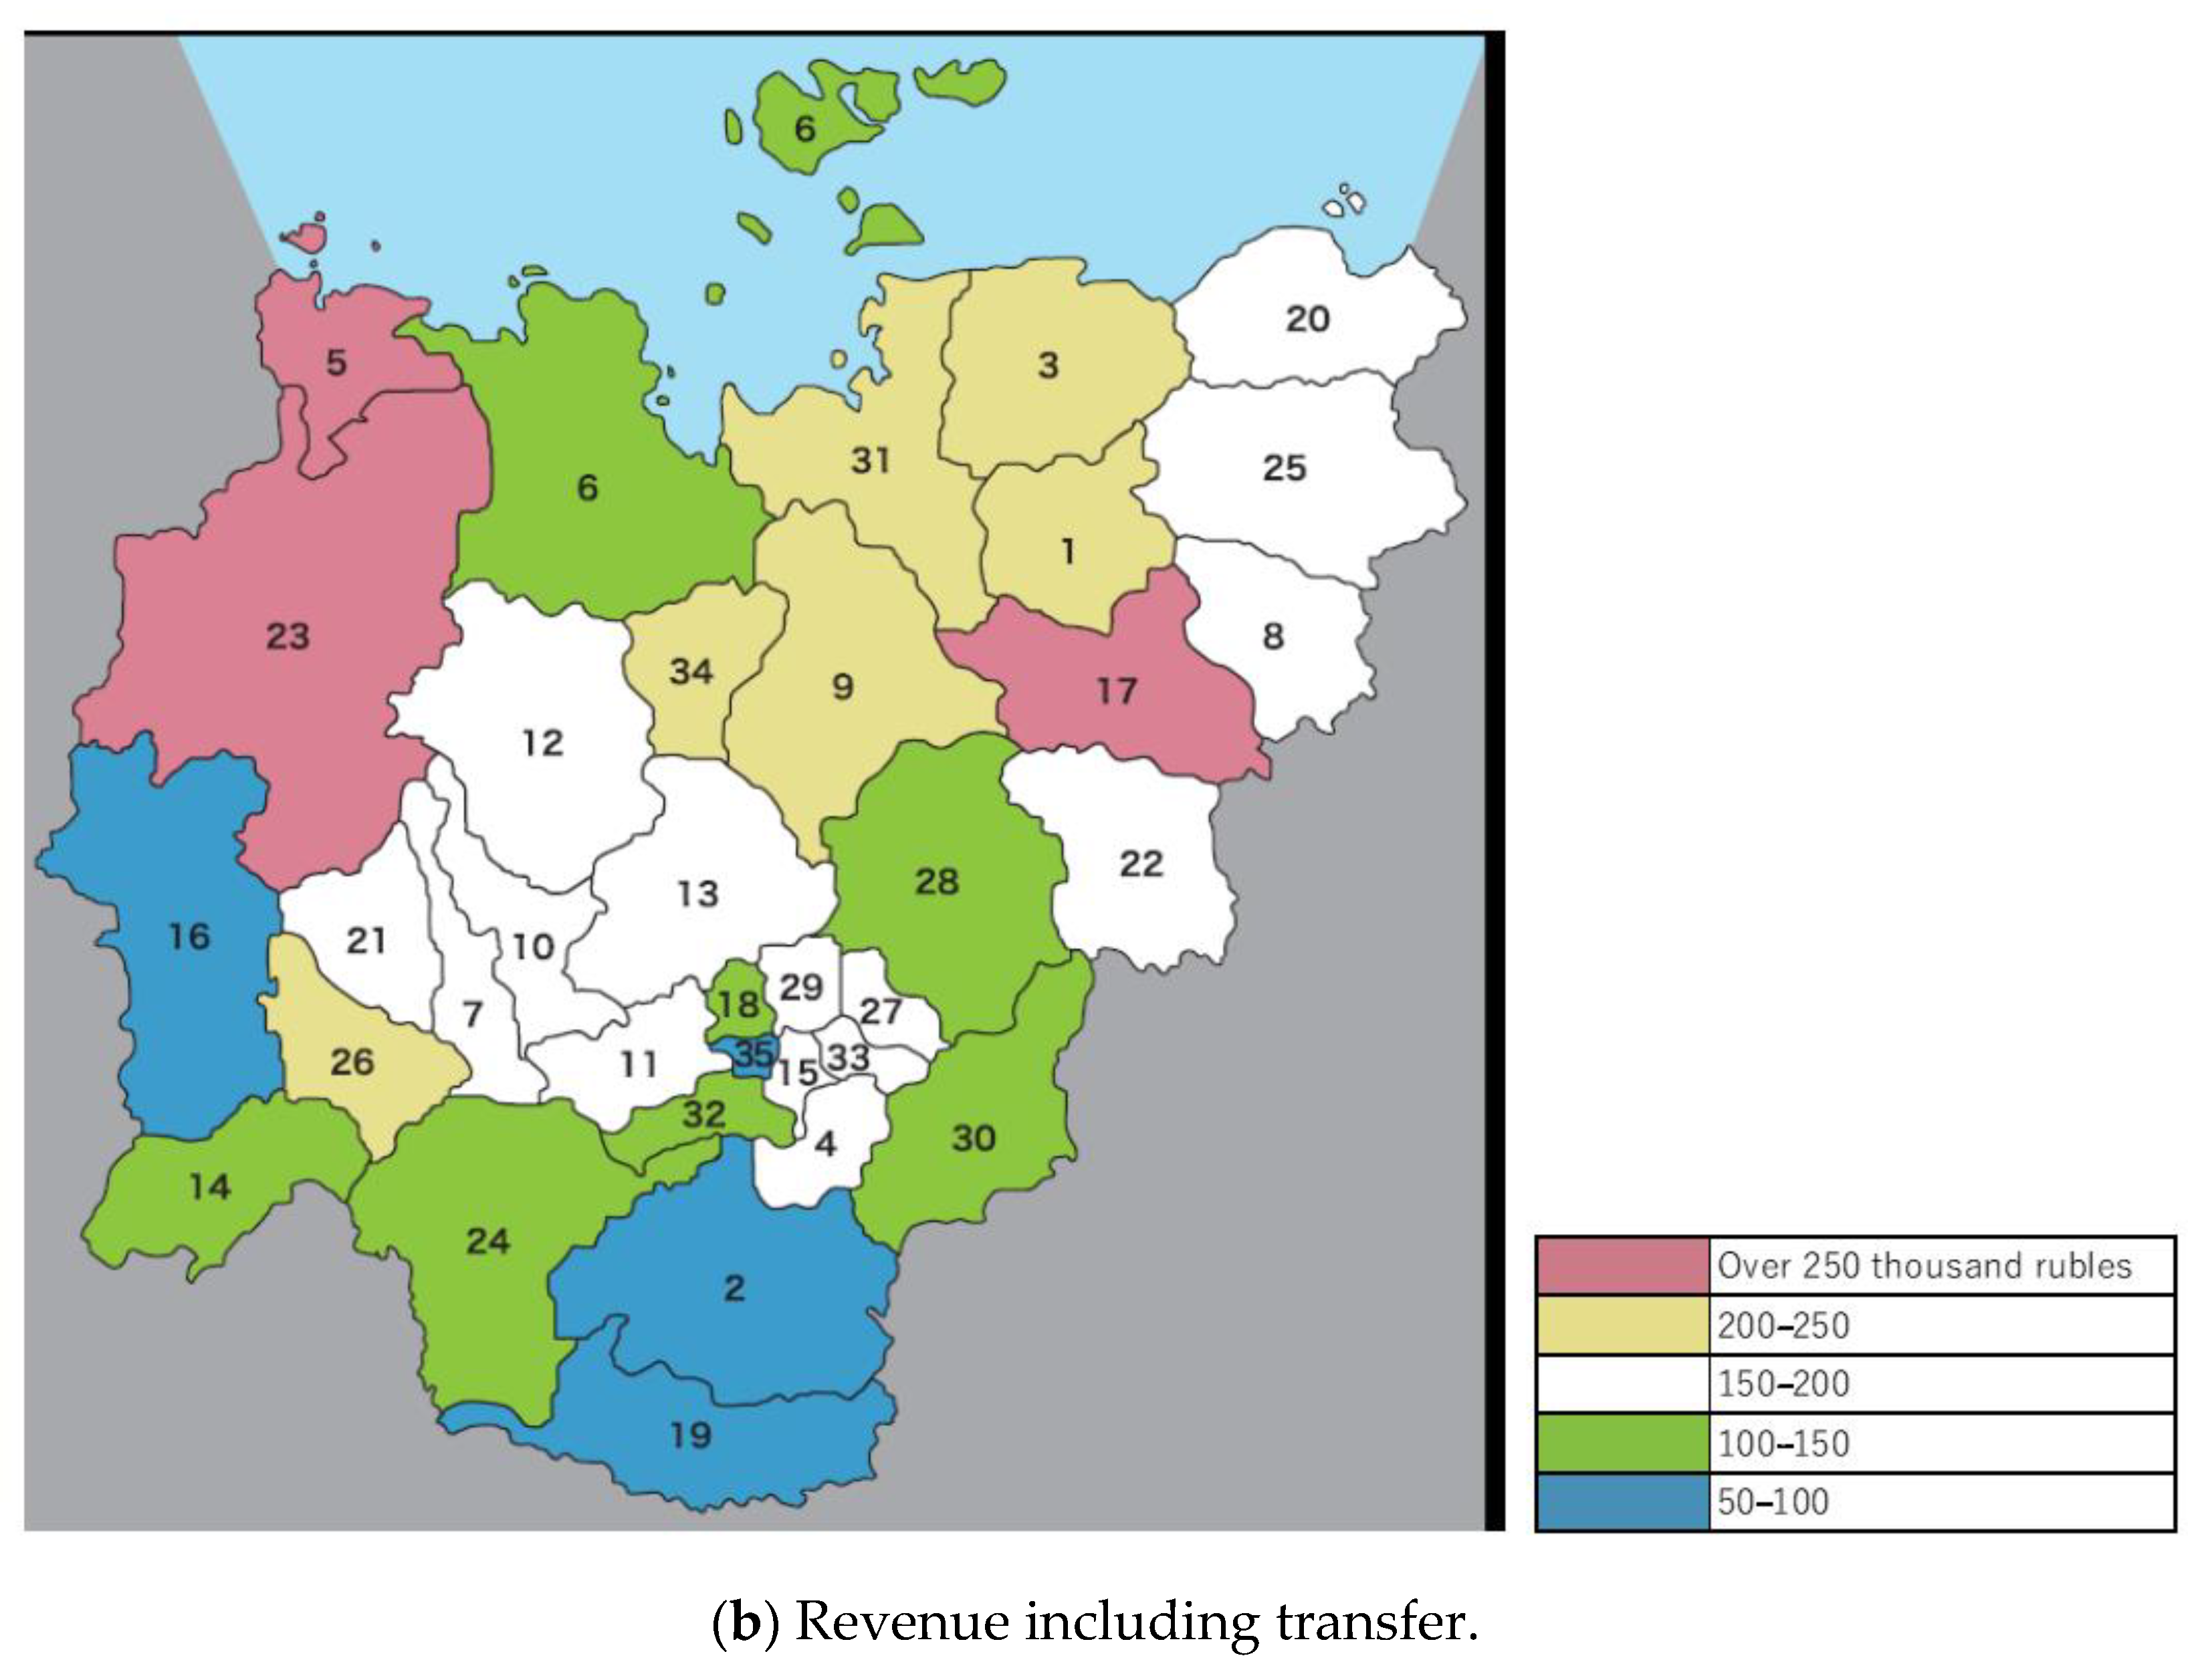
3.2. Contribution to Local Budgets
4. Concluding Remarks
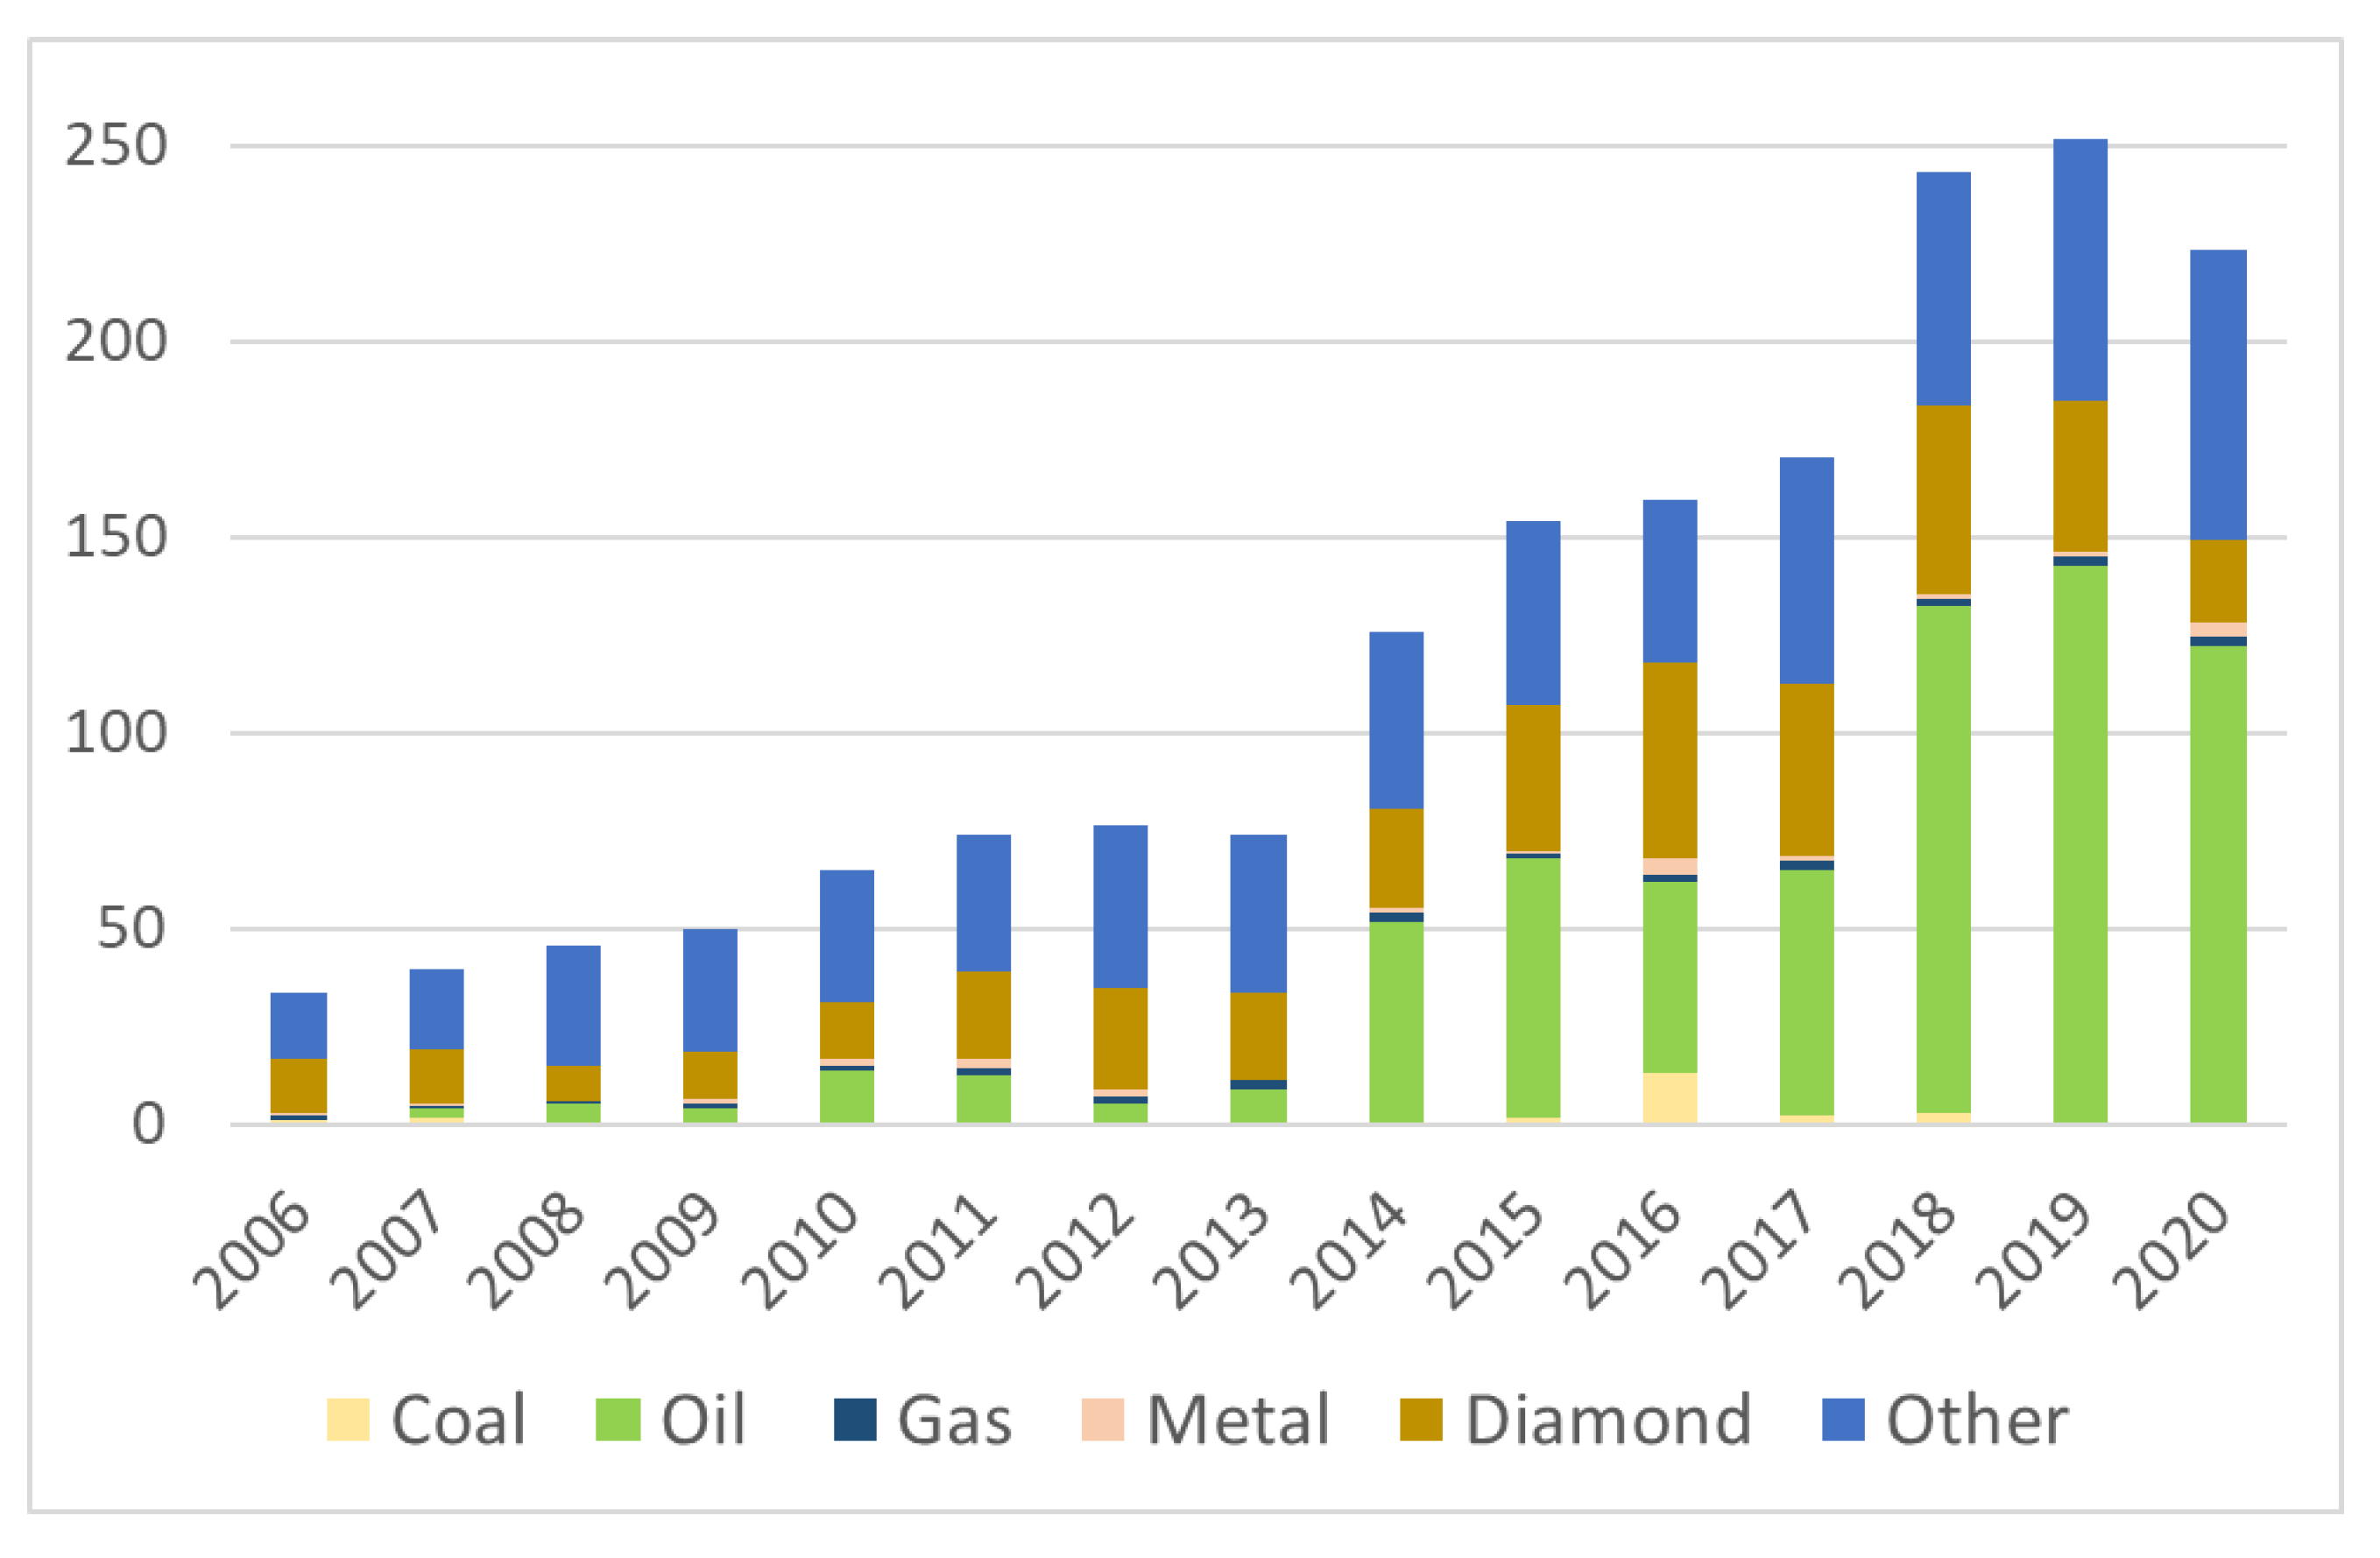
- The mining industry has been a driving force of the economic growth of Sakha in recent years. In the mining industry, the oil sector has sharply increased its presence, while the diamond sector has decreased its presence in the economic and industrial development of Sakha;
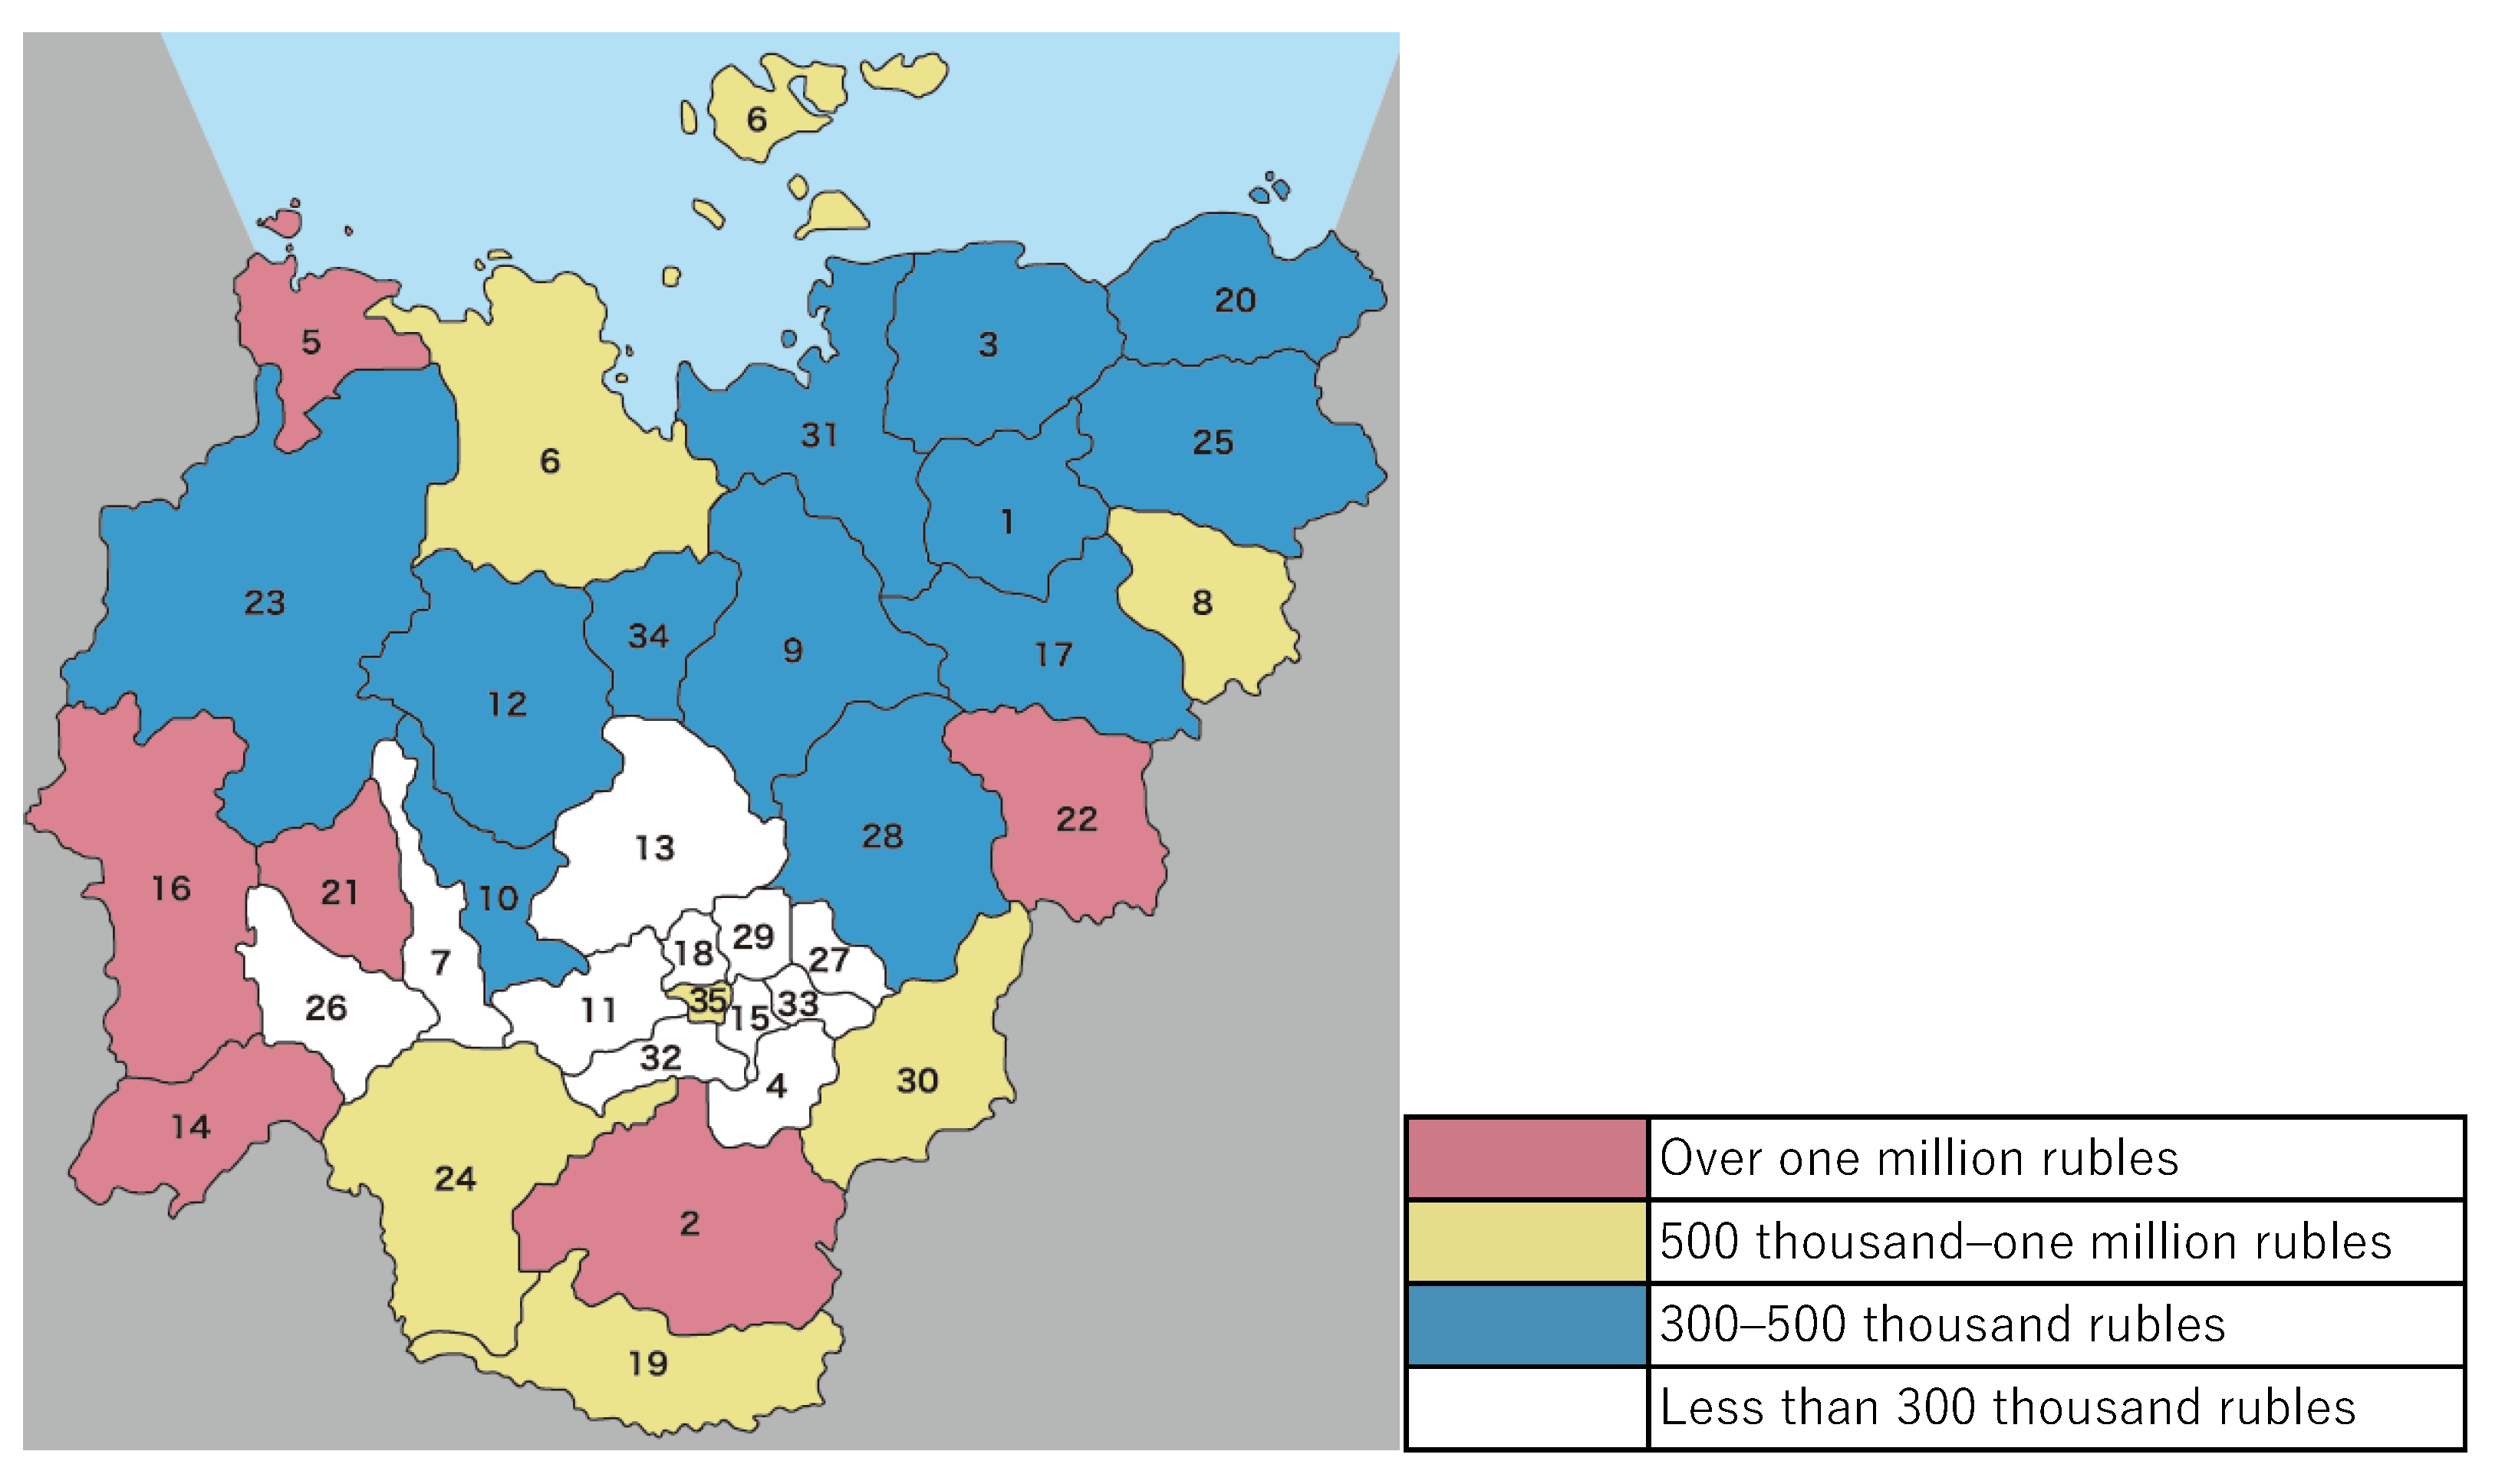
- The mining industry is unevenly developed in Sakha, which has caused significant inequality in per capita GMP. In other words, the mining industry has considerably increased GMP in several districts;
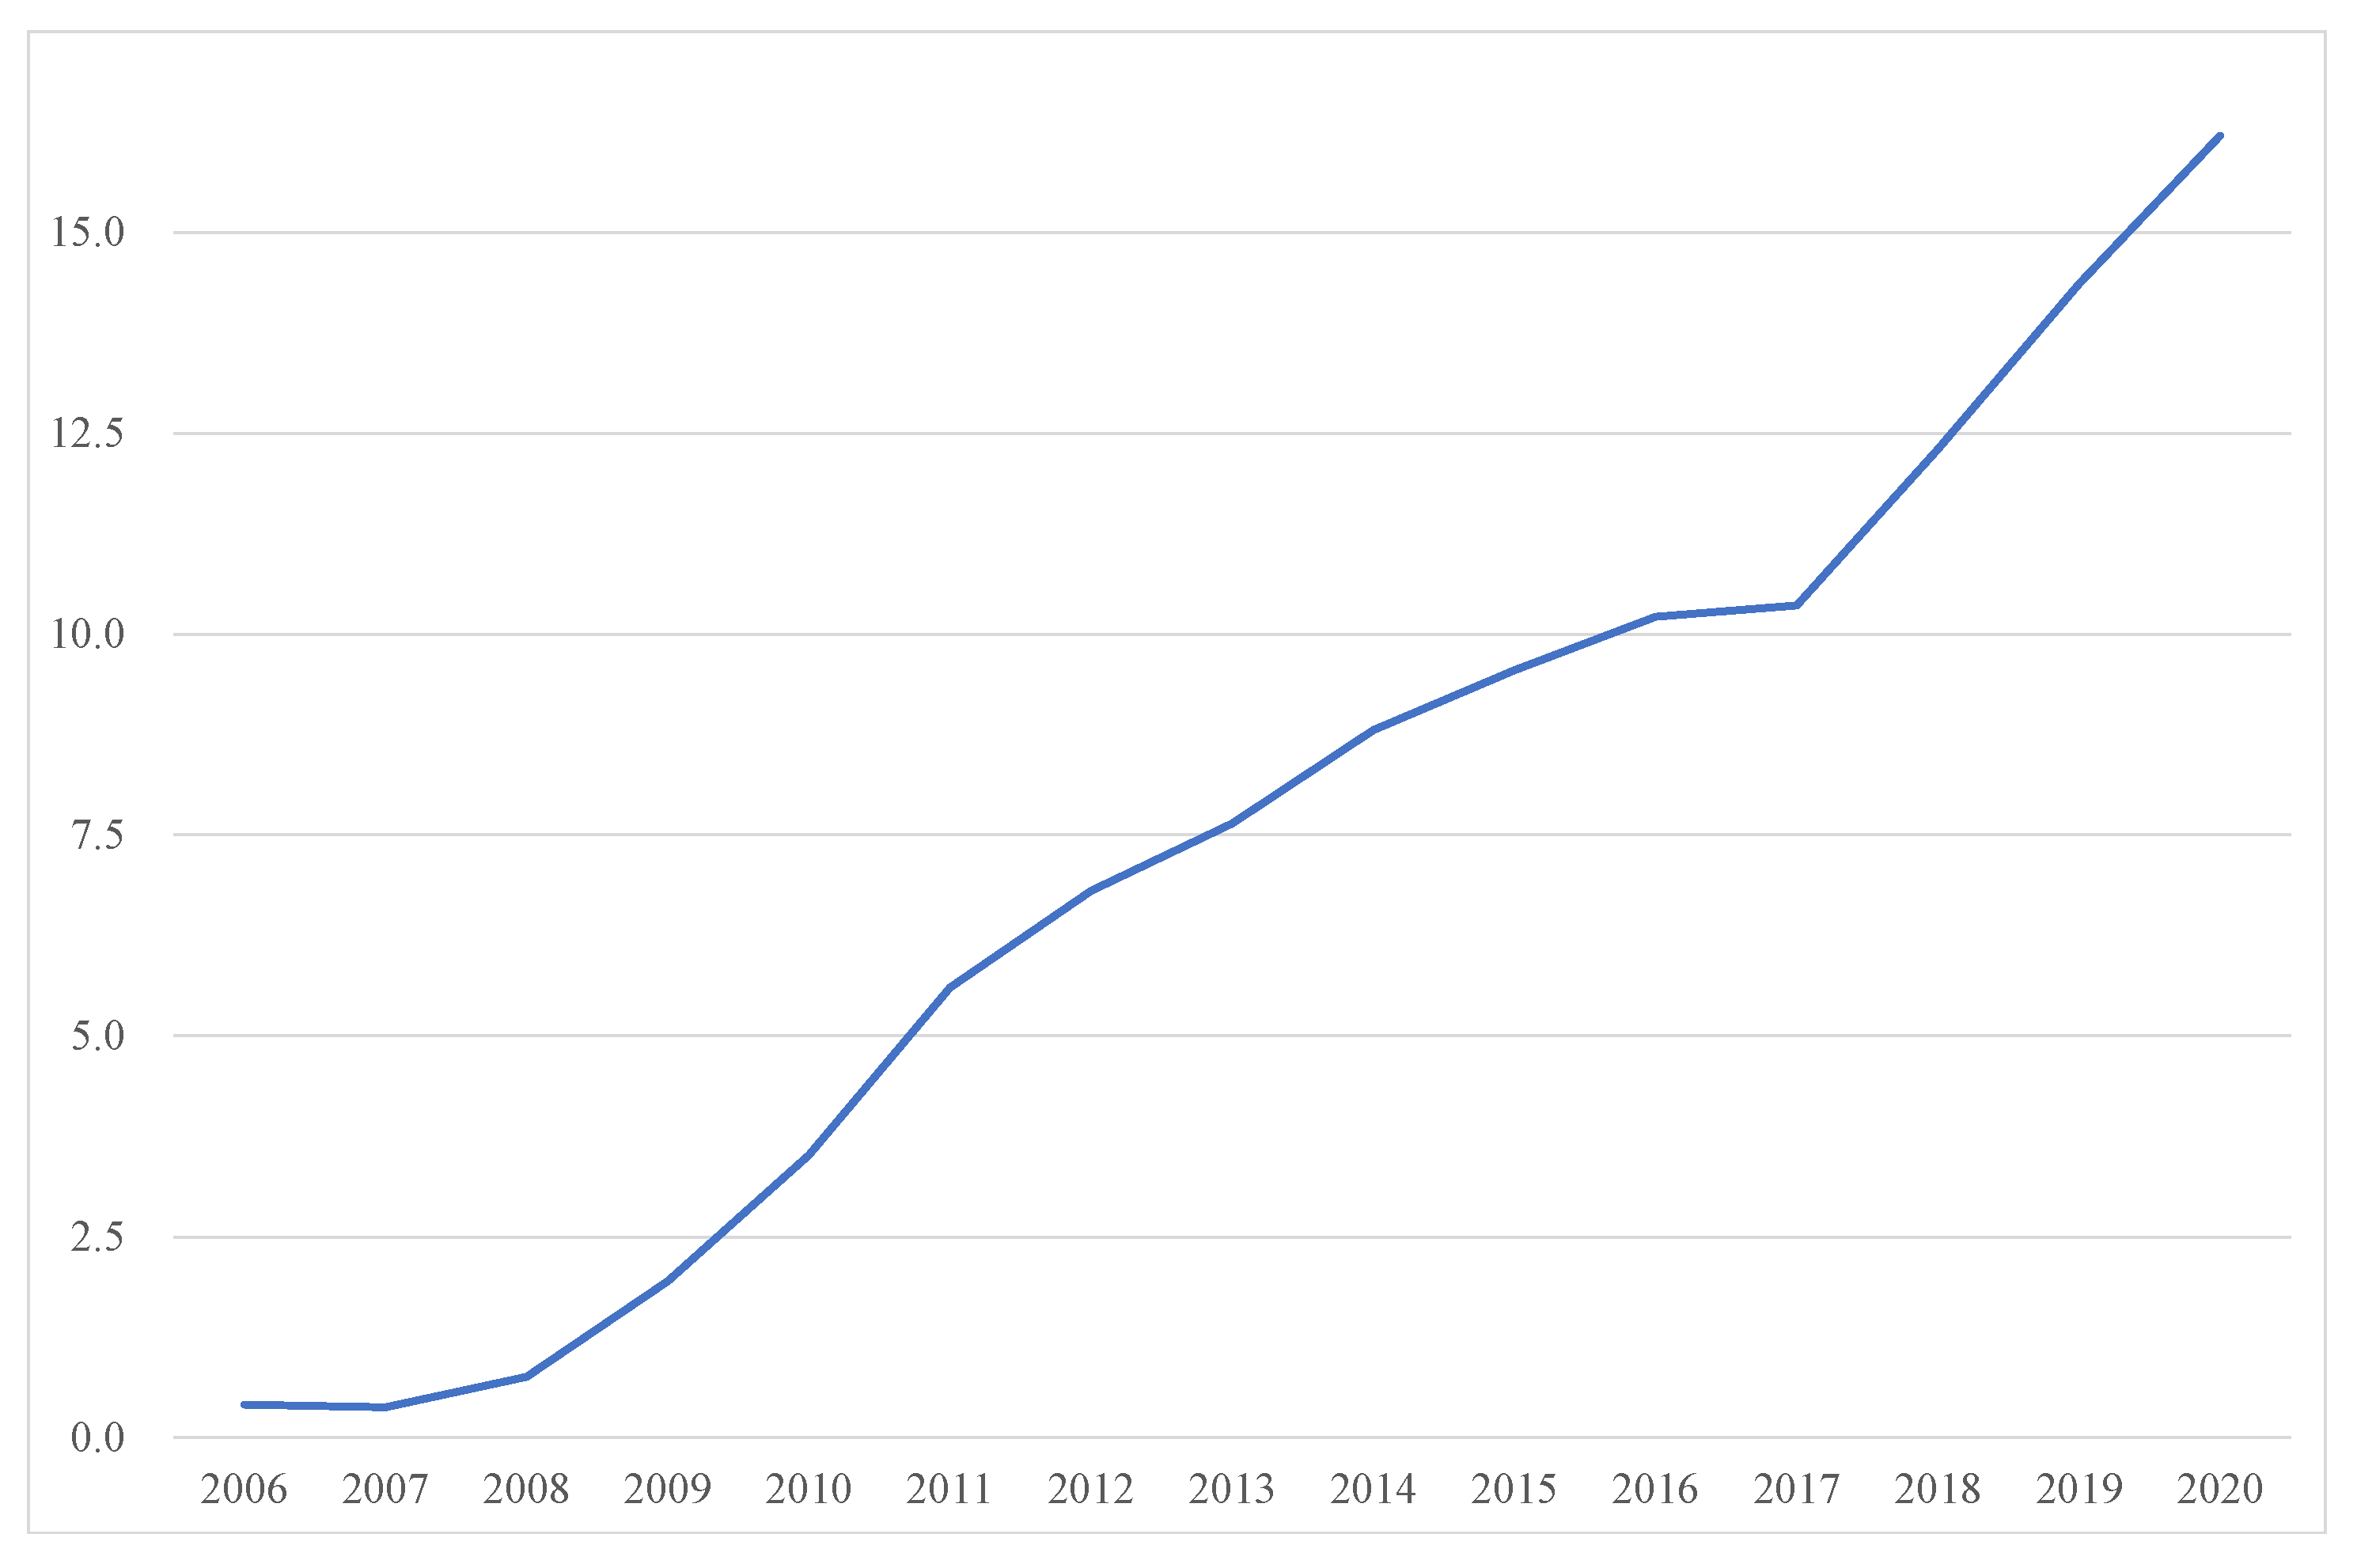
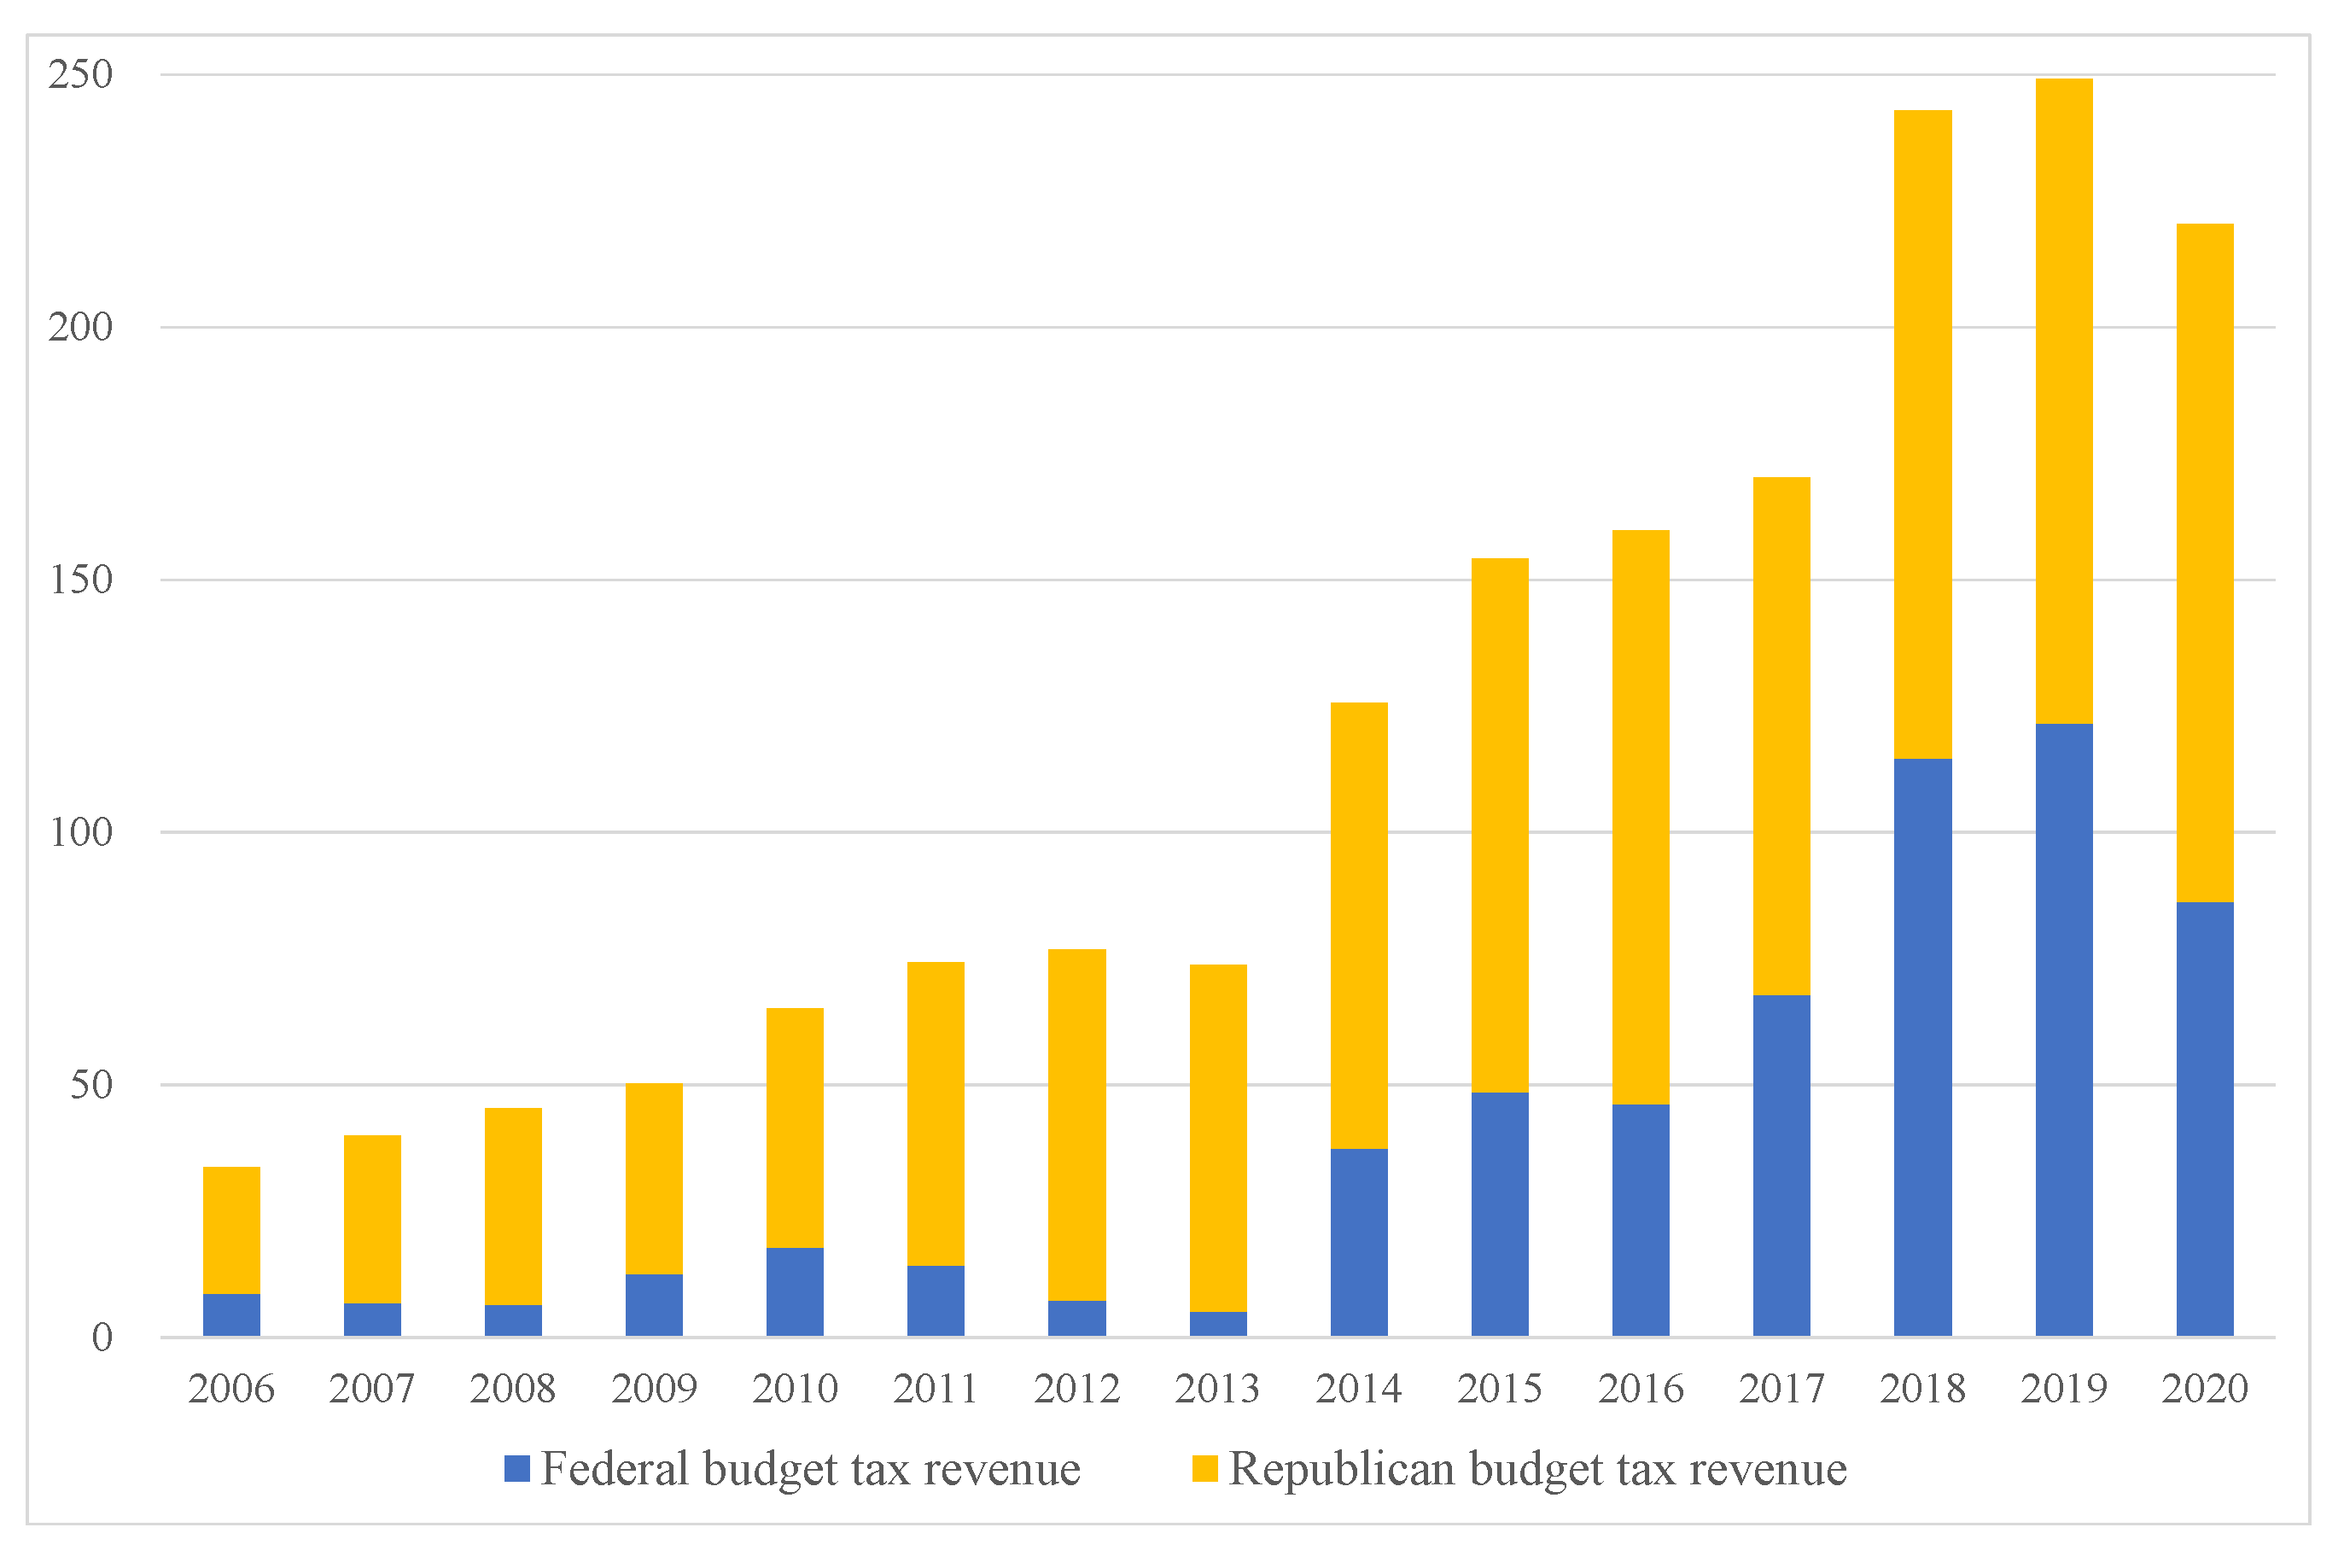
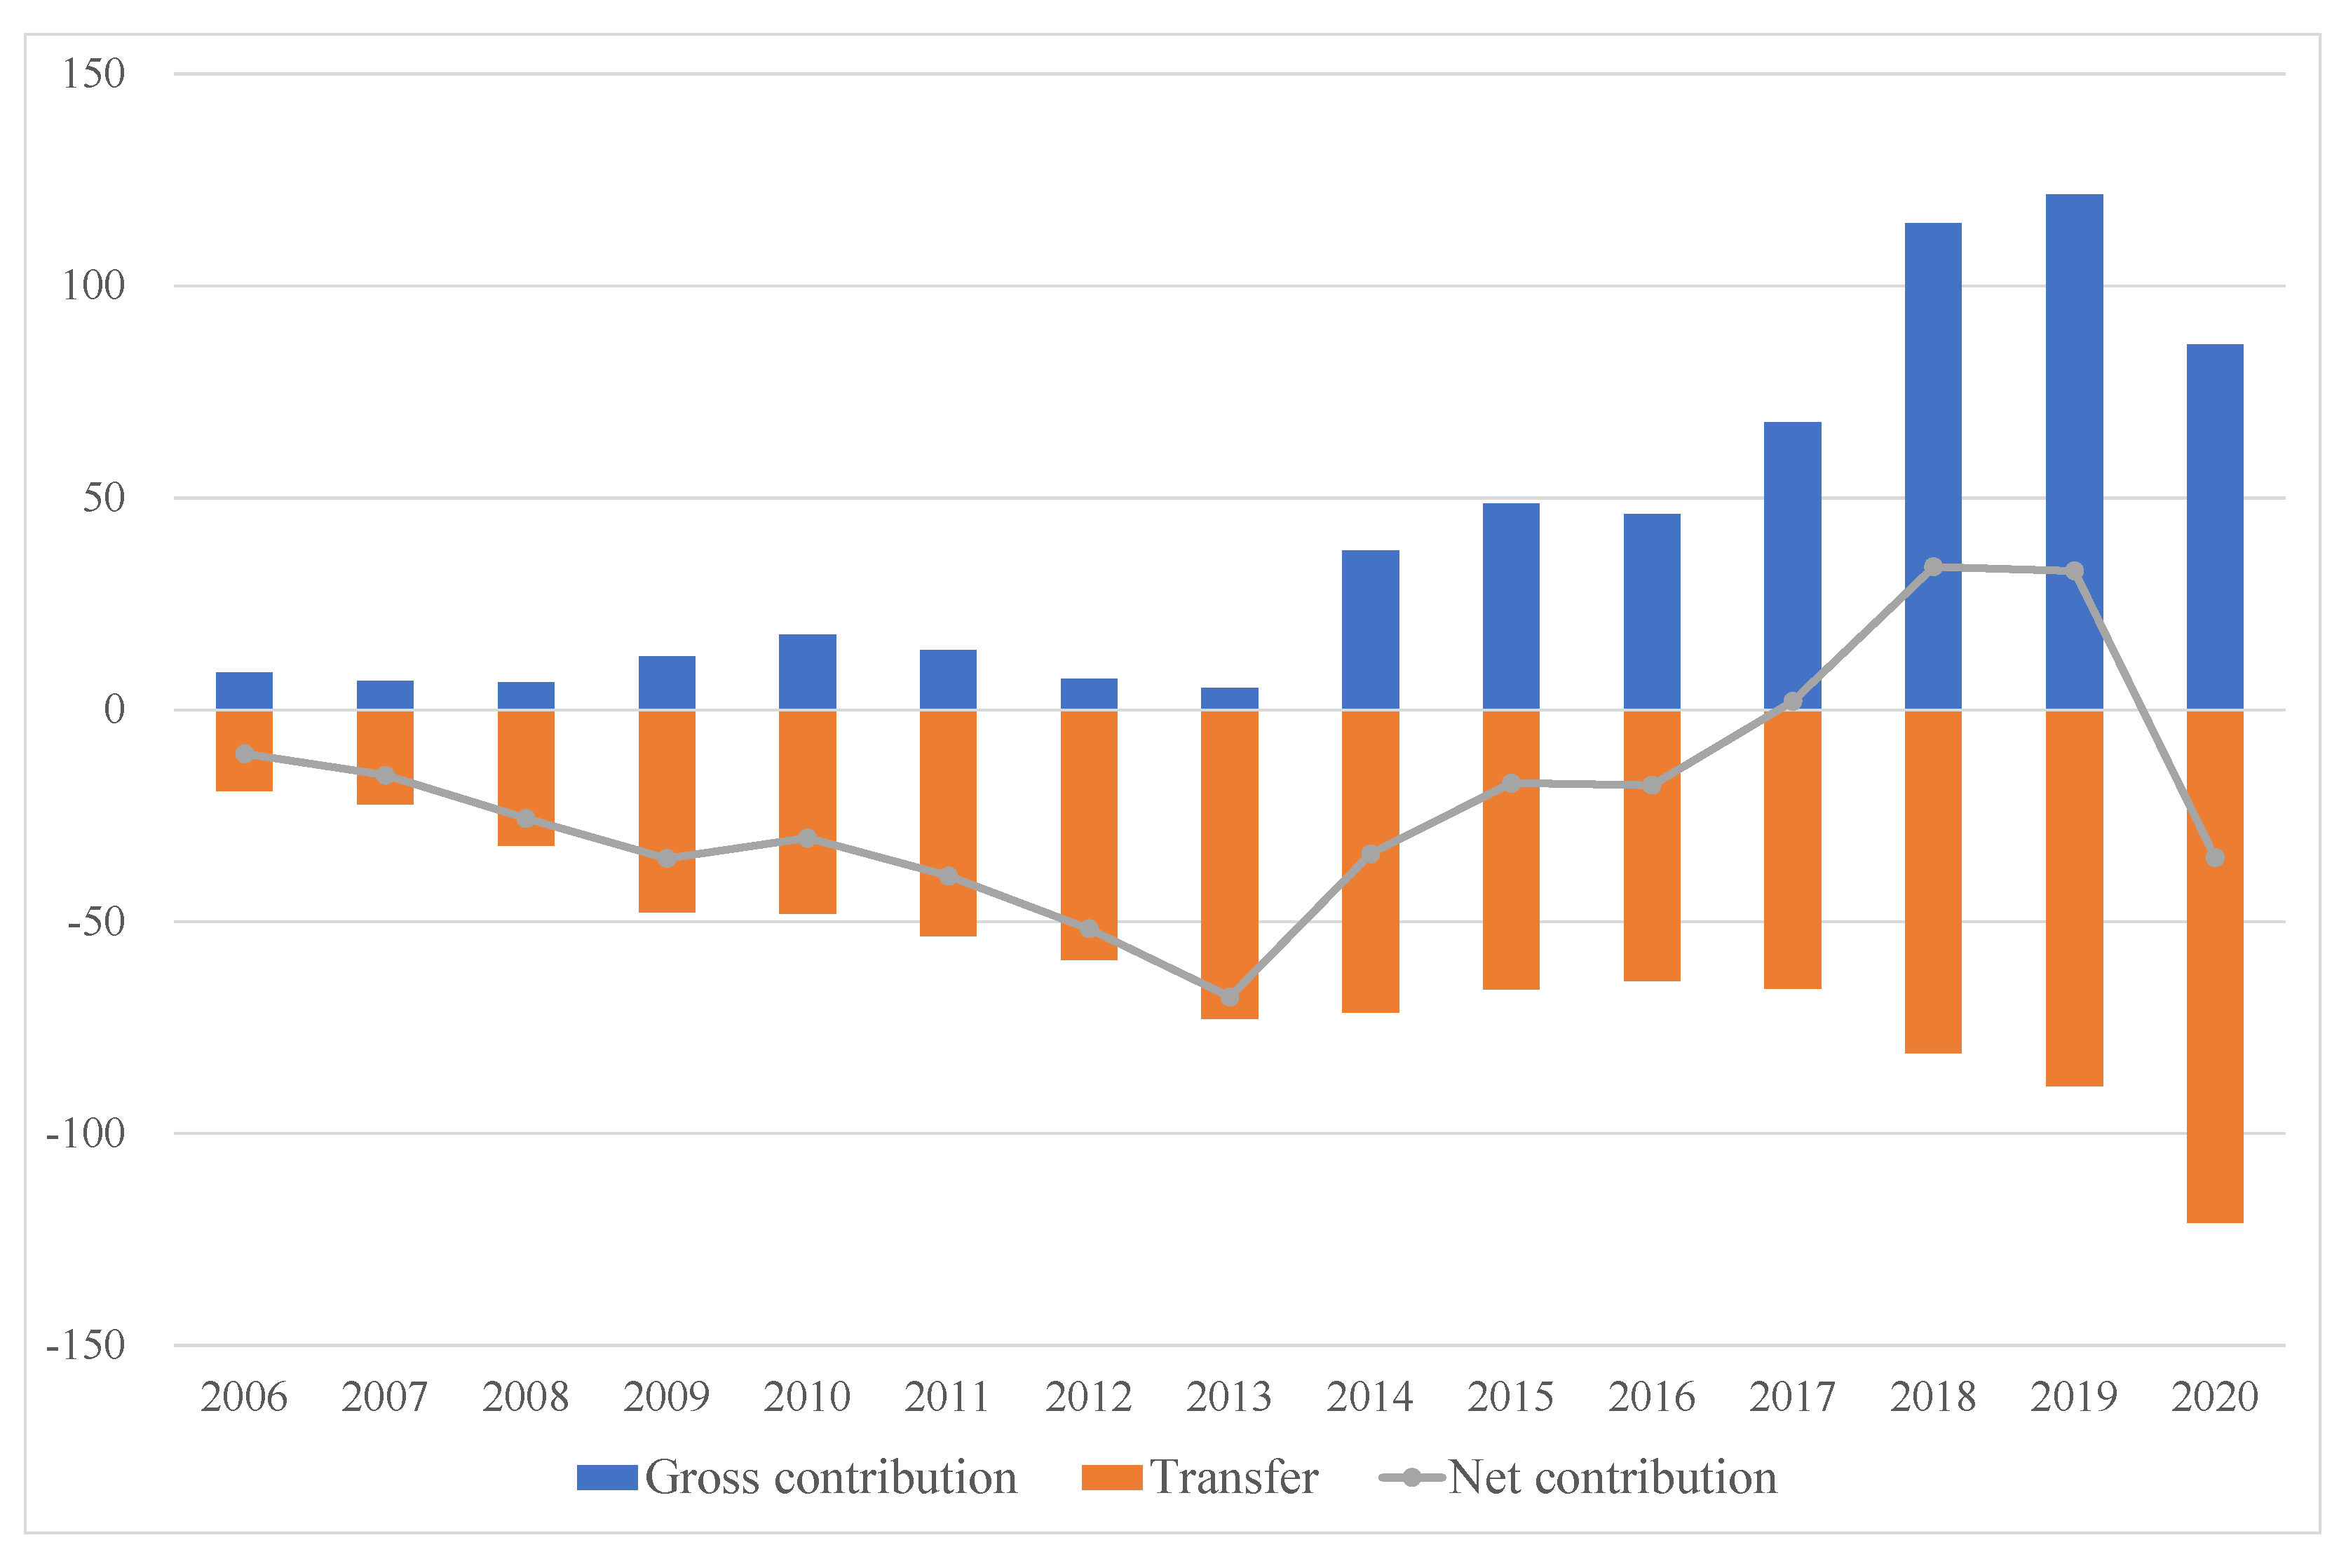
- Sakha’s contribution to the federal budget has increased significantly in recent years due to growing oil production. The importance of the oil sector of Sakha for the federal budget revenues has been enhanced considerably;
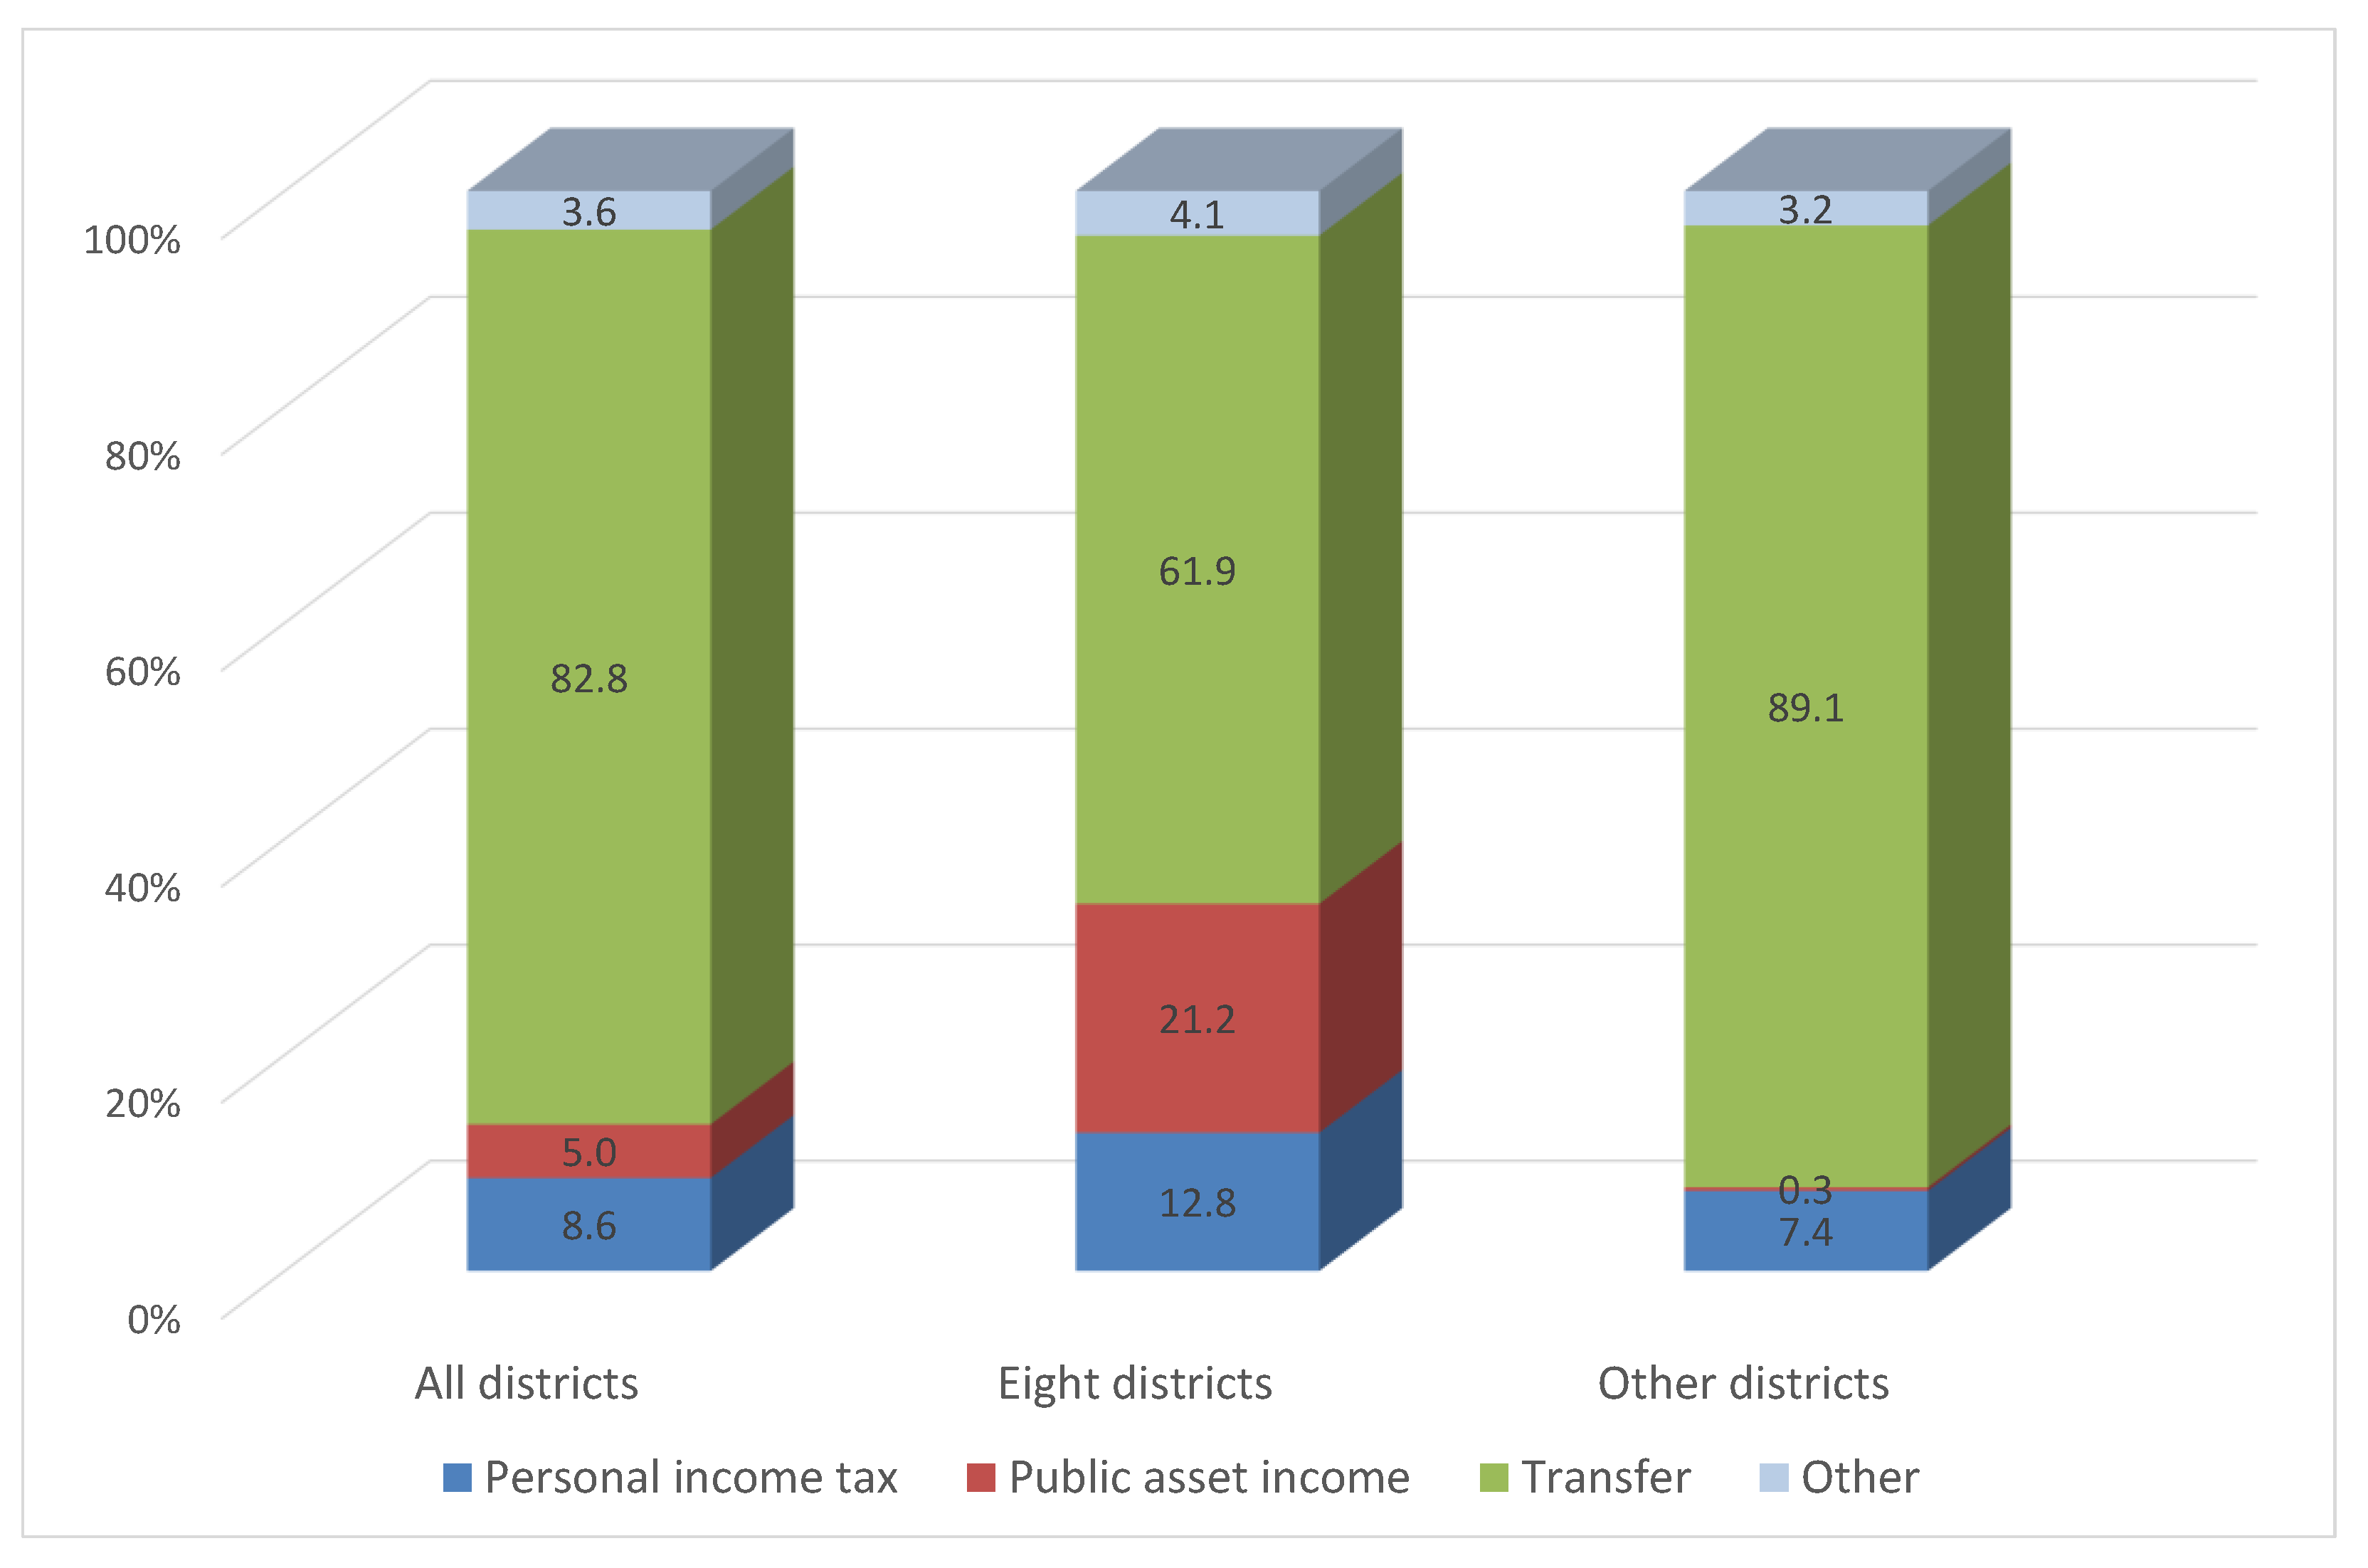
- Concerning the contribution to the republican and local budgets, the diamond sector is still more influential than the oil sector. While dividends of Alrosa caused considerable differences in per capita revenues of local budgets, revenues from the diamond sector account for 30% of republican budget revenues, from which transfer is provided to local budgets to equalize differences in local budget revenues.
Funding
Institutional Review Board Statement
Informed Consent Statement
Acknowledgments
Conflicts of Interest
Appendix A. Website Information on Data Used in This Paper
- -
- Equity information (Information for shareholders): http://www.alrosa.ru/%D0%B8%D0%BD%D0%B2%D0%B5%D1%81%D1%82%D0%BE%D1%80%D0%B0%D0%BC-%D0%B8-%D0%B0%D0%BA%D1%86%D0%B8%D0%BE%D0%BD%D0%B5%D1%80%D0%B0%D0%BC/ (accessed on 9 September 2021)
- -
- Export data of Sakha: http://stat.customs.gov.ru/unload (accessed on 9 September 2021)
- -
- Tax revenues: https://www.nalog.gov.ru/rn77/related_activities/statistics_and_analytics/forms/ (accessed on 9 September 2021)
- -
- Performance of consolidated regional budgets: https://roskazna.gov.ru/ispolnenie-byudzhetov/konsolidirovannye-byudzhety-subektov/ (accessed on 9 September 2021)
- -
- Performance of consolidated state budgets: https://roskazna.gov.ru/ispolnenie-byudzhetov/konsolidirovannyj-byudzhet/ (accessed on 9 September 2021)
- -
- Natural gas production in 2020: https://minenergo.gov.ru/node/1215 (accessed on 9 September 2021)
- -
- Diamond production in Russia: https://minfin.gov.ru/ru/perfomance/jewels/KimberleyProcess/ (accessed on 9 September 2021)
- -
- Local budget revenues of Sakha: https://minfin.sakha.gov.ru/bjudzhet/otchetnost/godovye-otchety (accessed on 9 September 2021)
- -
- GDP and GRP data: https://rosstat.gov.ru/accounts (accessed on 9 September 2021)
- -
- Local budget revenues of Sakha: http://www.gks.ru/dbscripts/munst/munst98/DBInet.cgi (accessed on 9 September 2021)
- -
- GRP: https://sakha.gks.ru/folder/32205 (accessed on 9 September 2021)
- -
- Industrial production: https://sakha.gks.ru/folder/35778 (accessed on 9 September 2021)
- -
- Population (year average): https://sakha.gks.ru/folder/32348 (accessed on 9 September 2021)
Appendix B. List of Municipalities in Sakha

| 1 | Abyysky | 10 | Vilyuisk | 19 | Neryungri | 28 | Tomponsky |
| 2 | Aldan | 11 | Gorny | 20 | Nizhnekolymsk | 29 | Ust-Aldan |
| 3 | Allaikhovsky | 12 | Zhigansk | 21 | Nyurba | 30 | Ust-May |
| 4 | Amginsky | 13 | Kobyui | 22 | Oymyakon | 31 | Ust-Yansky |
| 5 | Anabar | 14 | Lensk | 23 | Olenek | 32 | Khangalas |
| 6 | Bulun | 15 | Megino-Kangalas | 24 | Olyokminsk | 33 | Churapcha |
| 7 | Verkhnevilyuisk | 16 | Mirny | 25 | Srednekolymsk | 34 | Eveno-Bytantai |
| 8 | Verkhnekolymsk | 17 | Momsky | 26 | Suntar | 35 | Yakutsk |
| 9 | Verkhoyansk | 18 | Namsky | 27 | Tattinsky | 36 | Zhatay |
References
- Hill, F.; Gaddy, C. The Siberian Curse: How Communist Planners Left Russia Out in the Cold; Brookings Institution Press: Washington, DC, USA, 2003. [Google Scholar]
- Minprirody (Ministry of Natural Resources and Environment of the Russian Federation). Gosudarstvennyi Doklad o Sostoianii i Ispol’zovanii Mineral’no-syr’’evvykh Resursov Rossiiskoi Federatsii v 2019 Gody (National Report ’’On the State and Use of Mineral Resources of the Russian Federation); 2020. Available online: https://www.mnr.gov.ru/docs/gosudarstvennye_doklady/ (accessed on 9 September 2021).
- Kondratyeva, V.I.; Pulyaevskaya, V.L. Metodicheskii podkhod k opredeleniiu mesta munitsipal’nogo obrazovaniia v ekonomicheskom prostranstve regiona (Methodological Approach to the Determination of the Place of Municipalities in the Economic Space of the Region). Vestn. NGUEU 2017, 4, 77–85. [Google Scholar]
- Pulyaevskaya, V.L. Valovoi munitsipal’nyi product kak pokazatel’ otsenki ekonomicheskogo potentsiala raionov and gorodov (Gross Municipal Product as Measure of Estimation of Economic Potential of Districts and Cities). Vestn. NGUEU 2012, 3, 159–166. [Google Scholar]
- Pulyaevskaya, V.L. Valovoi munitsipal’nyi product v otsenke urovnia ekonomicheskogo razvitiia Respubliki Sakha (Iakutiia) (Gross Municipal Product in Assessing the Level of Economic Development of the Republic of Sakha (Yakutia)). Vestn. NGUEU 2015, 4, 135–144. [Google Scholar]
- Grigoŕeva, E. Nalogovye i sotsial’nye obiazatel’stva predpriiatii almazno-brilliantovogo kompleksa Iakutii (Tax and Social Obligation of Diamond-Brilliant Branch of Yakutia). Prior. Napravleniia Razvit. Nauk. i Obraz. 2015, 3, 274–279. [Google Scholar]
- Rosstat. Regiony Rossii. Sotsial’no-Ekonomicheskie Pokazateli—2020 g.(Regions of Russia. Social-Economic Indicators—2020). Available online: https://rosstat.gov.ru/storage/mediabank/LkooETqG/Region_Pokaz_2020.pdf (accessed on 9 September 2021).
- Soromotin, A. Neftegazovye resursy respubliki Sakha (Iakutiia): Sostoianie, perspektivy ispol’zovaniia (Oil and Gas Resources of the Republic of Sakha (Yakutia): State and Prospects of Use). Vestn. SVFU 2014, 11, 129–136. [Google Scholar]
- Filimonova, I.; Moiseev, S.; Nemov, V.; Provornaya, I. Neft’ i gaz Iakutii: Perspektivy i ogranicheniia (Oil and Gas of Yakutia: Perspectives and Constraint). Heftegazovaia Vertikal’ 2019, 20–21, 32–42. [Google Scholar]
- Grigoŕeva, E. Predposylki k izmeneniiu struktury biudzhetnykh dokhodov regiona na osnove prognoznoi otsenki zapasov prirodnykh almazov do 2050 g. (Prerequisites for Change in the Structure of Budgetary Revenues of the Region Based on Predictive Estimates of Natural Diamond Reserves till 2050). Seriia Vestn. SVFU 2017, 4, 22–29. [Google Scholar]
- Maksimova, K.L.; Popova, A.I. Otsenka sobremennoi podgotovki kadrov dlia granil’no-iuvelirnoi promyshlennosti v RS (Ia) (Evaluation of Modern Training for the Jewelry Industry in the Republic of Sakha (Yakutia)). Strateg. Ustoichivogo Razvit. Reg. Ross. 2016, 32, 30–36. [Google Scholar]
- Kuboniwa, M. Estimating GDP and foreign rents of the oil and gas sector in the soviet union and present-day Russia. In Russian Economic Development over Three Centuries: New Data and Inferences; Kuboniwa, M., Nakamura, Y., Kumo, K., Shida, Y., Eds.; Palgrave Macmillan: Singapore, 2019; pp. 421–438. [Google Scholar]
- Alrosa. Godovye Otchety (Annual Report). Various Years. Available online: http://www.alrosa.ru/documents/%d0%b3%d0%be%d0%b4%d0%be%d0%b2%d1%8b%d0%b5-%d0%be%d1%82%d1%87%d0%b5%d1%82%d1%8b/ (accessed on 9 September 2021).
- Tabata, S.; Liu, X. Russia’s energy policy in the far east and east Siberia. In Russia’s Energy Policy: National, Interregional and Global Dimensions; Pami, A., Ed.; Edward Elgar: Cheltenham, UK, 2012; pp. 156–181. [Google Scholar]
- Tabata, S. Finansovye potoki mezhdu federal’nym biudzhetom i arkticheskimi regionami Rossii (Flow of Financial Resources between the Federal Budget and the Arctic Regions in Russia). Reg. Ekon. Sotsiologiia 2019, 3, 3–25. [Google Scholar] [CrossRef]
- Alexeev, M.; Weber, S. Russian fiscal federalism: Impact of political and fiscal (de)centralization. In The Oxford Handbook of the Russian Economy, Alexeev, M., Weber, S., Eds.; Oxford University Press: New York, NY, USA, 2013; pp. 643–660. [Google Scholar]
- Danilov, Y.; Leontiev, S. Dobycha almazov v Arkticheskikh raionakh Respubliki Sakha (Iakutiia) (Diamond Mining in the Arctic Regions of the Sakha Republic (Yakutia)). Kontsept 2016, 11, 1–6. [Google Scholar]
- Yakovleva, N.P.; Alabaster, T.; Petrova, P.G. Natural Resource Use in the Russian North: A Case Study of Diamond Mining in the Republic of Sakha. Environ. Manag. Health 2000, 11, 318–336. [Google Scholar] [CrossRef]


| 2006 | 2010 | 2015 | |
|---|---|---|---|
| In million rubles | |||
| Total GRP | 206,845 | 386,825 | 749,987 |
| Mining industry | 80,571 | 154,548 | 361,253 |
| including | |||
| Coal | 9228 | 18,289 | 17,890 |
| Oil and gas | 2988 | 43,424 | 127,718 |
| Metal | 6138 | 14,045 | 33,933 |
| Diamond | 62,217 | 78,748 | 181,712 |
| In percentages | |||
| Total GRP | 100.0 | 100.0 | 100.0 |
| Mining industry | 39.0 | 40.0 | 48.2 |
| including | |||
| Coal | 4.5 | 4.7 | 2.4 |
| Oil and gas | 1.4 | 11.2 | 17.0 |
| Metal | 3.0 | 3.6 | 4.5 |
| Diamond | 30.1 | 20.4 | 24.2 |
| Crude Oil | Lensk | 66.4 | Mirny | 33.6 | ||
| Natural Gas | Vilyuysk | 63.0 | Lensk | 30.2 | Mirny | 6.8 |
| Coal | Neryungri | 95.5 | ||||
| Diamond | Mirny | 54.8 | Nyurba | 30.0 | Anabar | 15.2 |
| Gold (2015) | Oymyakon | 47.1 | Aldan | 35.1 | Olyokminsk | 6.6 |
| Total Tax Revenue | Federal Budget Tax Revenue | Republican Budget Tax Revenue | Extraction Tax | Corporate Tax | Personal Income Tax | Asset Tax | |
|---|---|---|---|---|---|---|---|
| All industries | 100.0 | 100.0 | 100.0 | 100.0 | 100.0 | 100.0 | 100.0 |
| Mining industry | 74.3 | 93.4 | 59.3 | 99.8 | 79.7 | 27.1 | 40.9 |
| including | |||||||
| Oil and gas | 58.5 | 105.3 | 18.2 | 83.7 | 40.1 | 5.4 | 14.7 |
| Diamond | 15.6 | −0.3 | 30.3 | 12.6 | 29.5 | 12.2 | 22.7 |
| Other | 25.7 | 6.6 | 40.7 | 0.2 | 20.3 | 72.9 | 59.1 |
Publisher’s Note: MDPI stays neutral with regard to jurisdictional claims in published maps and institutional affiliations. |
© 2021 by the author. Licensee MDPI, Basel, Switzerland. This article is an open access article distributed under the terms and conditions of the Creative Commons Attribution (CC BY) license (https://creativecommons.org/licenses/by/4.0/).
Share and Cite
Tabata, S. The Contribution of Natural Resource Producing Sectors to the Economic Development of the Sakha Republic. Sustainability 2021, 13, 10142. https://doi.org/10.3390/su131810142
Tabata S. The Contribution of Natural Resource Producing Sectors to the Economic Development of the Sakha Republic. Sustainability. 2021; 13(18):10142. https://doi.org/10.3390/su131810142
Chicago/Turabian StyleTabata, Shinichiro. 2021. "The Contribution of Natural Resource Producing Sectors to the Economic Development of the Sakha Republic" Sustainability 13, no. 18: 10142. https://doi.org/10.3390/su131810142
APA StyleTabata, S. (2021). The Contribution of Natural Resource Producing Sectors to the Economic Development of the Sakha Republic. Sustainability, 13(18), 10142. https://doi.org/10.3390/su131810142