Article

Using ClassCraft to Improve Primary School Students’ Knowledge and Interest in Sustainable Mobility

1
Departamento de Ciencias de la Educación, Universidad de Burgos, 09001 Burgos, Spain
2
Departamento de Ingenieria Civil, Universidad de Burgos, 09001 Burgos, Spain
3
Departamento de Transportes y Tecnologia de Proyectos y Procesos, Universidad de Cantabria, 39005 Santander, Spain
*
Author to whom correspondence should be addressed.
Sustainability 2021, 13(17), 9939; https://doi.org/10.3390/su13179939
Submission received: 4 August 2021 / Revised: 31 August 2021 / Accepted: 2 September 2021 / Published: 4 September 2021
(This article belongs to the Section Sustainable Transportation)

Abstract

:
Teaching students awareness about sustainable mobility has been lacking to date. There is a need to expand the themes being addressed in order to achieve a change in attitude. Society needs to design a curriculum that teaches about sustainable mobility to guarantee a better environment for future generations. This article presents the most important results of an experiment based on gamification to promote the education of sustainable mobility in primary school classrooms. This new teaching method, aimed at children aged 10–12 years old, applies non-gambling play metaphors to real-life tasks to motivate a change in attitude. The didactic approach was developed using the ClassCraft platform to create specific activities that consider the environmental, economic, and social aspects of sustainable mobility. The initial analysis revealed a perception about sustainable mobility that focused on environmental problems with very little input on the economic and social aspects. The experience has shown that by using the gamified ClassCraft tool applying structured activities about all aspects of sustainable mobility, the pupils acquired new concepts that clarified the social and economic components and began to develop a conscience about how to become an active part in behavioural change.

1. Introduction

Children are the future and their education and feelings about forming part of a community play a fundamental role in the configuration of any future society. Recognition that education is a key facilitator of sustainable mobility and development in general has been growing in importance. Providing the means and encouraging behaviour to achieve more sustainable mobility is a goal of ever-increasing importance for societies.
The methods used to communicate and educate about sustainable mobility have had shortcomings until now. Tonucci stated that schools develop activities to address road safety with the help of local councils and the municipal police [1]. Most educational studies and projects have concentrated on child safety, road safety, traffic rules, and promoting healthier options like walking and cycling to school [2]. There is a need to expand both the subjects being addressed to promote behavioural change and the tools used to achieve it.
The present study aims to observe and evaluate the use of gaming techniques as a key part of promoting learning and change towards more sustainable mobility habits.
To demonstrate the changes in learning and behaviour towards sustainable mobility, we concentrated on the following specific goals:
  • Evaluating pupils’ perception about sustainable mobility.
  • Evaluating the level of knowledge achieved from the experience.
The effects that gamification techniques have on student awareness of sustainable mobility were assessed through the following targets:
  • Evaluating student perception of gamification-based methodology.
  • Evaluating student satisfaction from using the game and methodology.
We developed an experience with fifth-grade children to demonstrate that students’ learning and satisfaction increases with the use of the gamification strategy. Gamified activities on sustainable mobility were designed to cover environmental, economic, and social aspects to promote a change in attitude.
Following the introduction, Section 2 provides a review of the relevant literature and how sustainable mobility has been presented to children, along with gamification and its application to mobility. Section 3 introduces the chosen methodology and describes the case study. The results are presented in Section 4. Finally, the main conclusions drawn are presented in Section 5 along with the limitations highlighted by the study and some possible future lines of research.

2. Literature Review

For the development of this research it is important to describe how teaching sustainable mobility to children has been addressed in the past and to analyse gamification and its application to mobility. These subjects will be analysed separately below.

2.1. Sustainable Developement

Sustainable development has been a continuously evolving concept since its first definition by the chairman of the United Nations World Commission on Environment and Development. The concept of sustainable development (SD) first appeared in the report “Our Common Future,” better known as the Brundtland Report [3]. Gro Harlem Brundtland was chair of the United Nations World Commission on Environment and Development and defined sustainability as “development that meets the needs of the present without compromising the ability of future generations to meet their own needs”.
It is noticeable how in just a few years, the approach has evolved from teaching children information about the environment and sustainability issues to educating children to act for change. Acting for change is the basis for all the discussions, decisions, and outcomes of the 1992 United Nations Summit on Environment and Development in Rio and all the documents that followed [4]. To promote education for sustainable development (ESD) in all areas of teaching and learning, in 2005, UNESCO launched the programme “Educating for a sustainable future” [5]. The project focused on environmental justice, which refers to the distribution of environmental benefits and burdens among human beings. A Decade of Education for Sustainable Development was declared between 2005 and 2014. The decade is now over, and there is a general lack of research and evaluations of the effectiveness of sustainability education programmes in the sustainability curricula of all schools worldwide [6]. A new action plan for people, planet, and prosperity was defined in the 2030 Agenda for Sustainable Development [7]. This plan sets out 17 sustainable development goals, including quality education, to ensure that all learners acquire the knowledge and skills needed to promote sustainability by 2030.
Several authors describe a set of competences needed to enable active, reflective, and cooperative participation towards sustainable development [8,9]. Schools around the world are also showing great interest in implementing activities aimed at increasing these competences. Several attempts have been made to move in this direction, especially at the engineering-related higher education or university level [10]. Bascopé et al. [11] stated that compared to ESD for secondary and higher education, ESD for children has been less addressed in scientific publications.

2.2. Sustainable Mobility and Infancy

There are many definitions of sustainable mobility and transport [12,13,14,15,16,17,18].
However, Buzási and Csete [19] best defined the concept as follows: From a social point of view, a sustainable transport system should provide basic accessibility to individuals, businesses, and society, as well as connect present and future generations; from an economic point of view, it enhances competitiveness and development through efficient and affordable transport operations; and from an environmental point of view, it promotes the use of renewable resources, limiting emissions and waste in terms of the absorption capacity of the planet, and preventing future negative effects. To understand how to teach sustainable mobility means we must ask why it is such an important subject.
During the United Nations Conference on the Environment and Development [4], children were recognised as an important group for the development of a sustainable environment.
Although research about mobility in general is a very broad subject, there is a notable lack of research that specifically refers to children. The little research there is has mainly concentrated on children’s journeys to school [20,21,22,23,24,25,26].
Children play a very important role in achieving sustainable mobility. Children can be the real “agents of change” [27,28,29,30,31,32]. They have, until now, been passively influenced by their parents, who have transmitted car-dependent lifestyles. However, through education they can become active agents of change by influencing their family members to behave in a different way.
Managing to change personal mobility behaviour to combat climate change is a momentous challenge for social scientists and professionals given the integrated nature of mobility in everyday life [33]. The attempts at understanding, managing, and promoting more sustainable mobility have mainly concentrated on individual decision-making and changing peoples’ behaviour, examples being a reduction in car use offset by a greater use of walking, cycling, and public transport. Individual behaviour plays an important role in sustainable transport, and fixed daily mobility habits are hard to change.
Over the years there has been an increased interest in the relationship between sustainable mobility and children. For example, key texts like “The child in the city” by [34] began to ask about how children move around in public spaces. Similarly, the classic series of empirical studies by Hillman et al. [35] attracted attention because the children promised to commit to more sustainable behaviour in their journeys. The lives of many children in developed countries cover quite a large area of urban space as they travel to different parts of the city to take part in school, sports, and educational and cultural activities [36]. This research opened the way for a number of wider empirical studies of the trip patterns of children and young adults throughout western industrialised countries, replicating the research of Hillman and finding similar changing patterns in children’s mobility, including countries like Denmark [37], Italy [38], Sweden [39], and New Zealand [40].
Many grassroots initiatives are being started that boast solutions supporting children’s freedom of movement (for example, walking buses, bicycle trains, volunteers at pedestrian crossings, and car sharing between parents, among others). However, any costly and innovative grassroots programme that is introduced by local councils to increase road safety and the mobility independence of children has more chance of succeeding if it is combined with initiatives aimed at changing the attitudes of both the parents and the children, along with increasing the awareness of all citizens about the subject. In this sense, ref. [41] showed that there is no a better place or time than the daily lives of school-aged children to start a change in attitude towards more sustainable mobility.
In Europe and North America, children’s mobility has received the greatest public and academic attention [42]. There are several examples in Spain of good educational practice in terms of sustainable mobility. Highlights are the initiatives of “Camino escolar seguro (Safe Journey to School)” in Barcelona, Granollers, Madrid, San Sebastián, Segovia, Viladecans, and Zaragoza. “Con Bici al Cole (To School by Bike)” or the environmental education programme in Segovia, “Pies para qué os quiero: movilidad y camino escolar (What are my Feet For: Mobility and Travelling to School).” These programmes tried to introduce and promote habits about caring for the environment in primary school children and the wider community. They also attempted to promote healthier lifestyles through the incorporation of concepts and behaviour related to sustainable mobility by converting the street into a space where people were able to be together [43]. In order for any educational activity about sustainable mobility to result in real behavioural change in daily lifestyles, these programmes need to be accompanied by other strategies.

2.3. Gamification and Sustainable Mobility
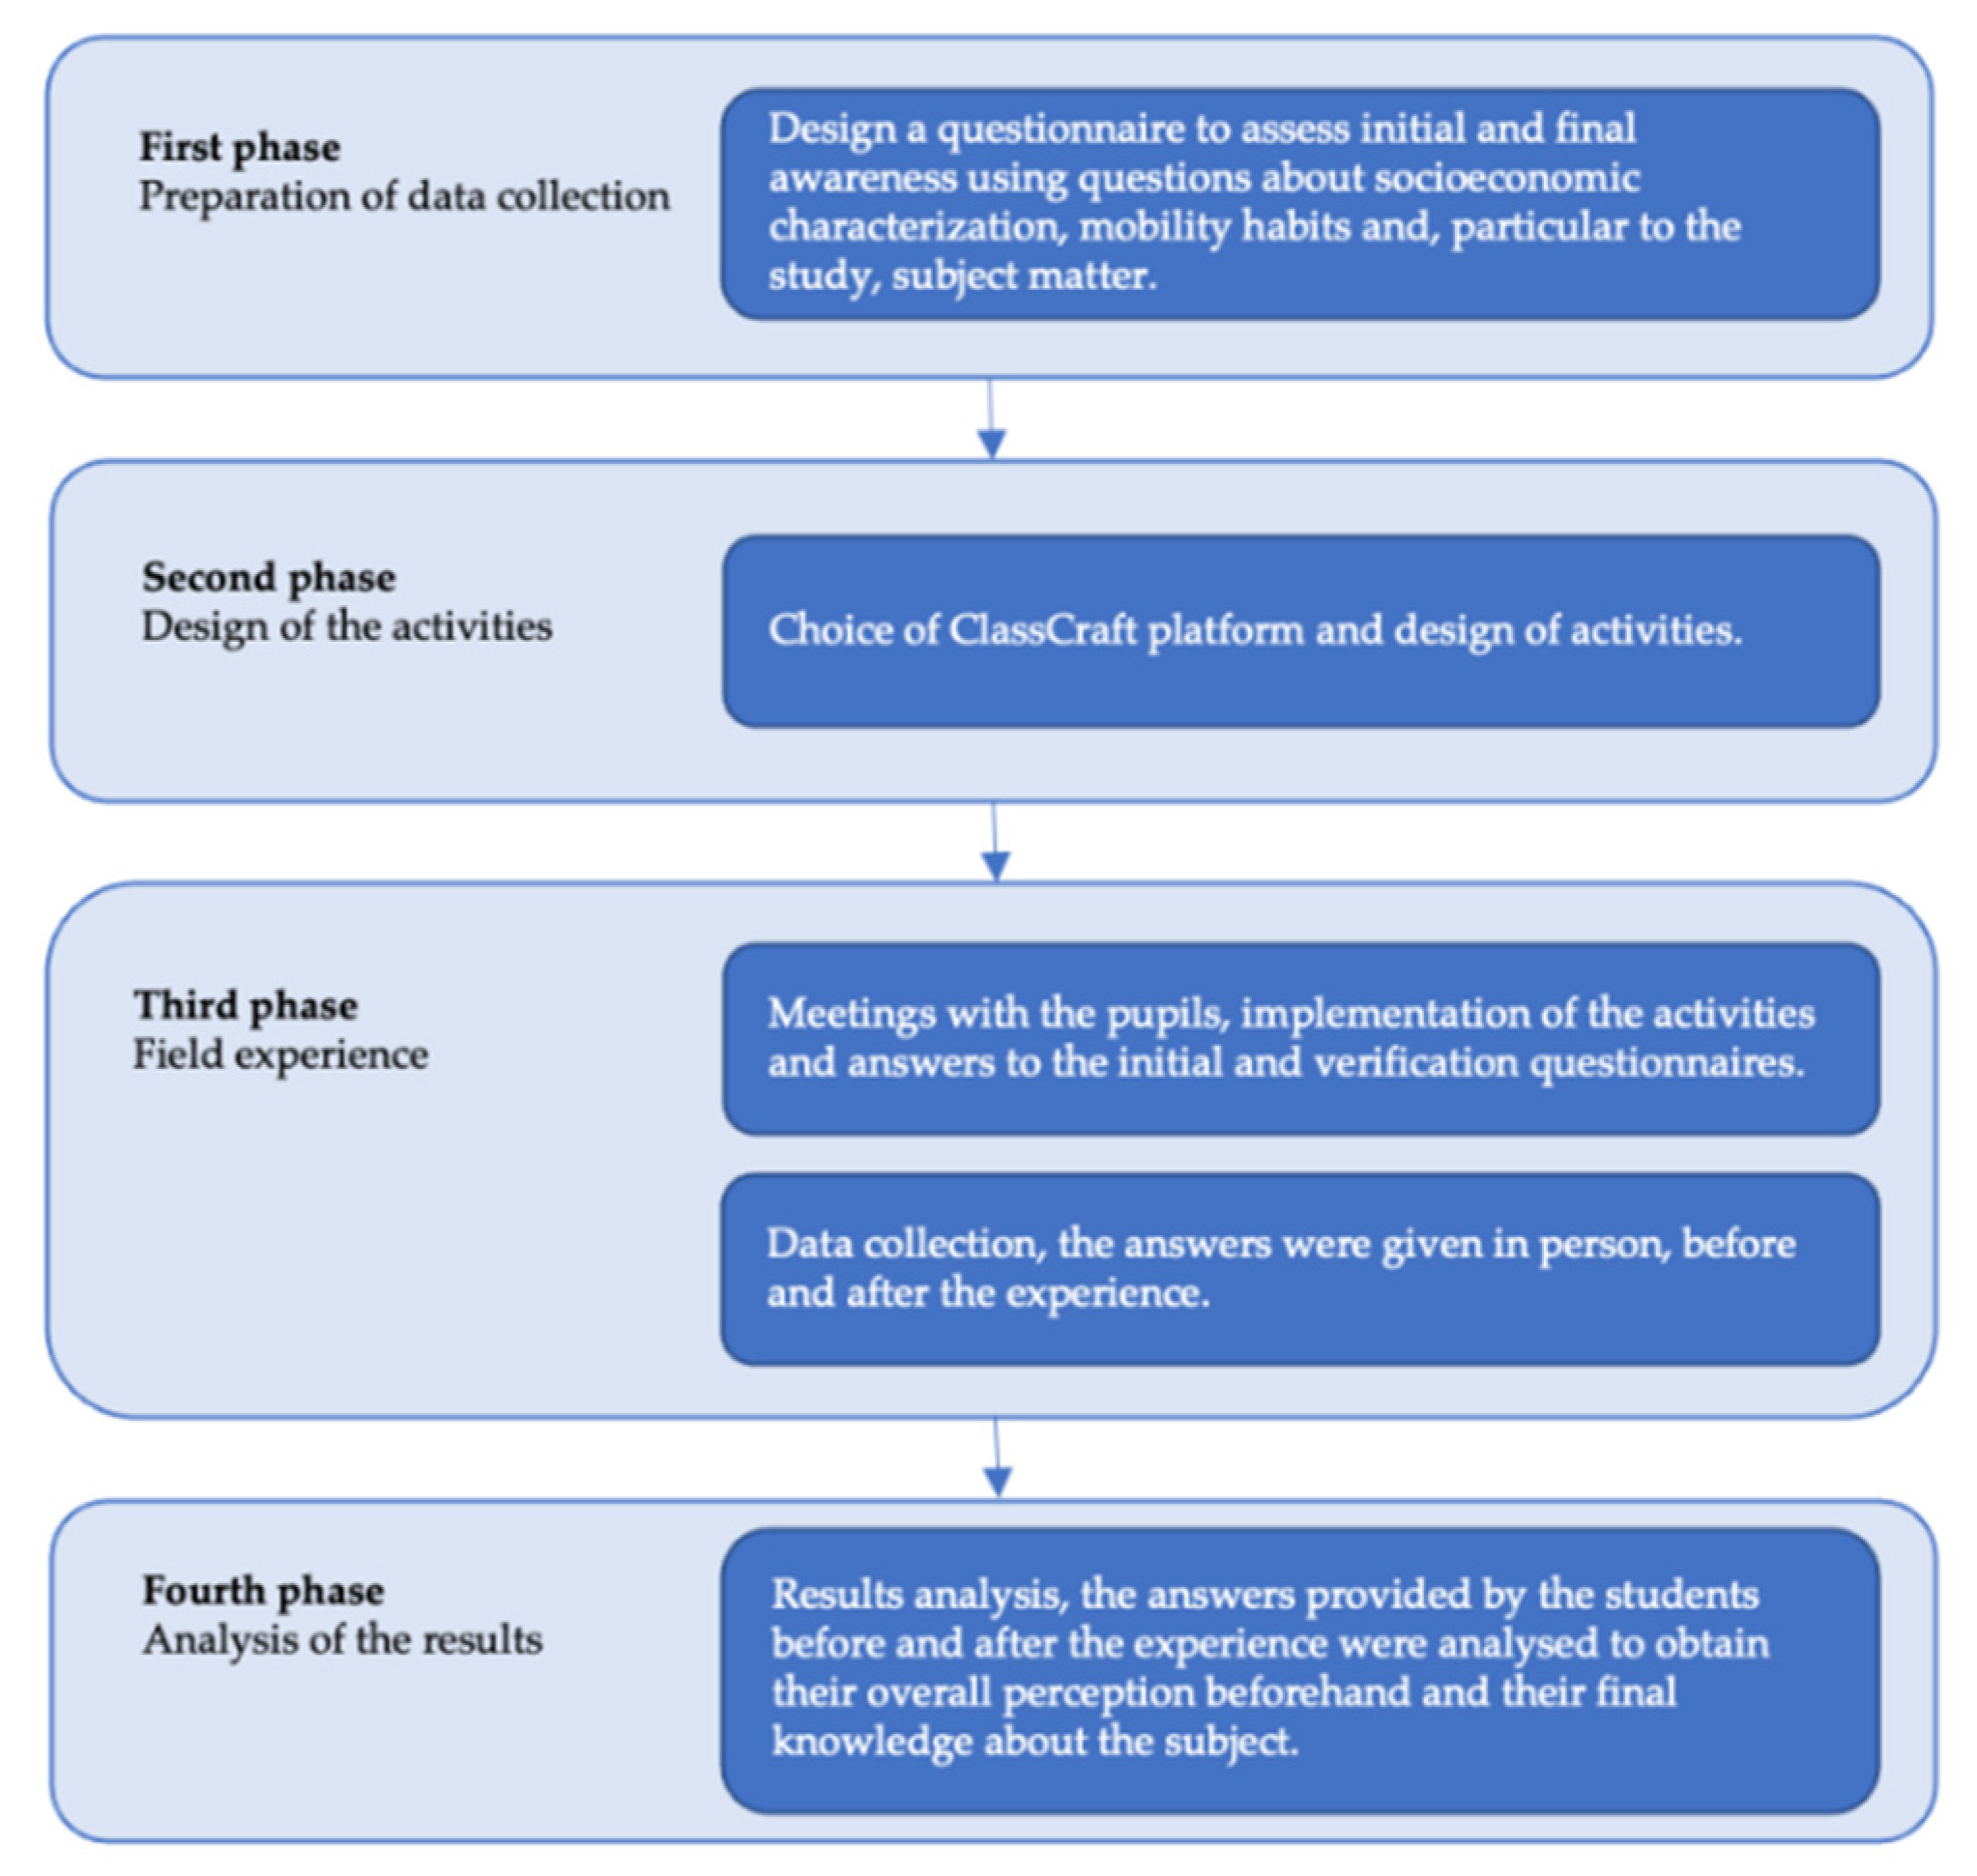
Serious games and persuasive games, along with their interactions, have shown potential to be strategic socio-technical elements to increase participation and commitment as well as promote more sustainable behaviour in terms of ethical, social, environmental, and health habits [44].
The key idea is to increase peoples’ motivation to make a certain decision or carry out certain tasks that are instrumental in achieving valuable goals, while making them enjoyable and rewarding experiences. Environmental sustainability is an area of application where gamification has been widely applied, from energy saving [45,46] and sustainable mobility [47,48,49,50] to other environmental questions like community environmental missions [51], the participatory governance of urban neighbourhoods [52], or the discovery of the educational city [53].
The use of gamification techniques to incentivise voluntary changes in behaviour towards more sustainable mobility has become widespread over recent years, coinciding with the spread of the smart city in Europe [49,54].
A smart city is an efficient and advanced city where new technology is applied to connect people, information, and urban structure, thereby creating a more sustainable, ecological, competitive, and innovative urban environment that provides its citizens with a better quality of life [55]. Most research and the resulting applications are aimed at adults. Merugu et al. [56] described an application to reduce traffic congestion. Hoh et al. [57] proposed game-theoretical design and crowdsourcing to motivate people to share information about parking spaces in the city. Gabrielli et al. [58] described a design methodology using gamification applied to case studies performed in four European cities. Buningh et al. [59] implemented a gamified system to encourage company employees to use sustainable transport modes for travelling to work. Wells et al. [60] proposed a gamification model that motivates users to adopt sustainable mobility by tracking people’s mobility behaviour and proposing modulated challenges based on their actual progress. Similarly, the Tripzoom platform [61] was used in three European cities [62] to identify the behaviour patterns of citizens’ mobility, later proposing and compensating with personalised gamified mobility solutions that improve CO2 emissions, the health of the players, and travel time. Tripzoom is a mobile app that encourages users to improve their mobility behaviour. To achieve this goal, the app uses the sensing capabilities of modern mobile devices (e.g., GPS and an accelerometer) to detect, measure, and track the movements of its users. The data obtained can guide user travel behaviour and give recommendations on how to improve it. On the other hand, the application allows interaction with other users through different interfaces. Finally, the application can be connected to the city authorities that monitor and manage the incentive and reward system.
In autumn 2014, an experiment was performed as part of the STREETLIFE EU project to assess the impact of sustainable mobility recommendations and gamification incentives on the mobility behaviour of people who needed to routinely travel to the city centre by car [49]. Mechanisms were provided to integrate and implement policies on a city-wide scale from a group of intelligent mobility services such as trip-planning services and route recommendations that citizens habitually used. Furthermore, mechanisms were provided to encourage citizens to make decisions in accordance with these mobility policies by using gamification. This study allowed a gamification designer to create games that increase the knowledge of the citizens about the current and new sustainable mobility policies and services in the city and motivate them to adopt the corresponding TIC solution to gain status and repute in the game and win prizes (virtual or material).
Therefore, gamification can play a key and triple role in this context: Supporting the sustainability of the long-term environmental education initiatives promotes the commitment of the community at large and encourages creativity and active participation. Some successful examples have used gamification to promote sustainable lifestyles in children and parents [63,64,65].
Beat the Street [66] and Kids-Go-Green [67] are similar applications in terms of their objectives. The “Beat the Street” initiative is an active travel plan proposed in the United Kingdom that converts the entire city into a game. In fact, it involves a local community in a competition that encourages them to walk or ride a bicycle around their neighbourhood. The system employs tracking technology and a reward scheme. This game has also been applied in schools to encourage active and sustainable mobility in children; however, preliminary studies show that the induced change was very limited [68]. This result could be because Beat the Street was not specifically designed with children in mind, nor for being used in a school environment and teaching syllabus. The mechanics of the game, the rewards, and the experiences of the Beat the Street user are designed to involve a population of generic players.
On the other hand, Kids-Go-Green [67] is specifically designed to be significant and attractive to smaller children within an education environment such as a school. Its aim is to increase awareness and change the behaviour of the children and their families about active and sustainable mobility. The method also aims to achieve a short-term commitment towards different mobility habits, especially in terms of the journey from home to school, which eventually leads to a long-term change in attitude by using the potential of gamified educational initiatives. Kids-Go-Green has been developed as a web application accessible using any navigator and can be used in school through large screens, interactive blackboards, tablets, and computers.

3. Methodology

In order to diagnose the awareness and knowledge of pupils about sustainable mobility before and after the learning experience using the ClassCraft platform, the research was subdivided into four large phases, which are summarised in the following Figure 1.
The following sections explain the different phases in detail.

3.1. Questionnaire Design

The questionnaires focused on knowledge and awareness about aspects of sustainable mobility by using 38 questions of diverse typologies: Some had multiple choice answers, others had open answers, some asked for preferences, and others were placed in a ranking. As a reference for structuring this type of questionnaire, the team applied a previous survey methodology used to study user perceptions about public transport service quality [69,70].
The 38 questions covered a variety of themes:
  • Socioeconomic: how many members were in the family unit, the type of employment the parents or guardians had, where they lived, whether they made use of a car and bicycles.
  • Analysis of mobility habits: how they travelled to school, whether they used a bicycle, the reasons for travelling, and the different transport modes present in the city.
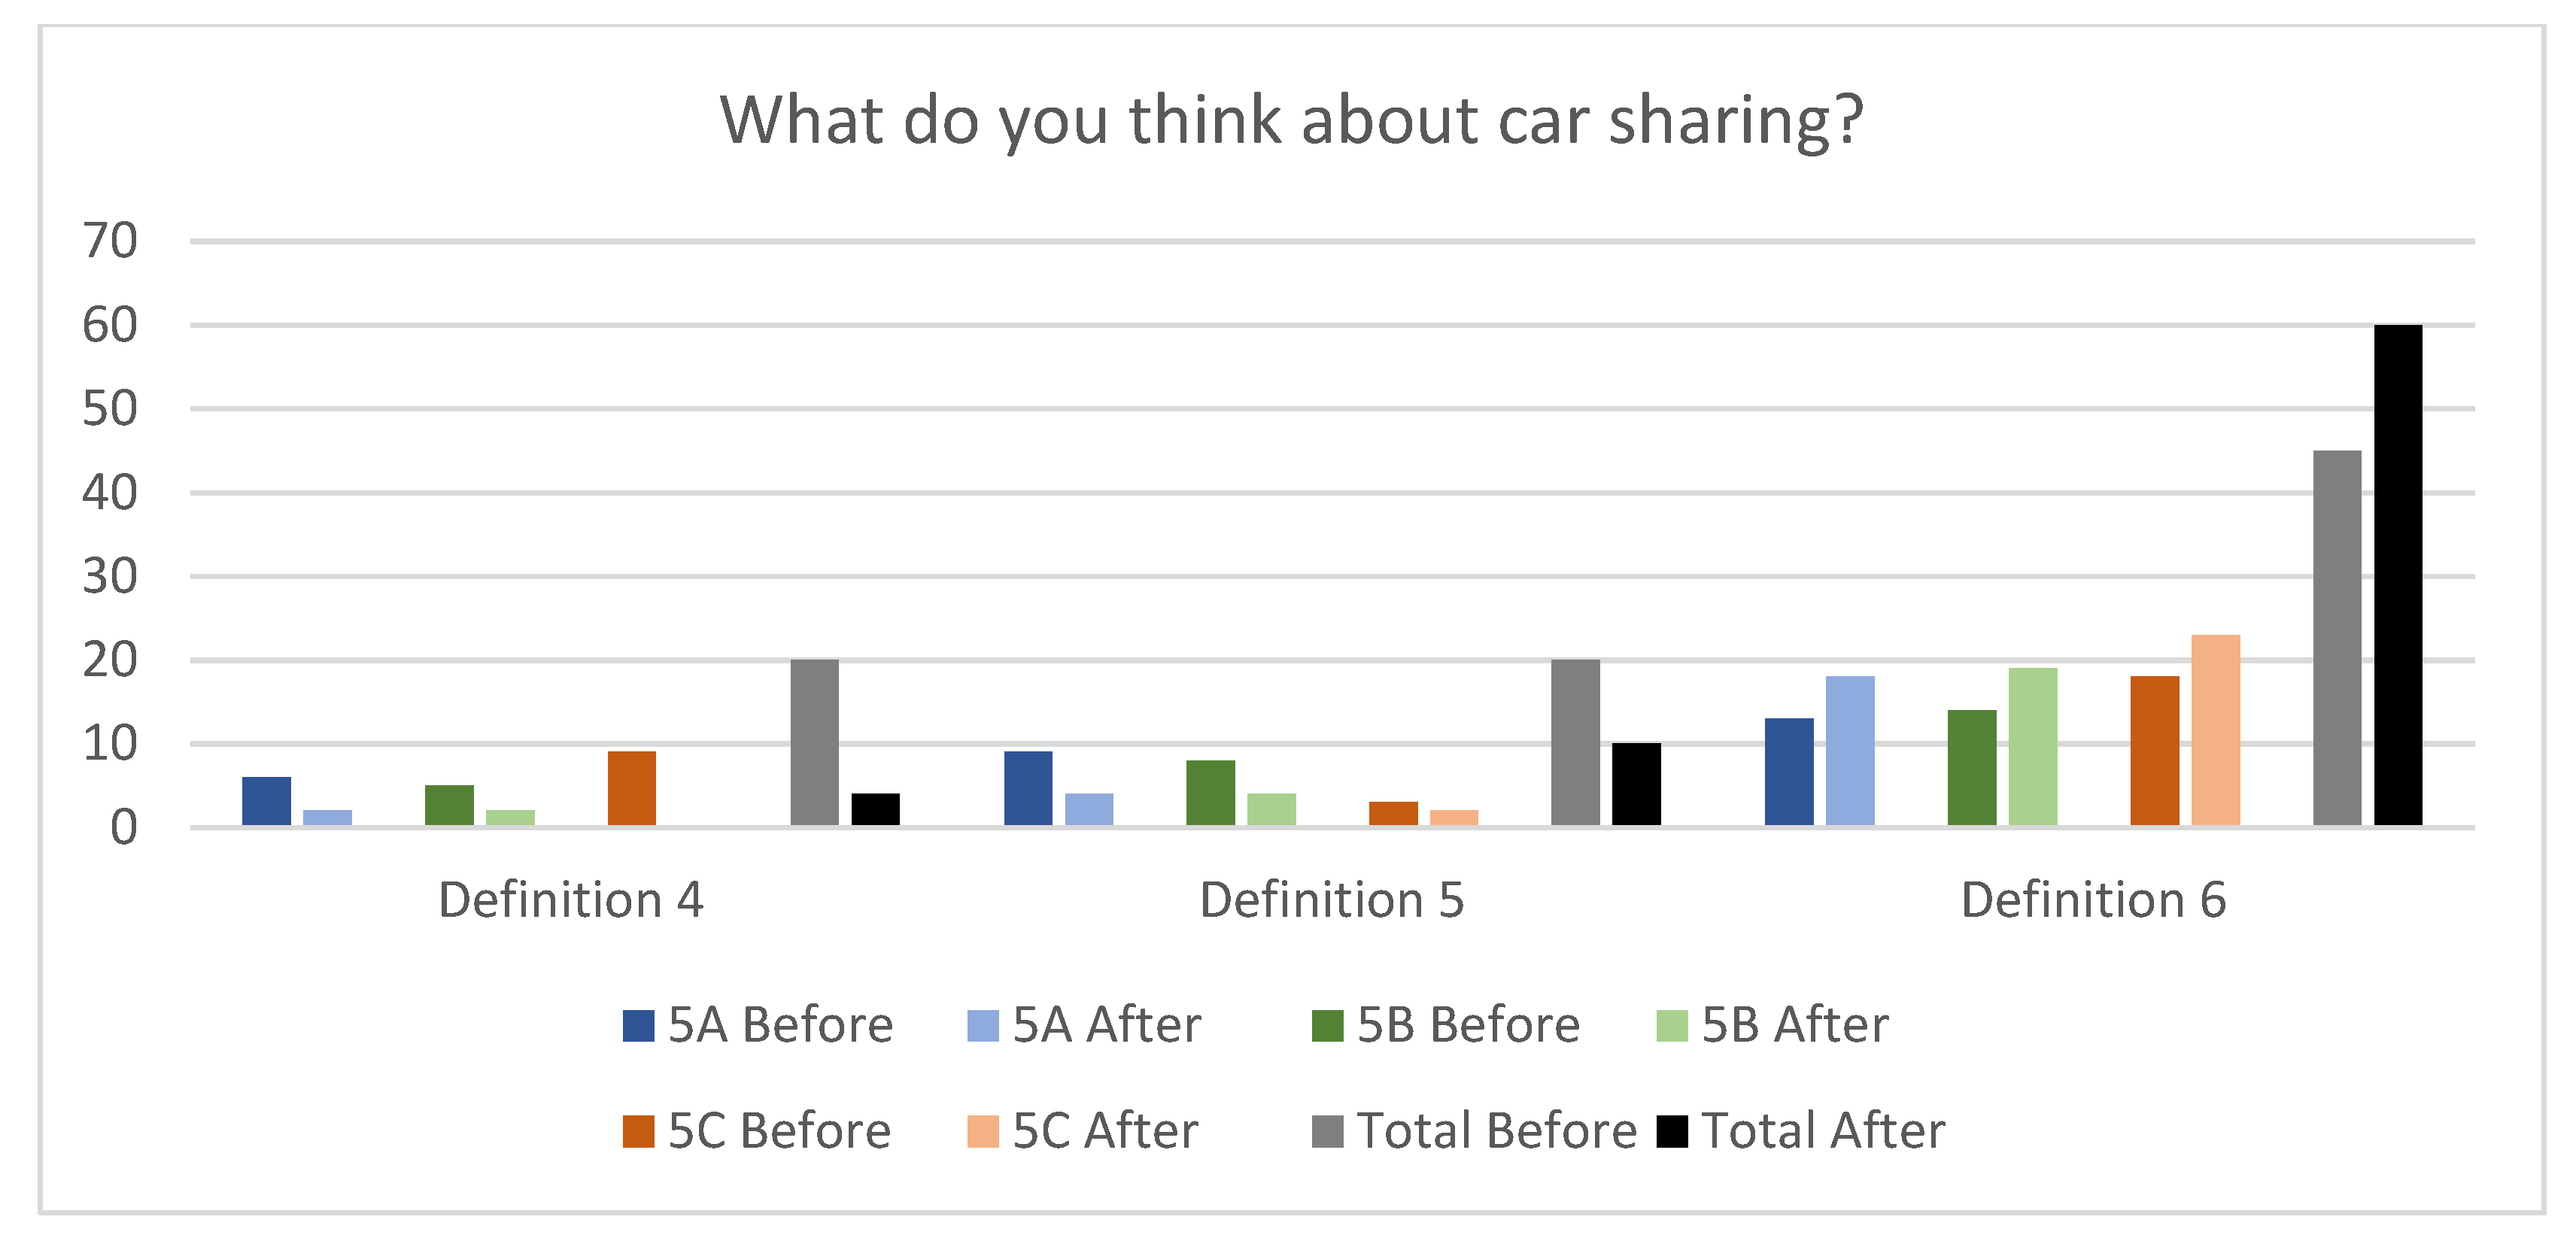
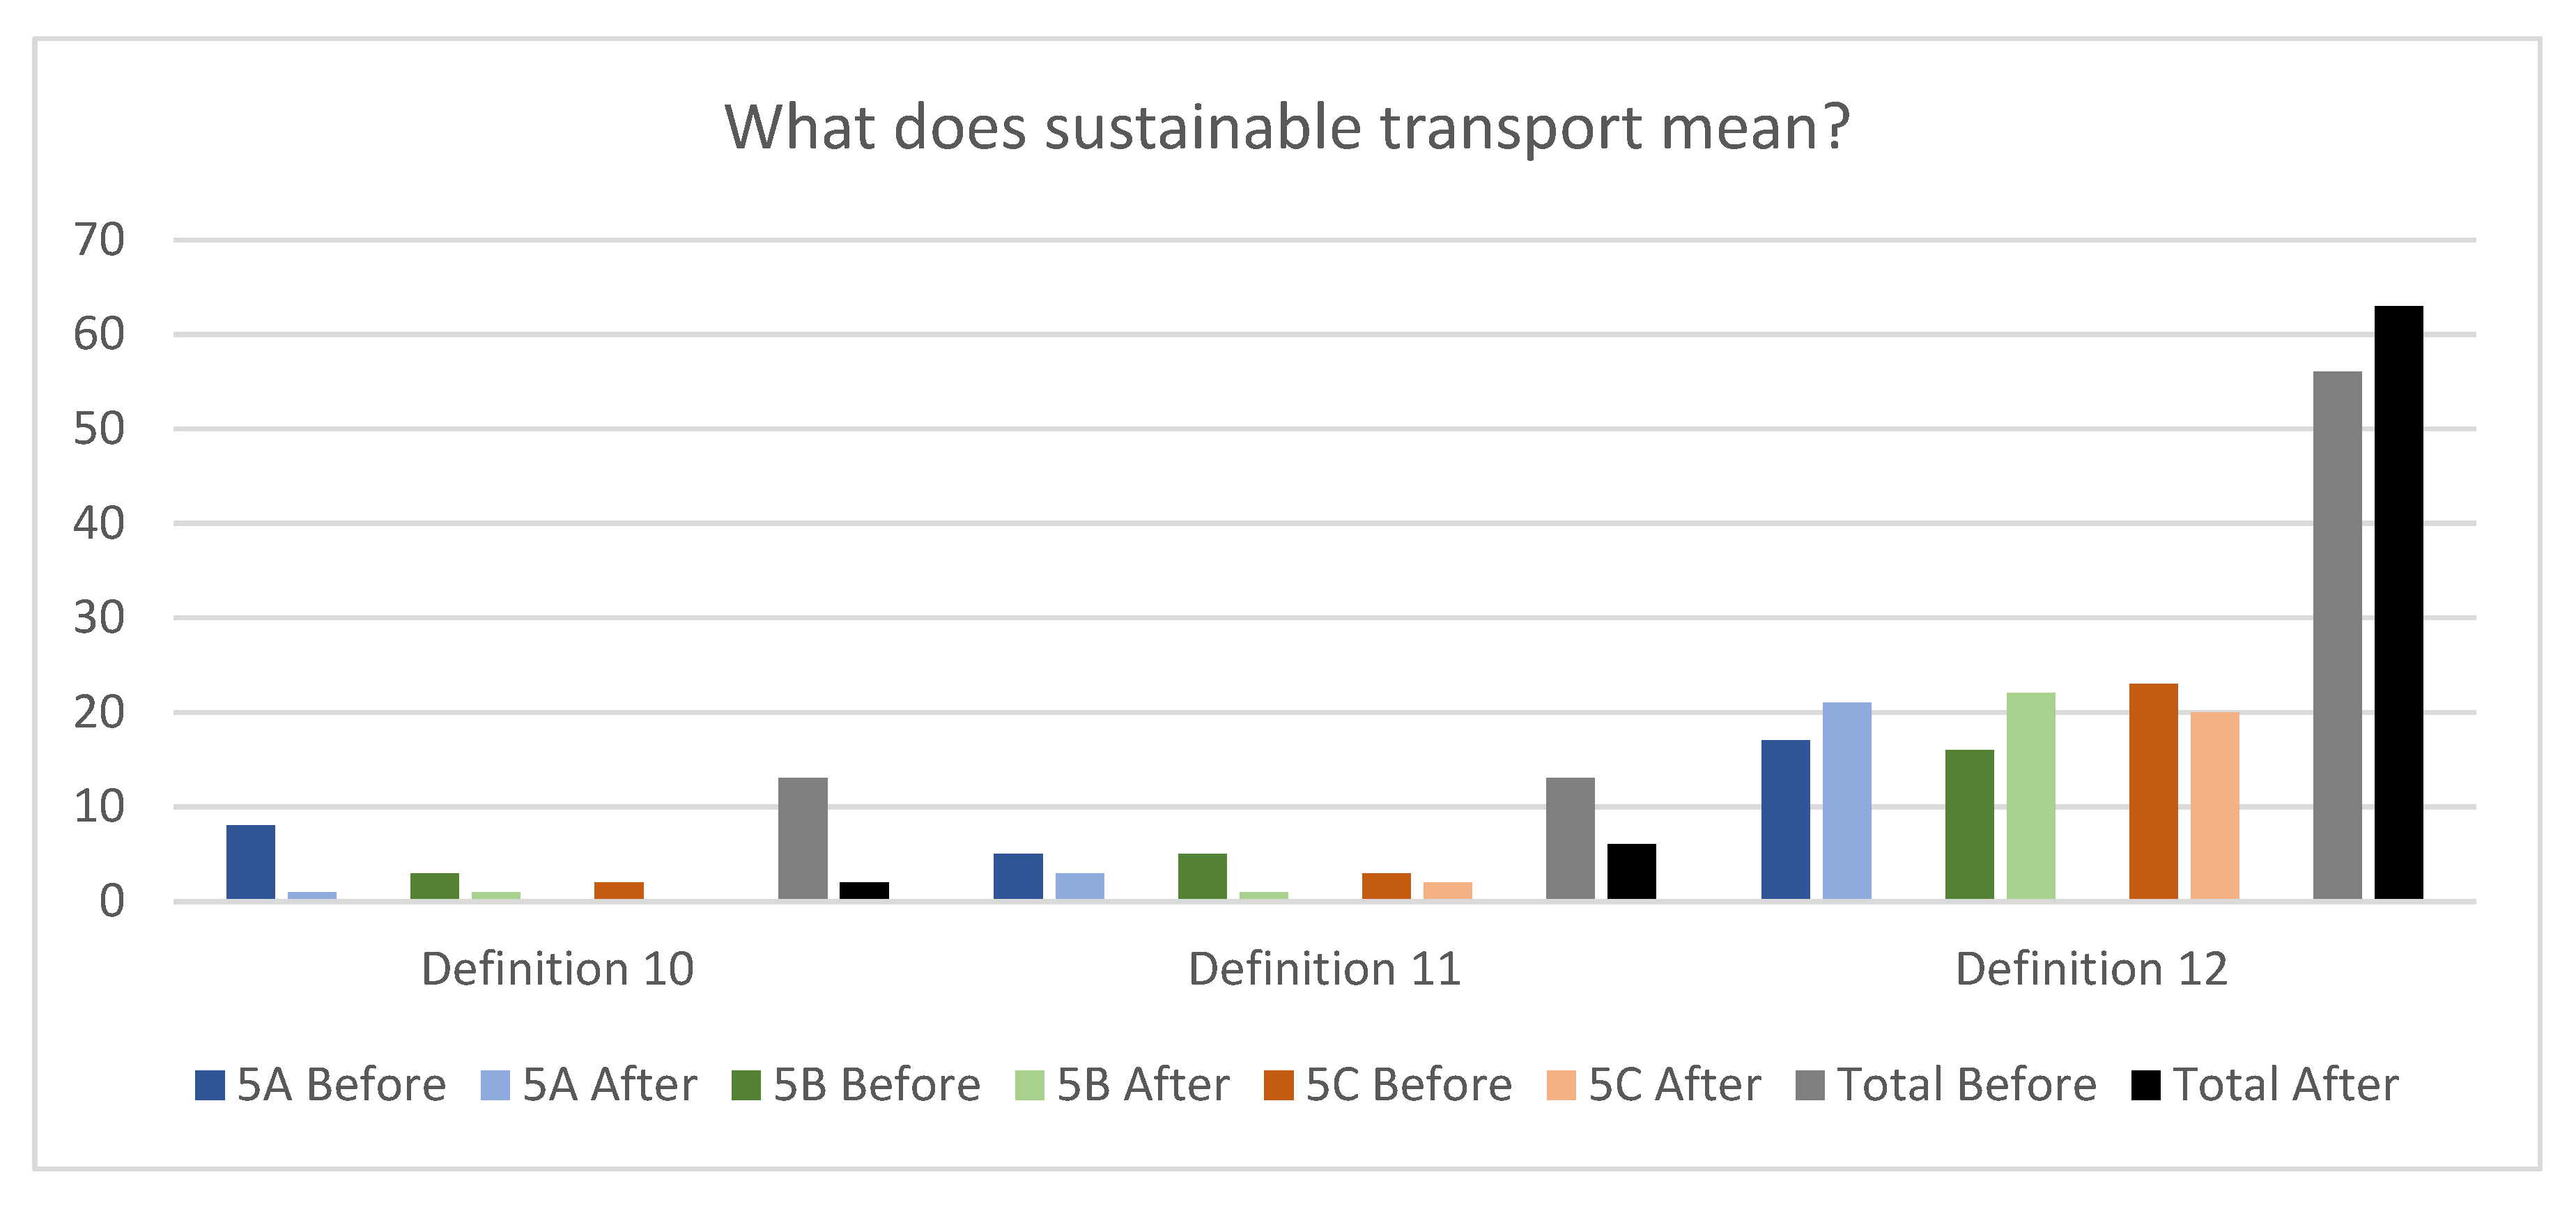
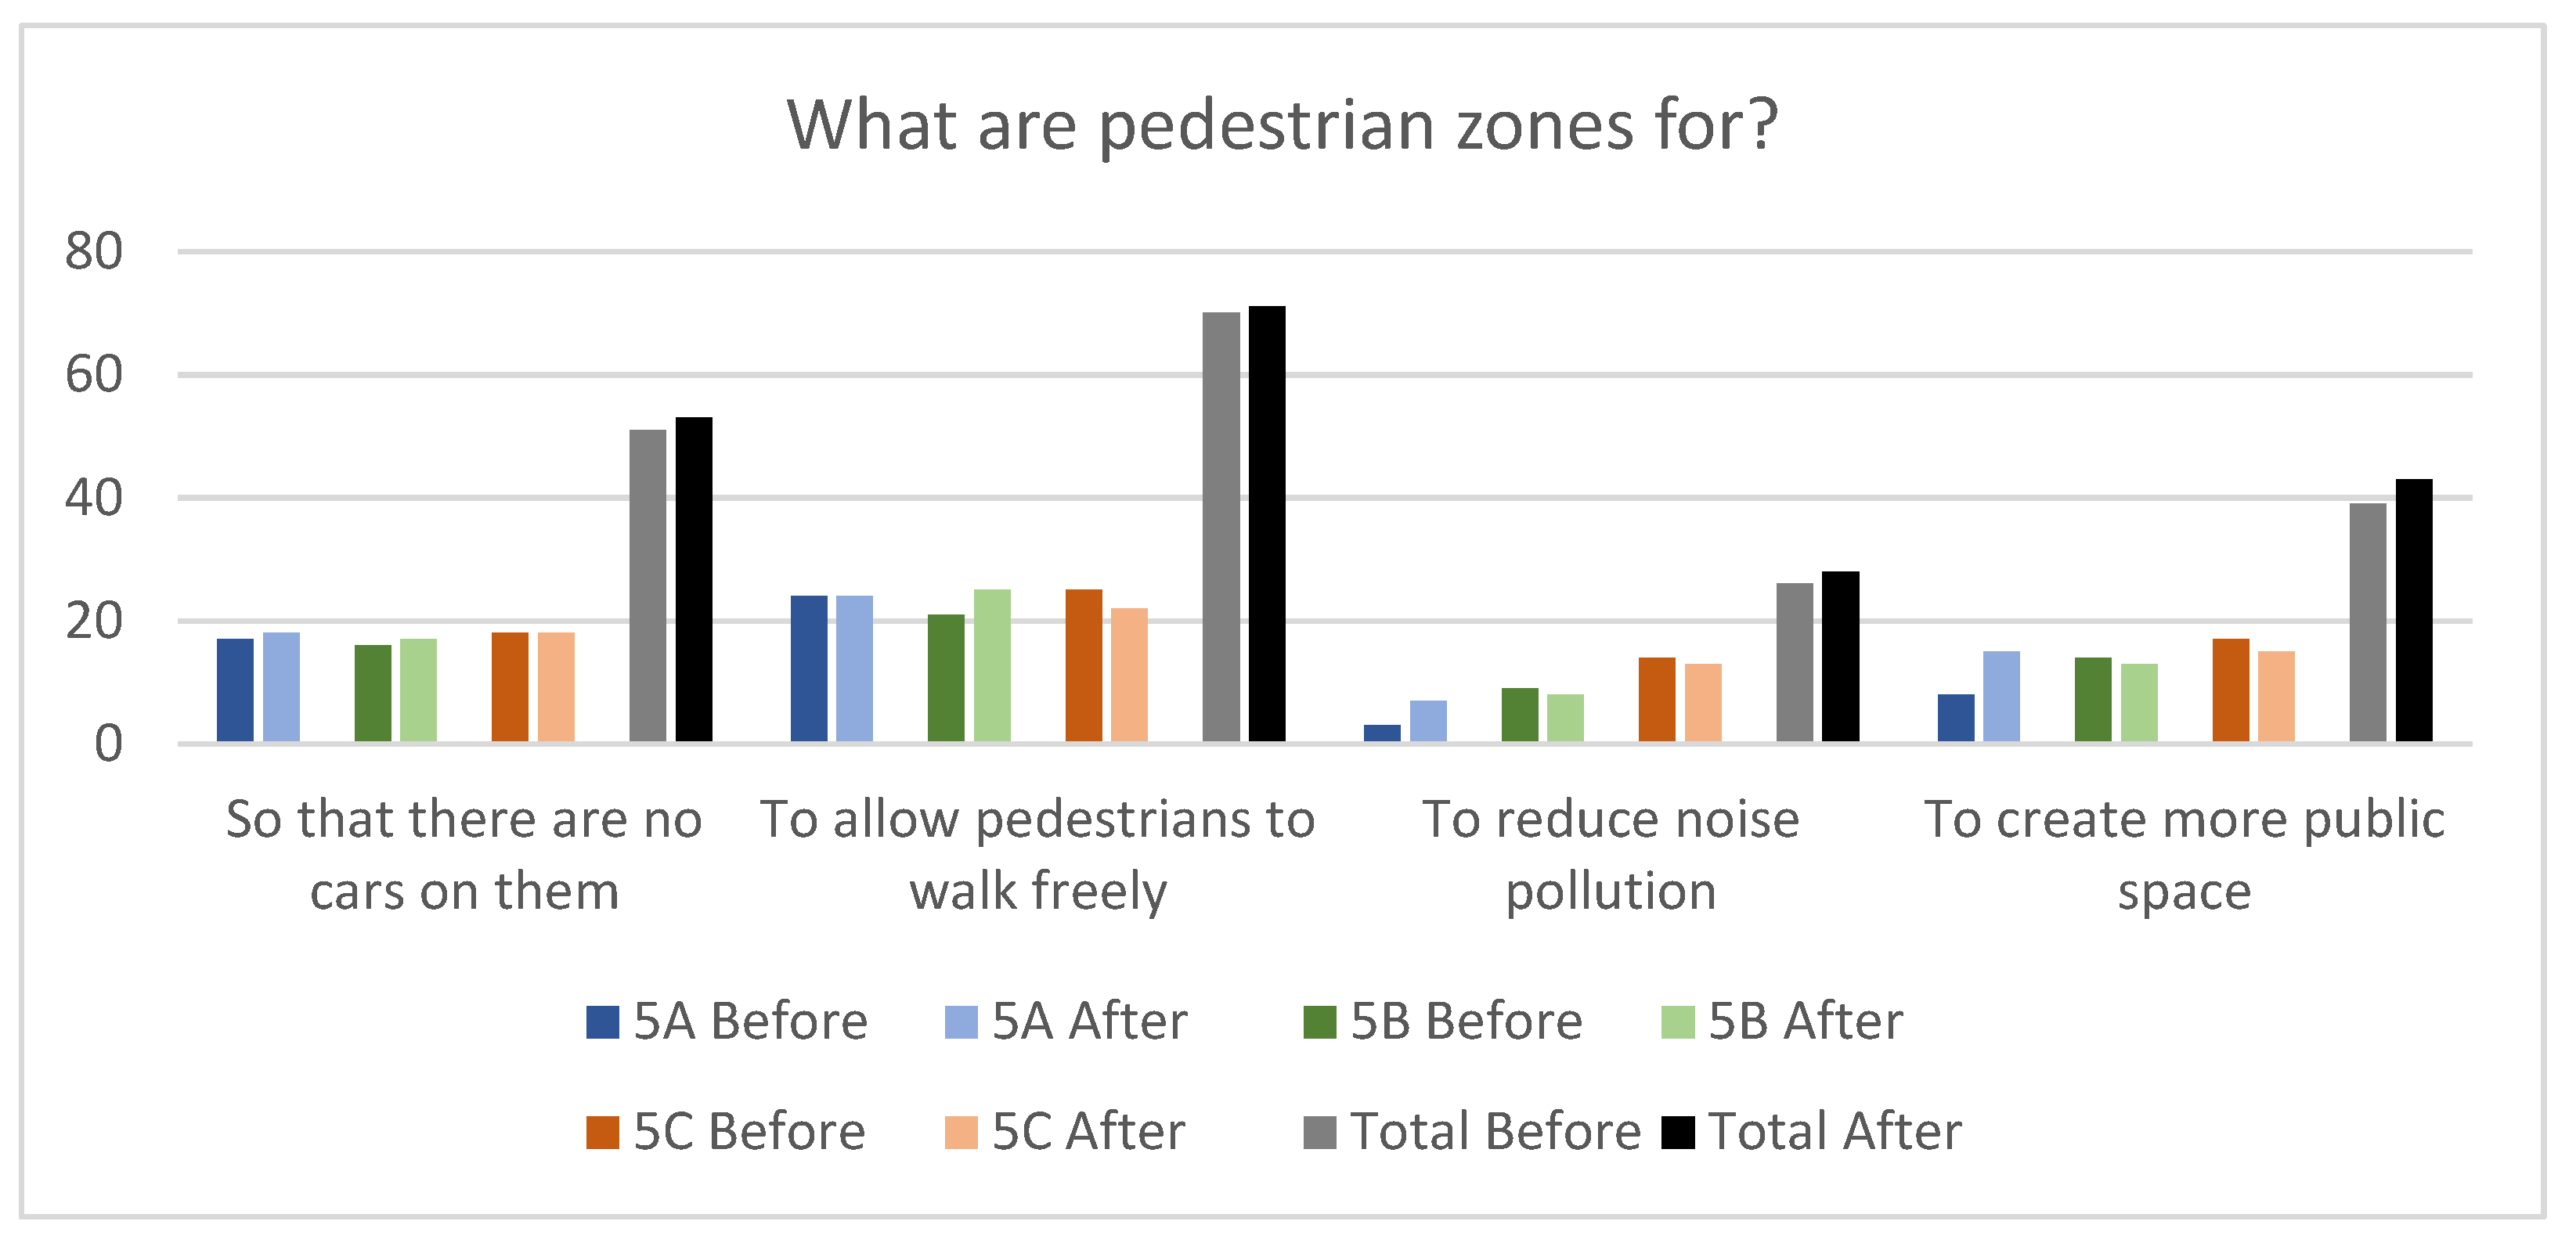
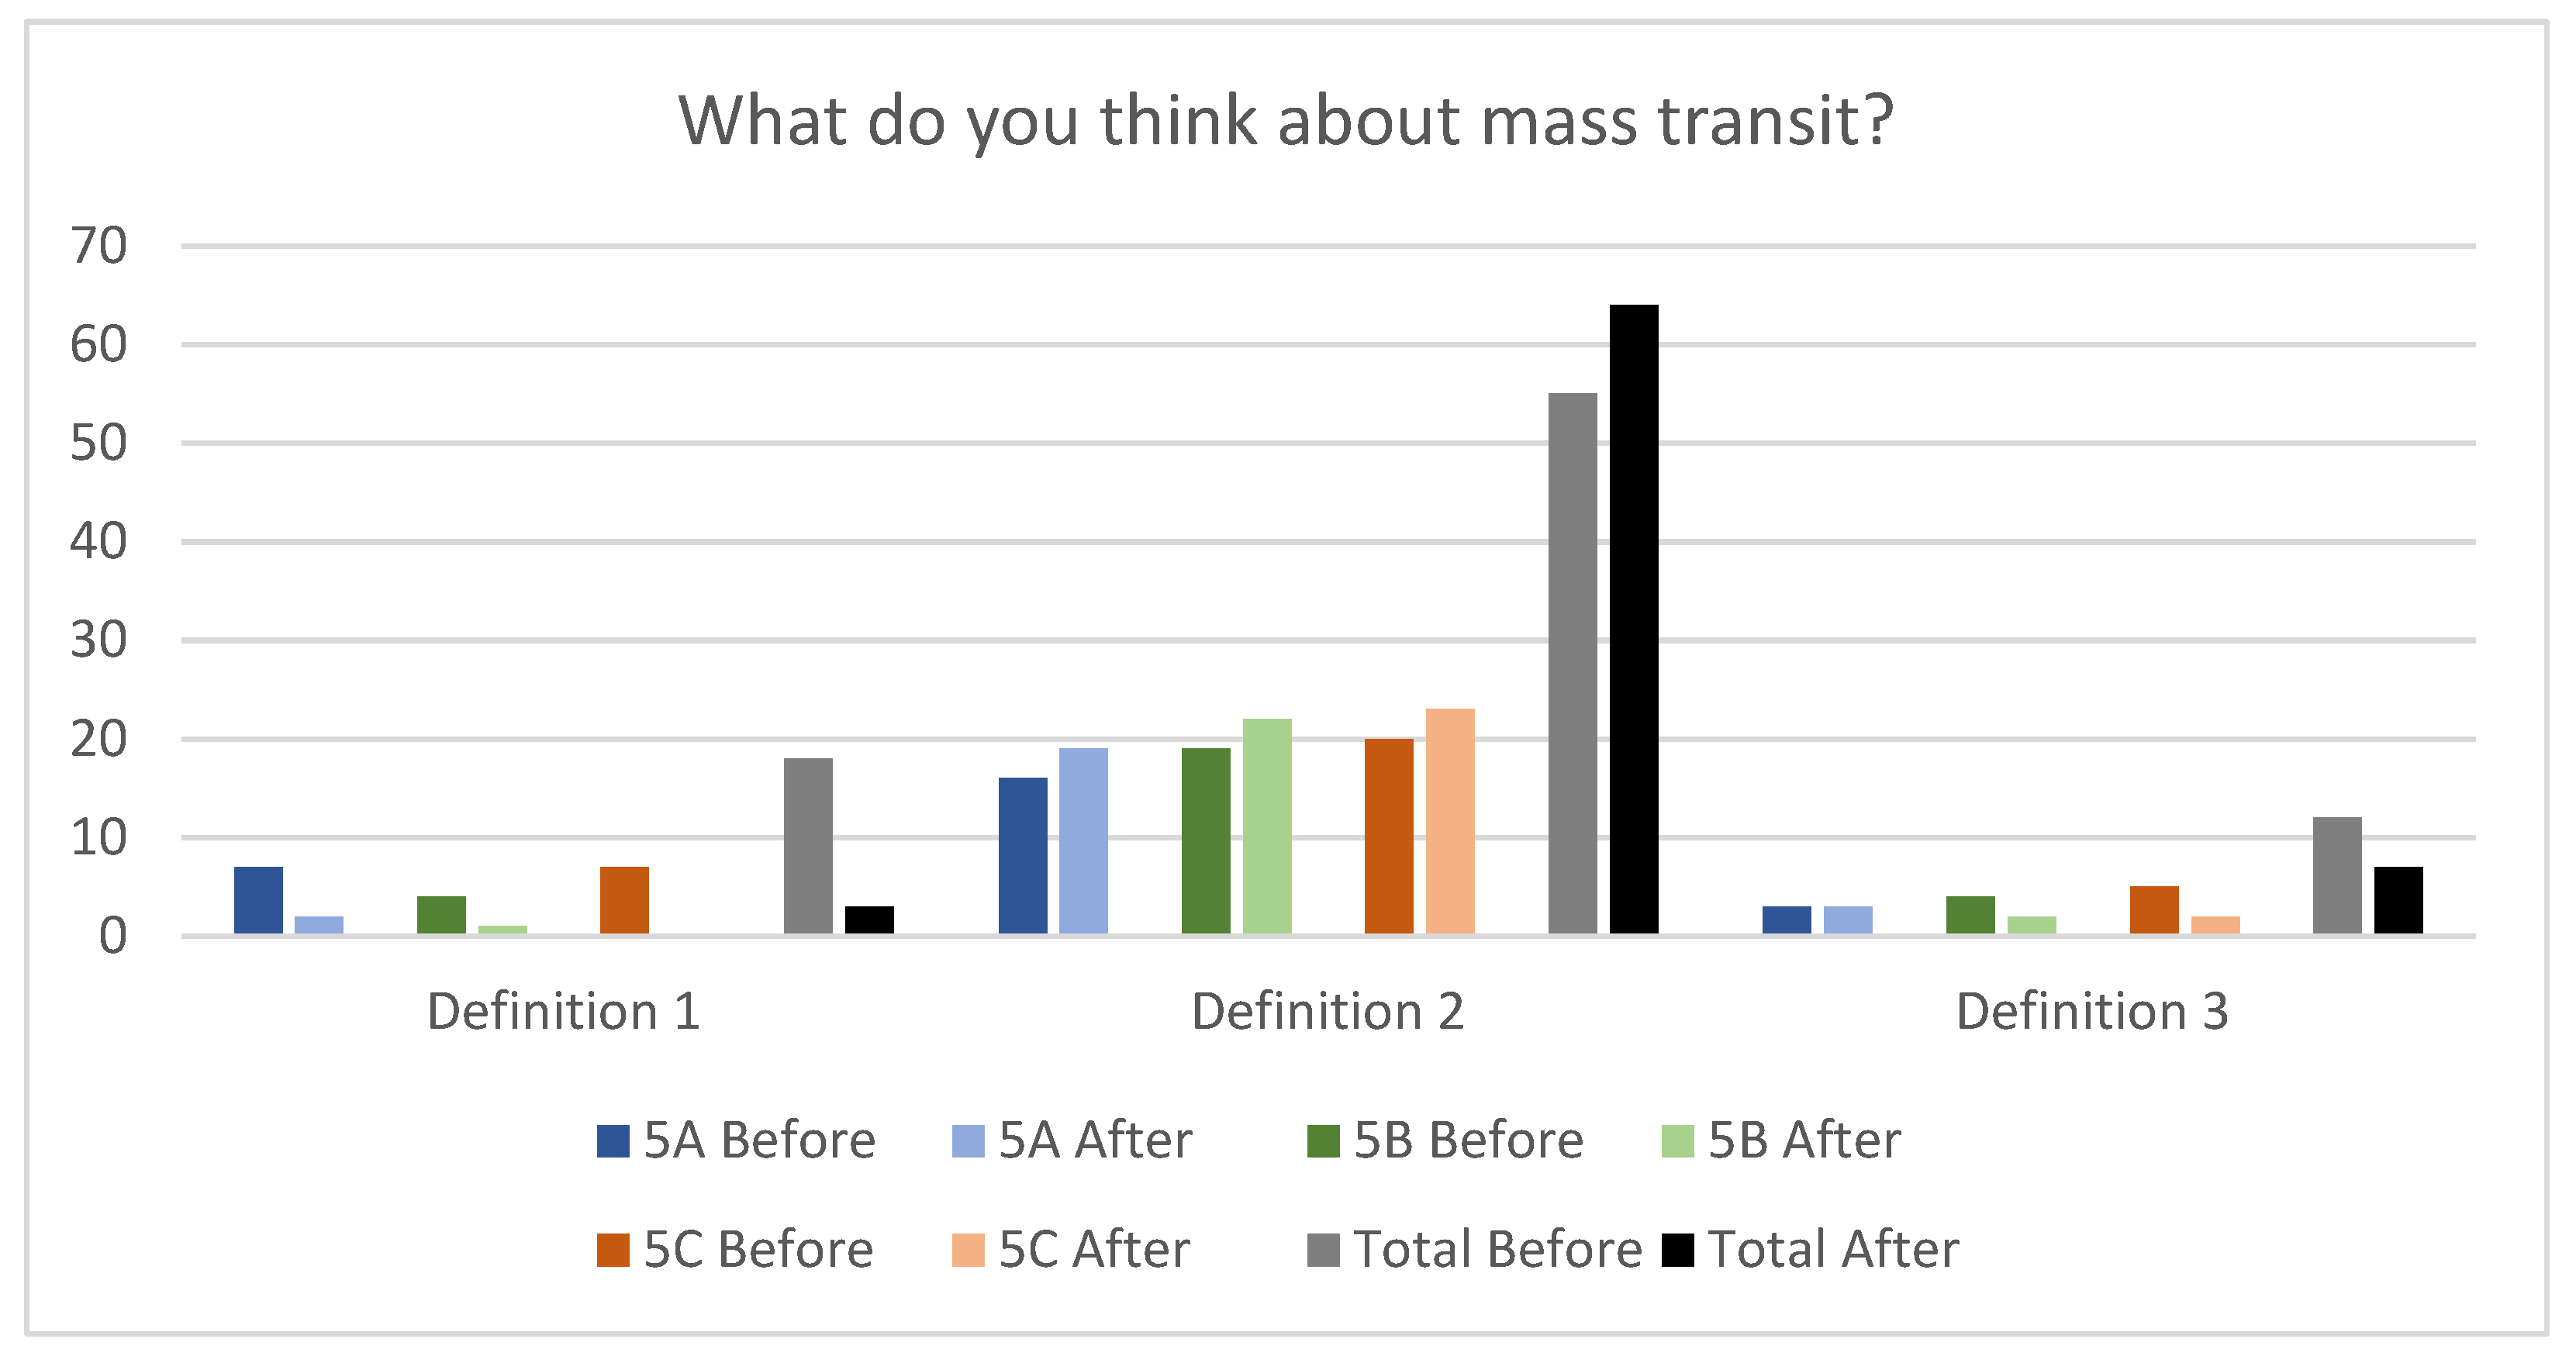
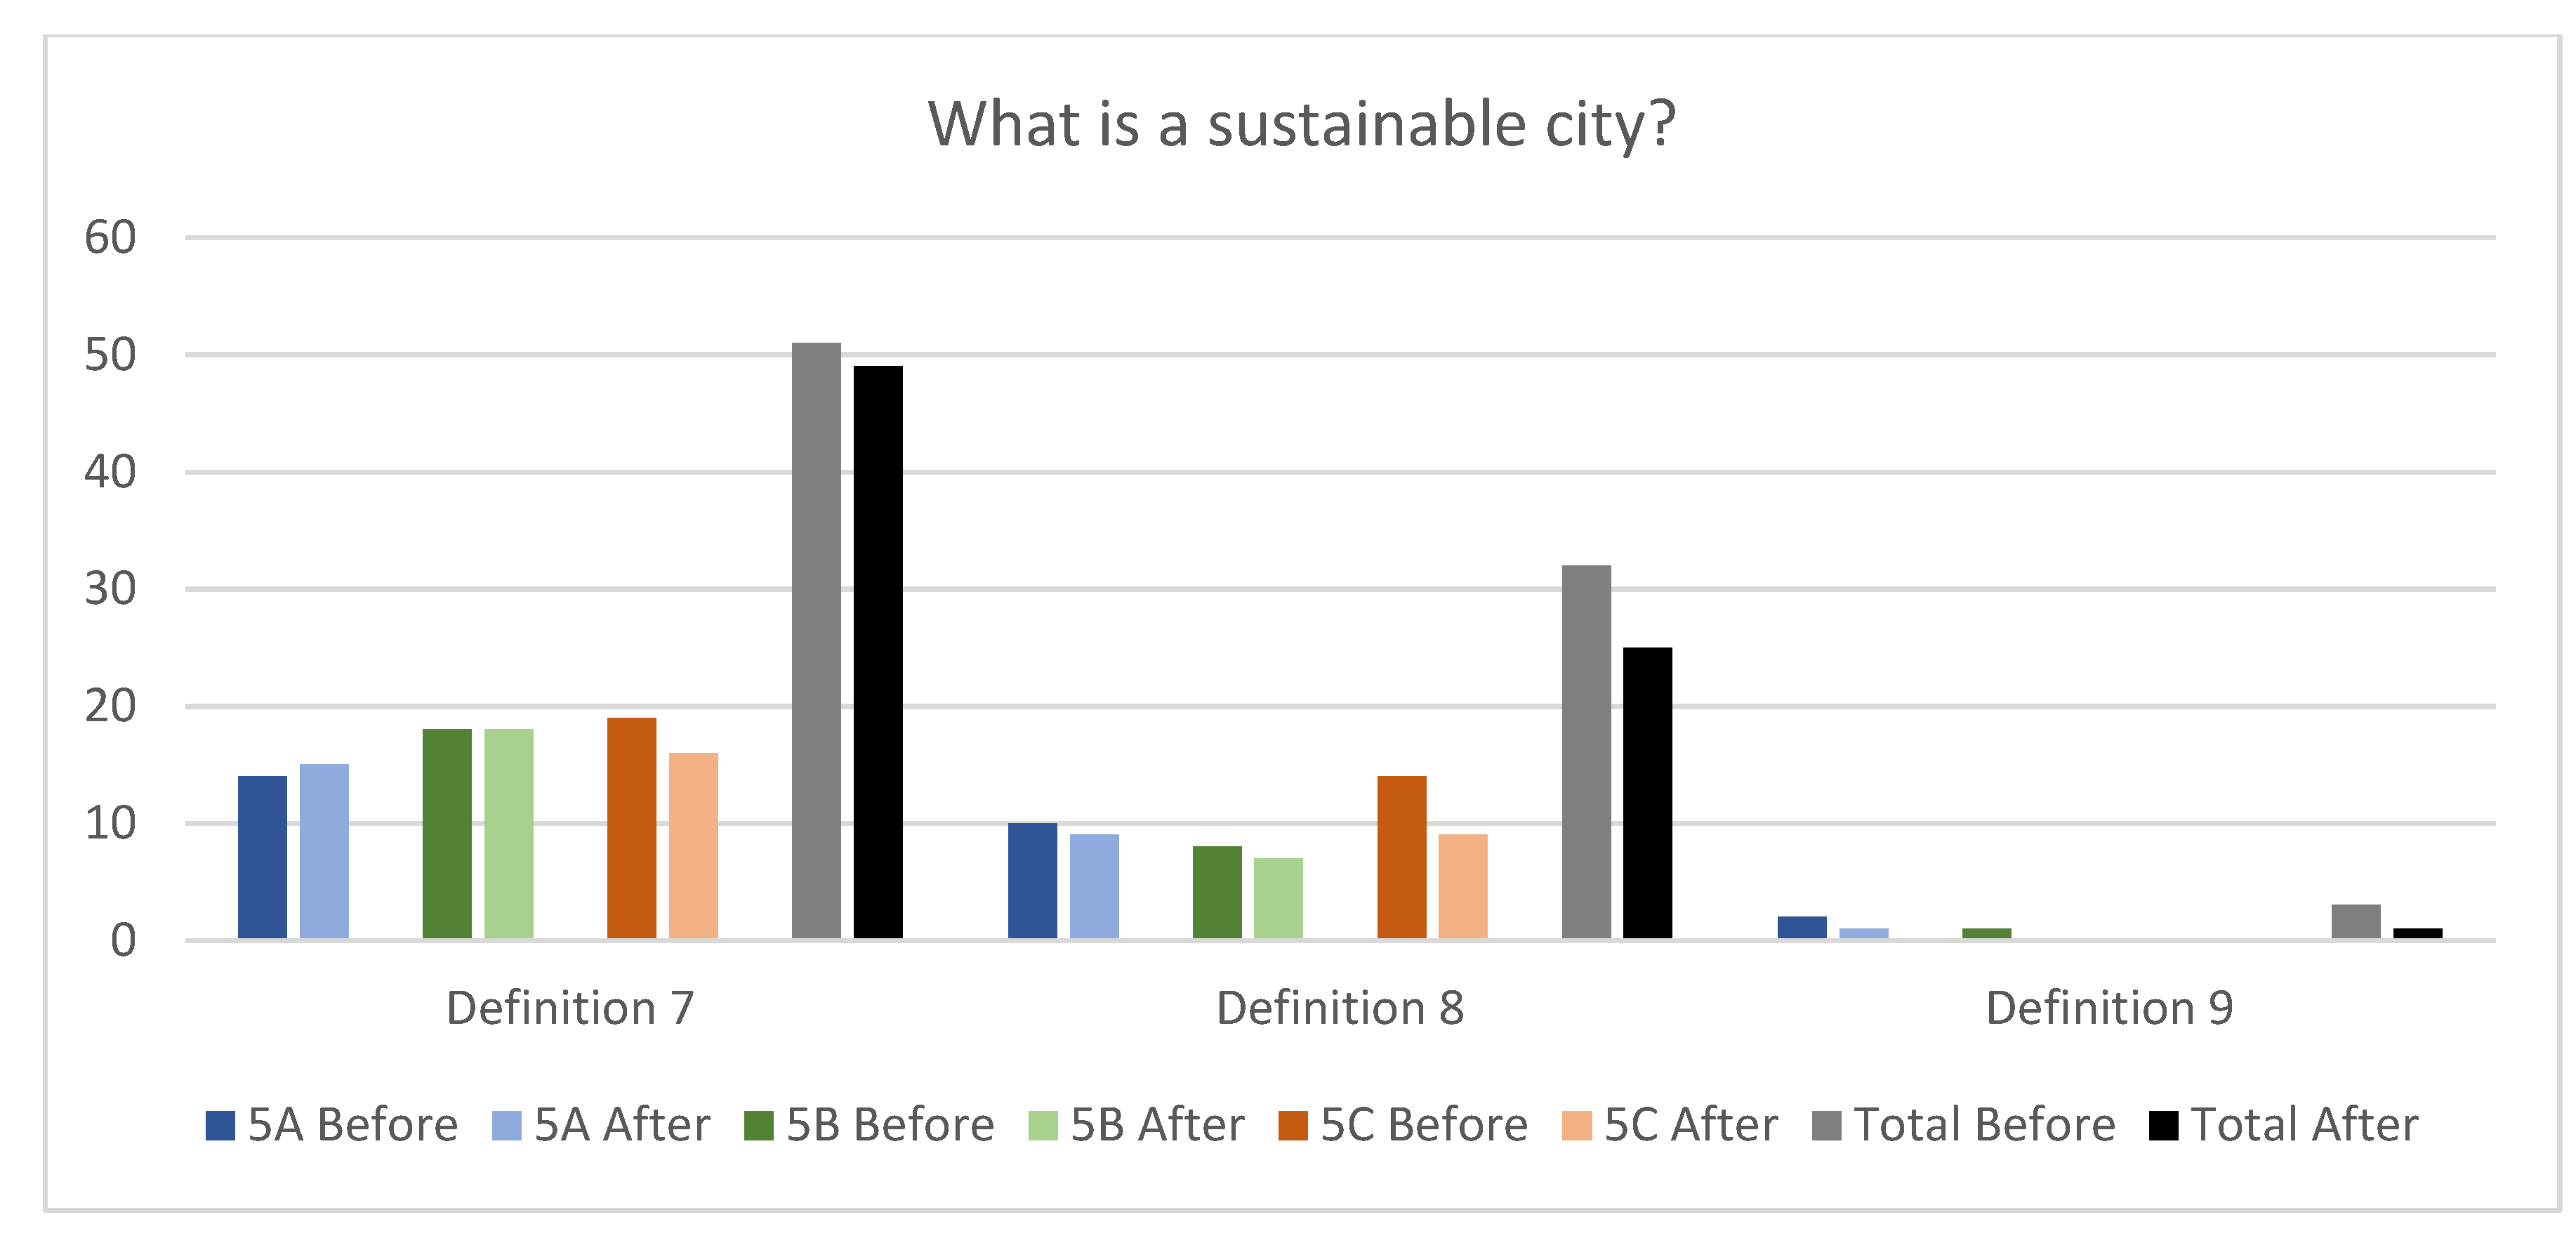
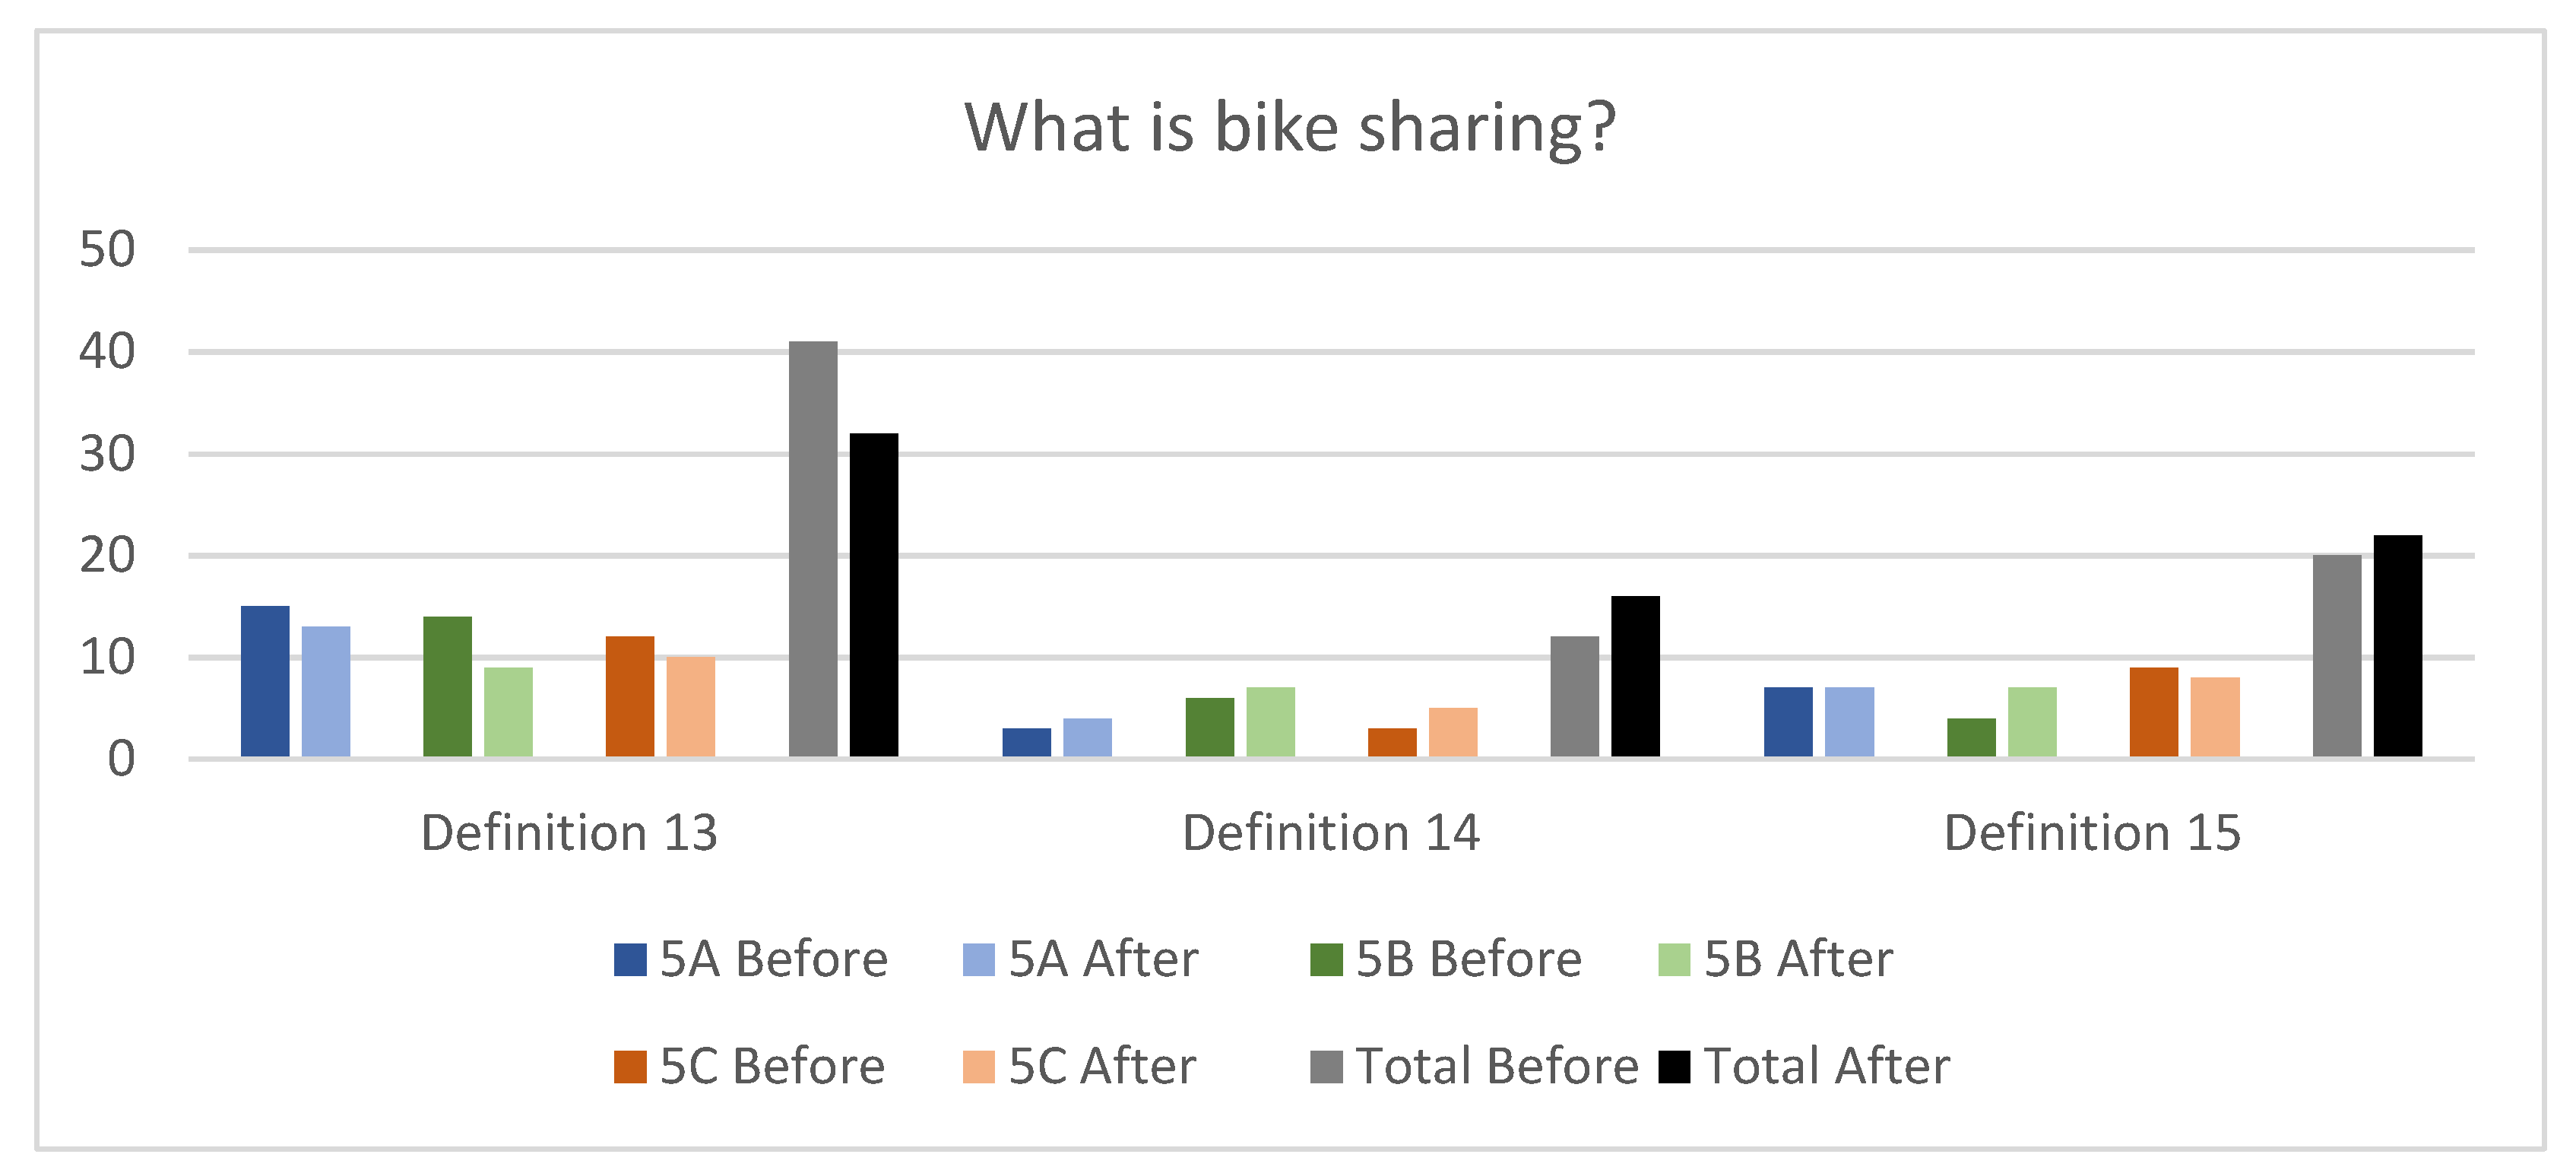
  • Definition of certain key words and concepts associated with sustainable mobility, such as “bike lane,” “pedestrian zones,” “mass transit,” “shared car,” “sustainable city,” “sustainable transport,” “bike sharing”.
All questions were adapted so that they could be easily understood by 10–12-year-old pupils.
This questionnaire, except for the initial part about socioeconomic characterisation, was filled out after the gamified learning experience to assess any changes in the children’s awareness.
To better understand the results, we discuss the initial questionnaire when we refer to the data obtained before the learning experience and the verification questionnaire when we refer to the data obtained after the learning experience.

3.2. Design of the Activities in the ClassCraft Platform

The first version of ClassCraft, created by Shawn Young in January 2011, was inspired by roleplaying videogames or roleplaying games (for example, World of Warcraft).
Although ClassCraft was initially developed for use in secondary school classes, examples exist of its use in primary education [71].
The web application has already been created and allows teachers to direct a roleplaying game in which the pupils take on a variety of characters. Roleplaying games (RPG) can be defined as a system to create stories based on a series of rules [72]. In this particular case the idea was for the pupils to become involved in a game where the evolution of their character is related to their academic abilities and class collaboration.
The game works using a web engine, so the events occurring in the game are sent in real time to the controls of other users, just like an online video game [73]. ClassCraft is not related to any specific learning material and the duration of the game depends on the expectations of the teacher (from a few classroom hours to the entire year). The pupils play during and outside school time [73].
ClassCraft is a very visual and attractive platform that can create a world of characters (wizards, healers, and warriors) that need to cooperate and take part in missions to win points and coins in order to improve their team. The aim is to move forward by collaborating as a team and at the same time learn and expand knowledge. The teachers have access to an interface where they can create a story and a group of activities that the pupils need to solve to gain points and rewards. They have a private online profile where they can see how many rewards they have received, what the activities are, etc. The pupils have to develop what the teacher has proposed and later receive points and rewards recognising their work.
The rules of the game are relatively simple. A pupil who demonstrates positive behaviour in the class can receive “experience points” (XP). If a pupil “breaks” the class rules, they will lose “health points” (HP), their vital energy for the game, and eventually they will fall in battle.
In our case, a story was created where the pupils were superheroes called on to save the inhabitants of a polluted island. Various types of activities were created and presented on the platform: crosswords, word search puzzles, coded messages, images, conceptual maps, mathematical problems, informative videos and documentaries, stories, chat discussions, and real examples. The map of the story including the activities was made up of a total of 48 stages. The children had a certain time available to solve each task and could receive different rewards (XP and GP) if they finished before or after the allowed time.

3.3. Data Collection in the Case Study: Conducting the Survey before and after the Experience

The protagonists of this research were the 5th-year primary pupils of the Colegio Marista Liceo Castilla school in Burgos. The sample total of the study was 75 pupils divided into 3 classes (25 each). All the pupils were within the 10–11-year age range, and there were slightly more boys than girls in all 3 classes. In total the sample consisted of 53% boys and 47% girls.
The experience was categorised as an extracurricular activity and the in-person meetings were planned so as not to interfere with school work.
The pupils were given 60 min each to answer the survey. They could receive help from the teachers from a practical (context) but not a conceptual (meaning) point of view. Anonymity was guaranteed at all times, as was the confidentiality of the replies. The questionnaires were filled out before the start of the experience and then again after 3 months of activities.

4. Results

The two questionnaires were analysed at the same time and the same questions were asked before and after the gaming experience.
The verification questionnaire asked the same questions as the initial questionnaire without repeating the socio-economic characterisation questions (which did not change and were not affected by the learning experience).
For ease of analysis, the results were divided into three large parts:
  • The characterisation of the pupils’ habits and their perception of mobility;
  • The evolution of basic knowledge about sustainable mobility;
  • The analysis of learning using gamification techniques before and after the activity.
The main aim was to see how the pupils’ ways of thinking had evolved in order to evaluate and validate the effectiveness of the activity. Note that in this experience the activities were not compulsory.

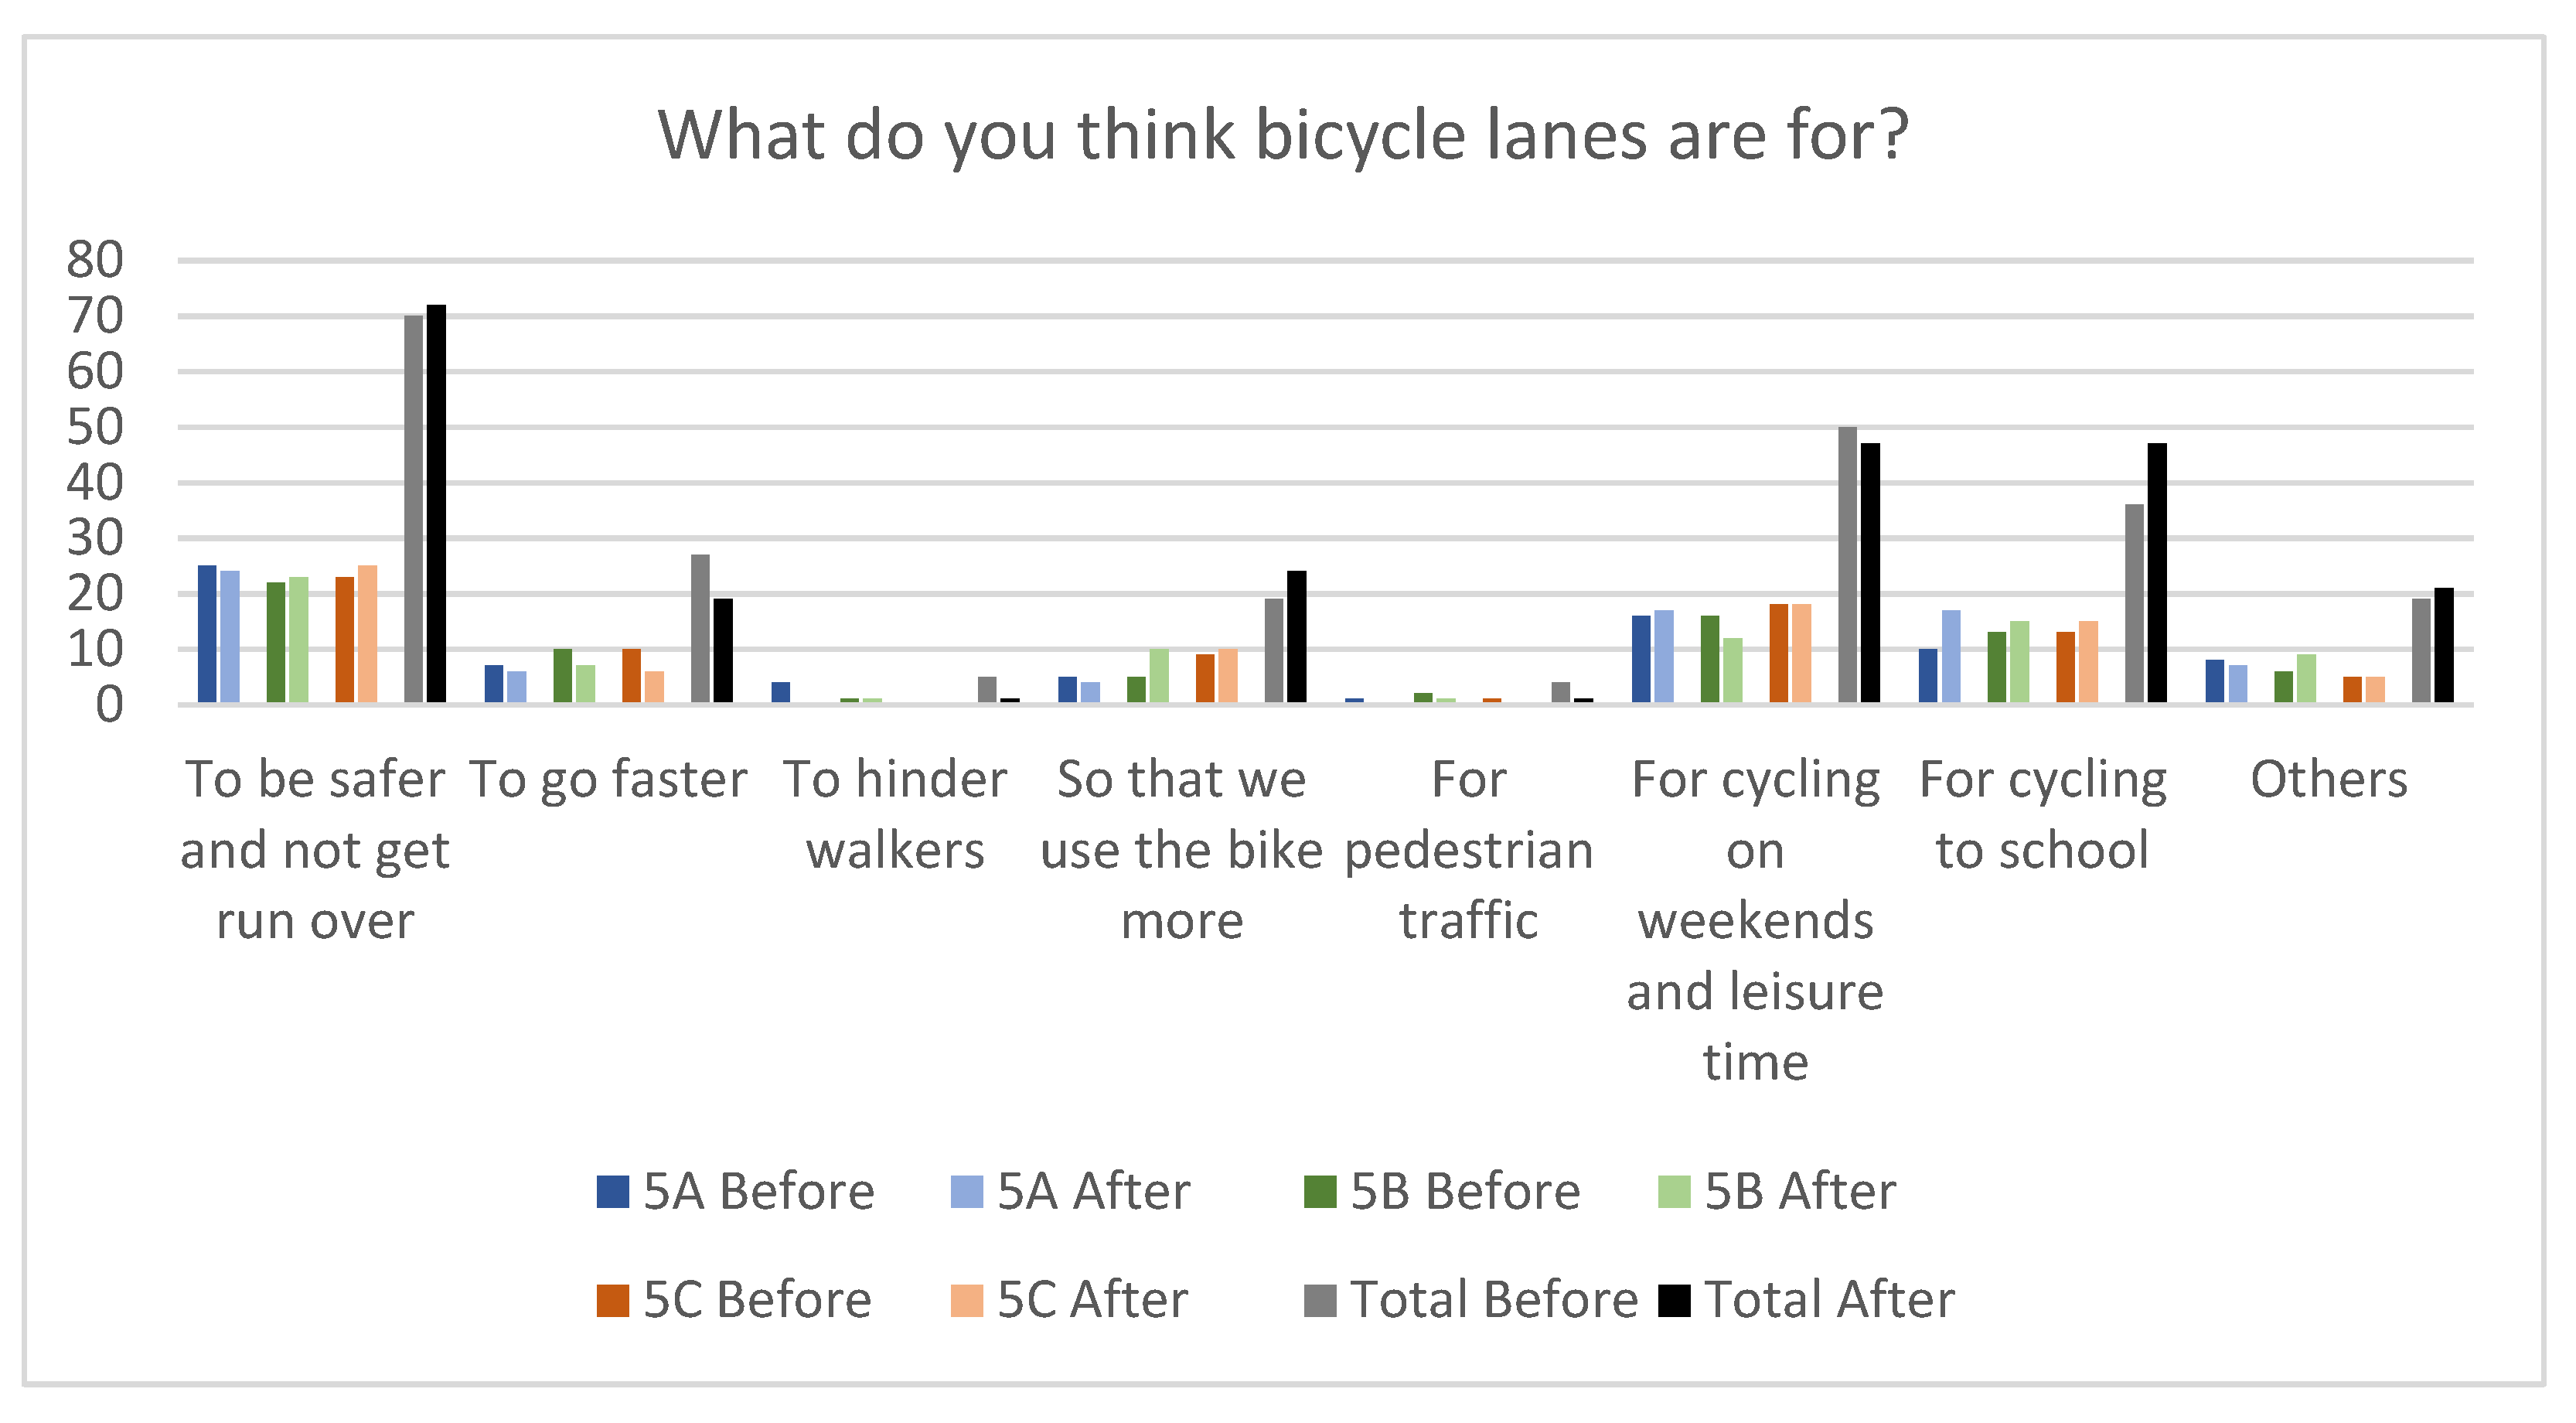
4.1. The Characterisation of Pupils’ Habits and Their Perception of Mobility

Below we analyse and compare the pupils’ habits and perceptions about mobility before and after the gamification experience.
We analyse the pupils’ perception of the different ways they could travel to school; what kinds of transport is available in the city; what their opinions are about various subjects related to the environment, pollution, and sustainability; and what their priorities are when they are about to travel.
In order to establish whether or not mobility habits were being influenced by the zones where the pupils lived, they were asked about their place of residence, as the school is located on the outskirts of the city (with respect to the urban centre) and is connected by one of the main highways into and out of the city.
Here we found heterogeneity with most of the pupils (37%) living in the city centre, a similar percentage (30%) living in the outskirts, and 22% living in surrounding towns and villages, with 11% living close to the school.
Car ownership was also found to be an important factor affecting the mobility habits of the pupils and their families.
Most households had 2 cars, with a total of 155 cars spread between the 75 households, representing a car ownership rate of 2.07 cars per household.
Most of the households (96%) had at least one bicycle that they used once per week (40%) or more than once per week (42%). Two households used their bicycles on a daily basis. Bicycle use was found to be mainly for recreational purposes and for getting around town.
The pupils were asked how many different ways (modes or combination of modes) they could choose from to travel from their home to school. The intention was to find out how many possible ways they were aware of for getting to school, whether they used them or not.
Most of the pupils typically travelled to school by car (over 61%) or on foot (21%), and a small percentage went by bicycle (11%) or by bus (7%). The pupils mainly went to school accompanied by their parents and to a lesser extent by their grandparents or siblings. After the experience, an increase in the options available was registered in the replies, meaning that with the activity the pupils had learnt about, remembered, or become aware of new modes of transport, thereby widening their vision. The most important increases were found in the following modes: bicycle, walking bus, bus, and walking, all of which are sustainable modes of transport, and from that point of view we can conclude that the activity was very effective. An expected increase was found in the number of pupils choosing the car, and curiously a fall in the number choosing the combined mode of bus and walking. Most of the pupils also used modes alternative to a car, but 21.3% of the pupils had only ever used a car for travelling. The most frequently used alternative modes were travelling by walking, bus, train, and bicycle. The most common reasons for travelling were shopping, visiting friends and family, and running errands.
Awareness about the available modes of public transport is an important factor in increasing their use. To check the pupils’ knowledge, they were asked about the modes of public transport that exist in the city of Burgos. Overall, the number of pupils aware of the different forms of public transport available in the city showed a significant increase after the gamified activity. Mechanical stairways, train, and rented bicycles were the public transport modes that showed the biggest increases of 29%, 18%, and 14%, respectively, but there were also increases found in the pupils’ awareness of taxis (3%) and buses (2%) (the public transport mode most widely known by the pupils). A small number of pupils pointed out the presence of the tram (one pupil both before and after the activity) and the metro (two pupils both before and after the activity) in the city of Burgos, which do not actually exist there. Nevertheless, overall we can conclude that the goal of the activity was achieved and the pupils significantly increased their awareness of the different modes of public transport available in the city.

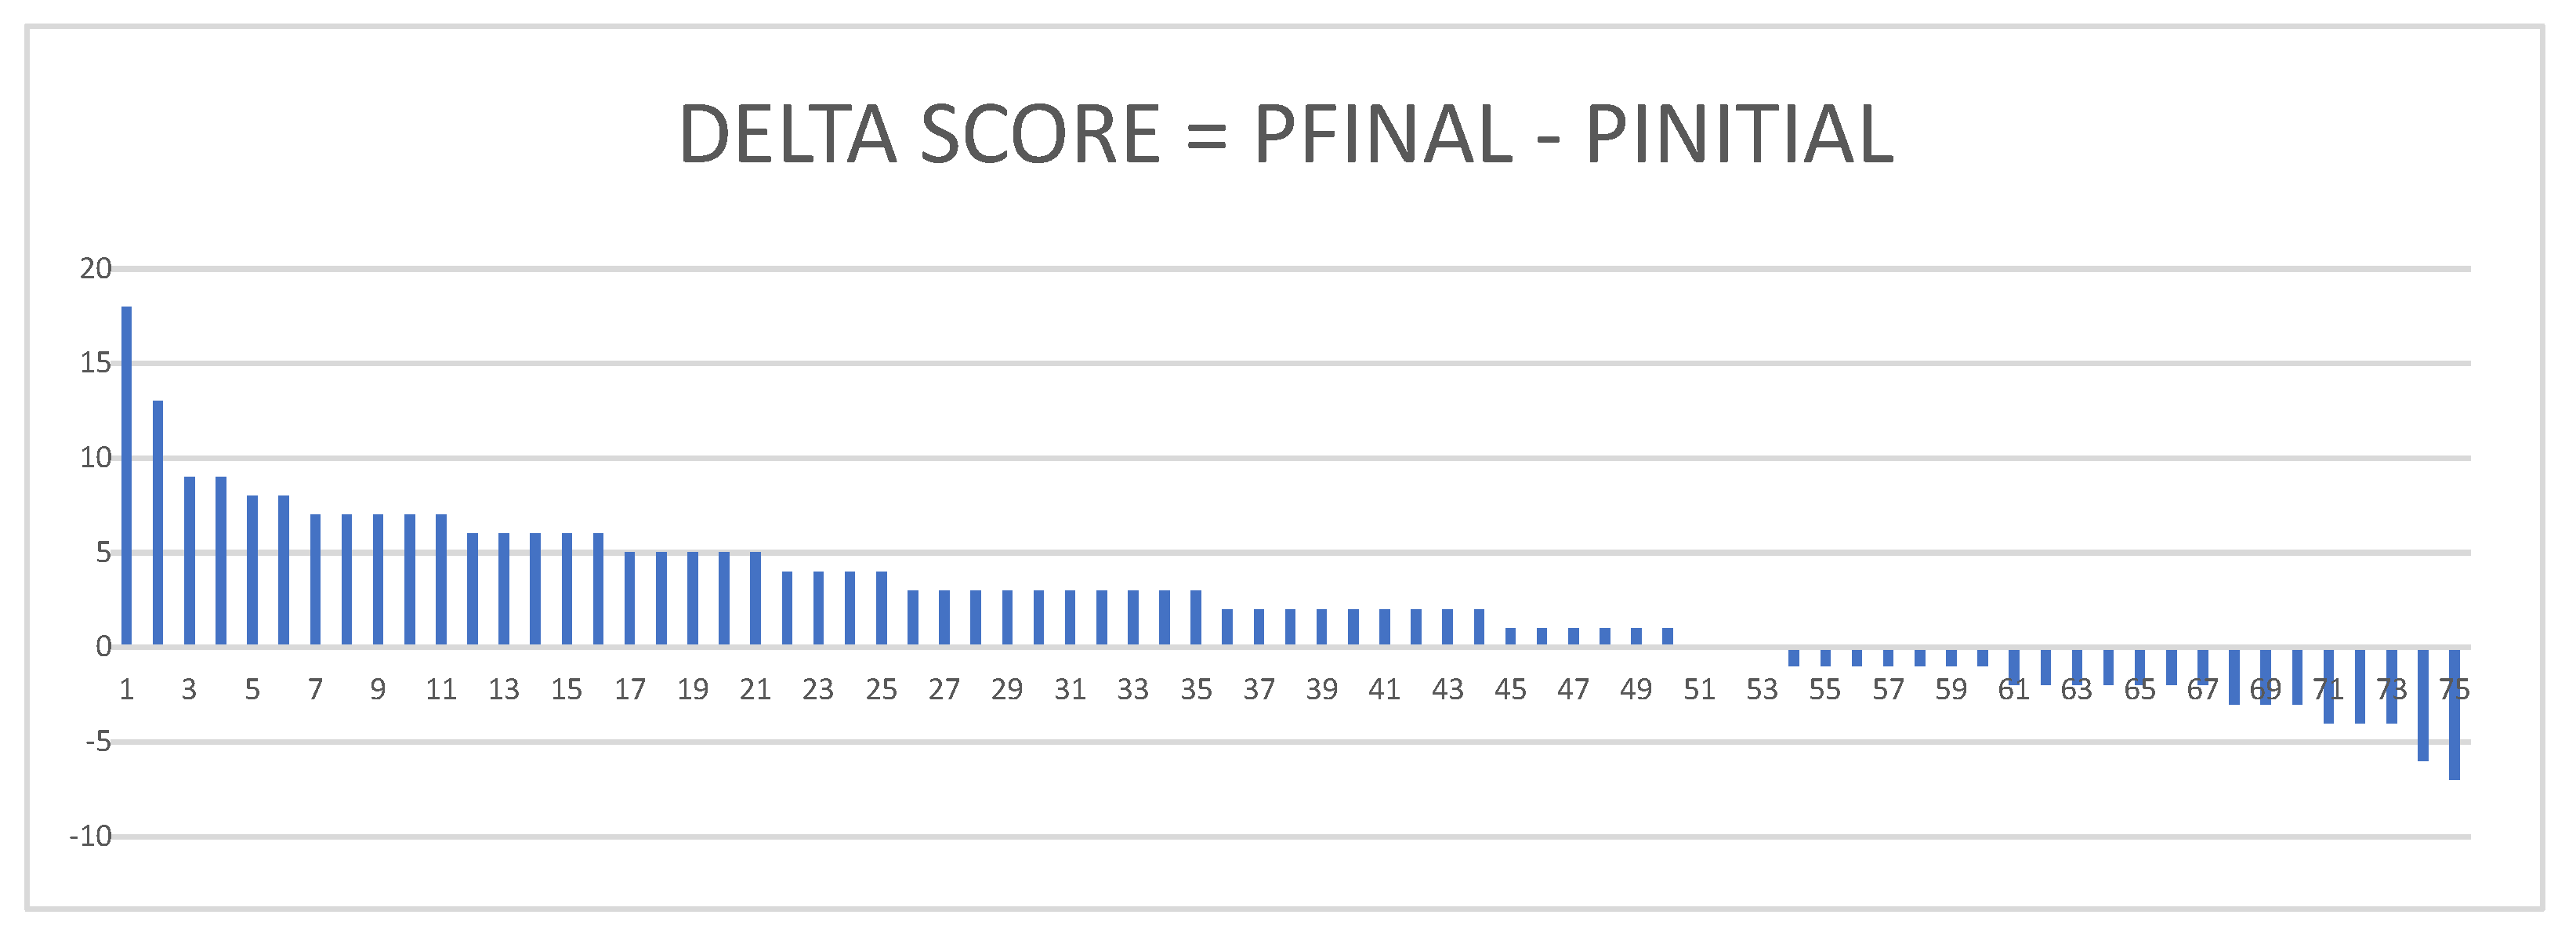
4.2. Evolution of Basic Knowledge about Sustainable Mobility

In this section we analyse the common questionnaire questions concerning the basic awareness of sustainable mobility found before and after the gamified activity.
We will start with awareness of bicycle lanes (Figure 2). Before the activities started, 70% of the pupils showed awareness of bicycle lanes; however, the aim was to see whether they understood their utility after the gamified activity. During the gamified activity the pupils learned that the bicycle is not purely a mode of transport used for leisure purposes, and this achievement was a significant one. There was also a 5% increase in the replies where the pupils stated that bicycle lanes encourage bicycle use and increase cyclist safety. These are important concepts and demonstrate the progress made by the pupils in learning about the function of bicycle lanes. The number of pupils saying that bicycle lanes were to go faster and were to be used at the weekend and during free time saw a 9% drop. The pupils also showed that they had a better understanding that bicycle lanes were not for pedestrian use and were in no way an infrastructure that got in the way of pedestrians or made life difficult for them. Overall, we can state that this activity produced very satisfactory results.
Exactly the same happened with pedestrian zones (Figure 3), where 70% of the pupils showed that they were aware of their presence in the city of Burgos. When asked about the utility of pedestrian zones, most (70%) of the pupils thought they allowed pedestrians to circulate freely and 50% said they were to stop cars entering the area, whereas 38% said they were to create more public space and 26% stated they were to reduce pollution.
After the gamified activity the highest increases were found in the two options that were chosen least beforehand (to create more public space increased by 4% and to reduce pollution increased by 3%). This is a very positive result, as it shows us that the gamified activities helped the pupils to better understand the least popular concepts.
The replies given for the specific definitions of “mass transit,” “shared car,” “sustainable city,” “sustainable transport,” and “bike sharing” are analysed below.
All were analysed for the frequency of the reply disaggregated by type and total, and the percentage variation found in the overall replies.
To check that the pupils understood the meaning of “mass transit,” they were asked to choose from three definitions:
Definition 1.
It is a kind of public transport that has set timetables and routes. Some examples are cars, motorbikes, vans, and trucks.
Definition 2.
It is a kind of public transport that has set timetables and routes. Some examples are buses, trains, and trams, etc.
Definition 3.
It is a type of transport used only by people who do not have a car.
Before the activity most of the pupils chose Definition 2 (65%), whereas 20% chose Definition 1 and 15% chose Definition 3. After the game, the number of pupils choosing the correct answer increased and the others dropped, above all in the case of Definition 1, which we considered to be incorrect.
An analysis of the data considering the percentage variation in respect to the concept of mass transit (Figure 4) shows that after the activity the number of pupils choosing Definition 2 increased by 22%, the number choosing Definition 1 dropped by 17%, and those choosing Definition 3 fell by 5%. We can also conclude that in this case the activity was successful at increasing awareness about the characteristics and functions of mass transit.
To check that the pupils understood the meaning of “shared car,” they were asked to choose from three definitions:
Definition 4.
Consists of sharing a car with other people for a limited time.
Definition 5.
Consists of sharing a car with other people, but only when my car is not available.
Definition 6.
Consists of sharing a car with other people to go to work, to school, travelling, etc. Using this method, we can reduce traffic jams and pollution in the city.
Most of the pupils understood the meaning of “car sharing” (Figure 5) and they mainly associated it with Definition 6, which is the most correct.
After the gamified activity the number of pupils choosing the correct definition increased. The percentage variation in the number of pupils choosing Definition 6 increased by 28%, those choosing Definition 4 fell by 18%, and those choosing Definition 5 fell by 10%. The activity again was shown to be effective at increasing pupil awareness.
To check that the pupils understood the meaning of “sustainable city” (Figure 6), they were asked to choose from three definitions:
Definition 7.
It is a city where the inhabitants look after the environment without damaging it, carrying out their economic activities and creating a respectful city for the well-being and equality of all.
Definition 8.
It is a city where the inhabitants look after the environment without damaging it and without carrying out any economic activity at all, thereby being very respectful of the environment.
Definition 9.
A sustainable city is a city in which the inhabitants do not look after the environment and carry out their economic activities without respecting their surroundings and thereby creating an unequal society with low levels of well-being.
Evidently the correct definition is number 7 and number 9 is totally incorrect.
Normally people think about Definition 8 given that they see the environmental factor, but ignore the other two aspects of sustainability.
If we look at the frequency of the replies the results seemed to be unsatisfactory, but this is really because in the first survey taken before the gamified experience, some of the children chose more than one definition, which was not allowed after the activity.
It is interesting to analyse a summary of the results by percentage, which shows how the number of children choosing the correct answer increased by 6% and the number of children choosing the other definitions decreased by 4% for Definition 8 and by 2% for Definition 9. The results can therefore be seen as satisfactory, although the aim would have been for the number of pupils choosing Definition 8 to drop substantially, meaning that the activity could be improved by concentrating on these points.
To check that the pupils understood the meaning of “sustainable transport” (Figure 7), they were asked to choose from three definitions:
Definition 10.
Sustainable transport means that everyone uses their own car to go to school or work, etc.
Definition 11.
Sustainable transport means people use all the available modes of transport in the city.
Definition 12.
Sustainable transport helps to reduce negative effects on the environment and means using less polluting modes of transport.
In this case the correct Definition is 12. Definitions 10 and 11 are incorrect, although 11 could be considered as less incorrect than 10. After the gamified activity the choice of Definition 12 increased by 20% and the number of pupils choosing Definitions 10 and 11 fell. The choice for Definition 10 fell by 13% and for 11 by more than 7%. This case also demonstrates the effectiveness of the activity.
To check that the pupils understood the meaning of “bike sharing,” (Figure 8) they were asked to choose from three definitions:
Definition 13.
It is a paid transport service where bicycles are placed at certain locations around the city so that people can use them. They can collect them in one place and leave them in another place.
Definition 14.
It is a service provided for short-distance journeys in an urban area used as an alternative to public transport that is located at various locations around the city; it is free to use.
Definition 15.
It is a service where the people use a bicycle as an alternative form of public transport and the bicycle can be used for as long as you like.
In this case, Definition 13 is the correct answer, although 14 and 15 provide some important concepts, which we tried to get across during the gamified activity. Definition 14 highlights the urban nature and the free aspect of the service, which are characteristics that could be introduced to a bike-sharing service, whereas Definition 15 insists that bike sharing is a form of public transport, but the bikes are available for as long as the user wants.
After the activity, by percentage, the choice for Definition 13 fell by 10%, whereas 14 and 15 increased by 6% and 4%, respectively. At first glance this looks like the results do not show a high percentage of improvement after the activity, contrary to the previous notions. It appears opportune to consider a clearer definition of bike sharing in any future experiments.

4.3. Analysis of Learning Using Gamification Techniques before and after the Activity

In the previous sections, we commented on the results of the questionnaires describing the pupils’ habits and perceptions of mobility and the evolution of their basic awareness about sustainable mobility before and after the learning activity using gamification techniques. In this section, we compare their initial and final levels of awareness in greater detail. To this end, points have been added to the awareness questions as a function of the answers given. A recount of these points scored in the initial (PINITIAL) and final (PFINAL) surveys allowed us to numerically define the base level at which the pupil started and the final level when they finished the gamified activity. A table summarising the most relevant results is presented below (Table 1).
The first column shows that the number of students who improved their level of awareness was greater than the number of students who lessened their awareness. In percentage terms, it can be seen that 66.67% of the pupils improved their scores (second column). The third and fourth columns show that overall, the number of pupils who improved their scores (80.36%) was much greater than the number of those who worsened their scores (19.64%). The justification for this will become clearer further on in this article, when we consider the results relating to other factors such as satisfaction, time spent doing the activity, the number of activities performed, etc. These relationships will help us explain how circumstances play a relevant role in the success of this methodology. Figure 9 visually represents the results of the 75 pupils, expressed in the table above, organized as a function of the variation in scores (DELTA_SCORE).
DELTA_SCORE = PFINAL − PINITIAL
In order to analyse the relationship between the final scores and other relevant variables, we applied a series of multiple linear regression models (9 models MR1-MR9). These models relate the final score (PFINAL) arrived at with the verification questionnaire (final), which represents the dependent variable, with the variables obtained using the ClassCraft platform indicating the time that each player spent on the game, as well as their overall satisfaction level with the game (SAT_GLOB) (Table 2).
The specific variables used were as follows:
  • From the platform: the level in the game reached by the pupil (NIV_JU), the points scored on the ClassCraft platform at the end of the game (P_JU), the number of activities finished on ClassCraft (N_ACT), and the number of connections (N_CON).
  • From the following information found using the final questionnaire: weekly access (ACC_SEM), total hours spent playing per week (HOR_SEM), and overall level of satisfaction (SAT_GLOB).
The models shown in Table 2 reveal a positive correlation between all the considered variables and the final scores reached by the pupils. In all cases the parameters associated with the considered dependent variable were statistically significant to more than a 95% confidence level.
MR1 ran a multiple regression model to predict the final score obtained from the verification questionnaire as a function of the level reached playing the game. A significant regression was obtained (F (1.74) = 140.877, p < 0.000), with an R2 of 0.656. The prediction for the final score is equal to:
PFINAL = 2.275 * (NIV_JU)
MR2 ran a multiple regression model to predict the final score obtained from the verification questionnaire as a function of the points scored on the ClassCraft platform at the end of the game. A significant regression was obtained (F(1.74) = 115.891, p < 0.000), with an R2 of 0.610. The prediction for the final score is equal to:
PFINAL = 0.003 * (P_JU)
MR3 ran a multiple regression model to predict the final score obtained from the verification questionnaire as a function of the number of activities finished using ClassCraft. A significant regression was obtained (F(1.74) = 82.476, p < 0.000), with an R2 of 0.527. The prediction for the final score is equal to:
PFINAL = 0.849 * (N_ACT)
MR4 ran a multiple regression model to predict the final score obtained from the verification questionnaire as a function of the number of ClassCraft connections. A significant regression was obtained (F(1.74) = 134.726, p < 0.000), with an R2 of 0.645. The prediction for the final score is equal to:
PFINAL = 0.655 * (N_CON)
MR5 ran a multiple regression model to predict the final score obtained from the verification questionnaire as a function of the weekly access to ClassCraft. A significant regression was obtained (F(1.74) = 301.488, p < 0.000), with an R2 of 0.803. The prediction for the final score is equal to 6.179 * (ACC_SEM).
PFINAL = 6.179 * (ACC_SEM)
MR6 ran a multiple regression model to predict the final score obtained from the verification questionnaire as a function of the number of hours spent weekly on ClassCraft. A significant regression was obtained (F(1.74) = 259.502, p < 0.000), with an R2 of 0.778. The prediction for the final score is equal to:
PFINAL = 12.194 * (HOR_SEM)
MR7 ran a multiple regression model to predict the final score obtained from the verification questionnaire as a function of the overall satisfaction level with the activity. A significant regression was obtained (F(1.74) = 350.162, p < 0.000), with an R2 of 0.826. The prediction for the final score is equal to:
PFINAL = 10.008 * (SAT_GLOB)
MR8 ran a multiple regression model to predict the final score obtained from the verification questionnaire as a function of the overall satisfaction level with the activity and the number of hours spent per week on ClassCraft. A significant regression was obtained (F(1.74) = 364.131, p < 0.000), with an R2 of 0.909. The prediction for the final score is equal to:
PFINAL = 6.207 * (SAT_GLOB) + 6.219 * (HOR_SEM)
MR9 ran a multiple regression model to predict the final score obtained from the verification questionnaire as a function of the overall satisfaction level with the activity and the weekly access to ClassCraft. A significant regression was obtained (F(1.74) = 453.112, p < 0.000), with an R2 of 0.925. The prediction for the final score is equal to:
PFINAL = 5.934 * (SAT_GLOB) + 3.355 * (ACC_SEM).
An analysis of models MR1, MR2, and MR3 shows conclusively that the pupils who learnt the most were those who reached the highest level in the game, those who accumulated the most points, and those who finished the most activities. This is very important because it validates the effectiveness of the method used and, above all, justifies that the pupils who did not show improvement and even in some cases worsened their performance were the pupils who remained at a lower level in the game, finished fewer activates, and therefore scored fewer points.
An analysis of models MR4, MR5, and MR6 shows how the amount of time spent playing also had a direct impact on the pupils’ final performance. It shows that the pupils who connected more often, those playing the most weeks, and those dedicating more hours per week also learnt more. If we connect these results to those presented above, we can conclude that the performance of the pupils is directly related to the activities they participated in and the time spent playing. A closer look reveals that models MR5 and MR6 presented the best R2 fit of the first six models. This shows that learning improved when the pupils connected more often and spent more time on the activities.
Model MR7 measured whether the pupil satisfaction levels using the application and playing the game had a positive effect on learning. We can clearly conclude that this was the case and is probably the most important factor. The more attractive the game is and the more satisfied the pupils are, the more they learn.
The last two models (MR8 and MR9) combined the effect of satisfaction with the time spent playing. As can be seen, the combination of the two meant that the pupils learnt more.

5. Discussion

This article presents a study exploring student motivation and the opportunity of using gamification for learning, as in previous research [74,75]. The promotion of more sustainable means and habits of mobility is an increasingly important goal for societies around the world. Sustainable urban mobility has grown in importance and become a major factor in smart cities [76]. Success with gamification involves determining which games are preferred by individuals, how the schemes can be organised, and what the effects will be. As found by Çakıroğlu et al. [77], our results show that gamification is so successful because some traditional classroom activities are inherently uninteresting and do not attract students’ attention. In fact, today’s students are growing up with interactive media and video games, and games are becoming part of their lives. Gamification in the classroom can therefore be engaging and motivating [78]. This is what we have found in our experience. It highlights very clearly that the element of fun and motivation is very important for students.
In terms of general knowledge, our results are in line with some previous studies [79,80,81,82] that found that gamified learning led to an improvement in students’ overall academic performance. This improvement stemmed from students’ enjoyment, participation, and satisfaction with the online gaming process.

6. Conclusions

This article describes the results of a learning experience based on gamification aimed at improving the perception of society about the problems associated with sustainable mobility. The project was designed to teach pupils aged 10–12 years old.
The main conclusions drawn from the work are presented below, and take into account the overall and specific objectives originally proposed and highlight their achievement.
The proposed goal was to observe and evaluate the use of gamification techniques as a key part of encouraging learning and changing habits regarding sustainable mobility. Specific targets were added, as they played an important role in achieving the overall goal. The level of fulfilment of both the overall and specific goals was satisfactory.
The bibliographic review, both regarding gamification and sustainable mobility, gave us a base from which to better understand this teaching methodology and verify its use in the field of education. We also found that little research has been done regarding teaching young children aged 10–12 years about sustainable mobility and the teaching methods used towards this end.
We can state that our experience has contributed to the understanding of the effect that this kind of methodology can have on improving perception about the concepts of sustainable mobility in all its aspects.
An initial assessment before the proposed gamified activity showed that the children had little awareness of the subject. We deduced that before they took part in the learning activity the children were only aware of the environmental aspects of sustainable mobility, and they completely ignored the social and economic aspects. Their knowledge was biased towards the environmental component.
A comparison with the data produced after the gamified activity shows that the children grew their knowledge of sustainable mobility, including their awareness of the social and economic aspects that sustainable mobility benefits.
Although our research followed a systematic methodology that allowed us to achieve the set objectives and to obtain interesting results that could be used from a practical point of view, we must recognise that there are limitations that need to be considered:
  • The most important limitation is the sample size and the lack of a comparison group. It was not possible to repeat the experience in another school with a different group of pupils, meaning that the results from our small sample reduce the generalisability of the study. Nevertheless, other researchers may find the data useful for new avenues of research.
  • Another limitation arises from the voluntary nature of the experience on the part of the students. In fact, some difficulties were encountered in involving students in the study, leading us to create favourable situations to encourage their participation, such as the provision of real prizes that could be won by taking part.
  • Last but not least is the impossibility of having a meeting with parents to explain the importance and extent of our research.
We believe that this work is a starting point for future research that should consider the following questions:
  • Future research needs to determine whether or not our findings can be generalised to a wider population. Different results could emerge by considering other populations, which can then be compared.
  • The possible effect of the results on the mode of transport chosen for the children’s daily trips to school by switching to sustainable modes.
  • A follow-up questionnaire that measures whether the acquired concepts were maintained after the gaming activity finished.
  • A questionnaire for the parents and guardians of the children that can be used to verify whether the children’s learned sustainable behaviour spread to other contexts, such as leisure time and family trips.
  • The opinions of the teachers about the experience.

Author Contributions

Conceptualization, S.S., V.A.-G. and M.R.; methodology, S.S., V.A.-G. and M.R.; validation, S.S. and L.d.; formal analysis, S.S., V.A.-G. and M.R.; investigation, S.S., V.A.-G. and M.R.; data curation, S.S. and L.d.; writing—original draft preparation, S.S., V.A.-G., M.R. and L.d.; writing—review and editing, S.S., V.A.-G., M.R. and L.d.; funding acquisition, S.S. All authors have read and agreed to the published version of the manuscript.

Funding

We would like to thank the Ministero dell’Istruzione dell’Università e della Ricerca of the Italian Government for funding the PhD studies of Silvia Sipone in the University of Burgos (Spain).

Acknowledgments

The authors would like to thank the Colegio Marista Liceo Castilla in Burgos.

Conflicts of Interest

The authors declare no conflict of interest.

References

  1. Tonucci, F. La Città Dei Bambini; Laterza: Bari, Italy, 2005. [Google Scholar]
  2. Tabibi, Z. Incidence, Causes and Prevention of Child Accidents in Iran: An Analysis of Existing Studies. J. Fam. Res. 2009, 5, 179–205. [Google Scholar]
  3. Brundtland, G.H. Informe de La Comisión Mundial Sobre Medio Ambiente y el Desarrollo: Nuestro Futuro Común; Oxford University Press: Oxford, UK, 1987. [Google Scholar]
  4. Keating, M. The Earth Summit’s Agenda for Change: A Plain Language Version of Agenda 21 and the Other Rio Agreements; Centre for Our Common Future: Geneva, Switzerland, 1993; ISBN 2940070008. [Google Scholar]
  5. UNESCO. Educación Para Los Objetivos de Desarrollo Sostenible: Objetivos de Aprendizaje—UNESCO Biblioteca Digitall. Available online: https://unesdoc.unesco.org/ark:/48223/pf0000252423 (accessed on 30 June 2019).
  6. Henderson, K.; Tilbury, D. Whole-School Approaches to Sustainability: An International Review of Whole-School Sustainability Programs; Macquarie University: Sydney, Australia, 2004. [Google Scholar]
  7. Naciones Unidas. Memoria del Secretario General Sobre la Labor de la Organización; UN: New York, NY, USA, 2015. [Google Scholar]
  8. Fadeeva, Z.; Mochizuki, Y. Higher Education for Today and Tomorrow: University Appraisal for Diversity, Innovation and Change towards Sustainable Development. Sustain. Sci. 2010, 5, 249–256. [Google Scholar] [CrossRef]
  9. Segalàs, J.; Ferrer-Balas, D.; Svanström, M.; Lundqvist, U.; Mulder, K.F. What Has to Be Learnt for Sustainability? A Comparison of Bachelor Engineering Education Competences at Three European Universities. Sustain. Sci. 2009, 4, 17–27. [Google Scholar] [CrossRef] [Green Version]
  10. Stanitsas, M.; Kirytopoulos, K.; Vareilles, E. Facilitating Sustainability Transition through Serious Games: A Systematic Literature Review. J. Clean. Prod. 2019, 208, 924–936. [Google Scholar] [CrossRef] [Green Version]
  11. Bascopé, M.; Perasso, P.; Reiss, K.; Bascopé, M.; Perasso, P.; Reiss, K. Systematic Review of Education for Sustainable Development at an Early Stage: Cornerstones and Pedagogical Approaches for Teacher Professional Development. Sustainability 2019, 11, 719. [Google Scholar] [CrossRef] [Green Version]
  12. Guzmán-Garcia, L.A. Optimización Dinámica de Estrategias de Movilidad Sostenible En Áreas Metropolitanas. Ph.D. Thesis, E.T.S.I. Caminos, Canales y Puertos (UPM), Madrid, Spain, 2011. [Google Scholar]
  13. Høyer, K.G. Sustainable Mobility—The Concept and Its Implications. Ph.D. Thesis, Vestlandsforsking, Sogndal, Norway, 2000. [Google Scholar]
  14. Lautso, K.; Spiekermann, K.; Wegener, M.; Sheppard, I.; Steadman, P.; Martino, A.; Domingo, R.; Gayda, S. PROPOLIS: Planning and Research of Policies for Land Use and Transport for Increasing Urban Sustainability; TRIMIS: Helsinki, Finland, 2004. [Google Scholar]
  15. Loo Becky, P.Y.; Chow, S.Y. Sustainable Urban Transportation: Concepts, Policies, and Methodologies. J. Urban Plan. Dev. 2006, 132, 76–79. [Google Scholar]
  16. Wieringa, K.; Statistical Office of the European Communities. Environment in the European Union, 1995: Report for the Review of the Fifth Environmental Action Programme; European Environment Agency: Copenhagen, Denmark, 1995; ISBN 9282752631. [Google Scholar]
  17. Zegras, C. Sustainable Transport Indicators and Assessment Methodologies, Background Paper for Plenary Session 4. In Proceedings of the Biannual Conference and Exhibit of the Clean Air Initiative for Latin American Cities: Sustainable Transport: Linkages to Mitigate Climate Change and Improve Air Quality, São Paulo, Brazil, 24–27 June 2006; pp. 1–16. [Google Scholar]
  18. Zito, P.; Salvo, G. Toward an Urban Transport Sustainability Index: An European Comparison. Eur. Transp. Res. Rev. 2011, 3, 179–195. [Google Scholar] [CrossRef] [Green Version]
  19. Buzási, A.; Csete, M. Sustainability Indicators in Assessing Urban Transport Systems. Period. Polytech. Transp. Eng. 2015, 43, 138–145. [Google Scholar] [CrossRef] [Green Version]
  20. Tranter, P.; Pawson, E. Children’s Access to Local Environments: A Case-Study of Christchurch, New Zealand. Local Environ. 2001, 6, 27–48. [Google Scholar] [CrossRef]
  21. Pooley, C.G.; Turnbull, J. Coping with Congestion: Responses to Urban Traffic Problems in British Cities c.1920–1960. J. Hist. Geogr. 2005, 31, 78–93. [Google Scholar] [CrossRef]
  22. Pooley, C.G.; Turnbull, J.; Adams, M. “…Everywhere She Went I Had to Tag along beside Her”: Family, Life Course, and Everyday Mobility in England since the 1940s. Hist. Fam. 2005, 10, 119–136. [Google Scholar] [CrossRef]
  23. Pooley, C.; Turnbull, J.; Adams, M. The Impact of New Transport Technologies on Intraurban Mobility: A View from the Past. Environ. Plan. A Econ. Space 2006, 38, 253–267. [Google Scholar] [CrossRef]
  24. Kerr, J.; Rosenberg, D.; Sallis, J.F.; Saelens, B.E.; Frank, L.D.; Conway, T.L. Active Commuting to School. Med. Sci. Sports Exerc. 2006, 38, 787–793. [Google Scholar] [CrossRef]
  25. McMillan, T.; Day, K.; Marlon, B.; Alfonzo, M.; Anderson, C. Johnny Walks to School-Does Jane? Sex Differences in Children’s Active Travel to School. Child. Youth Environ. 2006, 16, 75–89. [Google Scholar]
  26. Mackett, R.L.; Gong, Y.; Kitazawa, K.; Paskins, J. Children’s Local Travel Behaviour-How the Environment Influences, Controls and Facilitates It. In Proceedings of the 11th World Conference on Transport Research, Berkeley, CA, USA, 24–28 June 2007; pp. 1–17. [Google Scholar]
  27. Heft, H.; Chawla, L. Children as agents in sustainable development: The ecology of competence. In Children and Their Environments; Spencer, C., Blades, M., Eds.; Cambridge University Press: Cambridge, UK, 2006; pp. 199–216. [Google Scholar]
  28. Chawla, L. Childhood Experiences Associated with Care for the Natural World: A Theoretical Framework for Empirical Results. Child. Youth Environ. 2007, 17, 144–170. [Google Scholar] [CrossRef]
  29. Chawla, L. Growing up Green: Becoming an Agent of Care for the Natural World. J. Dev. Process. 2009, 4, 6–23. [Google Scholar]
  30. Sharpe, S.; Tranter, P. The Hope for Oil Crisis: Children, Oil Vulnerability and (in)Dependent Mobility. Aust. Plan. 2010, 47, 284–292. [Google Scholar] [CrossRef]
  31. Malone, K. Children’s Rights and the Crisis of Rapid Urbanisation. Int. J. Child. Rights 2015, 23, 405–424. [Google Scholar] [CrossRef]
  32. Malone, K. “The Future Lies in Our Hands”: Children as Researchers and Environmental Change Agents in Designing a Child-Friendly Neighbourhood. Local Environ. 2013, 18, 372–395. [Google Scholar] [CrossRef]
  33. Barr, S. Personal Mobility and Climate Change. Wiley Interdiscip. Rev. Clim. Chang. 2018, 9, e542. [Google Scholar] [CrossRef]
  34. Ward, C. The Child in the City; Pantheon Books: New York, NY, USA, 1978; ISBN 0394735943. [Google Scholar]
  35. Hillman, M.; Adams, J.; Whitelegg, J. One False Move… A Study of Children’s Independent Mobility; Policy Studies Institute: London, UK, 1990; ISBN 0853744947. [Google Scholar]
  36. Karsten, L.; van Vliet, W. Children in the City: Reclaiming the Street. Child. Youth Environ. 2006, 16, 151–167. [Google Scholar]
  37. Fotel, T.; Thomsen, T.U. The Surveillance of Children’s Mobility. Surveill. Soc. 2004, 1, 535–554. [Google Scholar] [CrossRef]
  38. Rissotto, A.; Tonucci, F. Freedom of Movement and Environmental Knowledge in Elementary School Children. J. Environ. Psychol. 2002, 22, 65–77. [Google Scholar] [CrossRef]
  39. Sandqvist, K. Growing up with and without a Family Car. In Social Change and Sustainable Transport; Indiana University Press: Bloomington, IN, USA, 2002; pp. 117–124. [Google Scholar]
  40. Collins, D.C.A.; Kearns, R.A. The Safe Journeys of an Enterprising School: Negotiating Landscapes of Opportunity and Risk. Health Place 2001, 7, 293–306. [Google Scholar] [CrossRef]
  41. Gilbert, H.; Whitzman, C.; Pieters, J.; Allan, A. Children and Sustainable Mobility: Small Feet Making Smaller Carbon Footprints. Aust. Plan. 2017, 54, 234–241. [Google Scholar] [CrossRef]
  42. Mikkelsen, M.R.; Christensen, P. Is Children’s Independent Mobility Really Independent? A Study of Children’s Mobility Combining Ethnography and GPS/Mobile Phone Technologies1. Mobilities 2009, 4, 37–58. [Google Scholar] [CrossRef]
  43. Ferrando, H.; Molinero, P.; Peña, T. Con Bici al Cole Proyecto Pedagógico Para Alumnos de Primaria; ConBici: Barcelona, Spain, 2007. [Google Scholar]
  44. Bielik, P.; Tomlein, M.; Krátky, P.; Mitrík, Š.; Barla, M.; Bieliková, M. Move2Play: An Innovative Approach to Encouraging People to Be More Physically Active. In Proceedings of the 2nd ACM SIGHIT Symposium on International Health Informatics—IHI ’12, Miami, FL, USA, 28–30 January 2012; ACM Press: New York, NY, USA, 2012; pp. 61–70. [Google Scholar]
  45. Cowley, B.; Moutinho, J.L.; Bateman, C.; Oliveira, A. Learning Principles and Interaction Design for ‘Green My Place’: A Massively Multiplayer Serious Game. Entertain. Comput. 2011, 2, 103–113. [Google Scholar] [CrossRef]
  46. Orland, B.; Ram, N.; Lang, D.; Houser, K.; Kling, N.; Coccia, M. Saving Energy in an Office Environment: A Serious Game Intervention. Energy Build. 2014, 74, 43–52. [Google Scholar] [CrossRef]
  47. Gabrielli, S.; Maimone, R.; Forbes, P.; Masthoff, J.; Wells, S.; Primerano, L.; Haverinen, L.; Bo, G.; Pompa, M. Designing Motivational Features for Sustainable Urban Mobility. In Proceedings of the CHI ’13 Extended Abstracts on Human Factors in Computing Systems on—CHI EA ’13, Paris, France, 27 April–2 May 2013; ACM Press: New York, NY, USA, 2013; pp. 1461–1466. [Google Scholar]
  48. Kazhamiakin, R.; Marconi, A.; Martinelli, A.; Pistore, M.; Valetto, G. A Gamification Framework for the Long-Term Engagement of Smart Citizens. In Proceedings of the 2016 IEEE International Smart Cities Conference (ISC2), Trento, Italy, 12–15 September 2016; pp. 1–7. [Google Scholar]
  49. Kazhamiakin, R.; Marconi, A.; Perillo, M.; Pistore, M.; Valetto, G.; Piras, L.; Avesani, F.; Perri, N. Using Gamification to Incentivize Sustainable Urban Mobility. In Proceedings of the 2015 IEEE First International Smart Cities Conference (ISC2), Guadalajara, Mexico, 25–28 October 2015; pp. 1–6. [Google Scholar]
  50. Holleis, P.; Luther, M.; Broll, G.; Cao, H.; Koolwaaij, J.; Peddemors, A.; Ebben, P.; Wibbels, M.; Jacobs, K. TRIPZOOM: A System to Motivate Sustainable Urban Mobility. In Proceedings of the SMART 2012: The First International Conference on Smart Systems, Devices and Technologies, Stuttgart, Germany, 27 May–1 June 2012; pp. 101–104. [Google Scholar]
  51. Lee, J.J.; Matamoros, E.; Kern, R.; Marks, J.; de Luna, C.; Jordan-Cooley, W. Greenify: Fostering Sustainable Communities via Gamification. In Proceedings of the CHI ’13 Extended Abstracts on Human Factors in Computing Systems, Paris, France, 27 April–2 May 2013; ACM Press: New York, NY, USA, 2013; pp. 1497–1502. [Google Scholar]
  52. Coenen, T.; Merchant, P.; Laureyssens, T.; Claeys, L.; Criel, J. ZWERM: Stimulating Urban Neighborhood Self-Organization through Gamification. In Proceedings of the International Conference Using ICT, Social Media and Mobile Technologies to Foster Self-Organisation in Urban and Neighbourhood Governance, Delft, The Netherlands, 17 May 2013; OTB Research Institute for the Built Environment, Delft University of Technology: Delft, The Netherlands, 2013; pp. 1–16. [Google Scholar]
  53. Hamari, J.; Koivisto, J.; Sarsa, H. Does Gamification Work?—A Literature Review of Empirical Studies on Gamification. In Proceedings of the 2014 47th Hawaii International Conference on System Sciences, Waikoloa, HI, USA, 6–9 January 2014; pp. 3025–3034. [Google Scholar]
  54. Khoshkangini, R.; Valetto, G.; Marconi, A. Generating Personalized Challenges to Enhance the Persuasive Power of Gamification. In Proceedings of the Personalization in Persuasive Technology Workshop, Persuasive Technology, Amsterdam, The Netherlands, 3–6 April 2017; Orji, R., Reisinger, M., Busch, M., Dijkstra, A., Kaptein, E.M., Eds.; Amsterdam, The Netherlands, 2017; pp. 70–83. Available online: http://ceur-ws.org (accessed on 23 June 2019).
  55. Bakıcı, T.; Almirall, E.; Wareham, J. A Smart City Initiative: The Case of Barcelona. J. Knowl. Econ. 2013, 4, 135–148. [Google Scholar] [CrossRef]
  56. Merugu, D.; Prabhakar, B.S.; Rama, N.S. An Incentive Mechanism for Decongesting the Roads: A Pilot Program in Bangalore. In Proceedings of the NetEcon, ACM Workshop on the Economics of Networked Systems, Stanford, CA, USA, 7 July 2009; pp. 1–6. [Google Scholar]
  57. Hoh, B.; Yan, T.; Ganesan, D.; Tracton, K.; Iwuchukwu, T.; Lee, J.-S. TruCentive: A Game-Theoretic Incentive Platform for Trustworthy Mobile Crowdsourcing Parking Services. In Proceedings of the 2012 15th International IEEE Conference on Intelligent Transportation Systems, Anchorage, AK, USA, 16–19 September 2012; pp. 160–166. [Google Scholar]
  58. Gabrielli, S.; Forbes, P.; Jylhä, A.; Wells, S.; Sirén, M.; Hemminki, S.; Nurmi, P.; Maimone, R.; Masthoff, J.; Jacucci, G. Design Challenges in Motivating Change for Sustainable Urban Mobility. Comput. Hum. Behav. 2014, 41, 416–423. [Google Scholar] [CrossRef]
  59. Buningh, S.; Martijnse-Hartikka, R.; Christiaens, J. Mobi—Modal Shift Through Gamification. In Proceedings of the Transport Research Arena (TRA) 5th Conference: Transport Solutions from Research to Deployment, Paris, France, 14–17 April 2014. [Google Scholar]
  60. Wells, S.; Kotkanen, H.; Schlafli, M.; Gabrielli, S.; Masthoff, J.; Jylhä, A.; Forbes, P. Towards an Applied Gamification Model for Tracking, Managing, & Encouraging Sustainable Travel Behaviours. ICST Trans. Ambient. Syst. 2014, 1, e2. [Google Scholar] [CrossRef]
  61. Bie, J.; Bijlsma, M.; Broll, G.; Cao, H.; Hjalmarsson, A.; Hodgson, F.; Holleis, P.; van Houten, Y.; Jacobs, K.; Koolwaaij, J.; et al. Move Better with Tripzoom. Int. J. Adv. Life Sci. 2012, 4, 125–135. [Google Scholar]
  62. Poslad, S.; Ma, A.; Wang, Z.; Mei, H. Using a Smart City IoT to Incentivise and Target Shifts in Mobility Behaviour—Is It a Piece of Pie? Sensors 2015, 15, 13069–13096. [Google Scholar] [CrossRef]
  63. González Jorge, M. Gramificación: Hagamos Que Aprender Sea Divertido. Master’s Thesis, Universidad Publica de Navarra, Pamplona, Spain, 2016. [Google Scholar]
  64. Hu, R.; Fico, G.; Cancela, J.; Arredondo, M.T. Gamification System to Support Family-Based Behavioral Interventions for Childhood Obesity. In Proceedings of the IEEE-EMBS International Conference on Biomedical and Health Informatics (BHI), Valencia, Spain, 1–4 June 2014; pp. 181–184. [Google Scholar]
  65. Jones, B.A.; Madden, G.J.; Wengreen, H.J. The FIT Game: Preliminary Evaluation of a Gamification Approach to Increasing Fruit and Vegetable Consumption in School. Prev. Med. 2014, 68, 76–79. [Google Scholar] [CrossRef]
  66. Beat The Street—Delivered by Intelligent Health. Available online: https://www.beatthestreet.me/UserPortal/Default (accessed on 23 June 2019).
  67. Marconi, A.; Schiavo, G.; Zancanaro, M.; Valetto, G.; Pistore, M. Exploring the World through Small Green Steps. In Proceedings of the 2018 International Conference on Advanced Visual Interfaces—AVI ’18, Castiglione della Pescaia Grosseto, Italy, 29 May–1 June 2018; ACM Press: New York, NY, USA, 2018; pp. 1–9. [Google Scholar]
  68. Coombes, E.; Jones, A. Gamification of Active Travel to School: A Pilot Evaluation of the Beat the Street Physical Activity Intervention. Health Place 2016, 39, 62–69. [Google Scholar] [CrossRef] [PubMed] [Green Version]
  69. dell’Olio, L.; Ibeas, A.; Cecín, P. Modelling User Perception of Bus Transit Quality. Transp. Policy 2010, 17, 388–397. [Google Scholar] [CrossRef]
  70. Rojo, M.; Gonzalo-Orden, H.; dell’Olio, L.; Ibeas, T. Relationship between Service Quality and Demand for Inter-Urban Buses. Transp. Res. Part A Policy Pract. 2012, 46, 1716–1729. [Google Scholar] [CrossRef]
  71. Mora Márquez, M.; Camacho Torralbo, J.; Torralbo, J.C. Classcraft: English and Role Play in the Primary School Classroom. Apertura 2019, 11, 56–73. [Google Scholar] [CrossRef] [Green Version]
  72. Grande-de-Prado, M.; Baelo, R.; García-Martín, S.; Abella-García, V. Mapping Role-Playing Games in Ibero-America: An Educational Review. Sustainability 2020, 12, 6298. [Google Scholar] [CrossRef]
  73. Sanchez, E.; Young, S.; Jouneau-Sion, C. Classcraft: From Gamification to Ludicization of Classroom Management. Educ. Inf. Technol. 2017, 22, 497–513. [Google Scholar] [CrossRef]
  74. Alghamdi, J.; Holland, C. Game-Play: Effects of Online Gamified and Game-Based Learning on Dispositions, Abilities and Behaviours of Primary Learners; Springer: Cham, Switzerland, 2017; pp. 55–63. [Google Scholar]
  75. Sailer, M.; Hense, J.U.; Mayr, S.K.; Mandl, H. How Gamification Motivates: An Experimental Study of the Effects of Specific Game Design Elements on Psychological Need Satisfaction. Comput. Hum. Behav. 2017, 69, 371–380. [Google Scholar] [CrossRef]
  76. Giffinger, R.; Haindlmaier, G.; Kramar, H. The Role of Rankings in Growing City Competition. Urban Res. Pract. 2010, 3, 299–312. [Google Scholar] [CrossRef]
  77. Çakıroğlu, Ü.; Başıbüyük, B.; Güler, M.; Atabay, M.; Yılmaz Memiş, B. Gamifying an ICT Course: Influences on Engagement and Academic Performance. Comput. Hum. Behav. 2017, 69, 98–107. [Google Scholar] [CrossRef]
  78. Glover, I. Play as you learn: Gamification as a technique for motivating learners. In Proceedings of the World Conference on Educational Multimedia, Hypermedia and Telecommunications 2013, Victoria, BC, Canada, 24–28 June 2013; Association for the Advancement of Computing in Education (AACE): Chesapeake, VA, USA, 2013; pp. 1999–2008. [Google Scholar]
  79. Bakker, M.; van den Heuvel-Panhuizen, M.; Robitzsch, A. Effects of Playing Mathematics Computer Games on Primary School Students’ Multiplicative Reasoning Ability. Contemp. Educ. Psychol. 2015, 40, 55–71. [Google Scholar] [CrossRef]
  80. Dourda, K.T.E.P. Content and Language Integrated Learning through an Online Game in Primary School: A Case Study. Electron. J. e-Learn. 2014, 12, 243–258. [Google Scholar]
  81. Hwang, G.-J.; Wu, P.-H.; Chen, C.-C. An Online Game Approach for Improving Students’ Learning Performance in Web-Based Problem-Solving Activities. Comput. Educ. 2012, 59, 1246–1256. [Google Scholar] [CrossRef]
  82. Sung, H.-Y.; Hwang, G.-J. A Collaborative Game-Based Learning Approach to Improving Students’ Learning Performance in Science Courses. Comput. Educ. 2013, 63, 43–51. [Google Scholar] [CrossRef]
Figure 1. Methodological schematic.
Sustainability 13 09939 g001
Figure 2. What do you think bicycle lanes are for?
Sustainability 13 09939 g002
Figure 3. What are pedestrian zones for?
Sustainability 13 09939 g003
Figure 4. What do you think about mass transit?
Sustainability 13 09939 g004
Figure 5. What do you think about car sharing?
Sustainability 13 09939 g005
Figure 6. What is a sustainable city?
Sustainability 13 09939 g006
Figure 7. What does “sustainable transport” mean?
Sustainability 13 09939 g007
Figure 8. What is bike sharing?
Sustainability 13 09939 g008
Figure 9. Variation in scores between the two questionnaires.
Sustainability 13 09939 g009
Table 1. Summary of the points scored from the questionnaires before and after the gamified activity.
% PupilsTotal Points% Points
Pupils who improved5066.6722580.36
Pupils who stayed the same34.000
Students that got worse2229.33−5519.64
Table 2. Summary of the regression models.
MR1MR2MR3MR4MR5MR6MR7MR8MR9
NIV_JU2.275
t-stat11.869
P_JU 0.003
t-stat 10.765
N_ACT 0.849
t-stat 9.082
N_CON 0.655
t-stat 11.607
ACC_SEM 6.179 3.355
t-stat 17.363 9.891
HOR_SEM 12.194 6.219
t-stat 16.109 8.172
SAT_GLOB 10.0086.2195.934
t-stat 18.71310.23710.954
R^2 adj.0.6560.6100.5270.6450.8030.7780.8260.9090.925
Observ.757575757575757575
Publisher’s Note: MDPI stays neutral with regard to jurisdictional claims in published maps and institutional affiliations.

