Article

Bio-Mitigation of Carbon Dioxide Using Desmodesmus sp. in the Custom-Designed Pilot-Scale Loop Photobioreactor

1
Department of Chemical Engineering, Birla Institute of Technology and Science (BITS), Pilani 333031, Rajasthan, India
2
Department of Biological Sciences, Birla Institute of Technology and Science (BITS), Pilani 333031, Rajasthan, India
*
Author to whom correspondence should be addressed.
Sustainability 2021, 13(17), 9882; https://doi.org/10.3390/su13179882
Submission received: 9 June 2021 / Revised: 27 August 2021 / Accepted: 27 August 2021 / Published: 2 September 2021
(This article belongs to the Special Issue Recent Advances in Biowaste Treatment—towards a Circular Bioeconomy)

Abstract

:
Today’s society is faced with many upfront challenges such as the energy crisis, water pollution, air pollution, and global warming. The greenhouse gases (GHGs) responsible for global warming include carbon dioxide (CO2), methane (CH4), nitrous oxide (NOx), water vapor (H2O), and fluorinated gases. A fraction of the increased emissions of CO2 in the atmosphere is due to agricultural and municipal solid waste (MSW) management systems. There is a need for a sustainable solution which can degrade the pollutants and provide a technology-based solution. Hence, the present work deals with the custom design of a loop photobioreactor with 34 L of total volume used to handle different inlet CO2 concentrations (0.03%, 5%, and 10% (v/v)). The obtained values of biomass productivity and CO2 fixation rate include 0.185 ± 0.004 g L−1 d−1 and 0.333 ± 0.004 g L−1 d−1, respectively, at 10% (v/v) CO2 concentration and 0.084 ± 0.003 g L−1 d−1 and 0.155 ± 0.003 g L−1 d−1, respectively, at 5% (v/v) CO2 concentration. The biochemical compositions, such as carbohydrate, proteins, and lipid content, were estimated in the algal biomass produced from CO2 mitigation studies. The maximum carbohydrate, proteins, and lipid content were obtained as 20.7 ± 2.4%, 32.2 ± 2.5%, and 42 ± 1.0%, respectively, at 10% (v/v) CO2 concentration. Chlorophyll (Chl) a and b were determined in algal biomass as an algal physiological response. The results obtained in the present study are compared with the previous studies reported in the literature, which indicated the feasibility of the scale-up of the process for the source reduction of CO2 generated from waste management systems without significant change in productivity. The present work emphasizes the cross-disciplinary approach for the development of bio-mitigation of CO2 in the loop photobioreactor.

1. Introduction

Global warming caused by rising carbon dioxide (CO2) emissions is currently a worldwide concern. Since industrialization, global greenhouse gas (GHG) emissions have increased due to human activities [1]. The primary source of CO2 emissions includes anthropogenic waste, fossil fuel combustion, transportation, municipal waste, and agriculture waste [2,3]. Most GHG emissions generated from agricultural waste occur through the various waste management stages and agricultural inputs, mainly from water, fertilizers, pesticides from the soil, residue management, and irrigation [4]. Another sector, municipal solid waste management, significantly contributes to GHG emissions, mainly CO2, methane (CH4), and nitrous oxide (N2O). From collection to treatment and disposal, the waste management process must be optimized to reduce greenhouse gas emissions [5]. One of the previous reports suggested that the anthropogenic emission of CO2 from municipal waste and the agriculture sector is responsible for global CO2 emissions up to 3.2% and 18.4%, respectively [6]. According to one of the recent reports, GHG emissions from the agricultural sector, including livestock such as cows, agricultural soils, and rice production, accounted for 10% of the total GHG emissions [7].
Thus, GHG emissions from municipal solid waste and agriculture waste treatment methods have raised concerns about climate change [8,9]. CO2 is one of the most significant GHG emissions. The estimated emission of CO2 in 2014 was 6870 MMT (million metric tons), which contributes to around 81% of the total GHG emissions in the world [10]. Currently, CO2 concentration is above 400 ppm (parts per million) according to the data obtained from the NOAA Earth System Research Laboratory, Global Monitoring Division [11]. The projected concentration of CO2 will rise to the value of 600 ppm, resulting in the rise of sea level from 0.4 to 1 m. It can also lead to ocean acidification in the twenty-first century [12,13]. The Intergovernmental Panel on Climate Change (IPCC) stated that if the appropriate action is not taken to prevent the continual increase of GHG emissions, the earth’s temperature will increase by 1.4–5.8 °C during the 21st century [14,15]. Hence, carbon capture sequestration (CCS) and carbon capture utilization (CCU) strategies are utilized to cut down the CO2 emissions from sources [16,17]. The present research is emphasized in the domain of CCU [18].
The physical and chemical methods to mitigate CO2 emissions include absorption, cryogenic separation, ionic liquids, and CO2 storage [19,20]. However, these approaches entail higher energy consumption, construction, and operating costs [21,22]. In recent times, biological methods of CO2 mitigation gained the attention of researchers due to the production of biomass energy during CO2 fixation by photosynthetic processes [23,24]. Photosynthetic microorganisms such as microalgae have an efficiency of 10–50 times higher than terrestrial plants, with a CO2 fixation rate between 0.73 and 2.22 g L−1 day−1 [25,26]. The microalgae-based mitigation process has several advantages, such as a higher growth rate than terrestrial plants [27] and completes the recycling of CO2. CO2 is converted into biomass via photosynthesis activity by utilizing nitrogen and phosphorous as a nutrient source and solar energy as an energy source, which can be further transformed into fuels using existing technologies. Later, fuels can be utilized to produce power and result in CO2 formation [28,29].
Conventionally, algae can be cultivated in an open culture system (raceway ponds) or a closed system (photobioreactors). A study carried out on 1 L glass made in a closed photobioreactor for the bio-mitigation of CO2 by Scendesmus obliquious reported the CO2 consumption rate values as 390.2 mg L−1d−1 [30]. Another study discussed the CO2 fixation by Scenedesmus sp. in a closed photobioreactor having dimensions of 33 cm length and 4.5 cm inner diameter [31]. The study demonstrated an integrated system for CO2 fixation from flue gas, wastewater remediation, and biomass production. Similarly, few studies have reported the CO2 mitigation study on raceway pond (open pond) systems. Raceway ponds are utilized for CO2 mitigation for the large-scale cultivation of algae species such as Chlorella, Dunaliella, and S. platensis, [30,32]. The raceway ponds are the best examples of open pond systems due to better nutrient mixing and biomass sedimentation. The disadvantages of raceway ponds are that, compared to the closed photobioreactor, raceway ponds show lower productivity because of the carbon limitation [32].
Closed photobioreactors mostly give higher biomass productivities and also prevent outside contamination [33]. Given the benefits of closed systems over open ponds, various photobioreactors (from laboratory to industrial scale) have been developed. Even though many photobioreactors have been studied, only a small number of these reactors can efficiently use solar energy for mass algal production. The majority of outdoor photobioreactors, such as flat-plate, horizontal, and inclined tubular photobioreactors, have exposed lightning surfaces. Bubble-column, airlift, and stirred-tank photobioreactors offer high scalability, but their application in outdoor cultures is limited due to their low illumination surface areas [33,34]. While many photobioreactors appear simple to run at the laboratory scale, only a few photobioreactors have been successfully scaled up at the pilot scale. The difficulties in maintaining optimal light, temperature, mixing, and mass transfer in photobioreactors make these scale-up techniques extremely difficult. The absence of effective photobioreactors is one of the primary blockades to mass algae production.
Overcoming these limitations, loop bioreactors are efficient reactors that provide uniform and good mixing without mechanical agitation and ease of operation. These are mainly constructed of transparent materials such as glass, plexiglass, polyvinylchloride (PVC), acrylic PVC, or polyethylene [35,36]. Loop reactors are cylindrical vessels that perform the mixing of multiphase fluids without the impeller action. The advantages of the loop reactor are better mixing without impellers and an adequate illumination surface, which allow these reactors to overcome the limitations of flat-plate, horizontal, and inclined tubular photobioreactors. Another significant advantage is that the cost of impellers is not incurred in these loop reactors, leading to energy savings [37,38]. The literature studies indicated that the application of loop bioreactors for CO2 mitigation using microalgae is limited. Most of the studies are confined to bench-scale reactors. Hence, there is an enormous scope to utilize the pilot-scale closed-loop photobioreactor for CO2 fixation using microalgae.
The present study focuses on the bio-mitigation of CO2 in the atmosphere by Desmodesmus species in the closed-loop photobioreactor (custom design) of a scale of around 34 L, which is almost a pilot-scale reactor. Bio-mitigation experiments using Desmodesmus species were carried out at three different CO2 concentrations, including 0.03% (atmospheric CO2), 5%, and 10% (v/v) in the loop photobioreactor. The work includes estimating growth kinetic parameters such as cell concentration, specific growth rate, biomass productivity, and CO2 fixation rate. The biochemical properties, such as chlorophyll content, lipid content, carbohydrate content, protein, and cells, were determined for the obtained biomass. Thus, an optimized process was developed to effectively utilize CO2 generated from waste and in actual day-to-day conditions. This is an economical and alternative source of carbon for the simultaneous production of biomass feedstock rich in lipids and carbohydrates in a “waste to wealth” chain and waste management for sustainable future development.

2. Materials and Methods

2.1. Media Preparation, Microalgae Strain, Culture Conditions, and Inoculum Preparation

BG-11 Medium was used as cultivation media for the growth of algae, which contains 0.04 g L−1 dipotassium hydrogen phosphate (K2HPO4), 0.006 g L−1 of citric acid (C6H8O7), 0.006 g L−1 of ferric ammonium citrate (C6H5+4yFExNyO7), 0.001 g L−1 EDTA, 1.5 g L−1 of sodium nitrate (NaNO3), 0.075 g L−1 of magnesium sulfate (MgSO4.7H2O), 0.036 g L−1 of calcium chloride (CaCl2), 0.002 g L−1 of sodium carbonate (Na2CO3), and 1 mL L−1 of trace metal mix. Trace metal mix comprised boric acid, zinc sulfate, copper sulfate, sodium molybdate, cobalt nitrate, and manganese chloride. The solid media was used for plating and was prepared by adding 1.5 g L−1 (1.5%) agar to aqueous media. The conditioned media was autoclaved at 121 °C and 15 psi for 15 min and was used for further studies.
Microalgae strain Desmodesmus sp. MCC34 [KF731760.1] was used in the present work [39]. It was collected from the Environment and Microbiology lab of BITS Pilani, Pilani Campus, Rajasthan. The strain was isolated from the local water bodies of Pilani, Rajasthan, as reported by Nagappan and Verma [35].
The inoculum was grown at a constant temperature of 26 ± 1 °C in the laboratory and the light intensity of 67 μmol photon m−2 s−1 for ten days. The purity of the grown culture was checked using repeated streaking of the culture on BG-11 plates. The cultures with an optical density close to unity were used as inoculum for conducting the experiments in a custom-designed loop photobioreactor at larger volumes. The optical density of culture was measured at a wavelength of 650 nm (OD) at [OD650 nm] (Evolution 201, Thermo Scientific, is Waltham, MA USA) to determine the cell concentration using a UV-Vis spectrophotometer. The calibration curve was prepared between the dry weight of biomass versus optical density to measure the cell concentration.

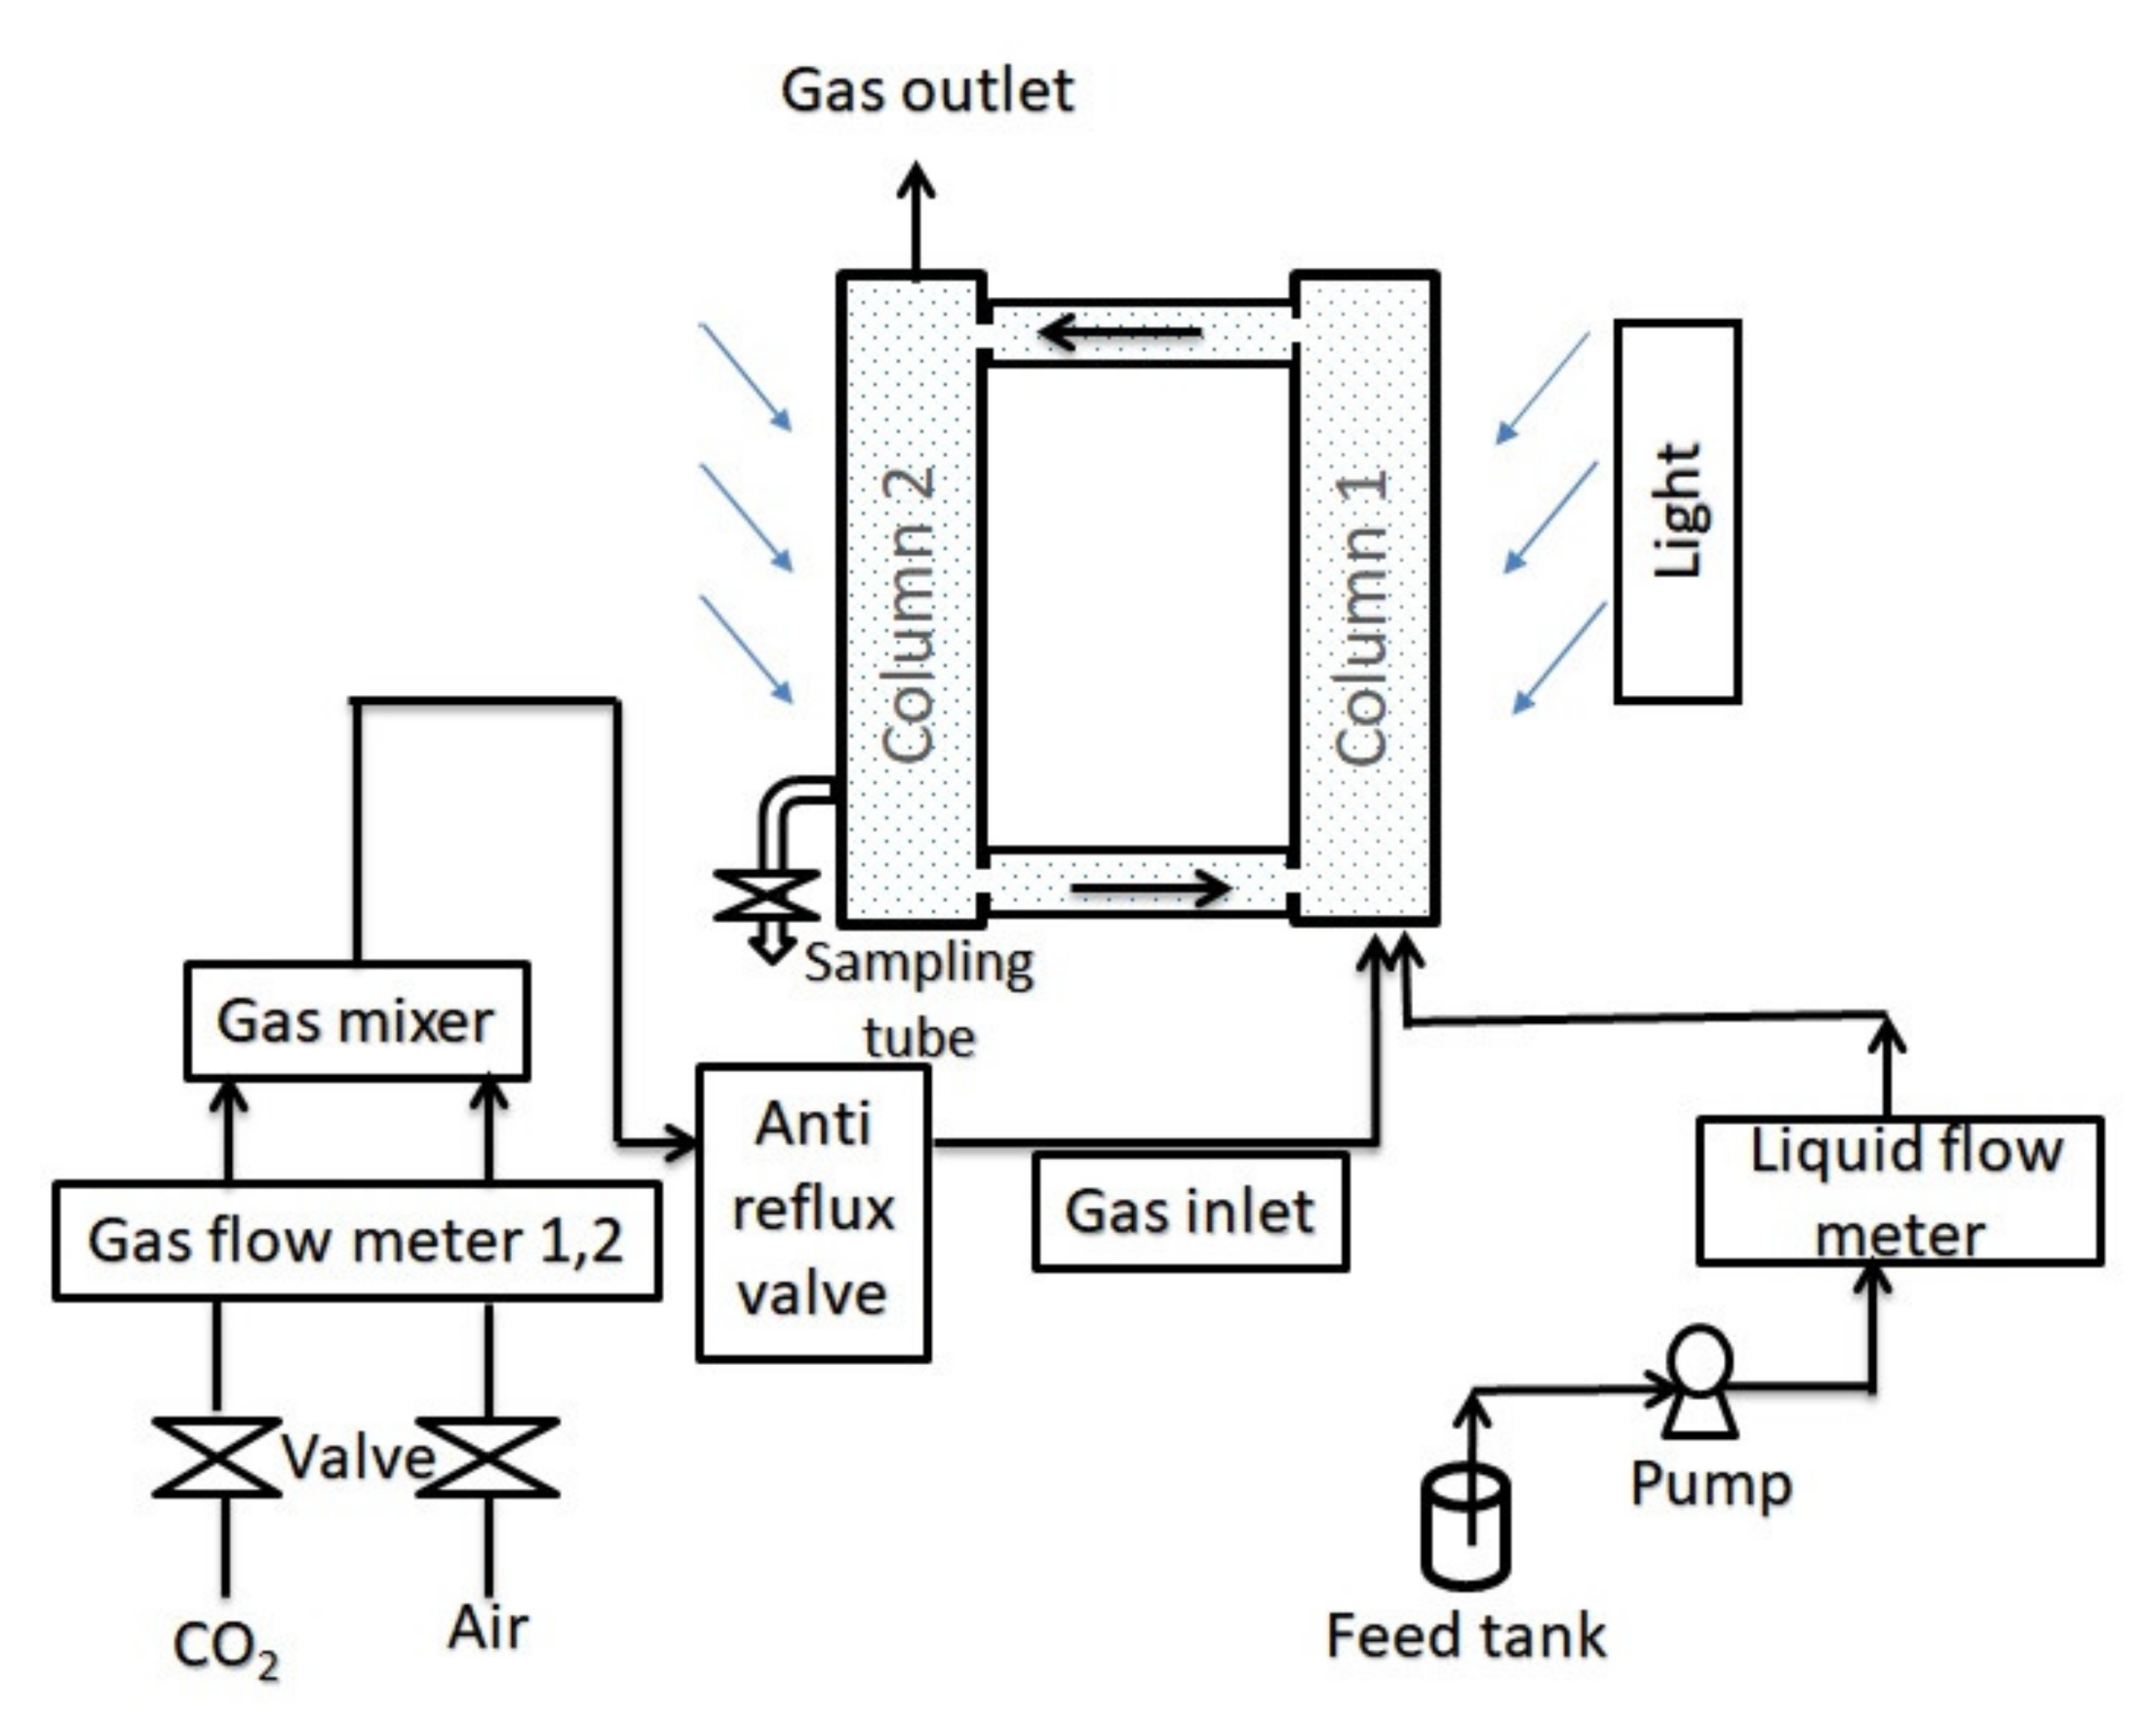
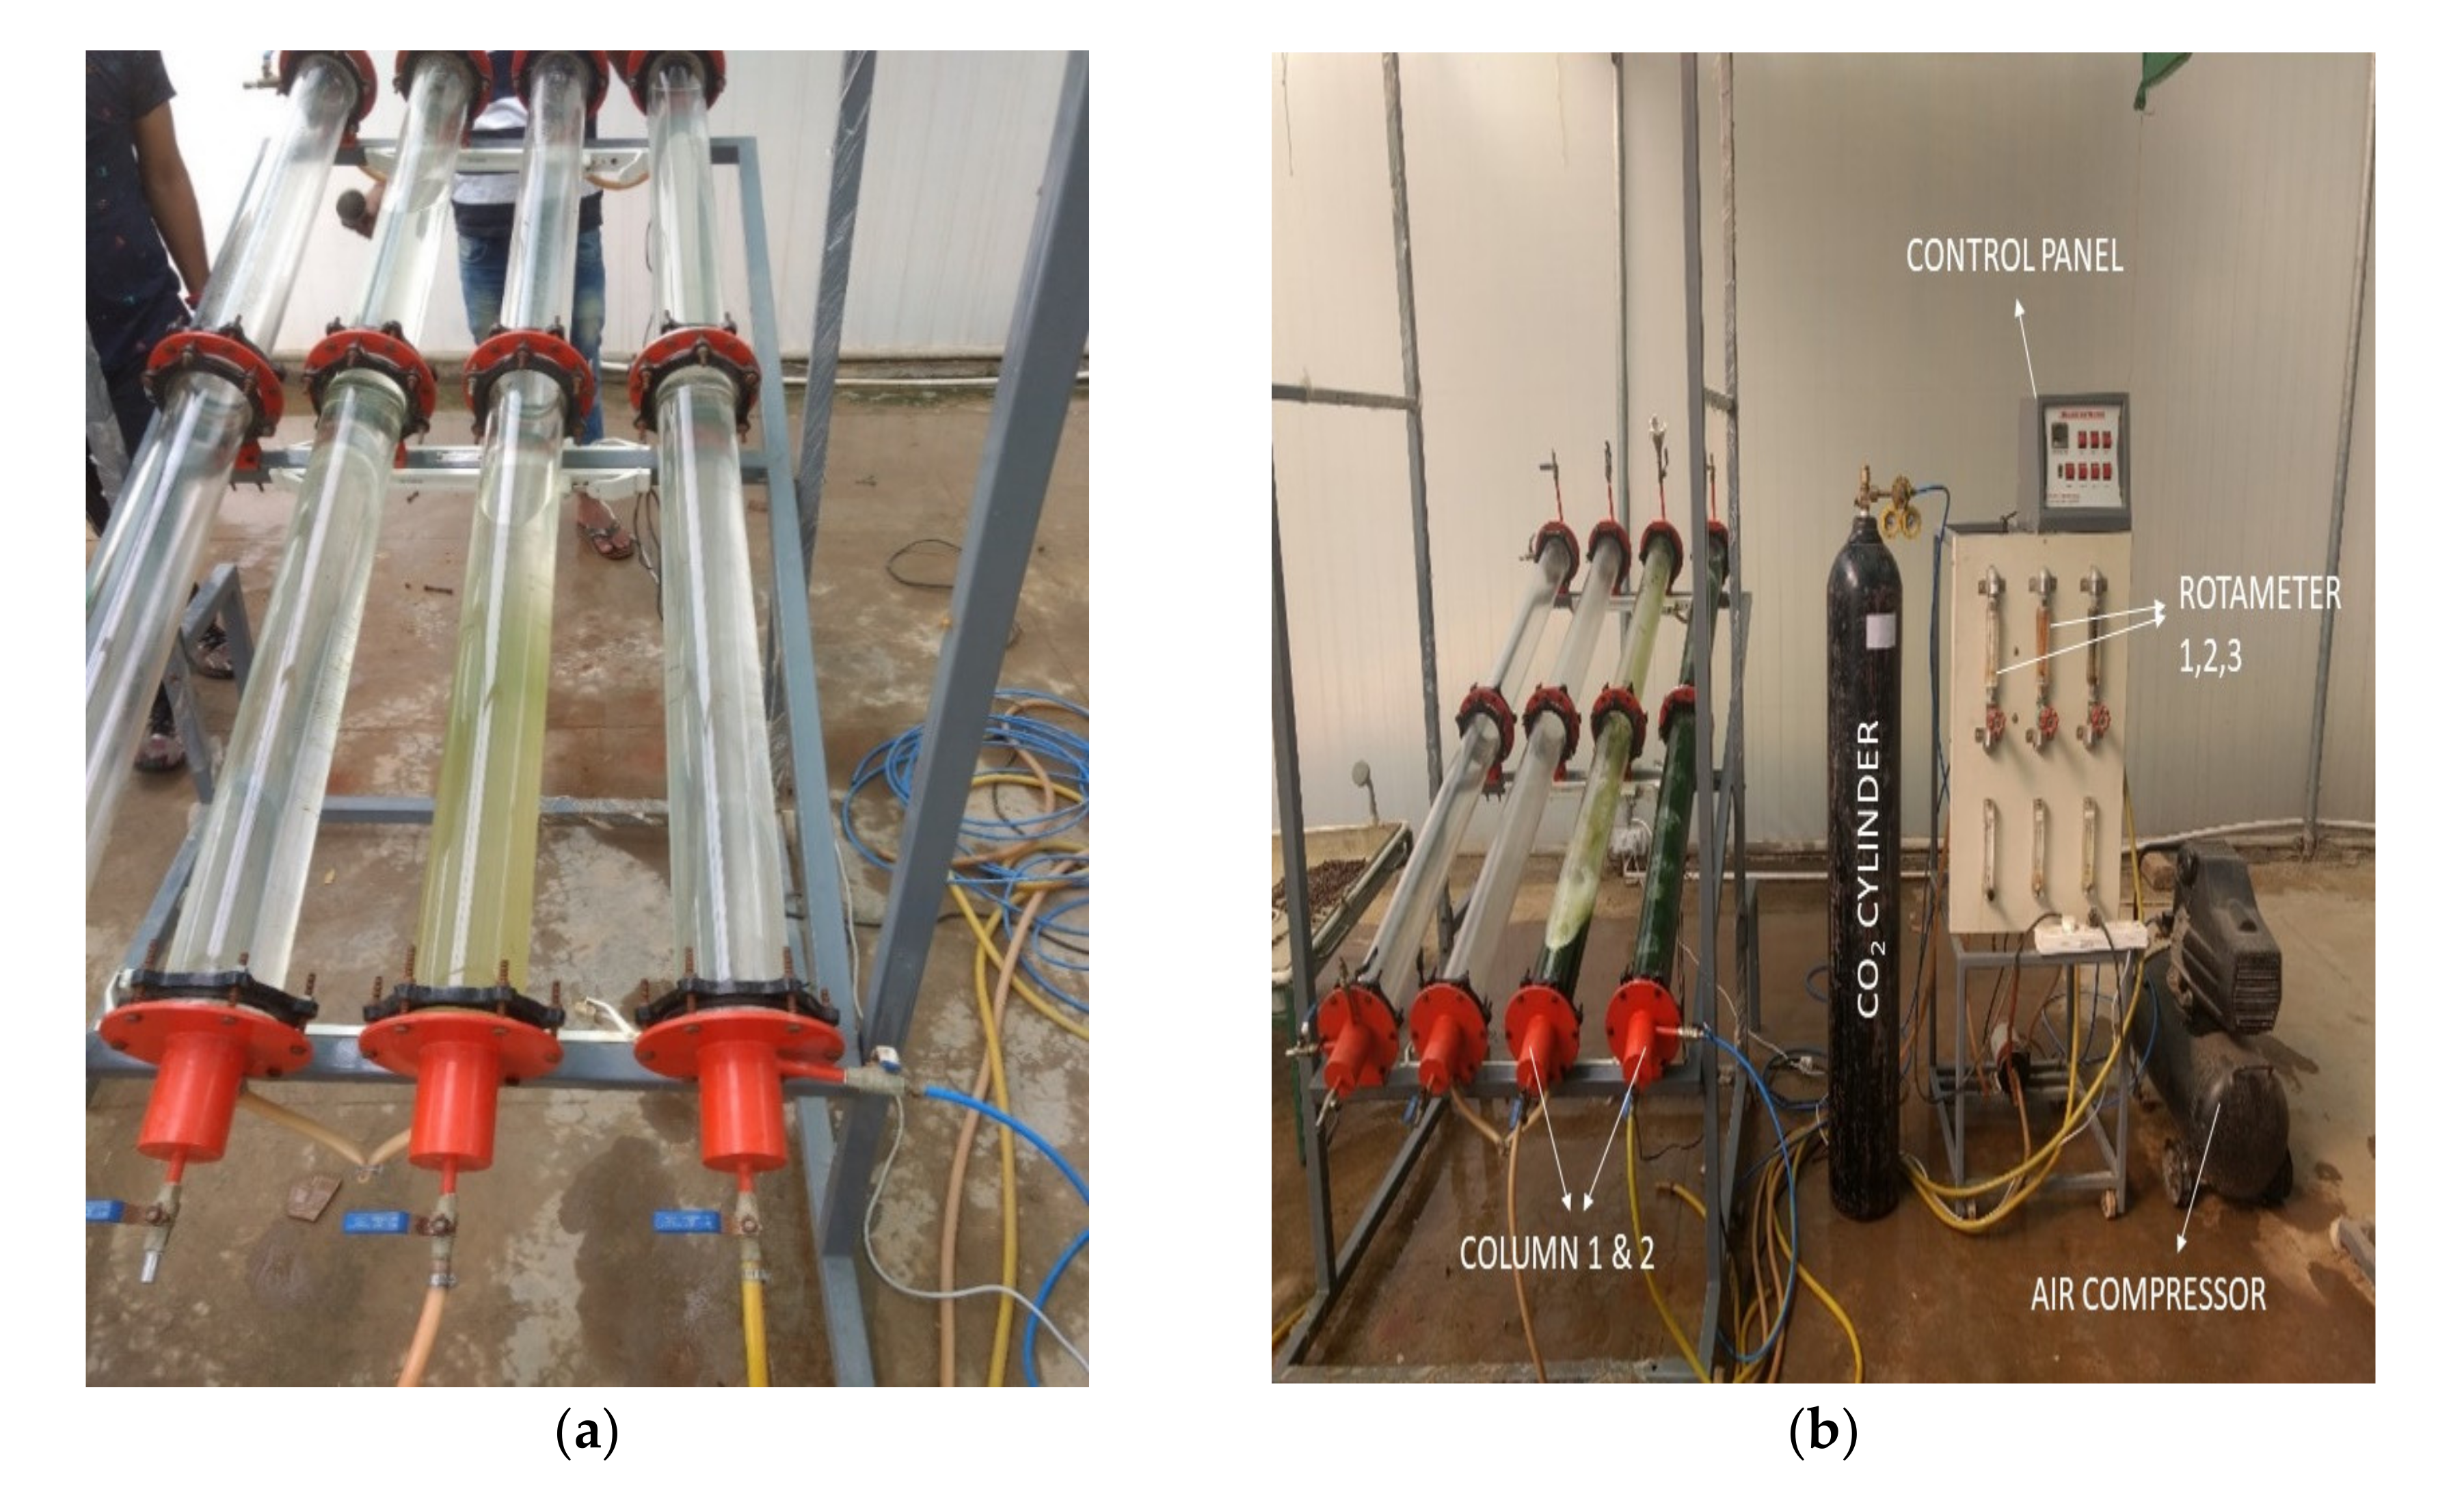
2.2. Experimental Setup

The schematic of loop photobioreactor with detailed custom design of experimental setup is given in Figure 1.
The loop photobioreactor was constructed with two units and dimensions of 2.03 m, including 0.105 m diameter and 0.12 m outer diameter. The loop photobioreactor with a total volume of 34 L and a working volume of 26 L was designed for the overall process, and a photograph of the actual setup is given in Figure 2. The sunlight was used as the energy source during the process. In this study, 1.25 L of enriched culture was used as inoculum volume, and it had an optical density (OD) of 0.82. The experiments were performed in the semicontinuous mode.

2.3. Experimental Procedure

A gas mixture comprising of 10% (v/v) CO2 (g) and 90% of compressed moisture-free air was utilized as a source of CO2 (g) in the photobioreactor. The gas mixture was supplied on a 12 h aeration cycle through the gas inlet port of the photobioreactor equipped with the sparger. The gas mixture was fed during the light period, and its supply was stopped during the dark period. The continuous study was performed in a loop photobioreactor for 12 days, and the temperature was maintained at ambient conditions of 30–35 °C. The initial pH was maintained between 7 and 9 for the optimal growth of Desmodesmus sp. that increased the solubility of CO2 in the aqueous phase. The flow rate of gas into the reactor was maintained at 32 vvm (4 L min−1).
Once the microalgae reached the stationary phase, culture was separated by filtering with muslin cloth and was rinsed with distilled water. The algal biomass was freeze-dried and preserved at −20 °C for carrying out further studies. The parameters such as pH, dry weight biomass, and CFU were measured after every 24 h duration. The optical density (OD650nm) was measured twice a day (after completion of the light cycle and a dark process). The control run was performed using ambient air (0.03% CO2) while keeping other conditions the same. The change in color of columns 1 and 2 in picture (b) concerning picture (a) shows Desmodesmus sp. after 12 days of the incubation period.

2.4. Measurement of Biomass Growth Rate

The dry weight biomass and optical density were measured to evaluate the biomass yield of Desmodesmus sp. Fifty milliliters of aliquot culture was collected, and dry weight biomass (g L−1) was measured using the standard filtration process [40,41]. The filtrate obtained was utilized for further studies. The contamination was checked by plating the supernatant and colony-forming unit (CFU) method. Aliquots were withdrawn from the loop photobioreactor every 24 h, and pH was measured using a digital pH meter (Eco Testr pH 2, Eutech Instruments).

2.5. Determination of Growth Kinetic Parameters

The biomass productivity (P) was calculated by the given Equation (1):
P = X t X 0 t t t 0
where Xt is the cell concentration (g L−1) at the end of the cultivation cycle (tt), and X0 is the initial cell concentration (g L−1) at t0 (day). The specific growth rate μmax (day−1) was calculated using Equation (2) [42,43].
μ m a x = ln N 2 ln N 1 t 2 t 1
where N1 and N2 are the concentrations of the cells at the beginning (t1) and the end (t2) of the exponential growth phase, respectively [43,44]. C1O0.48 H1.83N 0.11P0.01 was used as the microalgal biomass molecular formula stated in previous studies [45]. As per the reported studies, it is assumed that 1 g of produced algal biomass (C1O0.48 H1.83N 0.11P0.01) is equivalent to capture 1.88 g of CO2, and hence, the CO2 fixation rate (g L−1 d−1) was determined from Equation (3) [31,46].
Fixation   rate   of   CO 2 = 1.88 × P overall
where Poverall is the overall biomass productivity. CO2 utilization efficiency was obtained from Equation (4).
C O 2   u t i l i z a t i o n   e f f i c i e n c y = f i x a t a t i o n   r a t e   o f   C O 2 C O 2 i n × 100

2.6. Determination of Chlorophyll Content

Fifty milliliters of algal culture sample was collected in the falcon tube and was centrifuged for 10 min at 4000 rpm. The supernatant was discarded, and the pellet was stored at −20 °C until further use. During the extraction step, the pellet was re-suspended in 90% methanol. It was further assisted by sonication for cell lysis under dark conditions in the ice bath (to prevent the degradation of chlorophyll from light). The control parameters followed during the sonication were of 1 min timer and a 60% duty cycle. The thermal shock was given by the snap freezing method in liquid nitrogen, and the whole process was repeated for ten cycles to maximize the extraction yield. This step was followed by centrifugation at 4000 rpm for 10 min, and the pellet was dried and stored. One milligram of dried algal biomass was taken in the falcon tube, and a mixture of 90% methanol and 10% Millipore water was added to maintain the volume of 10 mL. The tube was kept in the water bath for 20 min, and then it was stored at 4 °C for the incubation period of 24 h. The absorbance of the obtained supernatant was measured at 652 and 665 nm in a spectrophotometer. Methanol was used as a blank solution in a UV-Vis spectrophotometer. The concentration of Chl a and Chl b was determined according to the following Equations (5) and (6) [46].
Chl   a   mgL 1 = 16.72 × absorbance 665 nm 9.16 × absorbance 652 nm
Chl   b   mgL 1 = 34.09 × absorbance 652 nm 15.28 × absorbance 665 nm

2.7. Biochemical Compositional Analysis

Biomass collected after every sampling point (as explained in Section 2.4) has been utilized for biochemical compositional analysis.

2.7.1. Analysis of Total Carbohydrate (CHO) Content

A 5 mL sample was taken and centrifuged at 5 °C for 10 min at 4000 rpm, and the obtained supernatant was discarded. The pellets were washed with deionized water and stored at −20 °C for further studies. Then, 0.5 mL of 2.5 M H2SO4 was added in the pellet to carry out primary hydrolysis (polysaccharides to monosaccharides) [47,48]. The samples were placed for incubation in a boiling water bath for two hours. The columns were cooled at room temperature, and hydrolysate was diluted with deionized water to make it to the volume of 5 mL. The particular step was followed by centrifugation at 4000 rpm, and the supernatant was collected. The phenol-sulfuric method was applied to determine the total content of carbohydrates in biomass [49]. The calibration plot was drawn at different glucose concentrations (0–0.1 mg mL−1). Two-milliliter aliquots of diluted supernatant along with standard solution were mixed with 1 mL of 5% aqueous phenol in a 15 mL falcon tube. Then, 5 mL of concentrated sulfuric acid was immediately added in all tubes and then vortexed for 10 s. All falcon tubes were kept at room temperature for 10 min, and then these were placed in the water bath at 30 °C to develop a yellow-golden color. The value of absorbance was measured at 490 nm in a UV-Vis spectrophotometer [50].

2.7.2. Analysis of Total Protein Content

The Folin–Lowry method was used for the total protein determination using white pellets obtained after pigment extraction [51]. The pellet was pretreated with 1% SDS/0.1 M NaOH in 500 μL. The re-suspended pellet mixed with reagent A (500 μL of 1:1:1:1 ratio of CTC (0.1% CuSO4·5H2O + 0.2% NaK tartrate +10% Na2CO3), 10% SDS, 0.8 M NaOH and dH2O) and the tubes were kept at room temperature for 10 min. After adding reagent B (250 μL of a solution of one volume of Folin–Ciocalteu reagent and five volumes of dH2O) to the samples, tubes were instantly vortexed and allowed to stand at room temperature for 30 min. The OD was measured at 750 nm for 0.5 mL of 1% SDS/0.1 M NaOH. The standard curve was prepared for the determination of the total amount of protein by dissolving different concentrations of bovine serum albumin (BSA) in 1% SDS/0.1 M NaOH (0–1.0 mg mL−1) as reported by Varshney et al. (2016) [52].

2.7.3. Analysis of Total Lipid Content

The total lipid content of the biomass was quantified gravimetrically using the Bligh and Dyer method with slight modifications [53]. The pellets were separated from the 50 mL culture after centrifugation at 4000 rpm for 10 min at 4 °C and were stored at −20 °C for further studies. The pellet was suspended in 2.4 mL deionized water followed by 3 mL chloroform and 6 mL methanol. It was followed by sonication by placing the mixture in the ultrasonic bath for 20 min. Further, 3 mL of each deionized water and chloroform were added to maintain the final ratio of 2:2:1.8. The final mixture was centrifuged for 10 min at 2000 rpm. The organic bottom layer of chloroform was carefully extracted after centrifugation and was transferred into a pre-weighted vial and preserved overnight for solvent evaporation in the fume hood. The vial was reweighted until dry to determine the overall lipid quantity, and these steps were carried out at room temperature as per the procedure reported by Varshney et al. (2018) [50].

3. Results and Discussion

The semicontinuous studies analyzed the growth performance of Desmodesmus sp. for 12 days, for the three different CO2 concentrations, 0.03%, 5%, and 10% (v/v), in a loop photobioreactor. The obtained results from these studies were analyzed and summarized in the following sections.

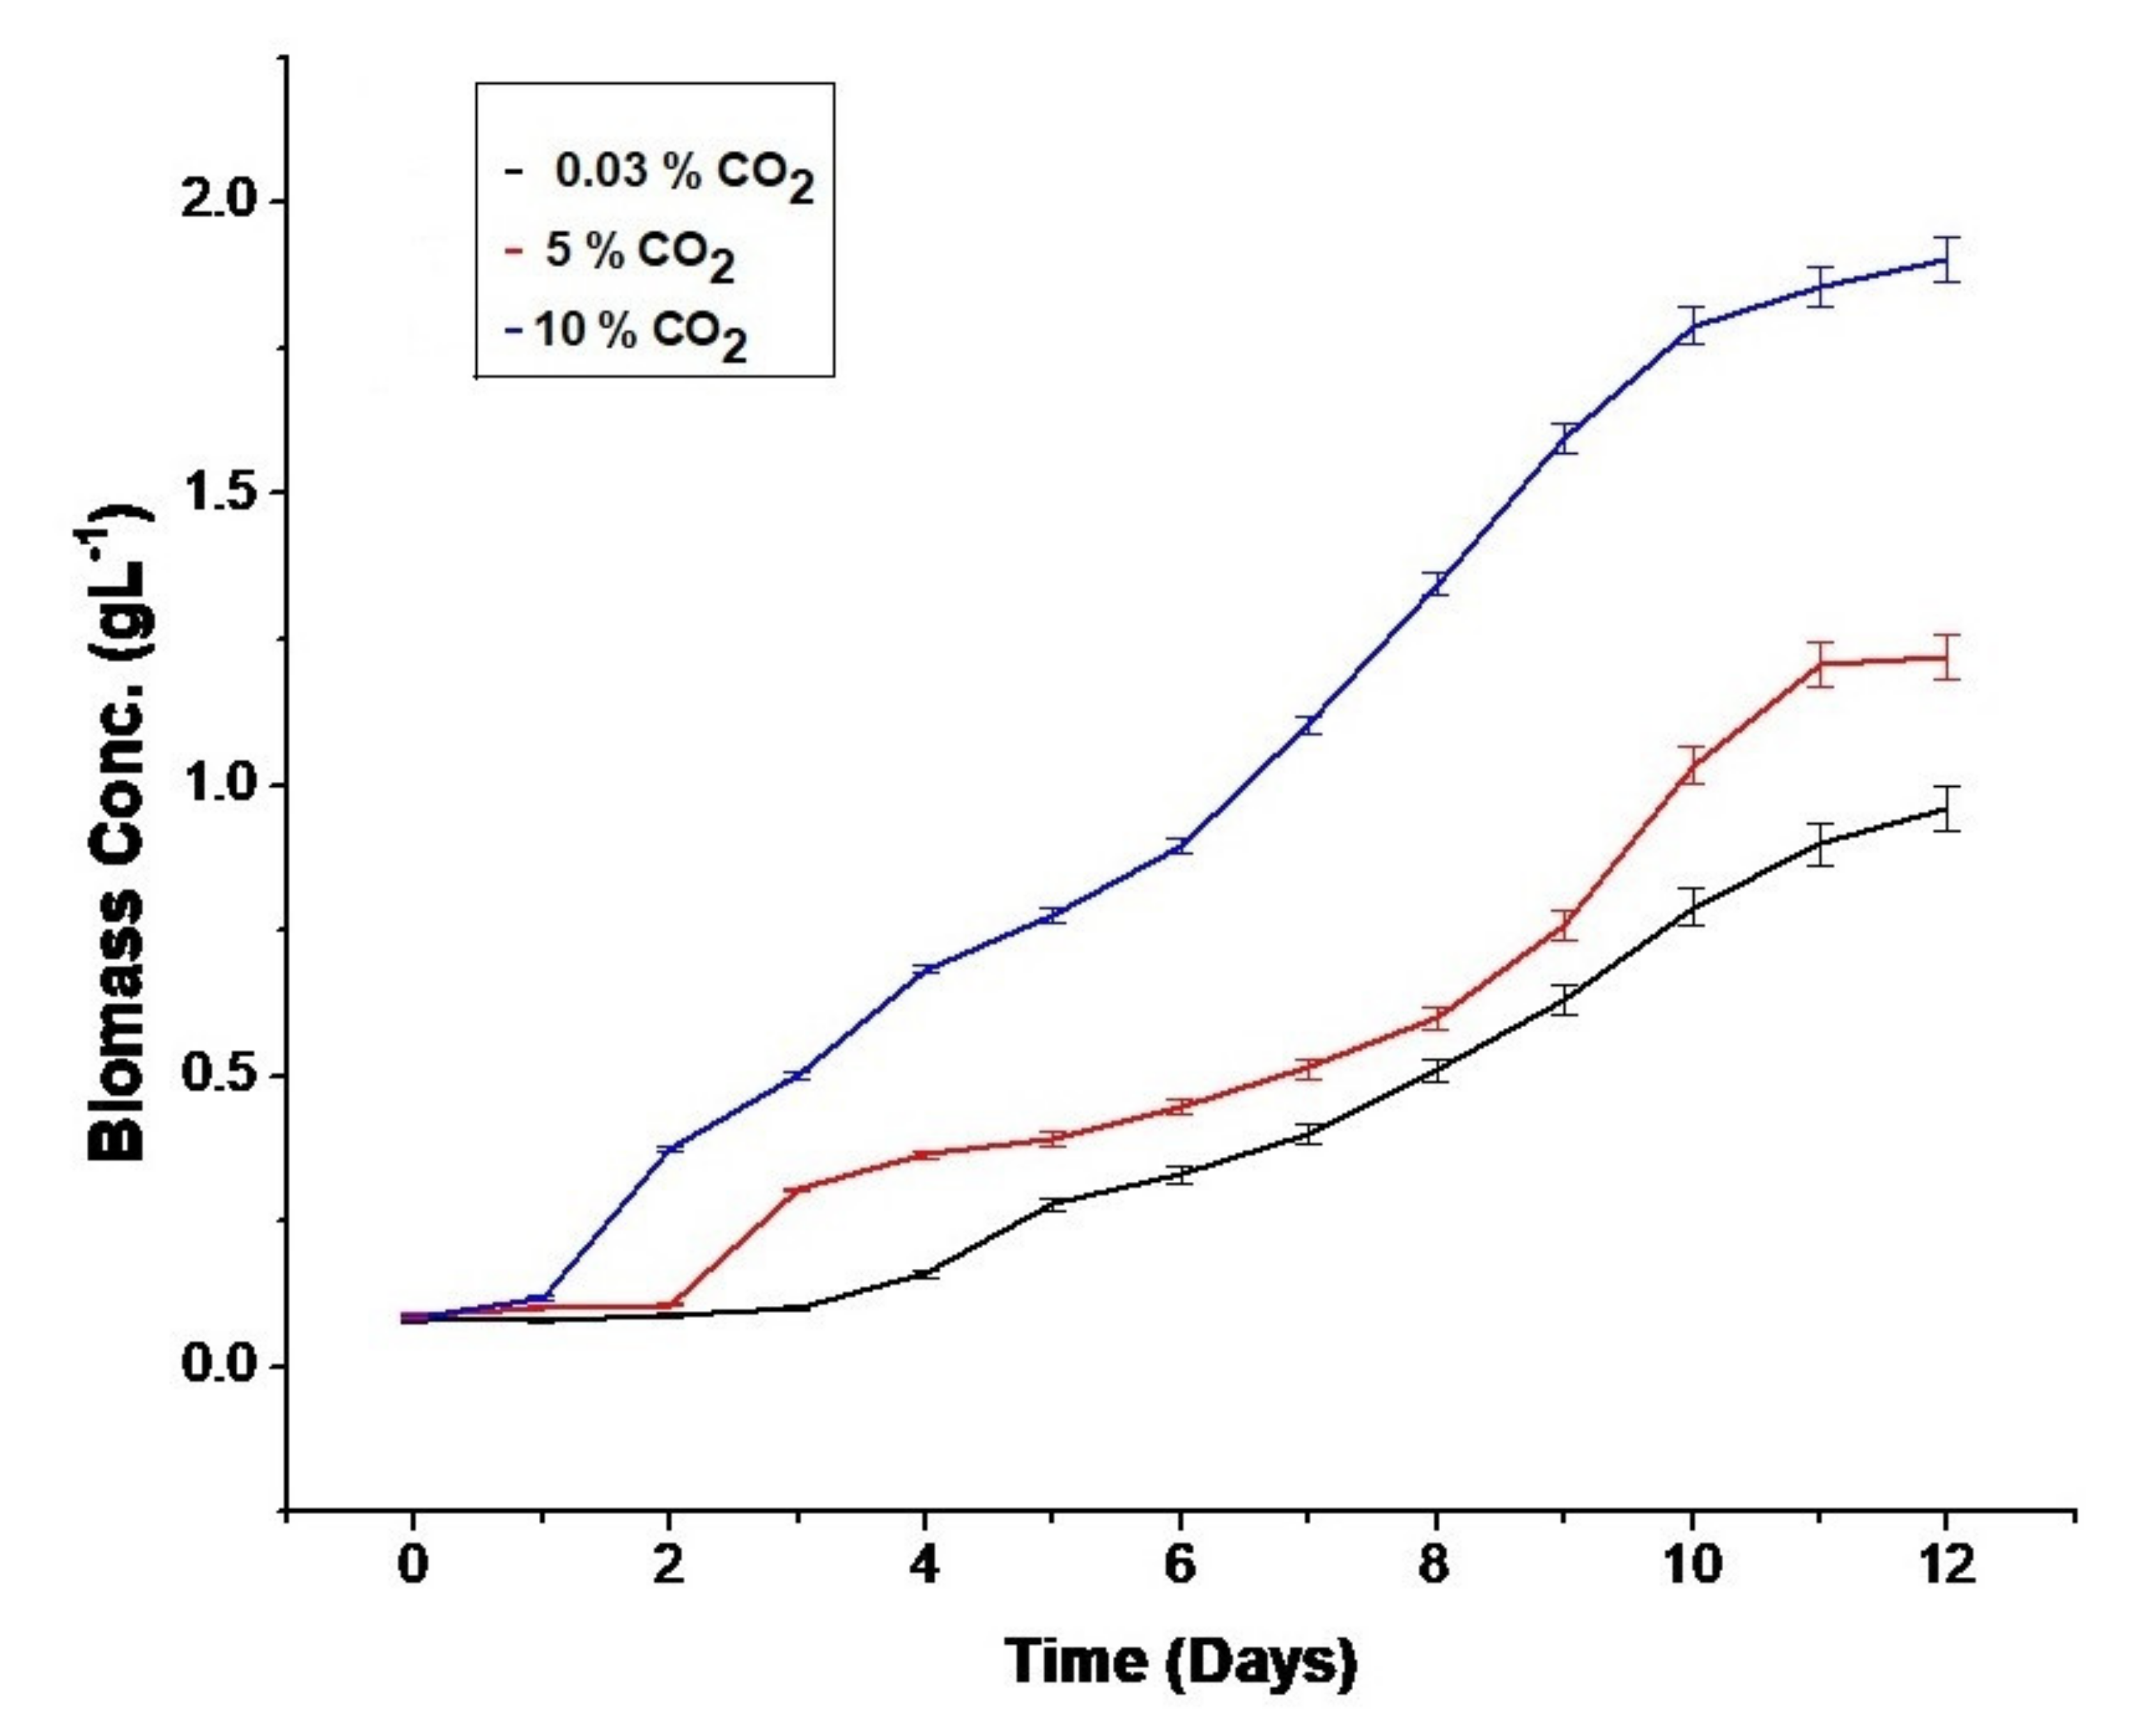
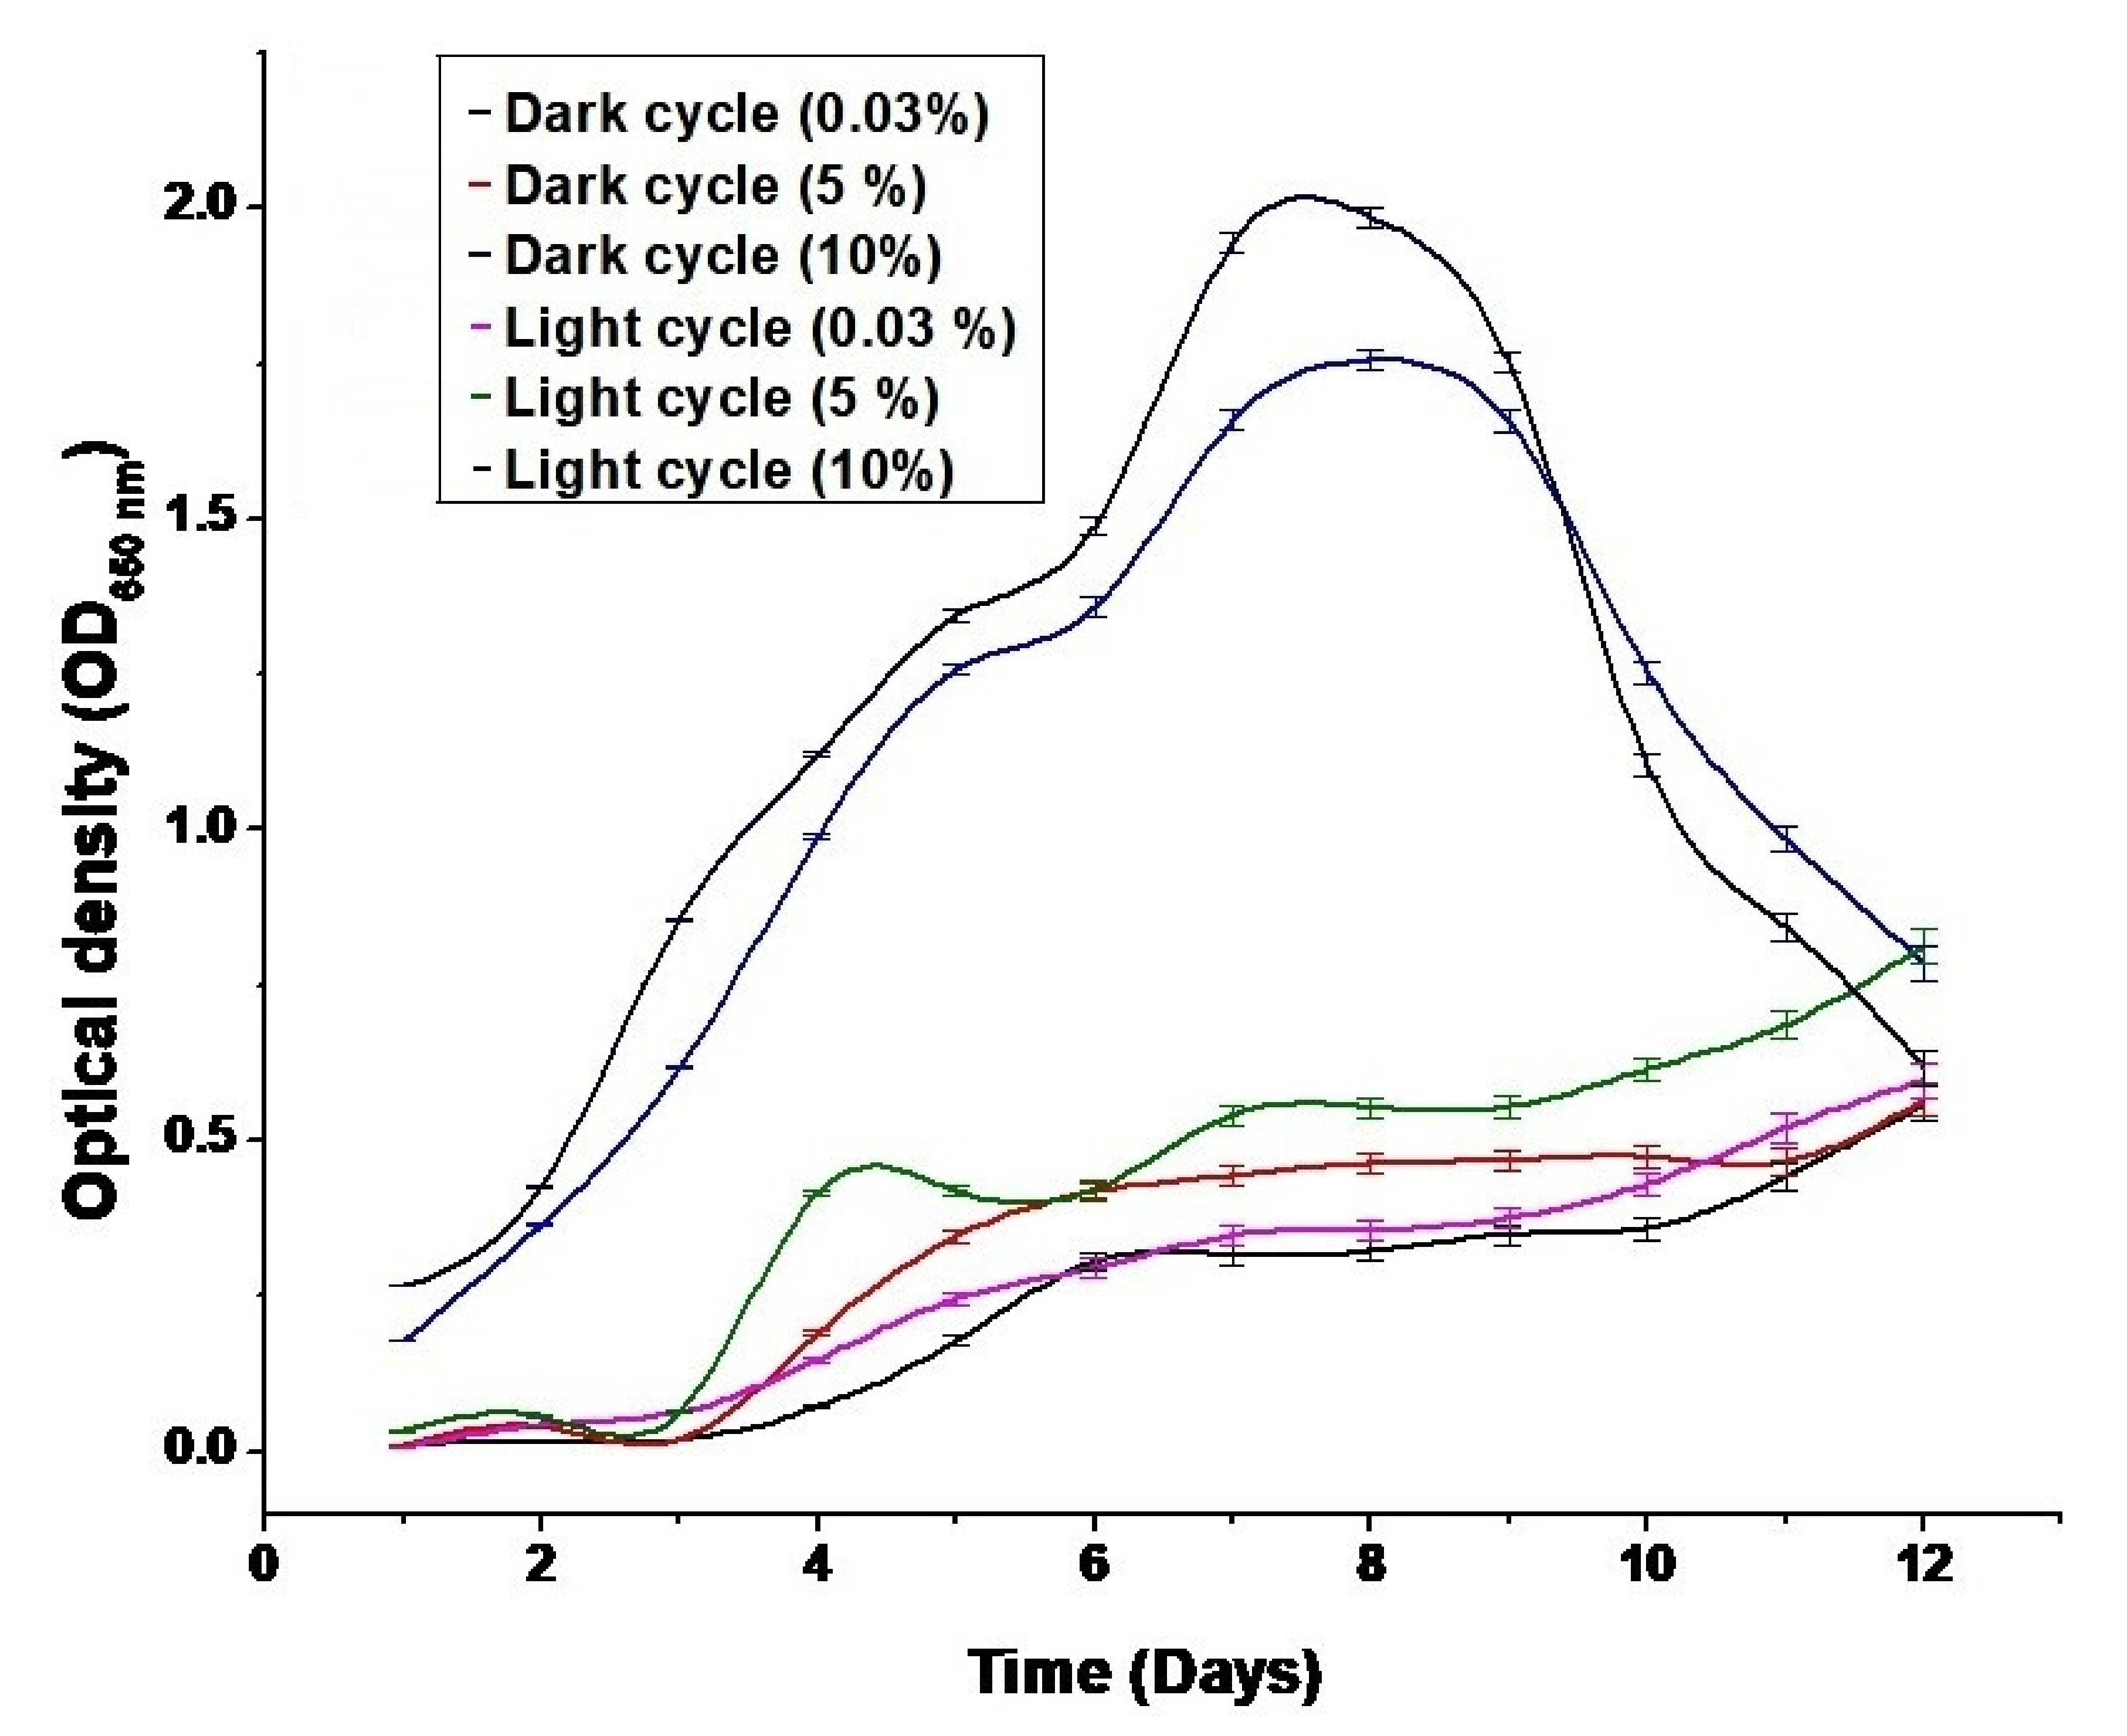
3.1. Effect of CO2 Concentration on Biomass Growth Rate and Optical Density Values

Desmodesmus sp. growth performance in the presence of different CO2 (0.03%, 5%, and 10% v/v) concentrations was examined in a loop photobioreactor. During all experiments, microalgae showed a short lag phase of 1 to 3 days, which indicated the suitability of gaseous CO2 mitigation by Desmodesmus sp. as a carbon source, as shown in Figure 3. The trend shows the increased growth in the exponential phase for ten days at different concentrations of CO2 due to the presence of the appropriate amount of nutrient for cell growth in the reactor.
After 12 days of incubation, culture supplemented with 10% (v/v) CO2 showed 1.903 ± 0.038 g L−1 of cell concentration on a dry cell weight (DCW) basis, which is higher as compared to the culture grown at 0.03% of CO2 v/v (0.96 ± 0.039 g L−1) and at 5% CO2 v/v (1.219 ± 0.040 g L−1). The cell concentration in cultures supplied with 5% CO2 and 10% CO2 was higher than the cultures with ambient air conditions, suggesting that CO2 as a carbon source facilitated microalgae growth [54,55]. A similar trend was reported for CO2 mitigation in earlier reported studies [56,57].
The results are also plotted to understand the light and dark cycle (L/D cycle) on biomass growth rate in optical density (OD650nm) at three different CO2 concentrations and are given in Figure 4. The values of optical density were measured twice a day [58].
The maximum OD values were obtained during the light cycle as 0.60 ± 0.017, 0.81 ± 0.016, and 1.99 ± 0.010 and during the dark cycle as 0.56 ± 0.016, 0.57 ± 0.017, and 1.76 ± 0.009 at 0.03% CO2, 5% CO2, and 10% CO2 concentrations, respectively. The increased absorbance values during the light cycle compared to the dark cycle confirmed that the photosynthesis process is enhanced during the day and microalgal growth is better during the light period. The increase in the biomass concentration values during the day cycle enhances the understanding that the increased biomass concentration is due to the increased cell growth, and hence is greatly dependent on the sunlight intensity [59].
It has been reported by the researchers that the photosynthetic efficiency of microalgae under intermittent illumination is known to be higher than under continuous illumination, provided that the parameters of the L/D cycle are tuned correctly [60,61]. The reasoning could be that photosynthesis is a cyclic process, where a slower thermochemical process follows almost instantaneous photochemical reactions.

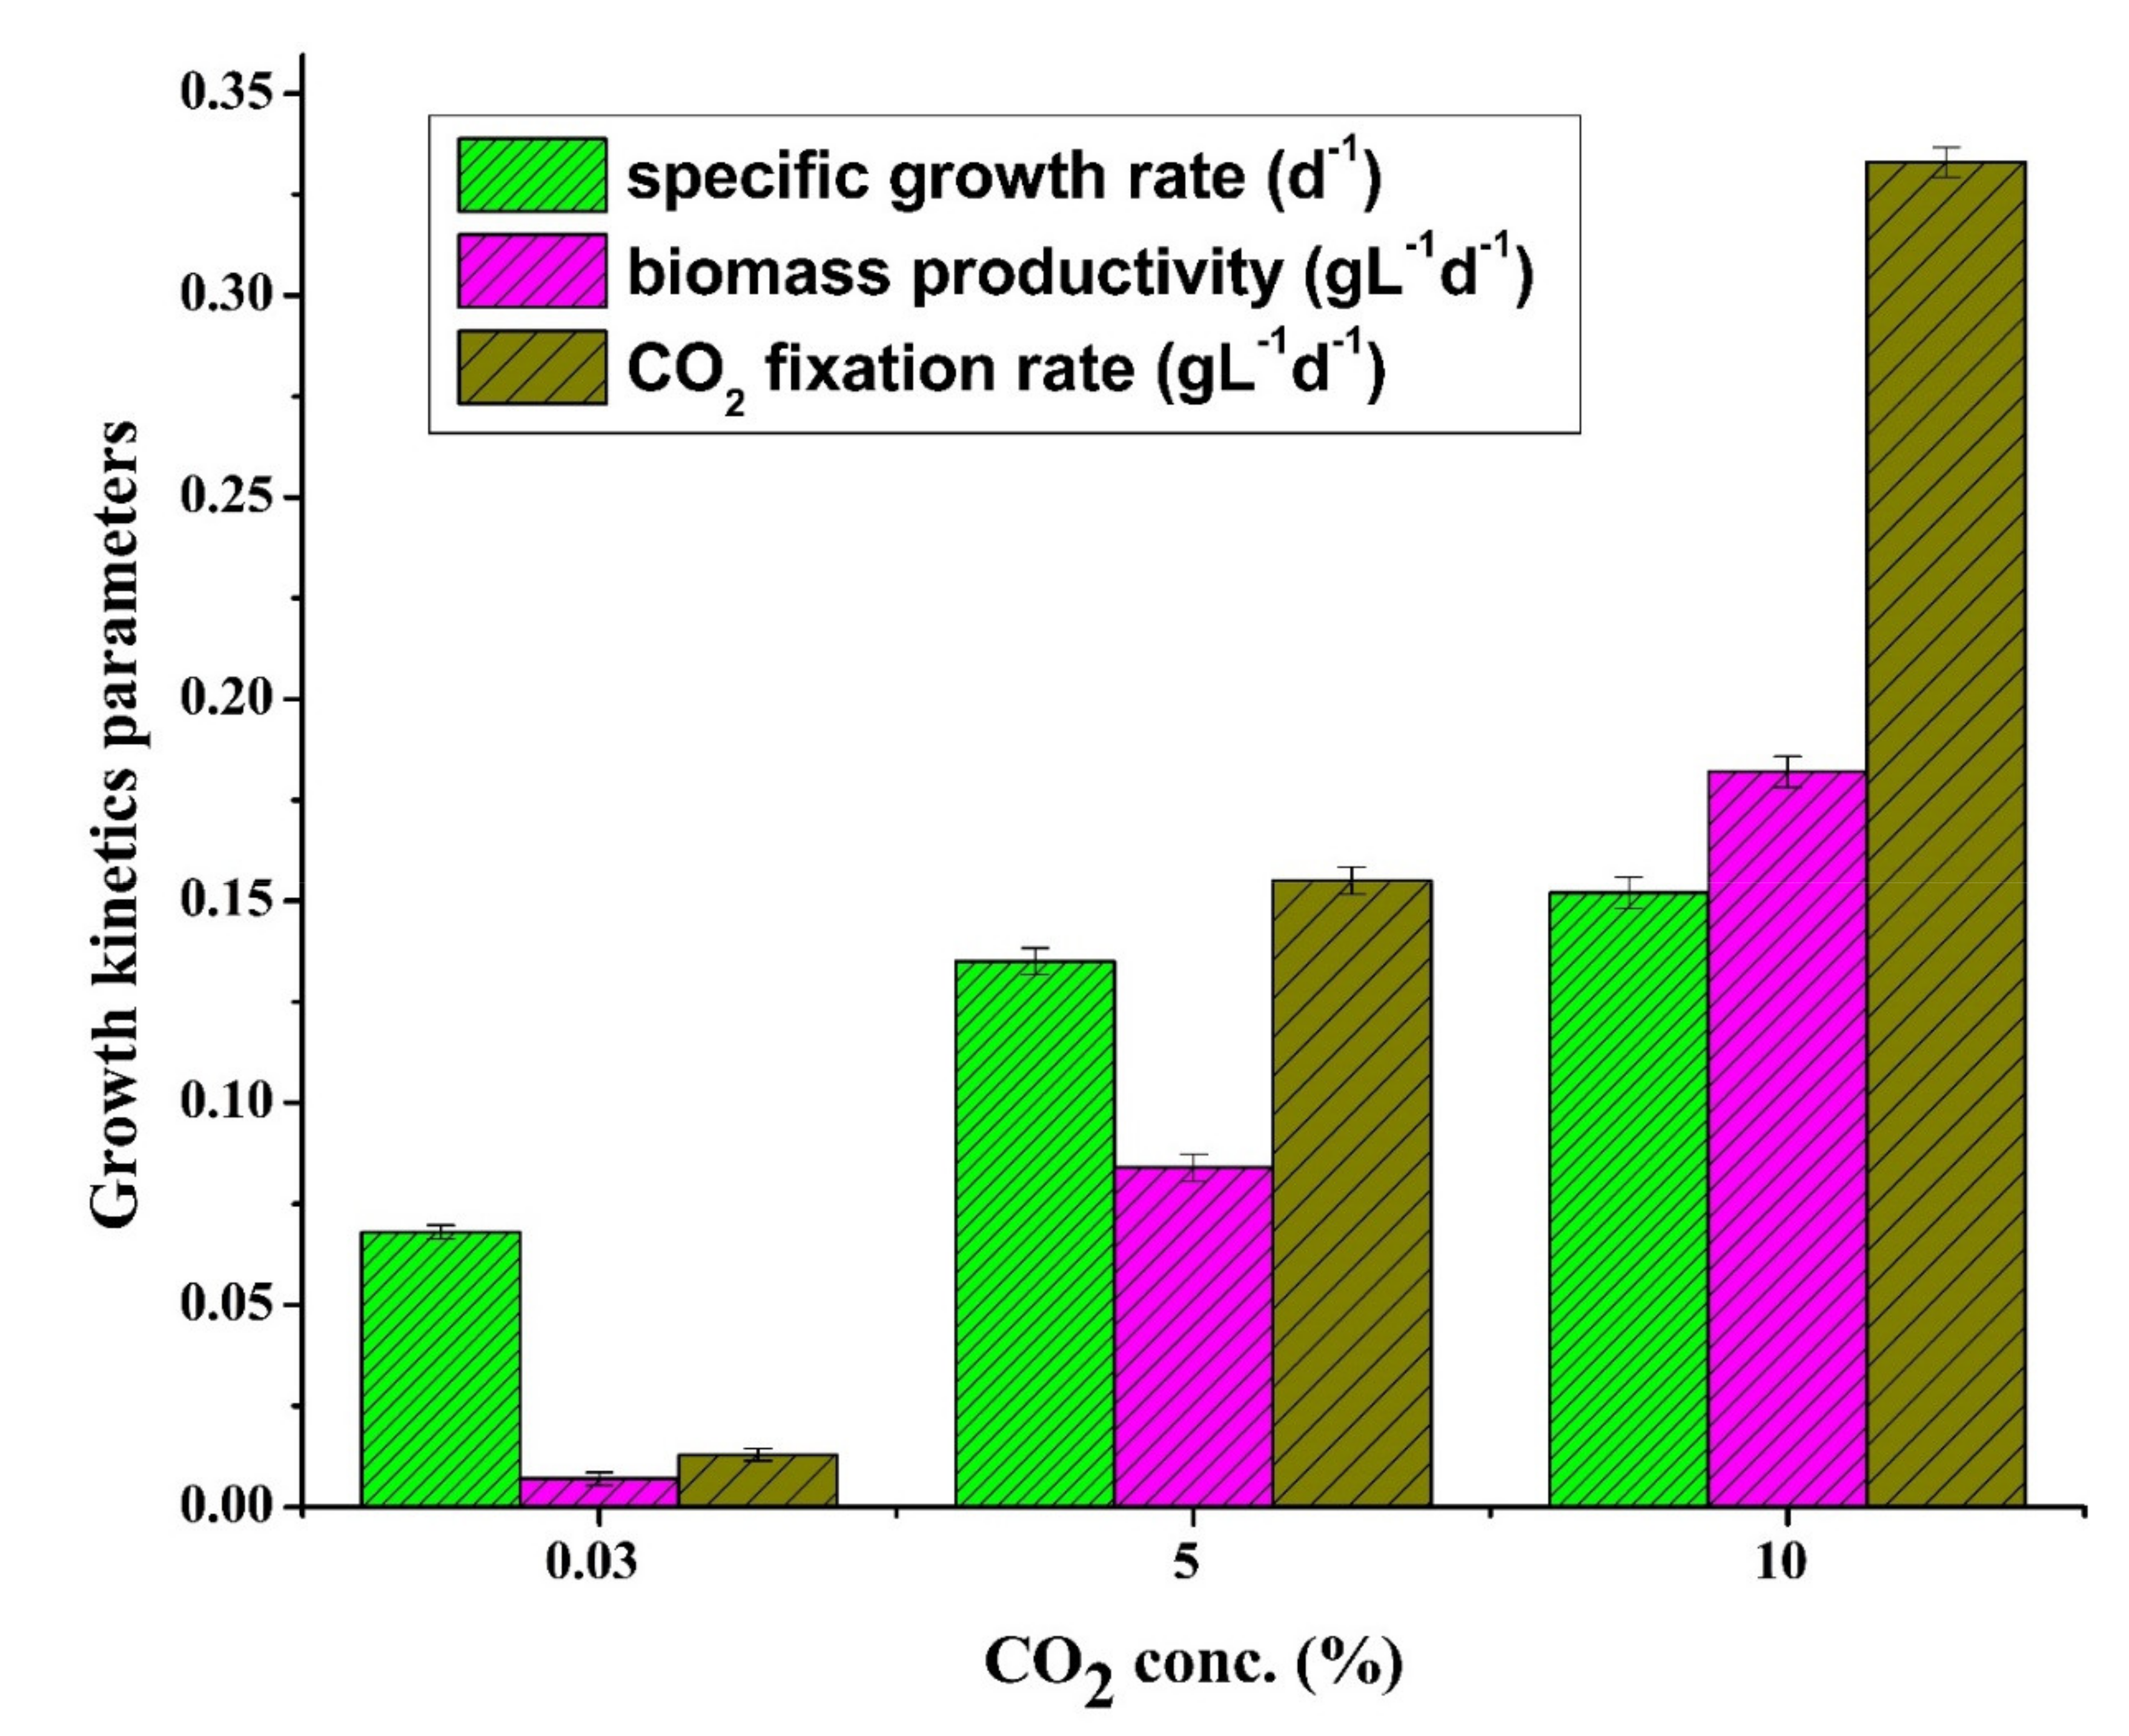
3.2. Effects of CO2 Concentration on Growth Kinetic Parameters

3.2.1. Specific Growth Rate

The specific growth rate (µ) of algal culture was measured using Equation (2) as given in Section 2.5. The maximum value of µm was obtained as 0.15 ± 0.004 d−1 when algal cells were grown with 10% inlet CO2 concentration. The specific growth rate was observed to be 0.07 ± 0.002 d−1 and 0.13 ± 0.003 d−1 for 0.03% and 5% inlet CO2 concentration, respectively (Figure 5). The marginal difference in the value of µ was observed to change CO2 concentration from 5% to 10%. These results are as per the reported results in the earlier studies [57,62].

3.2.2. Biomass Productivity

The concentration of CO2 significantly influences the productivity of biomass. The biomass productivity was estimated for all three inlet concentrations and is shown in Figure 5. It was observed that with the increase in CO2 concentration from 0.03% to 10%, the biomass productivity value was increased from 0.018 ± 0.002 g L−1 d−1 to 0.185 ± 0.004 g L−1 d−1. These findings are consistent with values obtained by studies given by [45,62].

3.2.3. CO2 Fixation Rate

The CO2 fixation rate was calculated using Equation (3). It was observed that the higher rate of biofixation of CO2 (0.33 ± 0.004 g L−1 d−1) was achieved when microalgae were cultured at 10% inlet concentration of CO2 (Figure 5). The CO2 fixation rates were obtained as 0.01 ± 0.001 g L−1 d−1 and 0.15 ± 0.003 g L−1 d−1 for 0.03% and 5% of CO2 concentration, respectively. These results are supported by the work carried out by different researchers [57,63].

3.3. Effect of CO2 Concentration on Biochemical Composition of Desmodesmus sp.

The content of lipids, total carbohydrates, proteins, and chlorophyll was estimated as macromolecular composition in the form of percentages of the total dry biomass (DCW) at three different CO2 concentrations (0.03%, 5%, and 10% v/v). The concentration of CO2 has a significant impact on the carbohydrate (CHO) content of microalgae [52]. CHO content of microalgae was observed as 14.6 ± 1.5%, 17.2 ± 2.0%, and 20.7 ± 2.4% of DCW for 0.03% CO2, 5% CO2, and 10% CO2 (v/v) concentration, respectively (Table 1). The different stages of growth and varying concentrations of CO2 have a greater impact on the total content of carbohydrates in the harvested algal biomass. The carbohydrate content in the algal biomass was significantly increased with an increase in CO2 concentration. The higher content of carbohydrates opens the possibility for further utilization of algal biomass as a substrate.
The maximum protein content of 32.3 ± 2.5% DCW was obtained when algal cells were cultivated with 10% CO2. The protein content was obtained as 14.4 ± 1.2% and 25 ± 1.1% when algal cells were grown at 0.03% and 5% CO2, respectively (Table 1). The higher cell concentration with an increase in CO2 concentration significantly increases the efficiency of the photosynthesis period. It leads to the formation of more and more amounts of protein.
The lipid content in algal biomass was observed to increase CO2 concentration (Table 1). The maximum amount of lipid, about 42 ± 1.0% DCW, was accumulated at 10% CO2. The lipid content was obtained as 15.5 ± 0.5% and 40 ± 2.0% for inlet CO2 concentration of 0.03% and 5%, respectively. The scarcity of nitrogen and phosphorus due to their continuous utilization in microalgae cultivation may be the reason for higher lipid content [64].
The concentration of Chl a and Chl b were estimated using Equations (5) and (6), respectively, as is shown in Table 1 at different inlet CO2 concentration of 0.03%, 5%, and 10% CO2 (v/v). Chl a and Chl b concentration varies from 0.12 ± 0.001 to 0.14 ± 0.004 mg L−1 and 0.15 ± 0.002 to 0.19 ± 0.005 mg L−1 with the increase in inlet CO2 concentration from 0.03% to 10%, respectively. The maximum amount of chlorophyll a and chlorophyll b was 0.14 ± 0.004 mg L−1 and 0.19 ± 0.005 mg L−1, respectively, when algae were treated with a 10% CO2 concentration. It is observed that Chl a content is less than Chl b for all inlet CO2 concentrations. It may be because the chlorophyll content in the microalgae varies in response to physical and chemical factors such as light intensity, agitation, temperature, and nutrient availability [65,66]. In the present study, the microalgae species, Desmodesmus, is a genus of green algae in the family of Scenedesmaceae. In the green algae, chlorophyll b absorbs energy from wavelengths of green light at 640 nm, which may be a possible reason for a higher content of chlorophyll b in Desmodesmus sp. The concentration of chlorophyll a indicates the quantity and capacity of photosynthesis activity of microalgae. It can also be used to assess the physiological state of microalgae.

4. Performance Comparison of Loop Bioreactor

Table 2 shows the comparison of the performance of the custom-designed loop bioreactor with other reactors at different scales (bench, pilot, and large) in terms of the parameters such as biomass productivity (g L−1 d−1), CO2 fixation rate, and biochemical compositions (carbohydrate, protein, and lipid content) for CO2 fixation via algal species. The maximum biomass produced (1.903 ± 0.038 g L−1), biomass productivity (0.19 ± 0.004 g L−1 d−1), and CO2 fixation rate (0.33 ± 0.004 g L−1 d−1) at 10% CO2 concentration are higher or nearly the same as compared to the values reported for previous studies (Table 2). The carbohydrate (20.7 ± 2.4%) and protein (32.3 ± 2.5%) content obtained in the present study at 10% CO2 concentration are comparable with the values reported for previous studies. However, the lipid content (42 ± 1.0%) is maximum compared to the studies reported in the literature. Most of the earlier studies were limited to the working volume of less than 1 L, except for a few studies. Compared to the large-scale bioreactors reported in the literature, the custom-designed loop bioreactor has shown better performance except for one study [35,67,68,69]. The scaled-up loop bioreactor has established comparable parameters that indicated the possibility of further scale-up of the process for the large-scale fixation of CO2 and simultaneous algal biomass production, leading to by-product formation. This study may be a viable solution for the source reduction of CO2 generated from waste management systems. The higher biomass productivity and carbohydrate content may lead to the value addition of the process in biofuels as by-product formation.

5. Conclusions

Biofixation of CO2 (g) at three different concentrations (0.03%, 5%, and 10% v/v) by Desmodesmus sp. was successfully demonstrated in the custom-designed loop photobioreactor. The maximum values of specific growth rate, biomass productivity, and CO2 fixation rate were obtained as 1.903 ± 0.04 g L−1, 0.19 ± 0.004 g L−1 d−1, and 0.333 ± 0.004 g L−1 d−1, respectively, at 10% CO2 concentration. The higher values of carbohydrate (20.7 ± 2.4%), protein (32.3 ± 2.5%), and lipid (42 ± 1.0%) content at 10% CO2 concentration confirmed the suitability of Desmodesmus sp. for the fixation of higher CO2 concentrations. The concentration of Chl a indicated the possibility of more significant photosynthesis activity of Desmodesmus sp. It can be concluded from the comparison of the present study with the studies reported in the literature that the use of a scaled-up loop bioreactor could possibly be utilized for large-scale fixation of CO2 emitted from waste management sources and reduces the problem of greenhouse gas emission. The more excellent biochemical constituents in algal biomass can also be utilized as potential feedstocks for biofuel applications. Thus, the present study leads to a waste-to-wealth process as a sustainable and eco-friendly strategy for biofuel component production with CO2 sequestration.

Author Contributions

The present research work is interdisciplinary research work. Please acknowledge: Conceptualization, S.R. and S.G.; methodology, S.R., S.G. and S.K.V.; validation, S.G.; formal analysis, S.R., S.G. and A.A.; investigation, A.A., K.T. and A.K.; data curation, A.A., K.T. and S.G.; writing—original draft preparation, A.A. and S.R.; writing—review and editing, S.R. and S.G.; visualization, S.R. and S.K.V.; supervision, S.R.; project administration, S.G. and S.K.V.; funding acquisition, S.R. and S.G. All authors have read and agreed to the published version of the manuscript.

Funding

The corresponding author would like to thank Science and Engineering Research Board—Core Research Grant, SERB—CRG, India for granting the project in the related area (CRG/2018/002943).

Institutional Review Board Statement

Not Applicable.

Informed Consent Statement

Not Applicable.

Data Availability Statement

Data is available on request from the corresponding author.

Acknowledgments

The authors are thankful to Birla Institute of Technology and Science (BITS), Pilani campus, India for providing the facilities to carry out the detailed research work.

Conflicts of Interest

The authors declare no conflict of interest. The funders had no role in the design of the study; in the collection, analyses, or interpretation of data; in the writing of the manuscript, or in the decision to publish the results.

References

  1. Ramanathan, V. The greenhouse theory of climate change: A test by an inadvertent global experiment. Science 1988, 240, 293–300. [Google Scholar] [CrossRef]
  2. Mendiara, T.; García-Labiano, F.; Abad, A.; Gayán, P.; de Diego, L.F.; Izquierdo, M.; Adánez, J. Negative CO2 emissions through the use of biofuels in chemical looping technology: A review. Appl. Energy 2018, 232, 657–684. [Google Scholar] [CrossRef]
  3. Sharma, J.; Kumar, S.; Kumar, V.; Malyan, S.K.; Mathimani, T.; Bishnoi, N.R.; Pugazhendhi, A. Upgrading of microalgal consortia with CO2 from fermentation of wheat straw for the phycoremediation of domestic wastewater. Bioresour. Technol. 2020, 305, 123063. [Google Scholar] [CrossRef]
  4. Agriculture, Agro-biodiversity and Climate Change. Available online: https://www.un.org/en/ecosoc/docs/pdfs/agriculture.pdf (accessed on 27 August 2021).
  5. Calabrò, P.S. Greenhouse gases emission from municipal waste management: The role of separate collection. Waste Manag. 2009, 29, 2178–2187. [Google Scholar] [CrossRef]
  6. Indian Network for Climate Change Assessment (INCCA). India: Green House Gas Emissions 2007; Ministry of Environment and Forests (MoEF), Government of India: New Delhi, India, 2010. [Google Scholar]
  7. Sources of Greenhouse Gas Emissions. Available online: https://www.epa.gov/ghgemissions/sources-greenhouse-gas-emissions (accessed on 27 August 2021).
  8. Chen, Y.C.; Lo, S.L. Evaluation of greenhouse gas emissions for several municipal solid waste management strategies. J. Clean Prod. 2016, 113, 606–612. [Google Scholar] [CrossRef]
  9. Vetter, S.H.; Sapkota, T.; Hillier, J.; Stirling, C.M.; Macdiarmid, J.I.; Aleksandrowicz, L.; Green, R.; Joy, E.J.; Dangour, A.D.; Smith, P. Greenhouse gas emissions from agricultural food production to supply Indian diets: Implications for climate change mitigation. Agric. Ecosyst. Environ. 2017, 237, 234–241. [Google Scholar] [CrossRef] [PubMed] [Green Version]
  10. Shahid, A.; Malik, S.; Zhu, H.; Xu, J.; Nawaz, M.Z.; Nawaz, S.; Alam, A.; Mehmood, M.A. Cultivating microalgae in wastewater for biomass production, pollutant removal, and atmospheric carbon mitigation; a review. Sci. Total Environ. 2020, 704, 135303. [Google Scholar] [CrossRef]
  11. Earth System Research Laboratory, Global Monitoring, DivisionNational Oceanic and Atmospheric Administration, U.S. Department of Commerce. The NOAA Earth System Research Laboratory, Gl. 2020. Available online: http://www.esrl.noaa.gov/gmd/ccgg/trends (accessed on 5 January 2020).
  12. Solomon, S.; Plattner, G.K.; Knutti, R.; Friedlingstein, P. Irreversible climate change due to carbon dioxide emissions. Proc. Natl. Acad. Sci. USA 2009, 106, 1704–1709. [Google Scholar] [CrossRef] [Green Version]
  13. Anand, A.; Raghuvanshi, S.; Gupta, S. Trends in carbon dioxide (CO2) fixation by microbial cultivations. Curr. Sustain. Energy Rep. 2020, 7, 40–47. [Google Scholar] [CrossRef]
  14. De Silva, G.P.D.; Ranjith, P.G.; Perera, M.S.A. Geochemical aspects of CO2 sequestration in deep saline aquifers: A review. Fuel 2015, 155, 128–143. [Google Scholar] [CrossRef]
  15. IPCC (Intergovernmental Panel on Climate Change). Climate Change 2013: The Physical Science Basis; Working Group I Contribution to the IPCC Fifth Assessment Report; Cambridge University Press: Cambridge, UK, 2013. [Google Scholar]
  16. Seyed Hosseini, N.; Shang, H.; Scott, J.A. Biosequestration of industrial off-gas CO2 for enhanced lipid productivity in open microalgae cultivation systems. Renew Sustain. Energy Rev. 2018, 92, 458–469. [Google Scholar] [CrossRef]
  17. Barahoei, M.; Hatamipour, M.S.; Afsharzadeh, S. CO2 capturing by chlorella vulgaris in a bubble column photo-bioreactor; Effect of bubble size on CO2 removal and growth rate. J. CO2 Util. 2020, 37, 9–19. [Google Scholar] [CrossRef]
  18. Khandelwal, A.; Anand, A.; Raghuvanshi, S.; Gupta, S. Integrated approach for microbial carbon dioxide (CO2) fixation process and wastewater treatment for the production of hydrocarbons: Experimental studies. J Environ. Chem. Eng. 2021, 9, 105116. [Google Scholar] [CrossRef]
  19. Ho, S.H.; Chen, C.Y.; Lee, D.J.; Chang, J.S. Perspectives on microalgal CO2 emission mitigation systems—A review. Biotechnol. Adv. 2011, 29, 189–198. [Google Scholar] [CrossRef] [PubMed]
  20. Nocito, F.; Dibenedetto, A. Atmospheric CO2 mitigation technologies: Carbon capture utilization and storage. Curr. Opin. Green Sustain. Chem. 2020, 21, 34–43. [Google Scholar] [CrossRef]
  21. Könst, P.; Mireles, I.H.; Van Der Stel, R.; Van Os, P.; Goetheer, E. Integrated system for capturing CO2 as feedstock for algae production. Energy Procedia 2017, 114, 7126–7132. [Google Scholar] [CrossRef]
  22. Farrelly, D.J.; Everard, C.D.; Fagan, C.C.; McDonnell, K.P. Carbon sequestration and the role of biological carbon mitigation: A review. Renew Sustain. Energy Rev 2013, 21, 712–727. [Google Scholar] [CrossRef]
  23. Salbitani, G.; Barone, C.M.A.; Carfagna, S. Effect of bicarbonate on growth of the oleaginous microalga Botryococcus braunii. Int. J. Plant Biol. 2019, 10, 35–37. [Google Scholar] [CrossRef] [Green Version]
  24. Mountourakis, F.; Papazi, A.; Kotzabasis, K. The microalga chlorella vulgaris as a natural bioenergetic system for effective CO2 mitigation—New perspectives against global warming. Symmetry 2021, 13, 997. [Google Scholar] [CrossRef]
  25. Anguselvi, V.; Ebhin Masto, R.; Mukherjee, A.; Kumar Singh, P. CO2 Capture for industries by algae. Algae 2019, 1–11. [Google Scholar] [CrossRef] [Green Version]
  26. Alami, A.H.; Tawalbeh, M.; Alasad, S.; Ali, M.; Alshamsi, M.; Aljaghoub, H. Cultivation of Nannochloropsis algae for simultaneous biomass applications and carbon dioxide capture. Energy Sources Part A Recover. Util Environ. Eff. 2021, 1–12. [Google Scholar] [CrossRef]
  27. Ullmann, J.; Grimm, D. Algae and their potential for a future bioeconomy, landless food production, and the socio-economic impact of an algae industry. Org. Agric. 2021, 11, 261–267. [Google Scholar] [CrossRef]
  28. Wang, B.; Li, Y.; Wu, N.; Lan, C.Q. CO2 bio-mitigation using microalgae. Appl. Microbiol. Biotechnol. 2008, 79, 707–718. [Google Scholar] [CrossRef]
  29. Leong, Y.K.; Chew, K.W.; Chen, W.H.; Chang, J.S.; Show, P.L. Reuniting the biogeochemistry of algae for a low-carbon circular bioeconomy. Trends Plant Sci. 2021, 26, 729–740. [Google Scholar] [CrossRef]
  30. Ho, S.H.; Chen, C.Y.; Yeh, K.L.; Chen, W.M.; Lin, C.Y.; Chang, J.S. Characterization of photosynthetic carbon dioxide fixation ability of indigenous Scenedesmus obliquus isolates. Biochem. Eng. J. 2010, 53, 57–62. [Google Scholar] [CrossRef]
  31. Nayak, M.; Karemore, A.; Sen, R. Sustainable valorization of flue gas CO2 and wastewater for the production of microalgal biomass as a biofuel feedstock in closed and open reactor systems. RSC Adv. 2016, 6, 9111–91120. [Google Scholar] [CrossRef]
  32. Lam, M.K.; Lee, K.T. Renewable and sustainable bioenergies production from palm oil mill effluent (POME): Win-win strategies toward better environmental protection. Biotechnol. Adv. 2011, 29, 124–141. [Google Scholar] [CrossRef] [PubMed]
  33. Ugwu, C.U.; Aoyagi, H.; Uchiyama, H. Photobioreactors for mass cultivation of algae. Bioresour. Technol. 2008, 99, 4021–4028. [Google Scholar] [CrossRef]
  34. Achinas, S.; Achinas, V.; Euverink, G.J.W. Microbiology and biochemistry of anaerobic digesters: A brief overview. In Bioreactors: Sustainable Design and Industrial Applications in Mitigation of GHG Emissions, 1st ed.; Elsevier: Amsterdam, The Netherlands, 2020; pp. 17–26. [Google Scholar] [CrossRef]
  35. Kumar, K.; Dasgupta, C.N.; Nayak, B.; Lindblad, P.; Das, D. Development of suitable photobioreactors for CO2 sequestration addressing global warming using green algae and cyanobacteria. Bioresour. Technol. 2011, 102, 4945–4953. [Google Scholar] [CrossRef] [PubMed]
  36. Huang, Q.; Jiang, F.; Wang, L.; Yang, C. Design of photobioreactors for mass cultivation of photosynthetic organisms. Engineering 2017, 3, 318–329. [Google Scholar] [CrossRef]
  37. Sharma, A.K.; Tripathi, K. Loop reactors—Advancing reactors realm: A review. Reactors 2016. [Google Scholar]
  38. Coker, A.K. Industrial and laboratory reactors—Chemical reaction hazards and process integration of reactors. Ludwig’s Appl. Process. Des. Chem. Petrochem. Plants 2015, 1095–1208. [Google Scholar] [CrossRef]
  39. Nagappan, S.; Verma, S.K. Growth model for raceway pond cultivation of Desmodesmus sp. MCC34 isolated from a local water body. Eng. Life Sci. 2016, 16, 45–52. [Google Scholar] [CrossRef]
  40. Abou-Shanab, R.A.I.; Ji, M.K.; Kim, H.C.; Paeng, K.J.; Jeon, B.H. Microalgal species growing on piggery wastewater as a valuable candidate for nutrient removal and biodiesel production. J. Environ. Manag. 2013, 115, 257–264. [Google Scholar] [CrossRef]
  41. Sundaram, S.; Thakur, I.S. Biosurfactant production by a CO2 sequestering Bacillus sp. strain ISTS2. Bioresour. Technol. 2015, 188, 247–250. [Google Scholar] [CrossRef]
  42. Abreu, A.P.; Fernandes, B.; Vicente, A.A.; Teixeira, J.; Dragone, G. Mixotrophic cultivation of Chlorella vulgaris using industrial dairy waste as organic carbon source. Bioresour. Technol. 2012, 118, 61–66. [Google Scholar] [CrossRef] [Green Version]
  43. Anjos, M.; Fernandes, B.D.; Vicente, A.A.; Teixeira, J.A.; Dragone, G. Optimization of CO2 bio-mitigation by Chlorella vulgaris. Bioresour. Technol. 2013, 139, 149–154. [Google Scholar] [CrossRef] [PubMed] [Green Version]
  44. Basu, S.; Roy, A.S.; Mohanty, K.; Ghoshal, A.K. Enhanced CO2 sequestration by a novel microalga: Scenedesmus obliquus SA1 isolated from bio-diversity hotspot region of Assam, India. Bioresour. Technol. 2013, 143, 369–377. [Google Scholar] [CrossRef]
  45. Tang, D.; Han, W.; Li, P.; Miao, X.; Zhong, J. CO2 biofixation and fatty acid composition of Scenedesmus obliquus and Chlorella pyrenoidosa in response to different CO2 levels. Bioresour. Technol. 2011, 102, 3071–3076. [Google Scholar] [CrossRef] [PubMed]
  46. Mohsenpour, S.F.; Willoughby, N. Effect of CO2 aeration on cultivation of microalgae in luminescent photobioreactors. Biomass Bioenergy 2016, 85, 168–177. [Google Scholar] [CrossRef]
  47. Lichtenthaler, H.K.; Buschmann, C. Chlorophylls and carotenoids: Measurement and characterization by UV-VIS spectroscopy. Curr. Protoc. Food Anal. Chem. 2001, 1, F4.3.1–F4.3.8. [Google Scholar] [CrossRef]
  48. Mecozzi, M. Estimation of total carbohydrate amount in environmental samples by the phenol-sulphuric acid method assisted by multivariate calibration. Chemom. Intell. Lab. Syst. 2005, 79, 84–90. [Google Scholar] [CrossRef]
  49. Wang, H.; Nche-Fambo, F.A.; Yu, Z.; Chen, F. Using microalgal communities for high CO2-tolerant strain selection. Algal Res. 2018, 35, 253–261. [Google Scholar] [CrossRef]
  50. Dubois, M.; Gilles, K.A.; Hamilton, J.K.; Rebers, P.A.; Smith, F. Colorimetric method for determination of sugars and related substances. Anal. Chem. 1956, 28, 350–356. [Google Scholar] [CrossRef]
  51. Varshney, P.; Beardall, J.; Bhattacharya, S.; Wangikar, P.P. Isolation and biochemical characterisation of two thermophilic green algal species- Asterarcys quadricellulare and Chlorella sorokiniana, which are tolerant to high levels of carbon dioxide and nitric oxide. Algal Res. 2018, 30, 28–37. [Google Scholar] [CrossRef]
  52. Lowry, O.H.; Rosebrough, N.J.; Farr, A.L.; Randall, R.J. Protein measurement with the Folin phenol reagent. J. Biol. Chem. 1951, 193, 265–275. [Google Scholar] [CrossRef]
  53. Varshney, P.; Sohoni, S.; Wangikar, P.P.; Beardall, J. Effect of high CO2 concentrations on the growth and macromolecular composition of a heat- and high-light-tolerant microalga. J. Appl. Phycol. 2016, 28, 2631–2640. [Google Scholar] [CrossRef]
  54. Bligh, E.G.; Dyer, W.J. A rapid method of total lipid extraction and purification. Can. J. Biochem. Physiol. 1959, 37, 911–917. [Google Scholar] [CrossRef] [PubMed] [Green Version]
  55. Yadav, G.; Karemore, A.; Dash, S.K.; Sen, R. Performance evaluation of a green process for microalgal CO2 sequestration in closed photobioreactor using flue gas generated in-situ. Bioresour. Technol. 2015, 191, 399–406. [Google Scholar] [CrossRef]
  56. Kaiwan-Arporn, P.; Hai, P.D.; Thu, N.T.; Annachhatre, A.P. Cultivation of cyanobacteria for extraction of lipids. Biomass Bioenergy 2012, 44, 142–149. [Google Scholar] [CrossRef]
  57. Wang, X.W.; Liang, J.R.; Luo, C.S.; Chen, C.P.; Gao, Y.H. Biomass, total lipid production, and fatty acid composition of the marine diatom Chaetoceros muelleri in response to different CO2 levels. Bioresour. Technol. 2014, 161, 124–130. [Google Scholar] [CrossRef]
  58. Widdel, F. Theory and measurement of bacterial growth. MethodsX 2019, 6, 2248–2257. [Google Scholar] [CrossRef]
  59. Chae, S.R.; Hwang, E.J.; Shin, H.S. Single cell protein production of Euglena gracilis and carbon dioxide fixation in an innovative photo-bioreactor. Bioresour. Technol. 2006, 97, 322–329. [Google Scholar] [CrossRef] [PubMed]
  60. Chiarini, A.; Quadrio, M. The light/dark cycle of microalgae in a thin-layer photobioreactor. J. Appl. Phycol. 2021, 33, 183–195. [Google Scholar] [CrossRef]
  61. Xue, S.; Su, Z.; Cong, W. Growth of Spirulina platensis enhanced under intermittent illumination. J. Biotechnol. 2011, 151, 271–277. [Google Scholar] [CrossRef]
  62. Toledo-Cervantes, A.; Morales, M.; Novelo, E.; Revah, S. Carbon dioxide fixation and lipid storage by Scenedesmus obtusiusculus. Bioresour. Technol. 2013, 130, 652–658. [Google Scholar] [CrossRef]
  63. Chiang, C.L.; Lee, C.M.; Chen, P.C. Utilization of the cyanobacteria Anabaena sp. CH1 in biological carbon dioxide mitigation processes. Bioresour. Technol. 2011, 102, 5400–5405. [Google Scholar] [CrossRef]
  64. Yang, Q.; Li, H.; Wang, D.; Zhang, X.; Guo, X.; Pu, S.; Guo, R.; Chen, J. Utilization of chemical wastewater for CO2 emission reduction: Purified terephthalic acid (PTA) wastewater-mediated culture of microalgae for CO2 bio-capture. Appl. Energy 2020, 276, 115502. [Google Scholar] [CrossRef]
  65. Chinnasamy, S.; Ramakrishnan, B.; Bhatnagar, A.; Das, K.C. Biomass production potential of a wastewater alga chlorella vulgaris ARC 1 under elevated levels of CO2 and temperature. Int. J. Mol. Sci. 2009, 10, 518–532. [Google Scholar] [CrossRef] [PubMed] [Green Version]
  66. Martínez, M.E.; Sánchez, S.; Jiménez, J.M.; El Yousfi, F.; Muñoz, L. Nitrogen and phosphorus removal from urban wastewater by the microalga Scenedesmus obliquus. Bioresour. Technol. 2000, 73, 263–272. [Google Scholar] [CrossRef]
  67. Chiu, S.Y.; Kao, C.Y.; Chen, C.H.; Kuan, T.C.; Ong, S.C.; Lin, C.S. Reduction of CO2 by a high-density culture of Chlorella sp. in a semicontinuous photobioreactor. Bioresour. Technol. 2008, 99, 3389–3396. [Google Scholar] [CrossRef]
  68. Yen, H.W.; Ho, S.H.; Chen, C.Y.; Chang, J.S. CO2, NOx and SOx removal from flue gas via microalgae cultivation: A critical review. Biotechnol. J. 2015, 10, 829–839. [Google Scholar] [CrossRef] [PubMed]
  69. Ugwu, C.U.; Ogbonna, J.C.; Tanaka, H. Improvement of mass transfer characteristics and productivities of inclined tubular photobioreactors by installation of internal static mixers. Appl. Microbiol. Biotechnol. 2002, 58, 600–607. [Google Scholar] [CrossRef]
  70. Sydney, E.; Sturm, W.; de Carvalho, J.; Soccol, V.T.; Larroche, C.; Pandey, A.; Soccol, C.R. Potential carbon dioxide fixation by industrially important microalgae. Bioresour. Technol. 2010, 101, 5892–5896. [Google Scholar] [CrossRef]
  71. Kumar, K.; Banerjee, D.; Das, D. Carbon dioxide sequestration from industrial flue gas by Chlorella sorokiniana. Bioresour. Technol. 2014, 152, 225–233. [Google Scholar] [CrossRef] [PubMed]
  72. Nayak, M.; Karemore, A.; Sen, R. Performance evaluation of microalgae for concomitant wastewater bioremediation, CO2 biofixation and lipid biosynthesis for biodiesel application. Algal Res. 2016, 16, 216–223. [Google Scholar] [CrossRef]
  73. Carlozzi, P. Dilution of solar radiation through “culture” lamination in photobioreactor rows facing south-north: A way to improve the efficiency of light utilization by cyanobacteria (Arthrospira platensis). Biotechnol. Bioeng. 2003, 81, 305–315. [Google Scholar] [CrossRef] [PubMed]
  74. Hall, D.O.; Acién Fernández, F.G.; Guerrero, E.C.; Rao, K.K.; Grima, E.M. Outdoor helical tubular photobioreactors for microalgal production: Modeling of fluid-dynamics and mass transfer and assessment of biomass productivity. Biotechnol. Bioeng. 2003, 82, 62–73. [Google Scholar] [CrossRef] [PubMed]
  75. López, M.G.-M.; Sanchez, E.D.R.; López, J.C.; Fernandez, F.G.A.; Sevilla, J.M.F.; Rivas, J.; Guerrero, M.; Grima, E.M. Comparative analysis of the outdoor culture of Haematococcus pluvialis in tubular and bubble column photobioreactors. J. Biotechnol. 2006, 123, 329–342. [Google Scholar] [CrossRef] [PubMed]
  76. Kargupta, W.; Ganesh, A.; Mukherji, S. Estimation of carbon dioxide sequestration potential of microalgae grown in a batch photobioreactor. Bioresour. Technol. 2015, 180, 370–375. [Google Scholar] [CrossRef]
  77. Ye, Q.; Cheng, J.; Guo, W.; Xu, J.; Li, K.; Zhou, J. Serial lantern-shaped draft tube enhanced flashing light effect for improving CO2 fixation with microalgae in a gas-lift circumflux column photobioreactor. Bioresour. Technol. 2018, 255, 156–162. [Google Scholar] [CrossRef] [PubMed]
Figure 1. Schematic diagram of custom-designed loop photobioreactor.
Sustainability 13 09882 g001
Figure 2. An overview of the loop photobioreactor: (a) at day zero after inoculation; (b) at day 12—last day of incubation period used for the CO2 mitigation study.
Sustainability 13 09882 g002
Figure 3. Effect of time on cell concentration (g L−1) at three different CO2 concentrations (0.03%, 5%, and 10% v/v).
Sustainability 13 09882 g003
Figure 4. Effect of light and dark cycle on optical density (OD) with respect to time for three different CO2 concentrations.
Sustainability 13 09882 g004
Figure 5. Effect of three different CO2 concentrations (0.03%, 5%, and 10% v/v) on the different growth kinetic parameters (specific growth rate (d−1), biomass productivity (g L−1 d−1), CO2 fixation rate (g L−1 d−1)) of microalgae.
Sustainability 13 09882 g005
Table 1. Biochemical compositions of Desmodesmus sp. in the form of percentages of the total dry biomass (DCW) at three different CO2 concentrations for 12 days of cultivation time.
Biochemical CompositionInlet Concentration of CO2 (v/v)
0.03%5% 10%
Total carbohydrates (% DCW)14.6 ± 1.517.2 ± 2.020.7 ± 2.4
Proteins (% DCW)14.4 ± 1.225 ± 1.132.3 ± 2.5
Lipids (% DCW)15.5 ± 0.540 ± 2.042 ± 1.0
Chlorophyll a, b (mg L−1)0.12
0.15
0.13
0.17
0.14
0.19
Table 2. Performance comparison of loop bioreactor in terms of various parameters with reported studies.
SpeciesCultivation Time (Day)Mode/
(Volume, L/Working Volume, L)
CO2 conc.
(% v/v)
Max. Biomass Produced (XMax) (g L−1)Biomass Productivity (P)
(g L−1 d−1)
CO2 Fixation Rate (RCO2) (g L−1 d−1)Carbohydrate
(% DCW)
Protein
(% DCW)
Lipids
(% DCW)
References
Chlorella sp. 8Column
Photobioreactors, (0.8)
2 1.210.150.28---Chiu et al., 2008 [67]
Chlorella vulgaris15Bio Flow fermenter, (11/8)10 1.940.130.2516.7440.959.95Sydney et al., 2010 [70]
Scenedesmus obliquus6Erlenmeyer
flask, (0.650)
10 1.840.150.29--22Tang et al., 2011 [45]
Chlorella sorokiniana8Airlift photobioreactor, (1.4)4 1.10.15---20.93Kumar et al., 2014 [71]
Scenedesmus sp.7Airlift photobioreactor, (0.5)2.5 1.30.190.3510.4-35.6Nayak et al., 2016 [72]
Scenedesmus sp.7Bubble-column
photobioreactor, (0.5)
2.5 1.370.1960.37--33.3Nayak et al., 2016 [72]
Acutodesmus sp.5Erlenmeyer flasks, (0.5/0.2)20 1.65--34.5238.7811.67Yadav et al., 2015 [55]
A. quadricellulare6Laboratory
scale photobioreactor, (0.8/0.680)
5 1.29--33.430.344Varshney et al., 2018 [53]
Desmodesmus sp. MCC3418Raceway pond, (1000)-1.9----0.103Nagappan et al., 2016 [39]
Porphyridium cruentum-Airlift tubular, (200)-3.01.50----Yen et al., 2015 [71]
Chlorella sorokiniana-Inclined tubular, (6.0)51.501.47----Ugwu et al., 2002 [69]
Arthrospira platensis-Undular row tubular, (11)--2.70----Carlozzi P., 2003 [73]
Phaeodactylum tricornutum9Outdoor helical tubular, (75)-2.951.40----Hall et al., 2003 [74]
Haematococcus pluvialis16Bubble-column, (55)-1.40.06----Lopez et al., 2006 [75]
Chlorella pyrenoidosa1.25Tubular batch reactors, (0.660)10 0.110.096---Kargupta et al., 2015 [76]
Chlorella PY-ZU14.5Cylindrical PBR (6)15-0.470.87---Ye at al., 2018 [77]
Desmodesmus sp.12Loop photobioreactor, (34/26)0.03 0.96 ± 0.040.018 ± 0.0020.013 ± 0.00114.6 ± 1.514.4 ± 1.215.5 ± 0.5Present study
Desmodesmus sp.12Loop photobioreactor, (34/26)5 1.219 ± 0.040.084 ± 0.0030.155 ± 0.00317.2 ± 2.025 ± 1.140 ± 2.0Present study
Desmodesmus sp.12Loop photobioreactor, (34/26)101.903 ± 0.040.185 ± 0.0040.333 ± 0.00420.7 ± 2.432.3 ± 2.542 ± 1.0Present study
Publisher’s Note: MDPI stays neutral with regard to jurisdictional claims in published maps and institutional affiliations.

