Article

Analyzing the Characteristics and Evolution of Chinese Enterprises’ Outward Forward Direct Investment Host Country Network

1
School of Law and Business, Sanjiang University, Nanjing 210012, China
2
College of Economics and Management, Nanjing University of Aeronautics and Astronautics, Nanjing 210037, China
3
School of Management Science and Engineering, Nanjing University of Information Science & Technology, Nanjing 210044, China
4
School of Marine Sciences, Nanjing University of Information Science & Technology, Nanjing 210044, China
*
Authors to whom correspondence should be addressed.
Sustainability 2021, 13(17), 9824; https://doi.org/10.3390/su13179824
Submission received: 5 August 2021 / Revised: 26 August 2021 / Accepted: 27 August 2021 / Published: 1 September 2021

Abstract

:
With the promulgation of the “Going Global” strategy, Chinese enterprises’ outward forward direct investment (OFDI) moved towards a stage of rapid development. Based on the data concerning projects of Chinese enterprises, this paper establishes a network of OFDI host countries with the industry as the media and analyzes the network and its evolution characteristics by using the complex network method. Results show that the number of network nodes is increasing, and the edges between communities are greater, and the number of countries along the Belt and Road route is increasing. The network is a so-called small-world network. To reduce investment risks, it is necessary to identify the key nodes in the network. Based on the centrality of key nodes in complex networks, the improved “scatter degree” method is used to evaluate the importance of each host node. Results demonstrate that the United States and Australia are the most important countries for Chinese enterprises to invest overseas, followed by Brazil, Canada, Russia, Indonesia, and the United Kingdom (UK). Excluding the UK, all other countries are resource-rich. Thus, it can be seen that the FDI of Chinese enterprises is mainly resource-based investment.

1. Introduction

Under the development trend of globalization of the world economy, Outward Foreign Direct Investment (OFDI) is undoubtedly an important way for a country to penetrate into the world economic system and develop together with other countries in the world. With the deepening of China’s reform and opening-up policy, China’s economic relations with the world have become closer, especially after its accession to the “going out” development strategy and the “One Belt, One Road” strategy, China’s OFDI has developed rapidly. In 2003, China’s OFDI was US$2.9 billion, with a total cumulative investment of US$33.2 billion while by 2019, China’s OFDI flow was US$136.91 billion, reigning as the second largest in the world, with a global share of 10.4%, stock of US$219.88 billion, second only to the United States and the Netherlands, with 43,000 enterprises established abroad and investment regions covering more than 180 countries worldwide (source of data 《Statistical Bulletin of China’s Outward Foreign Direct Investment》 (2003 and 2019)).
Under market economy conditions, OFDI is an act of independent choice for enterprises, but the OFDI behavior of enterprises in different industries and of different nature brings different impacts on the home country, including technology, trade, resources, and environment, etc. [1,2,3,4,5]. For example, investment in developed countries can improve China’s technology level, but there are few patents from local independent innovation, and OFDI can expand exports and alleviate the problem of insufficient resources for domestic economic development, but the degree of impact of OFDI on the home country is closely linked to factors such as technology and resource endowment of the host country [6,7]. Therefore, uncovering important host countries for OFDI can help academics focus on analyzing the impact of these countries’ technology and institutional environment on China, and help the Chinese government and enterprises make measures and decisions that are more conducive to investment development.
The novelty of this paper lies in the application of the complex network approach to OFDI, taking the host country network as a whole and analyzing the characteristics of the network and the changes in the key indicators of the network from year to year, which helps to understand the regional layout of OFDI by Chinese enterprises. It also uses the method of mining the key nodes of the network and the improved “scattering degree” method to determine the important country nodes in the host country network. Therefore, after the literature review, this paper carries out the introduction of the theoretical method, which contains two aspects, one is the method of establishing the network, the overall characteristics of the network and the network key node identification indicators, and the other is the improved “scattering degree” method. Based on the introduction of the theoretical method, the network of host countries is established by substituting the data of large Chinese enterprises’ investment from 2005 to 2019 and analyzing their overall network characteristics, network changes over consecutive years, and node importance ranking, finally obtaining the most important host countries for Chinese OFDI and making corresponding recommendations based on the research findings.

2. Literature Review

The rapid development of OFDI in China has also triggered a surge in research into China’s OFDI. Presently, OFDI research follows two pathways: the first is location selection where different ownership enterprises have different investment motives, state-owned enterprises prefer countries and regions with rich natural resources, while private enterprises prefer market access. However, they also have a joint investment motive, that is, to acquire technologies that are beneficial to the development of enterprises [8]. There are many factors affect the OFDI of Chinese enterprises which include market size, infrastructure development, human resources, geographical proximity, natural resource endowment of the host country [9,10], the institutional distance between host country and home country [11,12], the cultural distance [11,13], One Belt, One Road strategy [14]. One Belt, One Road strategy directs firms to invest in countries along the Belt and Road where good infrastructure and rich human resources are more likely to attract business investment [15]. In addition to some macro factors, enterprises should also consider their own productivity, technical ability, export experience, and other micro factors when choosing locations for overseas investment [16], Yan et al. [17] used samples of enterprises for analysis and found that there is a threshold effect of productivity on OFDI. When productivity is lower than the threshold, the enterprise does not want to expand overseas market, and only when the enterprise scale and productivity reach a certain level will the enterprise consider expanding.
The second concerns OFDI influencing factors. It has been suggested that investment in developed countries can promote the technological innovation of the home country, while investment in emerging countries is not conducive to the technological innovation of the home country [4]. OFDI has been shown to be conducive to the upgrading of China’s industrial structure, especially the optimization of mining and manufacturing industries [18]. At the same time, the increase of OFDI above a certain threshold is conducive to the home country’s reduction of industrial wastewater discharge and industrial SO2 discharge [19], but will increase CO2 emissions [20].
Most of the above studies are conducted from a macroscopic perspective, mainly due to the availability of macro data. From a micro perspective, research is mostly conducted by using the data of listed companies, Oriana Asia-Pacific Enterprise Analysis Database or customs database [21]. For example, Wu et al. [12,22] collected data from companies and found that OFDI improves the total factor productivity of its home country through reverse technology spillover.
In general, existing research on OFDI has focused on the stochastic frontier approach (SFA) and the propensity-score matching (PSM), [18,23] using macro data or data on listed companies and relevant corporate databases, to investigate in detail the factors influencing the location choice of OFDI and the impact of OFDI on the host or home country. The results of the study show that the factors influencing OFDI vary due to the heterogeneity of industries or enterprises, as well as the different perspectives and sample data of the study, and the results of the study using macro data of countries along the “Belt and Road” show that Chinese OFDI shows a political system risk preference, while using data of large OFDI investment projects (Projects of USD 1 million or more, all projects below are of USD million or more. The study also finds that Chinese SOEs’ resource investments prefer politically stable countries, while non-resource investments do not have a strong institutional preference [24,25]. Therefore, existing research on OFDI in China focuses on the impact aspect, and the analysis of the overall OFDI layout area of Chinese enterprises is still lacking, while the complex network approach can incorporate all OFDI host countries into a network system and analyze the OFDI location distribution of Chinese enterprises and its changes from a holistic perspective.
The study of complex network theory can be traced back to the Konigsberg Problem proposed by mathematician Euler in the 18th century. In the beginning, mathematicians all over the world had been committed to abstract mathematical research on simple regular networks and random networks. Regular network was too idealistic and ignored the complexity of actual network. Later, researchers found that the network in the real world has both rules and randomness, so they proposed some more practical network models [26,27].
Presently, complex network is a systematic and scientific research method and is widely used in the medical field [28] and computer science [29,30]. Additional studies using the method have been performed by Kawazoe et al. [31,32,33,34,35,36]. Using the network approach, researchers treat the object of study as a complete system, allowing them to analyze both the characteristics of the system and the internal structure of the system and the connections between the structures.
By using the complex network method and taking the host country as the network node, the analysis can not only take the host country network as a whole and analyze its network and evolution characteristics, but also analyze the position of each node in the network and the relationship among the nodes, which is beneficial to understand the distribution and evolution of the host country and the key host countries for Chinese enterprises’ OFDI.

3. Data and Methodology

3.1. Data

The research in this paper is based on the sample of Chinese enterprises’ OFDI projects. The data are from a 2005 follow-up survey records made by the American Enterprise Institute and the Heritage Foundation on Chinese enterprises worth more than one million US dollars. The survey provides a real-time record of Chinese companies’ OFDI projects including the amount of investment, primary and secondary industries to which they belong, the relationship between the investing parties, the host country, the mode of entry of the companies, the proportion of Chinese companies, and whether they belong to the One Belt One Road (OBOR) imitative or not. Here, industries may refer to those in agriculture, chemicals, energy, metals, transportation, agriculture, technology, logistics, entertainment, finance, health, real estate, community services etc.
Based on the original single project data, this paper sums up the investment amount of each industry in the same country from 2005 to 2019 and obtains the investment data of Chinese enterprises in each industry in a single country for 15 years, which is convenient to study the global layout characteristics of Chinese enterprises’ OFDI projects. The preliminary data processing results show that the project data have significant characteristics to the micro data. In other words, the data are discontinuous. Australia and the United States have the largest outward direct investment from Chinese enterprises, with investment years measured at 15 and 14, respectively. Other countries such as Antigua and Barbuda have at least one investment year. Such data situation ensures that the scale and node names of its network will not be fixed when using complex network analysis, which will change with the change of the host country in the current year. Therefore, based on the analysis of the evolution characteristics of the host country network, this paper not only horizontally excavates the important national nodes in the 1-year network (hereinafter, the nodes all refer to the national nodes in the host country network of Chinese enterprise OFDI), but also vertically judges the important nodes in the past 15 years, thus forming a comprehensive and three-dimensional analysis.

3.2. Methodology

3.2.1. Network Construction

In this paper, the distribution of OFDI host countries Chinese enterprises is taken as the research object, and the method of complex network is adopted to establish the OFDI host country network of Chinese enterprises. The network takes the host country involved as the node and takes the industry as the media to establish the edges between the nodes. If Chinese enterprises have investment in industry (or sector) S of country i and country j , we believe that there is an edge between the nodes of two countries, represented by a i j = 1; if there is no investment in the industry S of the two countries, a i j = 0, then, the undirected relationship matrix A of OFDI host country network of Chinese enterprises can be obtained as follows:
A = ( a i j ) N × N
By visualizing the host country network enterprise OFDI with Gephi software, the host country network of the Chinese enterprise OFDI in the current year can be obtained (Figure 1). The nodes in the network are all host countries of the Chinese enterprise OFDI, and there is no direction between the nodes. Therefore, the network is an undirected network. The network system displays the host country node system of the Chinese OFDI, reveals the network structure and characteristics of the host country, and evaluates the node status by combining indicators such as degree centrality, relative betweenness centrality, closeness centrality, and eigenvector centrality.

3.2.2. Network Topological Properties

The number of nodes and edges, network density, degree distribution, average path length, and clustering coefficient of the network are all common indicators used to describe the basic topological properties of the network [37]. In the corporate OFDI host country network, the number of nodes refers to the number of host countries in the network. The larger the number of nodes, the larger the network scale [38]. The number of edges of the network refers to the same industry investment made by Chinese companies in the two countries. The more the number of sides, the more countries involved in the same industry investment. Degree ( K i ) refers to the number of edges of other nodes connected to the node. Degree distribution P ( k ) is the probability that a node is randomly selected in the network and its degree value is k . The characteristics of degree value distribution can be judged through degree distribution analysis. Determine whether there are key nodes. Average path length (L) is the average of the distance between any two nodes [37], the shorter the distance between two nodes, the higher the efficiency of the transmission of information between them. The clustering coefficient ( C i ,) reflects the closeness between node i and its neighbor nodes and is the average of the clustering coefficients of all the nodes. The value lies between 0 and 1, and C i = 0 when and only when any two neighboring nodes of node i are not neighbors of each other or the node has, at most, one neighboring node.

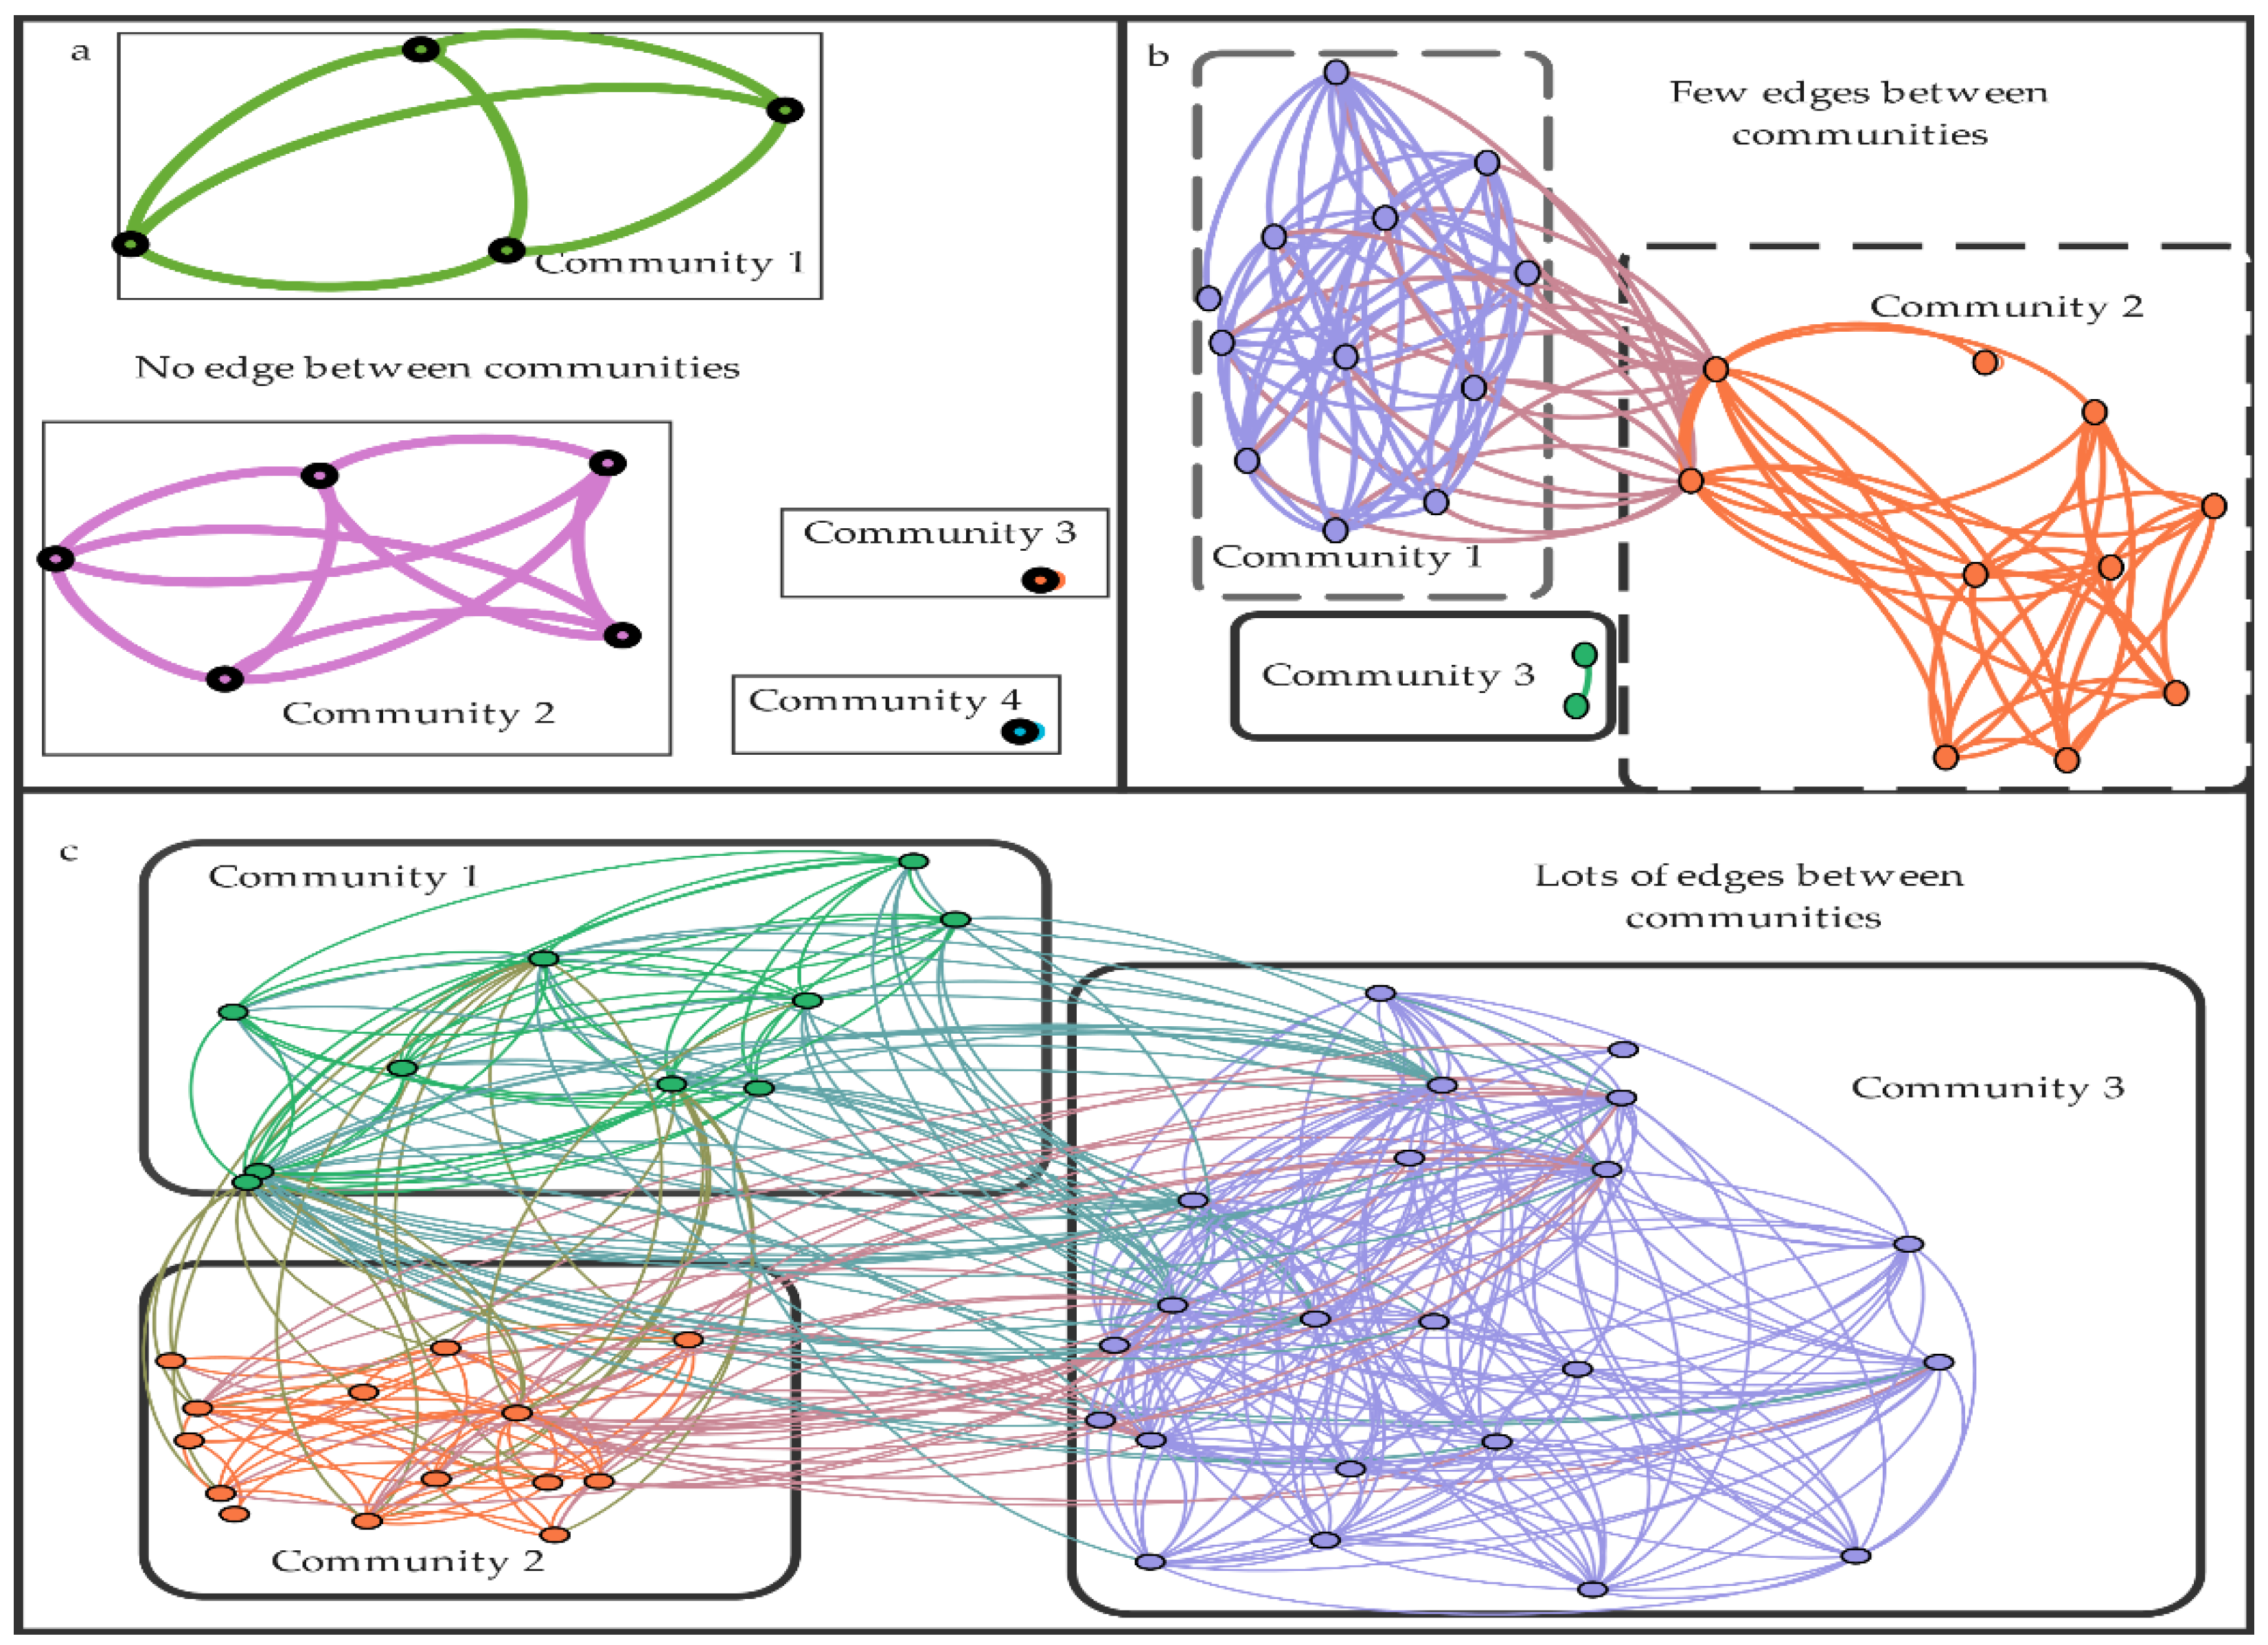
3.2.3. Modularity and Community Division

Complex network presents a number of groups or clusters which is called community structure. Community is a collection of nodes with common properties. The nodes within the community are closely connected, and the communities are connected by fewer edges. Modularity ( Q ) is is a good way to quantify the community structure as it can reflect the clustering degree of the network to a certain extent. Modularity can be positive, negative, or even 0. A larger positive value indicates a good network division. A smaller Q value results in a more ambiguous community division [39,40].

3.2.4. The Node Importance Index of the Network

(1)
Basic Evaluation Indexes
The importance of nodes is also called centrality. The importance of a node is classified using common indices such as degree, betweenness, closeness centrality, K-kernel, and PR value [38]. In this paper, each national node in China’s OFDI host network is sorted based on four basic indicators: a node’s own importance, the importance of neighboring nodes, the influence of nodes on neighboring nodes, and the degree of dependence of nodes on neighboring nodes. The four basic indicators are integrated using the improved “scatter degree” method to obtain the integration centrality, so as to judge which host country has the most influence in China’s OFDI host network, which is the most important host country.
Degree centrality (DC) is a sorting method based on the nearest neighbors of nodes. The higher the degree centrality of the node, the more countries involved in the same investment industry as the node. It can illustrate that the node in this country may involve more investment industries than the country node with a low degree value. The eigenvector centrality (EC) emphasizes the importance of the node by the importance of the neighboring node, and emphasizes the environment in which the node is located, reflecting the influence of the neighboring node on node i [37]. Relative betweenness centrality (Relative BC) reflects the extent to which node i controls the ability of neighboring nodes to transmit information [38]. Countries with high centrality have a strong ability to control information dissemination. The ability of node i to spread information to its neighbors is expressed by closeness centrality (CC) [37]. It should be noted that the greater the proximity of node i to the centrality, the greater the influence of the country on other host countries, and the higher the probability of achieving inter-country spillover.
(2)
Comprehensive evaluation index
Degree centrality, eigenvector centrality, relative betweenness centrality, and closeness centrality depict the importance of nodes from four aspects, namely, the importance of nodes themselves, the importance of neighboring nodes, the ability to transmit information as connected nodes, and the proximity of nodes themselves to other nodes. Therefore, the ranking results obtained by different indicators are slightly different. In order to make up for the defects caused by the above four indexes’ evaluation separately, this paper the improved “scatter degree” method to open the grade and designs the comprehensive centrality as a comprehensive evaluation index to comprehensively evaluate the importance of each host country. The method takes degree centrality, eigenvector centrality, relative betweenness centrality, and closeness centrality as basic indicators, and carries out analysis to obtain comprehensive evaluation indicators. The purpose of adopting this method is to reduce the influence of subjective factors in the research process and thus objectively evaluate the reference object [41].
The improved “scatter degree” method, is used for the dynamic comprehensive evaluation of time series stereo data, which is static evaluation of all indicators at the same time point (i.e., “scatter degree” method in single year). Based on the static evaluation results at each time point and combined with the time dimension, it finally forms a kind of un-scaling grade method based on the three-dimensional data analysis. In the dynamic comprehensive evaluation of OFDI host country status, it is necessary to compare a given set of countries in the host country network of a single year. Not only should the importance of country nodes in the network be evaluated every year, but also the importance of each country node in the statistical years of data be evaluated in combination with time series to obtain and judge the main country nodes.
Since this paper analyzes the importance of network nodes in the host country based on the data of investment projects of more than one million US dollars, this project has two characteristics. Firstly, individual countries have high levels of investment in individual years, but this is only an occasional occurrence (e.g., Switzerland, USD 43,060 million in agriculture investment in 2017, 71% of its total). Secondly, after analyzing the total investment amount of countries in 15 years, it is found that the total investment amount of countries with more years is often higher than that of countries with less years. For example, in 2008, 2010–2012, and 2014–2017, China has invested in Italy a total amount of US$215 million, involving nine industries. China has invested in Israel with a total amount of US$11,450 million, involving six industries, but for only 7 years. Therefore, it can be concluded that the investment amount of countries with less years is usually less than that of countries with more years, and its importance is reduced. The comprehensive evaluation index ranking of countries with less than 8 years of investment (the time span of sample data is 15 years) is not particularly high. Therefore, they can be removed.
In the vertical comparison, this research is based on investment projects to study the importance of China’s OFDI host countries. Countries with few investment years are defined as those who have lesser importance to OFDI. Besides, this paper takes the middle value of 15 years of statistical years from 2005 to 2019 as the boundary to eliminate the countries with investment years lower than 8 years, producing a dataset of 25 countries. Degree, eigenvector, relative betweenness, and close to centrality are used as evaluation indicators and are designated X 1 , X 2 , X 3 and X 4 , respectively. Three-dimensional time series of statistical data over the 2005–2019, 15-year period (Table 1) was used in the improved “scatter degree” method comprehensive evaluation index function [41].
The specific operation is as follows. Firstly, the extreme value method is adopted to perform dimensionless processing on the original index data so as to ensure the data unification and comparability. Secondly, calculate the weight coefficient of the evaluation index W j ( j = 1 , 2 , , m ). The principle of determination is to reflect the difference between the evaluation objects as much as possible. This difference is denoted as y i ( t k ) , which is the sum of squared deviations:
σ 2 = k = 1 n i = 1 n ( y i ( t k ) y ¯ ) 2
y ¯ = 1 T K = 1 T ( 1 n i = 1 n j = 1 m W j X i j ( ( t k ) ) = 0
σ 2 = k = 1 T i = 1 n ( y i ( t k ) ) 2 = k = 1 T [ w τ H w ] = w τ k = 1 T H k w
The symmetric matrix
w = ( w 1 , w 2 , , w m , ) τ ,   H = k = 1 T H k
is the m × m order symmetric matrix,
H k = X k τ X k ( k = 1 , , T ) ,   X k = [ X 11 ( t k ) X 1 m ( t k ) X n 1 ( t k ) X n m ( t k ) ] ,   k = 1 , 2 , , T
According to the principle of difference that maximizes the level of evaluation objects, the evaluation question is transformed into σ 2 and the maximum problem is given by:
M A X ( w τ H w ) = λ m a x ( H )
where w is the eigenvector corresponding to the maximum eigenvalue of H, and the weight vector is obtained and is as follows:
w = ( w 1 , w 2 , , w m ) τ  
Thirdly, according to the comprehensive evaluation index y i ( t k ) , conduct a comprehensive evaluation:
y i ( t k ) = j = 1 m W j X i j ( t k )

4. Results

4.1. Basic Topological Properties of the Host Country Network of Chinese Enterprise OFDI

According to the data from the follow-up survey conducted by the American Enterprise Institute and the Heritage Foundation, there were more than 1600 OFDI projects in China, with a total amount of more than 120 billion US dollars from 2005 to 2019. Since 2010, the investment industry has remained stable at about 12 years. Figure 2 shows the changes in the number of network nodes in the host country over the 15 years ranging from 2005 to 2019. The number of network nodes in the host country increased from 11 to 46, with a peak of 57 (Figure 2). The average degree is congruent with the changing trend of the number of nodes that increased steadily before 2012 and reached a peak in 2016 after declining in 2013. It can be seen from this that the scope of countries where Chinese enterprises invest directly abroad is continuously expanding. The maximum value of a single node increased from 5 to 53 at first, because the number of investment countries involved in the same industry is increasing, and the expansion of the scope of investment countries is conducive to the spread of investment risks in our country. Additionally, as there are only one or two countries or regions where Chinese enterprises invest overseas, one class of nodes will appear in the host country network after visualizing the countries of the current year’s Chinese enterprise OFDI on the basis of the same industry, i.e., lonely nodes. From 2005 to 2019, there will be 2 to 3 nodes or a pair of interconnected lonely nodes in more than half of the years, accounting for less than 11.9% of the total number of nodes in that year.
Figure 3 shows the changes in the number of host country network edges over the past 15 years from 2005 to 2019. Comparing Figure 2 and Figure 3, it is found that the change direction of the number of edges and the number of nodes graph is almost the same, both of which started to show a steady upward trend in 2005, increased to a peak in 2016, and decreased in the next 3 years. This indicates that the increase and decrease of links between the host country and the host country of OFDI were all generated in the previous year, with the increase in the number of host countries invested in the same industry, the number of host country network nodes increased, and the links between nodes also increased.

4.2. The Host Network Agglomeration Effect and Community Analysis

In calculating the C i of China’s OFDI host country network, it can be observed in Figure 4 that C i is above 0.8, and the average path is within 2, indicating that China’s OFDI host country network countries have always maintained the small-world network characteristics, with good connectivity between nodes and easy spillovers between countries [37].

4.3. Chinese Enterprises OFDI Host Network Community Structure Analysis

In general (Figure 4), the modularity of important indicators of community division is generally low, reaching 0.474 in 2006. The lowest was 0.164 in 2009. According to Zhang et al., (2012)’s [11] point of view, under the premise of the same number of nodes, the higher the degree of modularity, the more the number of communities will be.
In 2005 and 2006, there were no connections between communities. In 2007, there were a few connections between communities and the largest number of communities was six (Figure 4), because the OFDI of Chinese enterprises from 2005 to 2007 was concentrated in energy and metals. Even if there are investments in other industries, most of them coincide with countries with energy or metals, and occasionally involve countries in which non-energy and metals are invested in, which is a rare phenomenon. This also leads to lonely nodes in the OFDI complex network. For example, in 2005, the node of the UK in the network was a lonely node, because China’s investment in the UK only involved the transport industry, while the transport industry only invested in the UK in the same year (Figure 5a).
Note: For reasons of space, only the results of community division in 2005, 2008, and 2019 are listed here to show the changes of the community division. In Figure 5a, purple and green represent two communities, respectively, and the two graph with different colors are separated without edges. Meanwhile, there are two nodes outside the two graphs, indicating that there were two separate nodes in 2005. Figure 5b compared with Figure 5a, the changes are more apparent, although the community of Figure 5b is also divided into three communities, with blue, red, and yellow. There were few edges between the blue and red communities; at the same time, two yellow nodes were individually connected to form an independent community. The phenomenon of the solitary node as an independent community begins to disappear. As compared with Figure 5b, it can be seen that Figure 5c has more edges between the communities. although it can be seen from the color that it is divided into three communities (represented by green, purple, and orange, respectively). The change of network community structure in the host country from 2005 to 2019 indicates that OFDI of Chinese enterprises is developing towards the direction of industry diversification and national diversification.

4.4. Chinese Enterprises OFDI Host Country Network Node Analysis

Although the OBOR initiative was put forward in 2013, in order to compare and analyze the changes of Chinese enterprises’ investment in the countries along the OBOR from the perspective of investment location, this paper classifies the countries along the OBOR from their geographical locations. According to Figure 6, it can be observed that the number of countries that China invests along the OBOR route is increasing, which indicates that the OBOR strategy plays a guiding role in the OFDI of Chinese enterprises.
Based on the original data, China’s investment in countries along the OBOR mainly involves energy, metals, real estate, transportation, science and technology, and other industries. Energy investment is concentrated in Russia and Western Asia, the Middle East, with natural gas, oil, and coal as the main investment. Investment in metals is mainly in Indonesia, which is rich in metal reserves, especially iron ore and aluminum, which is also China’s major investment area in the country. As a rising star in the field of OFDI by Chinese enterprises, the real estate industry is dominated by developed countries or regions, such as the United States, UK, Germany, Australia, and other countries. OBOR countries mainly invest in Singapore, Indonesia, Malaysia, amongst others, but the number of investment projects is relatively small. Investment in the science and technology industry is mainly in telecommunications with China Mobile, China Unicom, and Huawei as the main investors. Investment in the transportation industry is mainly in automobiles, followed by maritime transportation and railway in aviation, which is concentrated in East Asia. Other industries mainly invest in East Asia and mainly in consumption and textile.
Arranging the source of Chinese OFDI by continent, we can see in Figure 7 that OFDI is mainly concentrated in Asia (excluding some countries in the Middle East), mainly in East Asia and West Asia. Among which ASEAN countries, Pakistan and Uzbekistan are the major investment countries of Chinese enterprise OFDI. Investments in energy and metals is significantly higher than investments in science and technology, agriculture, real estate, and tourism. By contrast, China’s investment in Europe has shown fluctuating growth in the past 15 years, mainly including Russia, UK, Germany, France, and other countries. Particularly, UK has the largest amount of investments in that every year, it receives more than US$1 million of Chinese investment projects, with the minimum amount of US$1 billion. The industries involved include finance, agriculture, energy, tourism, science and technology, logistics, health, and the service industry. However, China’s million-dollar investment projects in Russia mainly focus on energy. Although it also involves industries such as real estate and science and technology, the amount of investment in energy is much higher than other industries. The investment regions after Europe are the Americas and sub-Saharan Africa. China’s investment in the Americas is concentrated in the United States, Canada, Peru, Brazil, and Argentina, of which the United States has the largest amount of investment in all industries, with a minimum investment of US$1.7 billion in 2005 and a maximum investment of US$50 billion in 2016. A total of 14 industries are involved, where service industries dominate.

4.5. The Host Country Network Node Importance Analysis

In this paper, the network analysis software Gephi is used to calculate the node degree value, eigenvector centrality, closeness centrality, and betweenness centrality in each year. Due to the large gap between the values of the indicators, in order to facilitate the subsequent analysis and calculation, the degree value is compared with the betweenness centrality index as follows:
D C i = k i n 1
R B C i = 2 B C i n 2 3 n + 2   ( i = 1 , 2 , , n )
where k i is the degree value of node i, B C i is the betweenness centrality of country node i to obtain degree centrality and relative [38]. The centrality of the four indicators considers that the higher the degree value of the node, the more actively it can evaluate the importance of the node from the perspective of the node itself. Eigenvector centrality is estimated from the perspective of neighboring nodes where the node’s neighbors are considered to be more important, though the node itself is of course crucial. In contrast, closeness centrality is estimated from the position of the node and the closer the node is to the center, the greater its importance. Relative betweenness closeness regards nodes as bridges in that it controls the flow of information between nodes [37]. The top 10 countries in the ranking of the four indicators cover a wide range of areas. Under different indicators in different years, countries rank differently, but Australia, Brazil, the UK, the United States, Singapore, Indonesia, Russia, Canada, and other countries consistently rank higher.
From the perspective of degree centrality, nodes with high degree centrality also have high degree value. Judging from the single-year value of degree centrality, it is found that at most, a dozen countries and at least two countries have the same degree centrality value, and there are many countries with the same degree centrality before 2012. The main reason for this is that China has only one industry in some host countries, which results in the same degree centrality. However, this situation was more noticeable before 2012 as when Chinese enterprises invested overseas, they mainly concentrated in important industries such as energy and metals, and most host countries involved a relatively single industry.
From the perspective of centrality numerical ranking, in the host country network of Chinese enterprises’ OFDI, the countries with the highest-ranking times in a single year are mainly Australia, the United States, Canada, Indonesia, UK, Brazil, Russia, India, and Kazakhstan. The United States and Australia not only appear more frequently, and their ranking average is significantly smaller than other countries, only 2.42, but the ranking average of other countries is above 4, indicating that the United States and Australia are important facets of China’s OFDI, and not only in these major industries, but also in industries with more investment countries.
From the perspective of the environment in which the nodes are located, and from the perspective of relative eigenvector centrality, the Philippine neighbor nodes had the greatest influence in 2019, including the United States, Germany, Russia, Singapore, Australia, Indonesia, and other countries, with a total of 36 countries and regions. The United States, Russia, New Zealand, Australia, and India all belong to the nodes with high degree of value and great influence. Due to the great influence of the neighboring nodes, the Philippine node has high eigenvector centrality, but the largest Philippines eigenvector belongs to an individual phenomenon. Observing the centrality of eigenvectors of all countries in the investment network from 2005 to 2019, the results show that Australia, the UK, the United States, Russia, Brazil, and Indonesia are still ranked in the top 10. Combining degree centrality with eigenvector centrality, we can preliminarily judge that Australia, the United States, UK, Russia, Brazil, and Indonesia are important host countries of Chinese enterprises OFDI.
Judging from the ability of a single node to control the dissemination of information, the United States is the largest. From 2005 to 2019, the United States occupied the top three relative positions in the host country network of Chinese enterprises OFDI, which is in line with the position of the United States as a superpower in the world economy. Moreover, China’s large-scale direct investment projects in the United States involve the largest number of industries, reaching six in 2019 and ranking ninth in the amount of investment. The influence of the United States itself, together with China’s investment in the United States, makes the United States the node with the greatest influence on the neighboring nodes among all nodes. In addition, compared with the other three indicators, the relative betweenness indicator shows that there are multiple countries with nodes with relative betweenness centrality of 0, while the relative betweenness centrality of nodes in the host country network in 2005 and 2006 was all 0. The reason is that China’s investment in these countries involves only one industry investment, which results in these nodes becoming marginal nodes and has no impact on nodes in other countries. That is, in 2005 and 2006, Chinese enterprises’ outward direct investment in one country only involves a single industry investment. After 2007, with more and more enterprises’ OFDI, the number of industries invested by individual countries has also increased.
Judging from the location of nodes (i.e., the closeness centrality index), countries such as Philippines, Russia, Singapore, Australia, and Indonesia were core nodes of OFDI host network in 2019. They were located at the core of the network and were closest to other nodes in the network. Compared with non-core nodes, these nodes had stronger information dissemination ability and greater influence. Based on the analysis of degree centrality, eigenvector centrality, relative betweenness centrality, and closeness centrality, the network nodes of the host country of OFDI are sorted, and the final results are slightly different. However, it is not difficult to find that countries such as Australia, the United States, the UK, Russia, Singapore, and Brazil have a higher frequency in the top 10 rankings. Therefore, we can initially conclude that these countries are the important countries for Chinese enterprises’ OFDI from 2005 to 2019.

4.6. Comprehensive Evaluation Index Analysis

The data used in this study is the data of China’s enterprise OFDI project from 2005 to 2019 and OFDI involves a total of 130 countries or regions. Countries with investment years of more than 10 years include 16 countries such as Australia and the UK, while 33 countries have only one-year investment. Due to the fact that the countries of overseas investment are not exactly the same each year, using complex network analysis, only the ranking results of host country nodes can be obtained each year, thus some abnormal nodes may appear, and important nodes may be easily ignored. For example, in 2019, the Philippines ranked first in the comprehensive ranking. By analyzing all China’s investments in the country, it can be found that only 2 years of investment are available. Although the Philippines is an important host country, but from a long-term perspective, it is not important to China’s OFDI. Therefore, this paper analyzes the host country of OFDI from both single year and 15-years perspectives. Through horizontal analysis, it obtains the important countries in the host country network of OFDI of Chinese enterprises each year. Through longitudinal analysis, some abnormal nodes during the period of 2005–2019 are removed, and the major countries of China’s OFDI are analyzed in time.
Taking the four indexes of degree centrality, eigenvector centrality, relative betweenness centrality, and closeness centrality of the annual OFDI host country network analysis from 2005 to 2019 are used as the basic indicators, after the non-dimensional processing, the following 4 × 4 matrix can be obtained:
X k = [ X 11 ( t k ) X 14 ( t k ) X n 1 ( t k ) X n 4 ( t k ) ] ,   k = 1 , 2 , , T
Then construct the corresponding 4 × 4 symmetric matrix:
H k = X k τ X k ( k = 1 , , T )
Perform matrix calculation to find the maximum eigenvalue of H k λ m a x ( H k ) and the corresponding (normalized) eigenvector that is the weight coefficient vector w k , and substitute the weight coefficient into the comprehensive index function:
y i ( t k ) = j = 1 m W j X i j ( t k )
where k = 1 , 2 , , 15 and i = 1 , 2 , , n . n is the number of OFDI host countries in China’s enterprises that year.
Four central indicators are adopted to obtain the comprehensive indicators of each node through the above method, and the annual comprehensive indicators are sorted (for brevity, only the top five countries in the ranking of that year are given in Figure 8).
Through an annual comprehensive index analysis, excluding 2007, it was found that during 2005–2009, in the ranking of network nodes of the host countries of OFDI, there were multiple countries with the same comprehensive score and the same ranking. For example, in 2005, there were only 4 ranking among 11 countries, among which 4 ranked first in parallel (Figure 8). In 2009, Chad, Switzerland, and 13 other countries had the same rank because in recent years, Chinese enterprises of OFDI involved fewer industries such as energy and metals. It is not common for more than two industries to be invested in within the same country. As a result, some countries only received investment from in the same industry (most of them only invest in energy or metals). These countries have the same values as the importance indicators of network nodes, and the ranking results are also the same.
From 2010 onwards, although some countries have the same ranking, compared with before 2009, they ranked outside the top 10. Within the top 10, the ranking is clear because from 2010 onwards, the number of Chinese enterprises’ OFDI industry investments and the categories of industries invested in involved in the same host country also increased. As a result, the importance of countries involved in investment in multiple industries was highlighted, while countries with only one industry were gradually marginalized. The top five countries of China’s OFDI are Australia, the United States, Canada, Brazil, Russia, and the UK. In 2005, many countries tied for the top spot, but there has been a significant change since 2006, Australia took the top spot in 2007, 2008, 2014, 2015, and 2016. The United States and Brazil also took the top spot for 3 years (Figure 8). It can be seen that the top position is occupied by Australia, the United States, and Brazil. Therefore, Australia, the United States, Canada, Brazil, Russia, and other countries are the most important countries in China’s OFDI host country network in a single year. These countries are not only the major countries in China’s key investment industries, but also possess the largest number of industries involved in investment. They also have the greatest influence on other node countries associated with them. In order to further verify this conclusion, we continue to use the “scatter degree” method to mine the important host countries of China’s OFDI from the perspective of time series.
Using the “scatter degree” method, taking the median of the 15 years from 2005 to 2019 as the boundary, and excluding the countries with investment years less than 8 years and these were selected based on a standard of 15.5%, because this part is an important host country of China’s OFDI from a time perspective, the countries with too few years of investment must be less important than the countries with too many years/this led to a dataset of 25 countries (Table 2).
Through calculation, the ranking results of 25 countries from 2005 to 2019 are obtained. According to Table 2, it is not difficult to see that Chinese enterprises’ OFDI is mainly in Asian countries, 11 out of 25 countries are Asian countries, and 7 countries are European countries (not shown for brevity). Judging from the overall results of importance ranking, Australia, the United States, Brazil, and Canada are the most important countries. These four countries not only once ranked among the top three countries in a single year, but also had relatively small ranking differences, median, average and variance, indicating that their ranking results have fluctuated less than other countries in the past 15 years. In particular, Australia has been in first place for many years, with the smallest ranking average and variance. Moreover, Chinese enterprises have the most years of investment in Australia and the highest total investment and average annual investment. Therefore, in the long run, Australia is the most important host country for China’s OFDI. China’s investment in Australia is mainly in traditional energy and metal industries, followed by real estate, health and agriculture. Australia is the third largest host country for China’s energy investment and the first host country for coal investment. Apart from the energy industry, Australia is also the first country to invest in China’s agriculture. Chinese enterprises mainly invest in the Australian dairy industry in Australia. Main investors include Mengniu, Guangming, and other dairy enterprises.
The comprehensive vertical and horizontal analysis results show that Australia and the United States are in the first echelon of the host countries of Chinese enterprises OFDI, and both Australia and the United States rank first in terms of single-year ranking results and 15-year ranking results. This is closely related to the largest number of industries and amounts invested by Chinese enterprises in Australia and the United States. Direct investment in Australia involved chemical industry and steel industry in 2005, and most involved nine industries including agriculture, energy, entertainment, finance, health, iron and steel, real estate, science and technology, and transportation.
During the 15 years from 2005 to 2019, investment in Australia involved the largest number of industries, and almost all industries had investments, with the total investment amount only lower than that of the United States. However, unlike the United States, Chinese enterprises concentrated their investment in the energy and steel industries with a large number of times and a large amount. Brazil, Canada, Russia, Indonesia, and the UK are in the second tier, while Singapore, Germany, and Malaysia are in the third tier. Through the above analysis, it can be observed that the OFDI of Chinese enterprises is mainly concentrated in the resource-based industries. These include Australia, the United States, Brazil, Canada, Russia, and Indonesia which are rich in energy or steel. Investments in resource-poor countries such as the UK, Germany, France, and Singapore are mainly related to the service industry.

5. Conclusions and Recommendations

This paper analyzes the host country network of OFDI from 2005 to 2019 by using the methods of complex network and the improved “scatter degree” method. The study found that from 2005 to 2019, the areas and industries in which Chinese enterprises invested in OFDI were more and more extensive. From 2005, the number of countries increased from 11 to 46. The number of industries involved also changed from 5 to 14. The increasing cross-investment of various industries in different countries led to the gradual blurring of the community division of the host country network of Chinese enterprises in OFDI. In terms of investment region, the investment in countries taking part in the OBOR has increased significantly in the past 15 years from 2005 to 2019, not only in investment projects, but also in the number of host countries involved. From a regional perspective, Asian investment the most important facet of OFDI. From a national perspective, China has a large number of developed countries as the important host countries for outward direct investment.
According to the analysis of the host country network of China’s OFDI, the host country network maintained the characteristics of a small-world network from 2005 to 2019. In contrast, the path of information dissemination in small world networks is shorter than in non-small world networks, so there is a high probability that an attack against a key country outside the network will be transmitted to other countries, which can easily create network problems and show the vulnerability of the network.
Through the complex network and the improved “scatter degree” method, the analysis found that Australia, the United States, Brazil, Canada, Russia, Indonesia, and the UK are other key countries for Chinese enterprises’ OFDI. From a regional perspective, the major countries for Chinese enterprises’ OFDI investment are mainly concentrated in North America, Europe, and Southeast Asia. This finding is in line with other researchers who have argued, for example, that geographical distance and economic distance significantly promote Chinese OFDI. Chinese OFDI has a strong natural resource seeking motive, and in order to access natural resources, Chinese firms will overcome geographical distance and cultural differences to make OFDI in countries far from China [4].
Through the previous study, we believe that the government should pay attention to the maintenance of diplomatic relations with important host countries to reduce the risks of investment. It should also strengthen the service function of the “going out” public service platform to provide Chinese enterprises with more comprehensive information services and guide their investment behavior.

Author Contributions

Conceptualization, X.Z.; methodology, X.Z. and D.T.; formal analysis, X.Z. and B.J.B.; investigation, X.Z. and D.T.; resources, X.Z.; data curation, X.Z.; writing—original draft preparation, X.Z. and B.J.B.; writing—review and editing, X.Z., B.J.B. and D.T.; visualization, X.Z. and B.J.B.; supervision, D.T.; funding acquisition, D.T. All authors have read and agreed to the published version of the manuscript.

Funding

This research was funded by The Open Fund of the China Institute of Manufacturing Development, Nanjing University of Information Science and Technology, China, grant number SK2020-0090-11.

Institutional Review Board Statement

Not Applicable.

Informed Consent Statement

Not Applicable.

Data Availability Statement

The data come from The American Enterprise Institute and The Heritage Foundation (https://www.aei.org (accessed on 1 May 2020)).

Acknowledgments

Thanks are extended to The American Enterprise Institute and The Heritage Foundation for providing data for this research.

Conflicts of Interest

The authors declare no conflict of interest.

References

  1. Hong, J.; Zhou, C.; Wu, Y.; Wang, R.; Marinova, D. Technology Gap, Reverse Technology Spillover and Domestic Innovation Performance in Outward Foreign Direct Investment: Evidence from China. China World Econ. 2019, 27, 1–23. [Google Scholar] [CrossRef]
  2. Wang, F.; Liu, J.; Su, C. Outward Foreign Direct Investment and Export Performance in China. Can. Public Policy 2017, 43, S72–S87. [Google Scholar] [CrossRef] [Green Version]
  3. Ren, X.; Yang, S. Empirical study on location choice of Chinese OFDI. China Econ. Rev. 2020, 61, 101428. [Google Scholar] [CrossRef]
  4. Chen, Y.; Zhai, R.; Zhang, K.H. Natural Resources and Foreign Direct Investment in Africa: Evidence from Chinese Firms. Sustainability 2020, 22, 9616. [Google Scholar] [CrossRef]
  5. Yang, T.; Dong, Q.; Du, Q.; Du, M.; Dong, R.; Chen, M. Carbon dioxide emissions and Chinese OFDI: From the perspective of carbon neutrality targets and environmental management of home country. J. Environ. Manag. 2021, 295, 113120. [Google Scholar] [CrossRef]
  6. Gugler, P.; Lattemann, C.; Professor, W.; Zhang, D.; Vanoli, L. Technology-sourcing investment abroad as an enhancer of Chinese MNEs’ innovative capabilities. Int. J. Emerg. Mark. 2015, 10, 243–271. [Google Scholar] [CrossRef]
  7. Yao, S.; Zhang, F.; Wang, P.; Luo, D. Location Determinants of China’s Outward Foreign Direct Investment. China World Econ. 2017, 25, 1–27. [Google Scholar] [CrossRef]
  8. Ramasamy, B.; Yeung, M.; Laforet, S. China’s outward foreign direct investment: Location choice and firm ownership. J. World Bus. 2012, 47, 17–25. [Google Scholar] [CrossRef]
  9. Shah, S.H.; Kamal, M.A.; Hasnat, H.; Jiang, L.J. Does institutional difference affect Chinese outward foreign direct investment? Evidence from fuel and non-fuel natural resources. J. Asia Pac. Econ. 2019, 24, 670–689. [Google Scholar] [CrossRef]
  10. Buckley, P.J.; Clegg, L.J.; Cross, A.R.; Liu, X.; Voss, H.; Zheng, P. The Determinants of Chinese Outward Foreign Direct Investment. J. Int. Bus. Stud. 2007, 38, 499–518. [Google Scholar] [CrossRef]
  11. Zhang, X.; Newman, M.E. Multiway spectral community detection in networks. Phys. Rev. E Stat. Nonlin. Soft. Matter Phys. 2015, 92, 052808. [Google Scholar] [CrossRef] [PubMed] [Green Version]
  12. Zheng, B.; Wang, Y. The influence of cultural and institutional distance on China’s OFDI efficiency: Fresh evidence from stochastic frontier gravity model. Int. J. Emerg. Mark. 2020. [Google Scholar] [CrossRef]
  13. Wang, J.; Wei, Y.D.; Lin, B. Functional division and location choices of Chinese outward FDI: The case of ICT firms. Environ. Plan. A Econ. Space 2020, 53, 937–957. [Google Scholar] [CrossRef]
  14. Yu, S.; Qian, X.; Liu, T. Belt and road initiative and Chinese firms’ outward foreign direct investment. Emerg. Mark. Rev. 2019, 41. [Google Scholar] [CrossRef]
  15. Marks-Bielska, R.; Nazarczuk, J.M.; Rogalska, I. Institutions versus location of new firms: Does distance matter? Evidence from the Polish economy. Econ. Res. Ekon. Istraž. 2021, 1–21. [Google Scholar] [CrossRef]
  16. Wei, Y.; Zheng, N.; Liu, X.; Lu, J. Expanding to outward foreign direct investment or not? A multi-dimensional analysis of entry mode transformation of Chinese private exporting firms. Int. Bus. Rev. 2014, 23, 356–370. [Google Scholar] [CrossRef] [Green Version]
  17. Yan, B.; Zhang, Y.; Shen, Y.; Han, J. Productivity, financial constraints and outward foreign direct investment: Firm-level evidence. China Econ. Rev. 2018, 47, 47–64. [Google Scholar] [CrossRef]
  18. Li, L.; Liu, X.; Yuan, D.; Yu, M. Does outward FDI generate higher productivity for emerging economy MNEs?—Micro-level evidence from Chinese manufacturing firms. Int. Bus. Rev. 2017, 26, 839–854. [Google Scholar] [CrossRef] [Green Version]
  19. Xin, D.; Zhang, Y. Threshold effect of OFDI on China’s provincial environmental pollution. J. Clean. Prod. 2020, 258. [Google Scholar] [CrossRef]
  20. Jiang, H.; Jiang, P.; Kong, P.; Hu, Y.-C.; Lee, C.-W. A Predictive Analysis of China’s CO2 Emissions and OFDI with a Nonlinear Fractional-Order Grey Multivariable Model. Sustainability 2020, 12, 4325. [Google Scholar] [CrossRef]
  21. Qiao, P.; Lv, M.; Zeng, Y. R&D Intensity, Domestic Institutional Environment, and SMEs’ OFDI in Emerging Markets. Manag. Int. Rev. 2021, 60, 939–973. [Google Scholar] [CrossRef]
  22. Wu, Y.; Song, Y.; Deng, G. Institutional Environment, OFDI, and TFP Growth: Evidence from China. Emerg. Mark. Financ. Trade 2017, 53, 2020–2038. [Google Scholar] [CrossRef]
  23. Ravishankar, G.; Stack, M.M. The Gravity Model and Trade Efficiency: A Stochastic Frontier Analysis of Eastern European Countries’ Potential Trade. World Econ. 2014, 37, 690–704. [Google Scholar] [CrossRef] [Green Version]
  24. Luo, L.; Qi, Z.; Hubbard, P. Not looking for trouble: Understanding large-scale Chinese overseas investment by sector and ownership. China Econ. Rev. 2017, 46, 142–164. [Google Scholar] [CrossRef] [Green Version]
  25. Qi, Y.; Rao, G.; Gong, D. Institutional Risk Preference and Asymmetric Role of Institutional Distance: An Examination on the OFDI of China. Discret. Dyn. Nat. Soc. 2021, 2021, 1–12. [Google Scholar] [CrossRef]
  26. Watts, D.J.; Strogatz, S.H. Collective dynamics of ‘small-world’ networks. Nature 1998, 393, 440–442. [Google Scholar] [CrossRef]
  27. Barabási, A.-L.; Albert, R. Emergence of Scaling in Random Networks. Science 1999, 286, 509–512. [Google Scholar] [CrossRef] [Green Version]
  28. Noroozi, R.; Dinger, M.E.; Fatehi, R.; Taheri, M.; Ghafouri-Fard, S. Identification of miRNA-mRNA Network in Autism Spectrum Disorder Using a Bioinformatics Method. J. Mol. Neurosci. 2021, 71, 761–766. [Google Scholar] [CrossRef]
  29. Khoshnevisan, L.; Liu, X.; Salmasi, F.R. Predictive sliding-mode congestion control for wireless access networks with singular and non-singular control gain. IET Control. Theory Appl. 2020, 14, 1722–1732. [Google Scholar] [CrossRef]
  30. Devikar, R.N.; Patil, D.V.; Prakash, V.C. A hybrid computing approach to improve convergence time for scalable network. Sādhanā 2020, 45. [Google Scholar] [CrossRef]
  31. Kawazoe, T.; Sosa, S. Social networks predict immigration success in wild Japanese macaques. Primates 2019, 60, 213–222. [Google Scholar] [CrossRef]
  32. Jarrahi, M.H.; Sawyer, S. Networks of innovation: The sociotechnical assemblage of tabletop computing. Res. Policy X 2019, 1, 100001. [Google Scholar] [CrossRef]
  33. Li, J.; Shi, Y.; Cao, G. Topology structure based on detrended cross-correlation coefficient of exchange rate network of the belt and road countries. Phys. A Stat. Mech. Appl. 2018, 509, 1140–1151. [Google Scholar] [CrossRef]
  34. Souza, T.T.P.; Aste, T. Predicting future stock market structure by combining social and financial network information. Phys. A Stat. Mech. Appl. 2019, 535, 122343. [Google Scholar] [CrossRef] [Green Version]
  35. Yanikkaya, H.; Karaboga, H.; Altun, A. Implications of participation in global value chains for international trade network. Appl. Econ. Lett. 2020, 28, 1169–1173. [Google Scholar] [CrossRef]
  36. Liu, Z.; Xiao, Y.; Jiang, S.; Hu, S. Social entrepreneurs’ personal network, resource bricolage and relation strength. Manag. Decis. 2020. [Google Scholar] [CrossRef]
  37. Wang, X.; Li, X.; Chen, G. Network Science: An Introduction; Higher Education Press: Beijing, China, 2012; pp. 46–398. (In Chinese) [Google Scholar]
  38. Liu, J. Lectures on Whole Network Approach; Shanghai People’s Press: Shanghai, China, 2014; pp. 78–257. (In Chinese) [Google Scholar]
  39. Newman, M.E.J.; Girvan, M. Finding and evaluating community structure in networks. Phys. Rev. E 2004, 69, 1–15. [Google Scholar] [CrossRef] [PubMed] [Green Version]
  40. Newman, M.E.J. Modularity and community structure in networks. Proc. Natl. Acad. Sci. USA 2006, 103, 8577–8582. [Google Scholar] [CrossRef] [Green Version]
  41. Zheng, Z.-H.; Yu, Y.-X. Improvement of the vertical “scatter degree” method and its application in evaluating water environmental carrying capacity. Technol. Cienc. Agua 2017, 8, 71–76. [Google Scholar] [CrossRef]
Figure 1. China Enterprise OFDI Host Country Network (2019).
Sustainability 13 09824 g001
Figure 2. Number and average degree of nodes in OFDI Host Country Network from 2005 to 2019.
Sustainability 13 09824 g002
Figure 3. Number of OFDI Host Network Sides from 2005 to 2019.
Sustainability 13 09824 g003
Figure 4. Basic Characteristics of OFDI Host Country Network from 2005 to 2019.
Sustainability 13 09824 g004
Figure 5. Result chart of community division in (a) 2005, (b) 2008, and (c) 2019.
Sustainability 13 09824 g005
Figure 6. Regional distribution Chinese enterprises’ OFDI from 2005 to 2019.
Sustainability 13 09824 g006
Figure 7. Distribution of OFDI by continent for Chinese enterprises in 2005–2019.
Sustainability 13 09824 g007
Figure 8. Top five OFDI host nodes from 2005 to 2019. Note: The year and figure in the parentheses represent the ranking of the host node in the current year. For example, 2010 (3) in the United States indicates that the United States ranked third in the ranking of nodes in 2010.
Sustainability 13 09824 g008
Table 1. Time series stereo data.
t 1 t k
S 1 X 11 ( t 1 ) X 12 ( t 1 ) X 1 m ( t 1 ) X 11 ( t k ) X 12 ( t k ) X 1 m ( t k )
S 2 X 21 ( t 1 ) X 21 ( t 1 ) X 2 m ( t 1 ) X 21 ( t k ) X 21 ( k ) X 2 m ( t k )
⋮⋮
S n X n 1 ( t 1 ) X n 2 ( t 1 ) X n m ( t 1 ) X n 1 ( t k ) X n 2 ( t k ) X n m ( t k )
Table 2. Ranking of major countries for OFDI by Chinese enterprises.
2005–2019 Ranking Comprehensive Score and Rank
HighestLowestAverageMedianVarianceScoreRanking
Australia192.822.1813.081
USA110432.8812.212
Brazil194.852.6011.053
Indonesia2206.564.5810.634
Canada1165.443.489.995
UK1176.645.019.616
Russia1207.2775.188.437
Germany3178.6774.568.398
Singapore120976.088.379
India12310.0786.697.8710
Malaysia2209.0775.367.5011
Pakistan4179.73103.757.4712
France11910.27115.687.4413
Italy12410.93116.577.3614
Kazakhstan12110.696.706.2515
South Korea42112.33135.525.4616
South Africa32512.33127.085.4217
Cambodia32511.8107.435.3018
Laos42311.67106.495.1619
Switzerland42313.4147.035.0120
Thailand42313.2146.294.9421
Peru42413.13126.654.7622
Spain42213.27155.974.4423
Netherlands42113.73155.903.9724
Congo32413.87167.193.9525
Publisher’s Note: MDPI stays neutral with regard to jurisdictional claims in published maps and institutional affiliations.

