Article

Effects of Controlled Drainage on the Content Change and Migration of Moisture, Nutrients, and Salts in Soil and the Yield of Oilseed Sunflower in the Hetao Irrigation District

College of Water Conservancy and Civil Engineering, Inner Mongolia Agricultural University, Hohhot 010018, China
*
Author to whom correspondence should be addressed.
Sustainability 2021, 13(17), 9835; https://doi.org/10.3390/su13179835
Submission received: 5 July 2021 / Revised: 22 August 2021 / Accepted: 29 August 2021 / Published: 1 September 2021

Abstract

:
Controlled drainage (CD) is an important agricultural measure for maintaining soil moisture and nutrients, controlling groundwater level, and increasing crop yield. In arid regions, CD can be used to improve the water supply in agriculture and reduce environmental pollution. In this study, we investigated the effects of CD, including drainage depths of 40 cm (CWT1) and 70 cm (CWT2) during the plant growth stages, free drainage (FD), and open-ditch drainage (OD), on the migration of water, nutrients, and salts in the soil, the dynamics of the groundwater level, the loss of soil nitrogen, and the growth of oilseed sunflower plants. Compared with FD, CD increased the water and nutrient content in the soil, reduced nitrogen loss, and enhanced the ability of the soil to continuously supply nitrogen to the oilseed sunflower plants, which benefited plant growth at later growth stages and reduced environmental pollution. During the period between irrigation at the budding stage and the harvest stage, the average soil water content in the 0–20 cm soil layer in CWT1 increased by 3.67%, 4.78%, and 0.55%, respectively, compared with that in CWT2, FD, and OD. The soil mineral content in CWT1 was 25.17%, 35.05%, and 17.78% higher than that in CWT2, FD, and OD, respectively, indicating that higher soil salinity occurred at the later stage of plant growth in CWT1, which actually had little effect on the plants due to their enhanced salt tolerance and increased need for water and nutrients at that stage. In addition, CD delayed the decline in groundwater level, which allowed the plants to use groundwater at later growth stages, and as a result, the yield and water-use efficiency were improved. CWT1 significantly increased oilseed sunflower yield by 4.52–11.14% and increased water-use efficiency by 1.16–10.8%. Moreover, CWT1 also increased the survival rate of the oilseed sunflower plants by 2.62–2.92%, and the plants demonstrated good growth. Therefore, under CD conditions, plants used soil water and nitrogen more efficiently and, as a result, their productivity was increased, and the water quality was improved.

1. Introduction

Controlled drainage has a long history of use and is widely applied globally [1,2,3,4]. In arid and semi-arid regions, soil salinization can be prevented by drainage. In humid and semi-humid regions, excessive water can be drained away to reduce the risk of yield loss, allowing farmers to cultivate a greater variety of crops. In temperate regions, drainage facilitates the reclamation of flood-stricken areas and provides better growth conditions for crops [5]. In most cases, surface drainage not only causes an increase in agricultural production, but in many countries, it also leads to a reduction in retention and water loss, and it is ineffective in the event of a flood. The advancement of science and technology and the increasing attention to agriculture have encouraged the wide application of subsurface drainage technology in agricultural production [6]. However, underground drainage has an adverse effect on surface water quality, and the excessive nutrients cause environmental pollution [7]. Underground drainage systems have been identified as the main sources of nutrients, as well as pollutants [8]. Nutrients, herbicides, and pesticides are discharged from the soil body through drainage, which reduces nutrient utilization efficiency and results in environmental pollution [9]. The issues associated with environmental protection and soil pollution have attracted increasing attention. In addition to the use of subsurface pipes to reduce soil salinization and discharge excessive water to provide a suitable environment for crops, minimizing the unnecessary adverse effects of a drainage system on hydrology and water quality has become a main goal for the development of new drainage systems [10,11]. Controlled drainage (CD) is considered to be a sustainable management method that can be used to save water, decrease nutrient leaching, reduce drought stress, and increase yield, and it has therefore become a prospective trend in agricultural production.
In arid areas, controlled drainage has become increasingly popular in the treatment of saline soil due to its advantages, which include lower land space requirements, low pollution, long durability, stability, no weeds, lower labor requirements, less earthwork, easy management, operation, and maintenance, and convenience of mechanized construction [12]. Studies have shown that soil salinization is one of the major causes of the decline of agricultural productivity in many arid and semi-arid regions in the world [13,14]. In most cases, conventional irrigation and crop management measures cannot reduce soil salinity [15], so using subsurface drainage to reduce soil salinization offers a solution. In the second half of the 20th century, subsurface drainage was widely introduced in many parts of the world [16]. Ghumman et al. [17] reported that the long-term use of subsurface drainage effectively reduced soil salinity, reduced the area of saline soil by 10–40%, and increased social and economic benefits by 1.8–2.5%. A study performed by Ali et al. [18] showed that subsurface drainage removed large amounts of salts from the soil. In the first three years after subsurface drainage was introduced, the soil salinity decreased linearly. The same result was obtained in a newly salinized area, whereby saline soils were reduced from 75% to 30% within four years, and the soil salinity was expected to decline further. The study performed by Li et al. [19] indicated that if the groundwater was maintained at a level suitable for crop growth by using an engineered drainage system, the salts in the soil could be well balanced under natural rainfall conditions. The appropriate management of groundwater levels using a drainage system enables crops to effectively use groundwater and promotes the leaching of soil salinity through natural rainfall, thereby increasing water-use efficiency.
CD refers to the use of a control device to raise or lower the drainage outlet in order to adjust the draining intensity to meet the requirements of the agricultural field. CD can be used to maintain a higher groundwater level during the growing season, thus making it easier for crops to absorb and utilize shallow groundwater and nutrients at critical growth stages; meanwhile, it reduces the discharge of soil chemicals and nutrients, thereby facilitating environmental protection. In arid areas, a key issue that needs to be resolved is how to maintain the balance between water and salt in the field during the CD process [20]. It is also very important to understand the migration of soil water and salts during the process. CD with subsurface pipes is a new management measure for farmland drainage, and a number of studies have shown that this measure is able to lower the amount of water drained away from farmlands, thereby reducing the amount of nitrogen lost [11,21,22]. A study conducted by Wang et al. [21] indicated that the implementation of CD reduced the loss of N O 3 -N in dryland soil by about 20.53%, reduced N H 4 + -N loss by an average of 18.9%, increased crop yield by 0.11%, and reduced the amount of drained water by 19.23%. Using the DRAINMOD-NII simulation model, DRAINMOD-NII incorporates process-based modeling of carbon and nitrogen dynamics in addition to the hydrologic processes that were already present in the model. The model simulates the reactive transport nitrogen by using a finite difference solution to a multiphase form of the advection–dispersion–reaction equation. The nitrogen processes and transformations considered in the model include atmospheric deposition, fertilizer application, plant uptake, mineralization, immobilization, nitrification, denitrification, ammonia volatilization, and NO3- and NHx-nitrogen losses via subsurface drainage and surface runoff. Luo et al. [10] predicted that both shallow drainage and CD reduced the annual drainage amount and N O 3 -N loss by 20–30% and affected crop yield by −3% (reduced yield) to 2%, depending on the distance between drainage ditches or pipes. Youssef, M.A. et al. [22] reported that CD reduced the amount of annual underground drainage by 86 mm (30%) on average and reduced the annual N loss by 10.9 kg N hm−1 (32%). They also used the DRAINMOD model to predict the dynamics of drainage, and the DRAINMOD-NII prediction showed that the reduction of N loss under CD conditions was mainly caused by increased denitrification. The trend of the reduction of the annual drainage amount and nitrogen loss under CD conditions predicted by RZWQM-DSSAT was similar to that predicted by the DRAINMOD/DRAINMODNII model [22]. (Similarly to DRAINMOD, RZWQM-DSSAT simulates the infiltration of water into the soil profile using the Green–Ampt equation, deep seepage using Darcy’s equation, and the tile drainage using the Hooghoudt equation. On the other hand, RZWQM-DSSAT applies a numerical solution to Richards’ equation in order to compute the soil water distribution in the vadose zone, which is different from the empirical “drained-to-equilibrium” approach implemented in DRAINMOD. The former model uses the Shuttleworth–Wallace PET method.)
The use of subsurface controlled drainage plays an important role in the improvement of salinized soil and environmental protection in the Hetao Irrigation District, and the desalinization efficiency and soil moisture conservation effects of controlled drainage are conducive to the control of soil secondary salinization and the improvement of agricultural water-use efficiency in the irrigation area [23]. At the same time, the nutrient loss in the soil is relatively small, which has an important impact on the uptake and utilization of nutrients and the growth and development of crops, and it has a positive impact on environmental protection. Most studies show that after the cessation of this agrotechnical treatment and the liquidation of sunflower cultivation, the local ecosystem has a serious phenomenon of secondary salinization, and the degree of soil salinization is increasingly aggravated, which affects the growth and development of crops and, thus, affects the crop yield [24,25,26]. A comprehensive study for the understanding of the response of crops, soil, salt, and fertilizers to CD using subsurface pipes has not been conducted so far in the Hetao Irrigation District, where the soil is typically salinized. Due to the severe salinization, the soil in the district has poor permeability, and as a result, irrigation at the later stage of growth of oilseed sunflower plants may cause a high rate of plant death. However, if the plants were to be under water deficit stress at later growth stages, CD could then be used to satisfy the needs of the plants for water and nutrients at these stages. Our study was performed in an area with moderately salinized soil in the Hetao Irrigation District. We aimed to examine the effects of different drainage systems on soil water content, salinity, mineral nitrogen content, and the quality of drainage water, to understand the regularity of the response of the soil–crop–environment system to drainage methods, and to determine the best drainage system for benefiting crop yield, reducing environmental pollution, and improving water- and fertilizer-use efficiency.

2. Materials and Methods

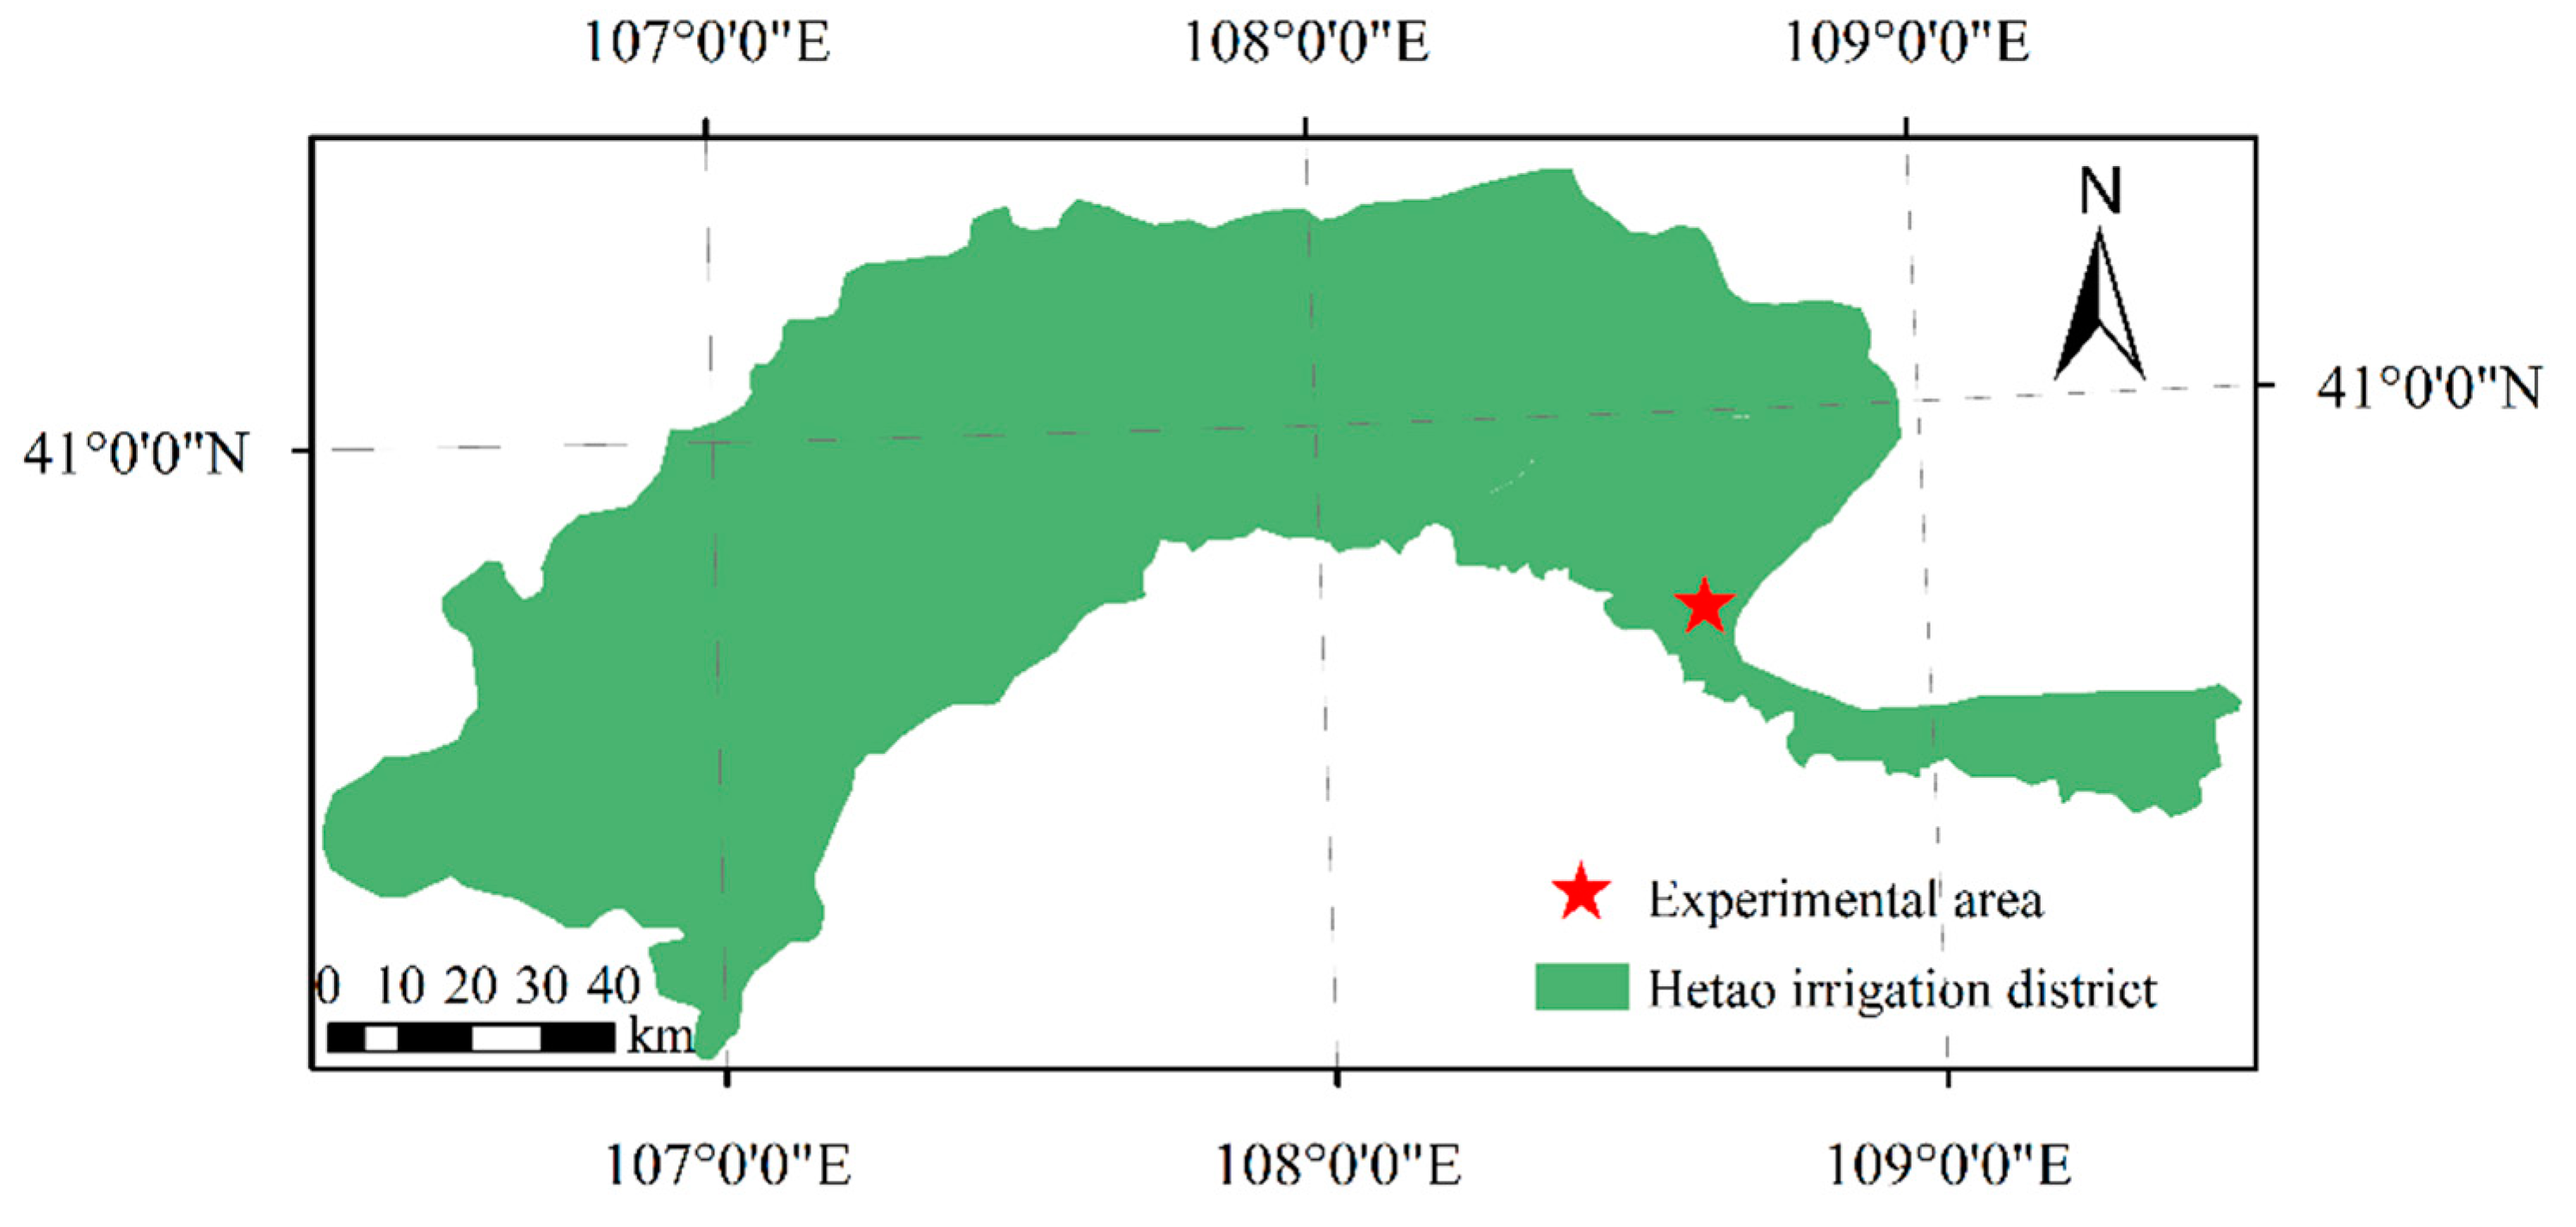
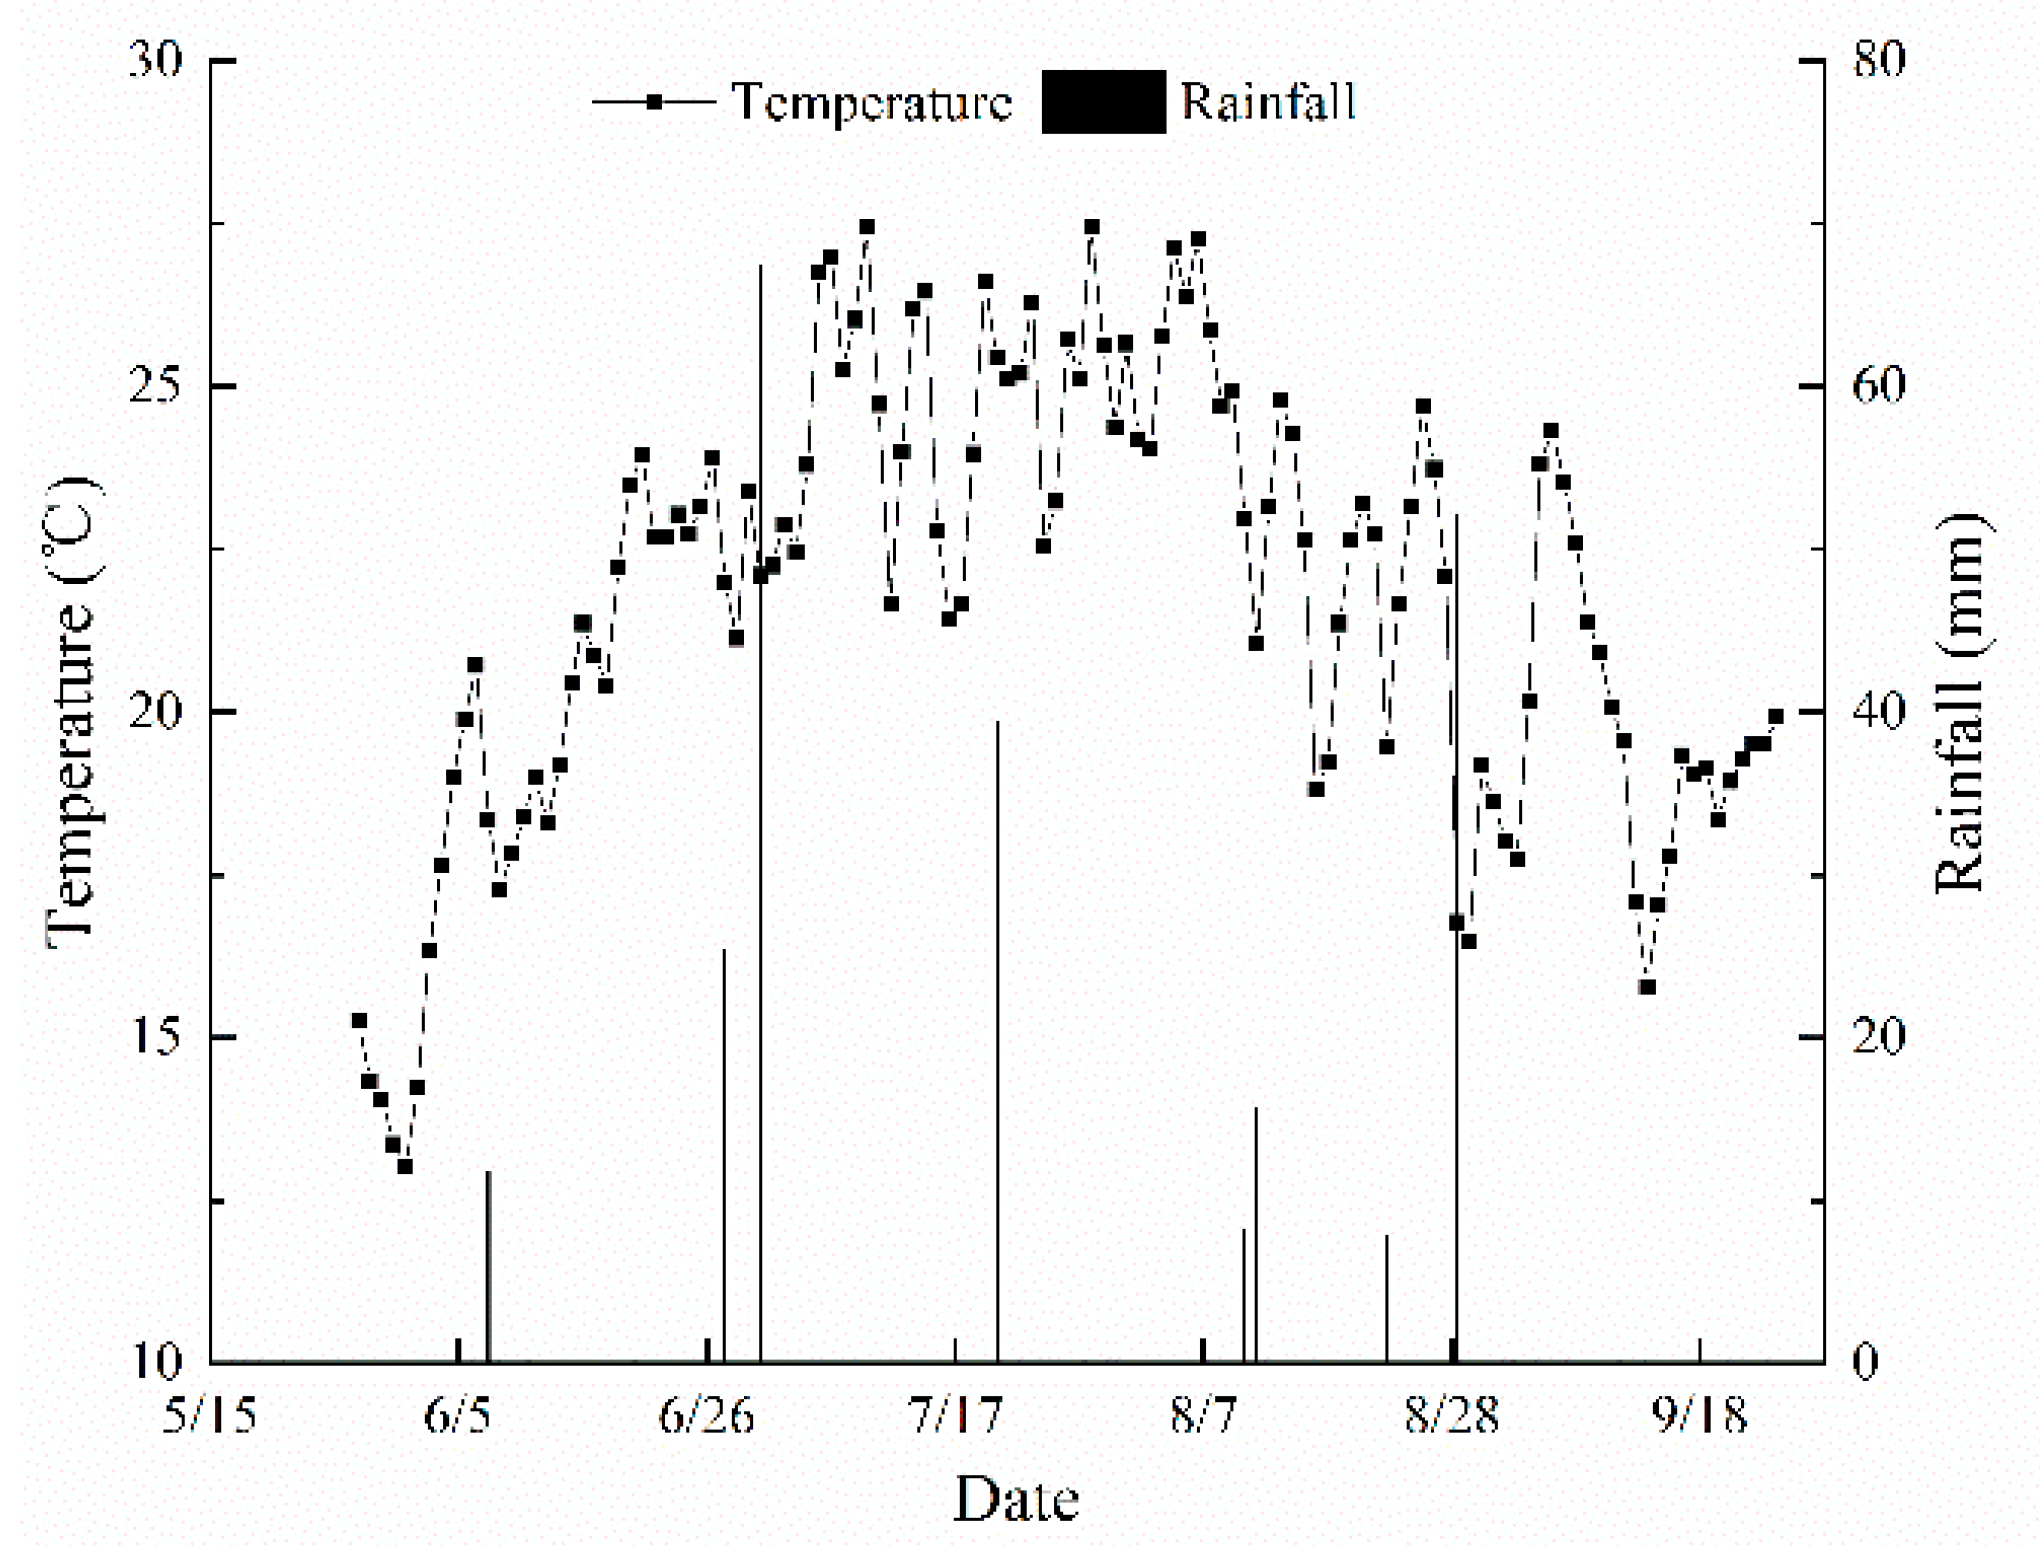
2.1. Overview of the Experimental Area

The comprehensive test of subsurface drainage was carried out from May to October 2020 in a field (40°45′28″ N, 108°38′16″ E; 1018.88 m altitude) in the Urad irrigation area, which is located in the lower reaches of the Hetao Irrigation District (Figure 1), which is in a mid-temperate continental climate zone and has variable temperature, dry and windy weather, abundant light energy, low precipitation, strong evaporation, and a short frost-free period. It is a typical arid area with an annual average temperature of 6–8 °C, rainfall of 196–215 mm, evaporation of 2172.5 mm, frost-free period of 130 d, wind speed of 2.5–3 m/s, sunshine duration of 3230.9 h, and maximum soil frost depth of 1.2 m. The effective rainfall during the oilseed sunflower growing season (May to September) was 227.8 mm (Figure 2).

2.2. Soil Properties

Undisturbed soil samples from the 0–1 m soil layer were taken using a ring knife, and they were then used for the indoor determination of bulk density, saturated (mass) water content, water holding capacity, and saturated hydraulic conductivity. The samples included a total of six layers (0–10, 10–20, 20–40, 40–60, 60–80, and 80–100 cm), and three replicate samples were taken from each soil profile. The soil (0–100 cm) had an initial average water content of 22.57%, electrical conductivity EC1:5 of 1.27 dS·m−1, and pH of 8.8. The basic physical properties of the soil in the experimental area are shown in Table 1, and the soil nutrients in the plow layer were determined (Table 2).

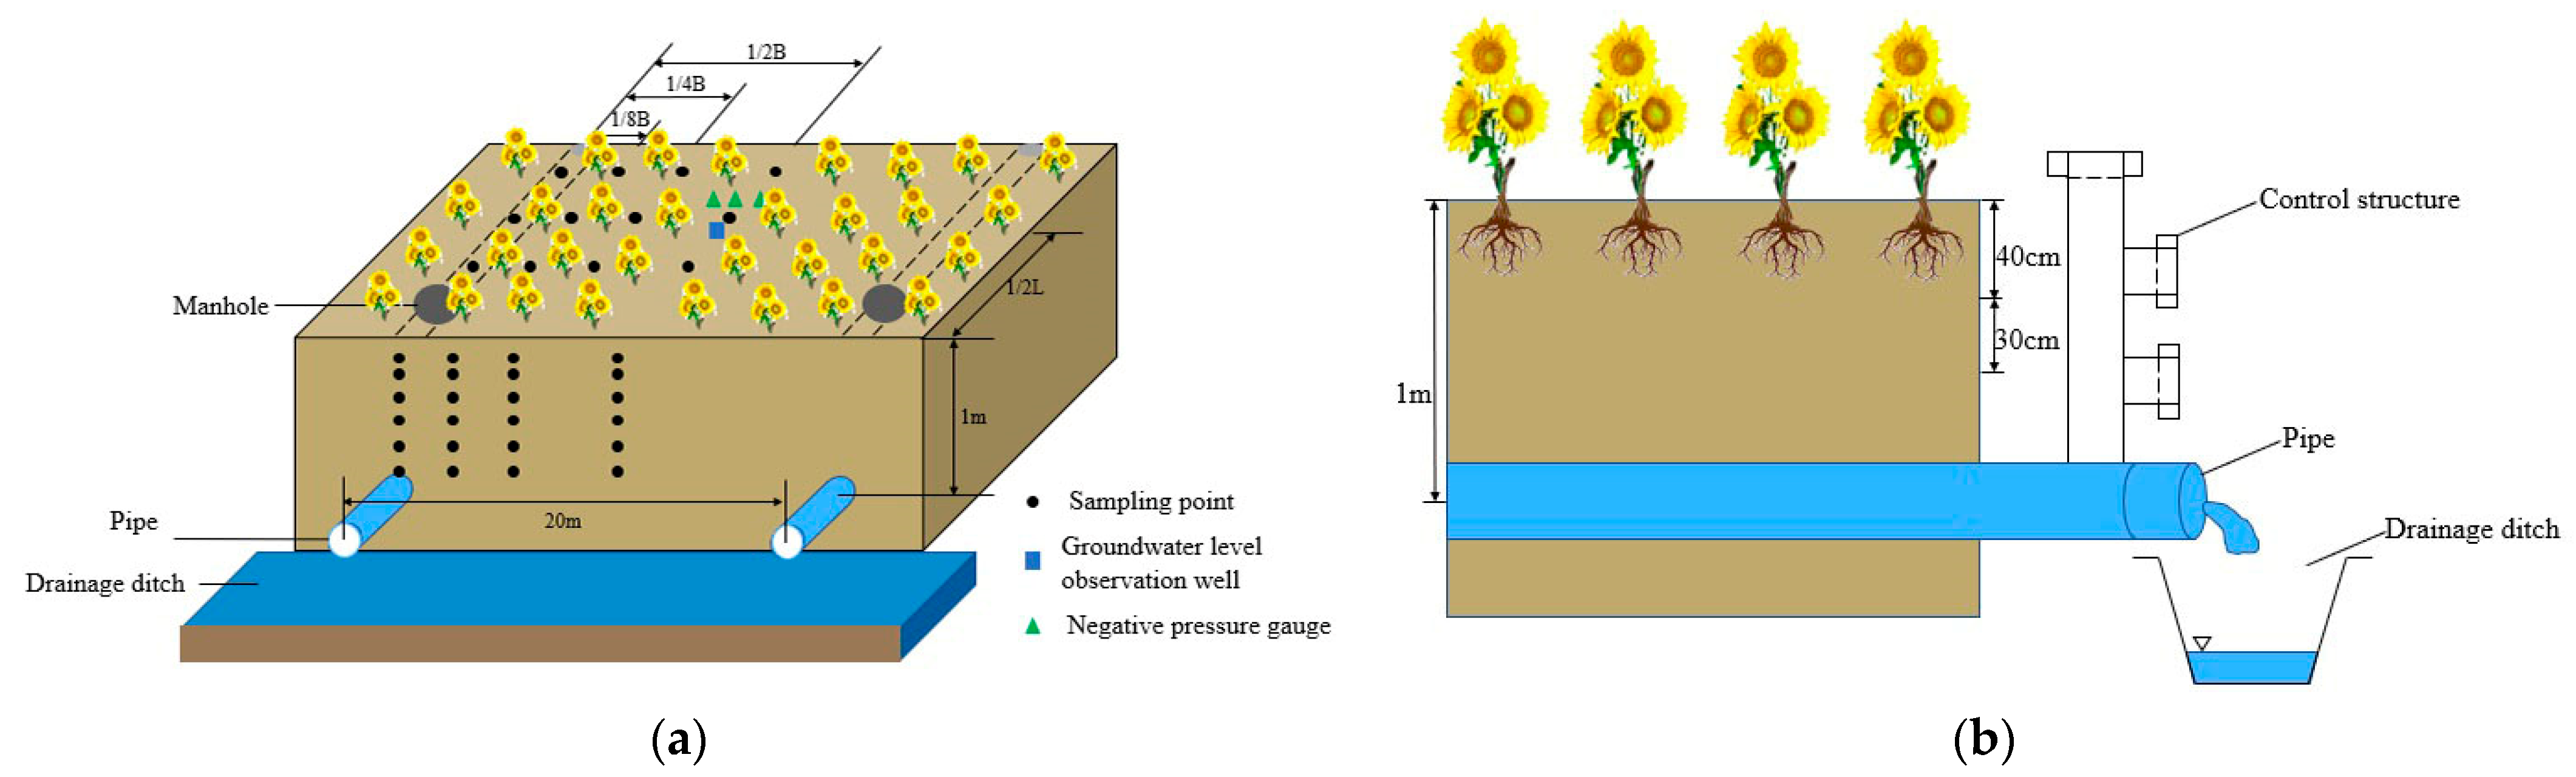
2.3. Experimental Design

The experiment included four field plots that were 40 m long and 30 m wide, and the space between plots was 10 m. PVC plastic cloth was buried in the soil at 1 m depth around each plot to prevent inter-plot interference. The drainage systems included free drainage (FD), open-ditch drainage (OD), and CD. Each subsurface drainage plot was equipped with two pipes (80 mm diameter) concealed beneath a 100 cm soil layer and arranged with a slope of 1‰. The distance between the two subsurface pipes was 20 m. CD included the CWT1 (drainage depth of 40 cm) and CWT2 (drainage depth of 70 cm) treatments, in which the drainage depth was adjusted to 40 or 70 cm, respectively, during the plant growth stages. Three replicates were set up for each treatment for a total of 12 test plots. The spots for sampling soil in the subsurface drainage plots were arranged at 0, 2.5, 5, and 10 m from a subsurface pipe. The layout of the design is shown in Figure 3 (B is the distance between subsurface pipes; L is the length of the subsurface pipe). Conventional local drainage ditches (1.5 m depth) were adopted for OD, and the distance between ditches was 100 m. The spots for sampling soil in the OD plots were arranged at 0.4, 12.5, 25, and 50 m from a drainage ditch. Soil was regularly sampled every 10 d and was also sampled before and after each irrigation and rain. Sampling was repeated three times in each plot. Before planting, land leveling was carried out using a laser device, and the properties of the saline soil in the experimental field were improved by adding desulfurized gypsum (30 t/hm2) to replace the harmful sodium ions adsorbed by the soil, as well as fine sand (dune sand) (85.05 m3/hm2) to improve soil permeability.
The field was irrigated (2050 m3/hm2) on May 20, 2020 (spring irrigation). On June 1, the field was fertilized with 130 kg/hm2 of urea (N content was 46%), 290 kg/hm2 of diammonium phosphate (N content was 18% and P2O5 content was 44%), and 150 kg/hm2 of potassium sulfate (K2O content was 50%). After that, the soil was covered with plastic membranes. The seeds of the oilseed sunflower variety “AO33” were sown by hand in the holes that were punched on the membranes and arranged in rows (60 cm of space between rows, 20 cm of space between plants, and 50 lines of sunflower were planted in each plot), and the planting density was 4.95 × 10⁴ plants/hm2. After sowing, the openings of the holes were covered with fine sand. On July 18, when the buds were growing, the plants were irrigated (900 m3/hm2) and fertilized with urea (130 kg/hm2). The plants were harvested on September 29. The growth stages of the oilseed sunflower plants are shown in Table 3. Yellow River water (the degree of mineralization was about 0.67 g/L) was used in irrigation with the help of a water pump, and the amount of water used in the irrigation was measured and controlled using a water meter.

2.4. Data Collection and Measurement Methods

2.4.1. Determination of Soil Salinity, Water Content, and Mineral Nitrogen Content

A soil drill was used to collect the soil at depths of 0–100 cm, which were divided into six layers (0–10, 10–20, 20–40, 40–60, 60–80, 80–100 cm), following which the soil was brought back to the laboratory for determination. The electrical conductivity of the soil was determined by measuring the soil extract with a mass ratio of soil:water of 1:5 with a Leici DDS-307A conductivity meter (INESA Scientific Instrument, Shanghai, China). The soil water content was measured using the oven-drying method. The soil mineral nitrogen was extracted using the calcium chloride extraction method [27], and the content was determined using a continuous flow analyzer.

2.4.2. Record of Seedling Emergence and Yield Test

The seedling emergence rate was investigated in the experimental field in early June, and a hand-held counter was used to record the number of seedlings in each plot. The number of oilseed sunflower plants was also counted in each plot at harvest. At the maturity stage, 20 standard plants were selected from the inside of each plot, and the plants were individually harvested for the yield test.

2.5. Data Processing and Analysis

Origin 2018 and Excel 2016 (Microsoft Corp., Redmond, WA, USA) were used for data processing and plotting. SPSS 17.0 (SPSS Inc., Chicago, IL, USA) was used in a variance analysis, and the multiple comparisons were performed with the least significant difference (LSD) method.

2.5.1. Calculation of the Seedling Emergence Rate and Survival Rate

The seedling emergence rate and survival rate were calculated based on the recorded data using the following equations:
Emergence rate (%) = (The number of seedlings per unit area/planting density) × 100%
Survival rate (%) = (The number of survival plants per unit area/the number of seedlings per unit area) × 100%

2.5.2. Water-Use Efficiency

Soil water-use efficiency (WUE) was calculated using the following equation:
W U E = Y E T
where WUE is the soil water-use efficiency (kg·hm−2·mm−1); Y is the grain yield (kg·hm−2); ET is the amount of water (mm) consumed by oilseed sunflower plants during the entire growing period.
Water consumption was calculated using the following water balance equation:
E T = P + I + G L D Δ W  
In the equation, P is precipitation (mm); I is the amount of irrigation (mm); G is the amount of groundwater replenishment (mm); L is the amount of leakage in deep layers (mm); D is the amount of lateral drainage (mm); ΔW is the change in the average soil water content in the 0–100 cm soil layer between the beginning and the end of the experiment (mm). The direction of soil water movement was determined by measuring the soil water potential using a field negative pressure gauge. The groundwater replenishment and leakage in the deep soil layer were calculated based on Darcy’s law [28].

3. Results

3.1. Effect of Controlled Drainage on Farmland Soil Water Content

The vertical distribution of the soil water content in the 0–100 cm soil layer under different drainage conditions is shown in Figure 4. After the spring irrigation, due to the larger amount of water, the soil water content was high. CWT1, CWT2, and FD all had drainage pipes concealed beneath the 100 cm soil layer, and the difference in soil water content between them was small. Due to the slow drainage, OD had a slightly higher soil water content than subsurface drainage, which was 0.59–4.86% higher than that in CWT1, CWT2, and FD. After irrigation at the budding stage, due to the 40 cm drainage depth, CWT1 discharged less water from the soil during the plant growth stages compared with the other drainage systems, thereby providing better water and fertilizer conditions for the growth of plants at their later growth stages. This increased transpiration and water consumption; thus, the difference in soil water storage in the 0–1 m soil layer between CWT1 and the other drainage systems at later stages of plant growth was reduced. The order of soil water content in the different drainage systems was CWT1 > OD > CWT2 > FD.
The roots of oilseed sunflower plants were mainly distributed in the 0–40 cm soil layer. During the period between the irrigation in July and harvest in September, the average soil water content in the 0–20 cm soil layer in CWT1 increased by 3.67%, 4.78%, and 0.55%, respectively, compared with CWT2, FD, and OD; the average soil water content in the 20–40 cm soil layer increased by 2.63%, 4.25%, and 0.09%, respectively, and thus, CWT1 provided better water conditions for the plants at the later growth stage. Water deficit had an evident effect on the growth of the oilseed sunflower plants. Figure 4a,b show dynamic changes in soil moisture content in different treatments for 0–20 (a), 20–40 (b), the oilseed sunflower plants were under water deficit stress, and the plants in CWT1 were less affected by the stress. The soil water content in the 40–100 cm soil layer in CWT1 was the highest, as it was 1.10–3.36% higher than that in CWT2, FD, and OD, suggesting that CWT1 benefited the soil water supply.

3.2. Effect of Controlled Drainage on Farmland Soil Salinity (EC)

The salinity (expressed by EC) of the different soil layers in the 0–100 cm soil profile in the different drainage systems is shown in Figure 5. There were great differences in soil salinity between the different drainage systems at each growth stage. Before the spring irrigation, due to strong evaporation, the soil salinization was severe, resulting in salts mainly accumulating in the shallow soil, so the salinity of the 0–40 cm soil layer was evidently greater than that of the 40–100 cm soil layer.
The main purpose of spring irrigation was to reduce salt stress on the seedlings as much as possible by leaching. The drainage depth in both CWT1 and CWT1 was 100 cm at this time, which showed a better effect on desalination after the spring irrigation and brought about suitable growth conditions for the seedlings. As shown in Figure 5a, at the seedling stage, the EC value of the 0–20 cm soil layer in CWT1, CWT2, and FD was 0.65–0.66 dS·m−1, and there was no significant difference between them. Due to the large distance between ditches, OD showed a low drainage efficiency and a poor effect on desalination; as a result, at the seedling stage, the EC value of the soil in the 0–20 cm soil layer in OD was 38.69–42.27% greater than that in CWT1, CWT2, and FD, and the difference was significant (p < 0.05). The soil desalination rate in the 20–40 cm soil layer was 113.79–115.79% in CWT1, CWT2, and FD, but 59.74% in OD. The soil desalination rate in the 0–100 cm soil layer in CWT1, CWT2, and FD was 105.56–106.94%, while that in OD was 43.48%. The purpose of irrigation at the budding stage was to provide sufficient water and nutrients for plant growth. Irrigation at the budding stage showed a weak effect on salt leaching due to the smaller amount of irrigation water, and the effect varied with drainage depth. At the budding stage, the EC values of the soil in the 0–20 cm and 20–40 cm soil layers in OD were 23.40% and 16.17% higher than that in FD, and the differences were significant (p < 0.05), while the differences in the EC value between CWT1, CWT2, and FD were not significant. During the period between the flowering stage and maturity stage, the soil began to salinize. At the flowering stage, the EC value of the soil in the 0–20 cm soil layer in CWT1 was 6.67%, 11.83%, and 14.29% higher than that in CWT2, FD, and OD, and the differences were significant (p < 0.05); the EC value of the soil in the 20–40 cm soil layer in CWT1 was 14.18% higher than that in OD, and there was no significant difference between CWT1, CWT2, and FD. At the maturity stage, the salinization rate of the soil in the 0–40 cm soil layer in CWT1, CWT2, FD, and OD increased by 39.10%, 32.58%, 26.86%, and 19.02%, respectively, compared with that at the time before sowing, and the soil salinization rate in CWT1 and CWT2 was higher. At the late growth stages, the salt tolerance of the oilseed sunflower plants increased, and thus, the plants required more water and nutrients. Therefore, soil salinity had less of an effect on the plants at the later growth stages, and CD was able to effectively provide a suitable amount of water and nutrients for the plants at that time.
The salinity of the soil in the 40–100 cm soil layer in all of the drainage systems was lower (Figure 5c–e), and the difference in soil salinity between drainage systems in this soil layer was less than that in the 0–40 cm soil layer. At the pre-sowing stage and seedling stage, the salinity of the soil in the 40–100 cm soil layer and in the 0–40 cm soil layer in all of the drainage systems showed the same change trend. At the budding stage, due to the variation in drainage depth, the EC value of the soil in CWT1 was 9.24% and 9.68% higher than that in CWT2 and FD, respectively, and the difference was significant (p < 0.05). At the maturity stage, the EC values of the soil in CWT1 and CWT2 were 10.62% and 9.44% higher than that in FD, and they were 9.44% and 11.08% higher than that in OD, respectively; the differences were significant (p < 0.05). At the maturity stage, the EC values of the soil in CWT1, CWT2, FD, and OD were 1.25, 1.24, 1.13, and 1.11 dS·m−1, respectively.

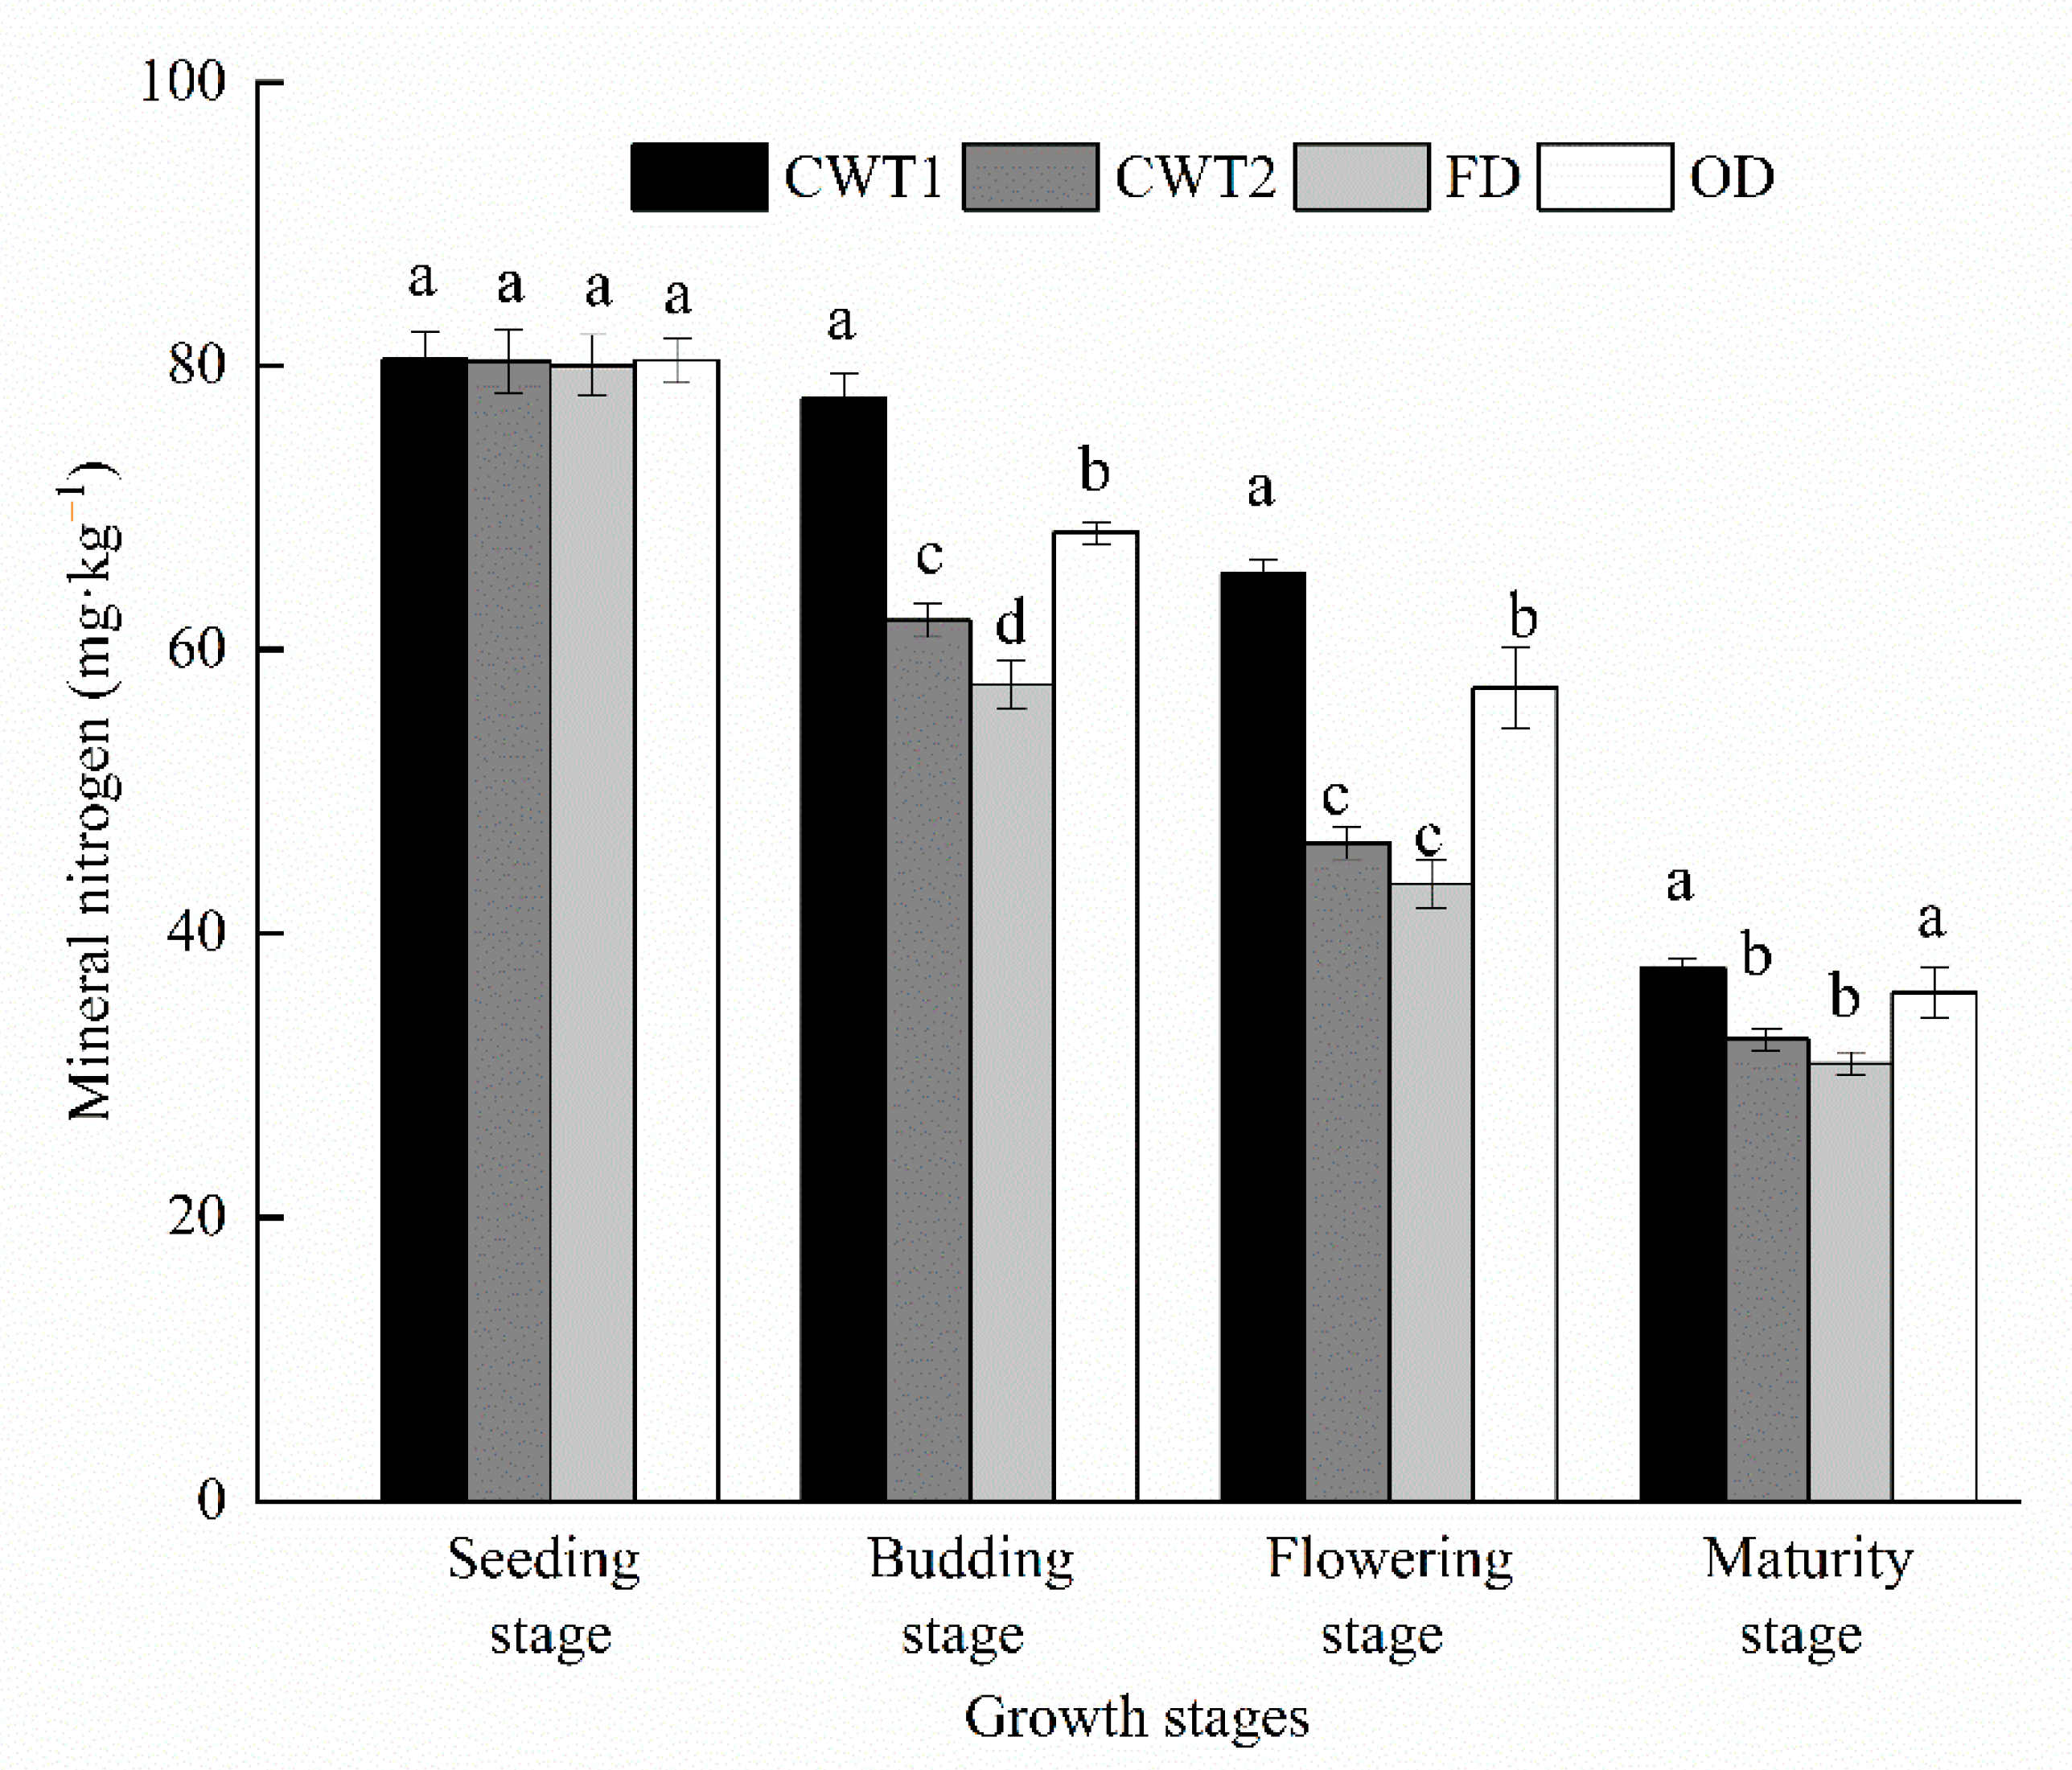
3.3. Effect of Controlled Drainage on Soil Mineral Nitrogen Content

The soil mineral nitrogen content in the plow layer (0–40 cm) in different drainage systems at different growth stages is shown in Figure 6. Because the basal fertilizer was applied before sowing, the mineralization rate of inorganic fertilizer was fast at the seedling stage, the content of mineral nitrogen was higher, and there was no significant difference between drainage systems. At the budding stage, the mineral nitrogen content in the soil in the different drainage systems varied significantly with the drainage depth. The soil mineral nitrogen content in CWT1 was 25.17%, 35.05%, and 17.78% higher than that in CWT2, FD, and OD, respectively, and the differences were significant (p < 0.05). A similar profile of mineral nitrogen content was also found at the flowering stage. As a result of the difference in drainage depth, the order of soil mineral nitrogen content in the different drainage systems was CWT1 > OD > CWT2 > FD. The soil mineral nitrogen content in CWT1 was 40.91%, 50.25%, and 13.99% higher than that in CWT2, FD, and OD, respectively, and the differences were significant (p < 0.05). Growth at the budding stage and flowering stage was critical for oilseed sunflower plants and had a great effect on grain yield. CWT1 resulted in a stronger capability of the soil to continuously supply nitrogen to the oilseed sunflower plants. At the end of the growing period, the differences in soil mineral nitrogen content between drainage systems were significantly reduced, and the difference in soil mineral nitrogen content between CWT1 and OD was not significant. The soil mineral nitrogen content in CWT1 and OD was significantly greater than that in CWT2 and FD, suggesting that the plants in CWT1 absorbed and utilized more mineral nitrogen at the middle and later stages of growth.

3.4. Effect of Controlled Drainage on the Amount and Quality of Drainage Water and Nitrogen Loss

The effects of drainage systems on the amount and quality of drainage water after irrigation at the budding stage are shown in Table 4. Due to the shallower drainage depth, the CWT1 drainage amount was 15.74% and 28.18% lower than those in CWT2 and FD, respectively. The drainage amount in OD was also smaller as a result of the low drainage efficiency caused by the large distance between drainage ditches. The average concentration of N O 3 -N in the drainage water in CWT1 was 1.90%, 5.18%, and 39.29% lower than those in CWT2, FD, and OD, respectively, and the average concentration of N H 4 + -N was 1.11%, 22.32%, and 39.63% lower than those in CWT2, FD, and OD, respectively. The drainage water in CWT1 had a lower nitrogen concentration, which reduced the environmental pollution and encouraged environmental protection.
The loss of N H 4 + -N and N O 3 -N in the soil in different drainage systems after irrigation and fertilization at the budding stage is shown in Table 5. The loss of N O 3 -N and N H 4 + -N in CWT1 was the smallest, as it was 17.24% and 29.41% lower than that in CWT2 and FD, respectively, and the differences were significant (p < 0.05). The loss of N O 3 -N in CWT2 was significantly reduced by 14.71% compared with that in FD. Due to the smaller drainage amount, the loss of N O 3 -N in OD was also smaller. There was no significant difference in the loss of N O 3 -N between OD, CWT1, and CWT2. N H 4 + -N could be easily absorbed by negatively charged soil colloids and, thereby, had weak mobility, so the difference in the loss of N H 4 + -N between the different drainage systems was smaller than that of N O 3 -N. The loss of N H 4 + -N in CWT1 was 42.31% higher than that in FD, and the difference was significant (p < 0.05). There was no significant difference in N H 4 + -N loss between CWT1, CWT2, and OD.
In summary, controlled drainage stabilized the groundwater level, decreased the hydraulic gradient of the runoff, reduced the flow rate of the drainage water, lowered the capability of the water flow to carry away nitrogen, and prolonged the retention of soil water in the farmlands. After irrigation and fertilization at the budding stage, the deeper the drainage depth of the controlled drainage, the greater the loss of N H 4 + -N and N O 3 -N in the soil. As a result, the N export was less at the shallower depth of CD seen in CTW1 than in the deeper CD in CWT2.

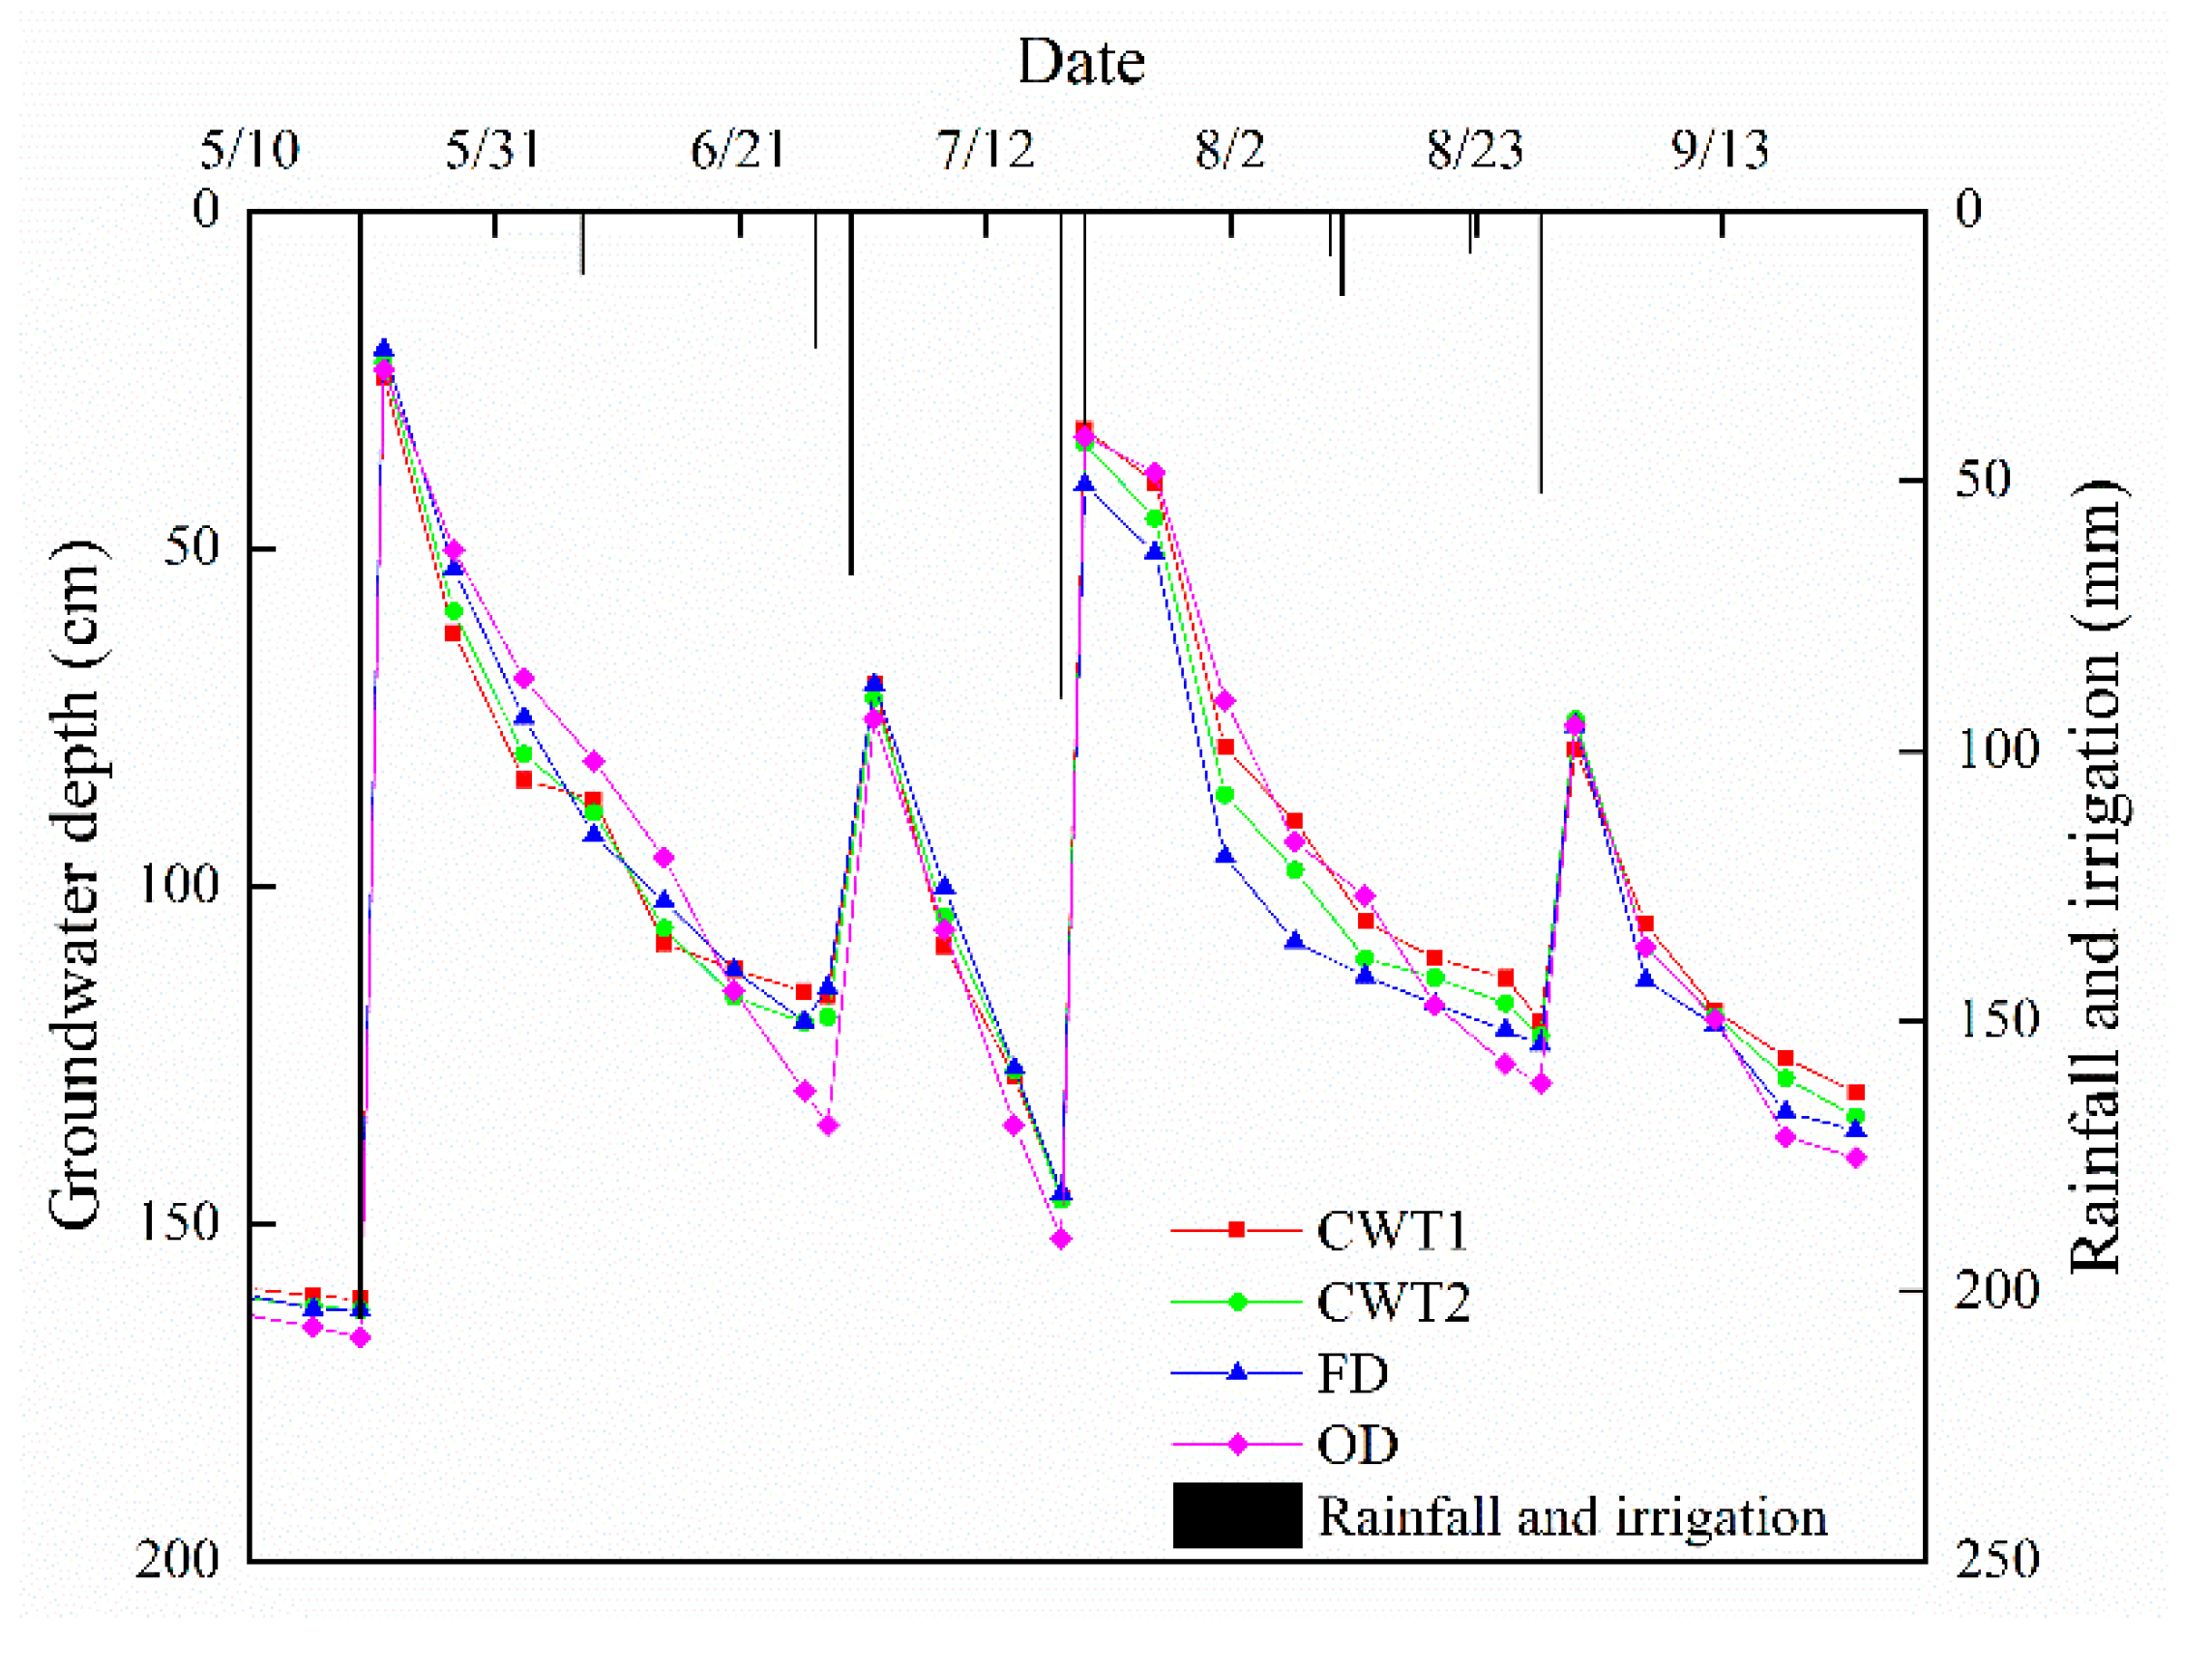
3.5. Effect of Controlled Drainage on the Groundwater Level of Farmlands

The groundwater levels in the different drainage systems are shown in Figure 7. After irrigation in May and July, the changes in groundwater level in all drainage systems were basically the same, and the change trend could be clearly categorized into stable, rising, and falling phases. After spring irrigation, the drainage depths of CWT1, CWT2, and FD were all 100 cm, and there was no significant difference in the groundwater level between them. Due to the low drainage efficiency, the decline of groundwater level in OD was slow and delayed. In late June, the groundwater level in OD was 10.94–14.62% deeper than those in CWT1, CWT2, and FD, respectively. After irrigation at the budding stage, the drainage systems had varied drainage depths, and thus, the groundwater levels differed. CWT1 caused a higher groundwater level. The average groundwater levels in CWT2 and FD were 5.14% and 10.18% lower than that in CWT1, respectively. The controlled drainage depth during the plant growth stages differed in the different drainage systems. When the groundwater level dropped to 100 cm, the difference in groundwater level between the drainage systems was gradually reduced. CWT1 resulted in a higher groundwater level and higher soil water content, which was helpful for plant growth and groundwater replenishment.

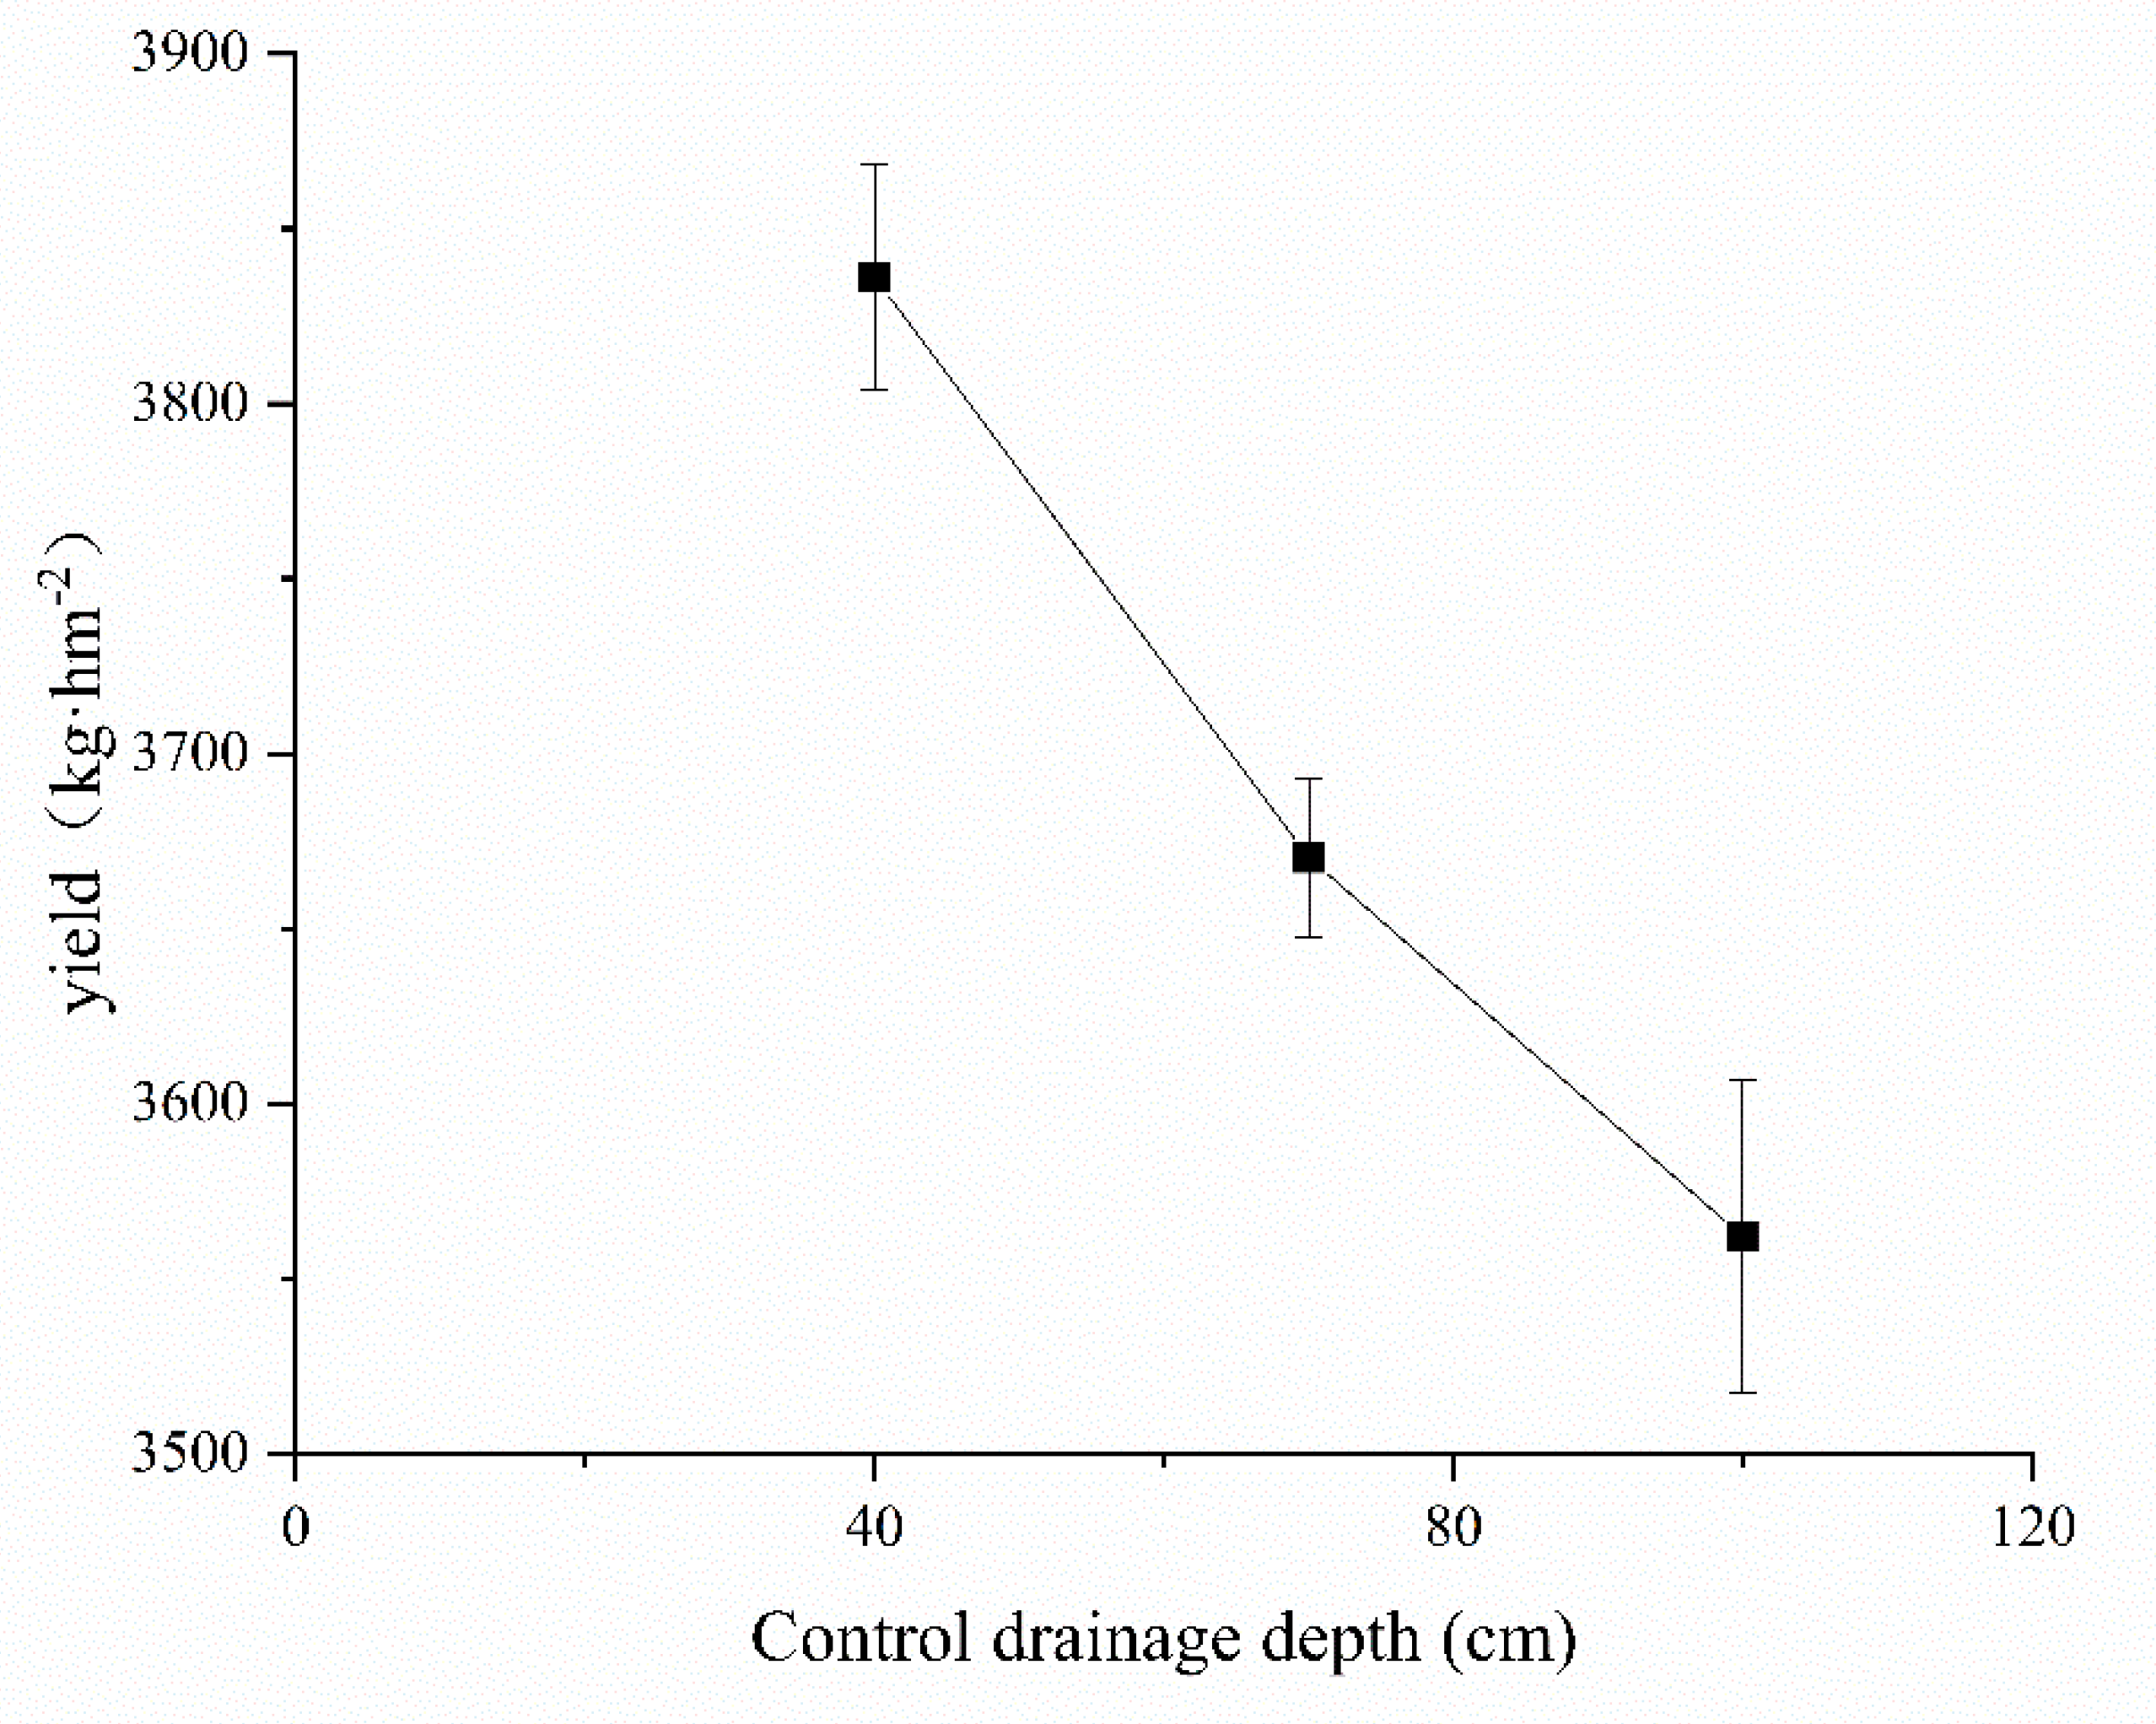
3.6. Effect of Controlled Drainage on Oilseed Sunflower Yield

Table 6 shows the effects of different drainage systems on the emergence rate, growth, and yield of oilseed sunflower plants. In OD, the leaching after the spring irrigation was insufficient, and the higher soil salinity negatively affected germination. The emergence rate in OD was significantly lower than that in the subsurface drainage systems (CWT1, CWT2, and FD). The subsurface drainage systems significantly increased the emergence rate by 2.54–2.68% (p < 0.05). Due to its ability to bring about better water and fertilizer conditions for the plants at later growth stages, CWT1 benefited the survival of the plants. Compared with the other drainage systems, CWT1 significantly increased the survival rate of the plants by 2.62–2.92% (p < 0.05).
The plant height and stem diameter differed in the different drainage systems. Table 6 shows the average plant height and stem diameter after irrigation and fertilization at the budding stage. Rapid plant growth was observed at the budding stage. The CD systems provided good growth conditions for the oilseed sunflower plants. The plant height in CWT1 was 4.52%, 6.76%, and 13.99% higher than those in CWT2, FD, and OD, respectively, and the differences were significant (p < 0.05). The plant height in CWT2 was 2.14% and 9.06% higher than those in FD and OD, respectively, and the differences were significant (p < 0.05). The difference in stem diameter between drainage systems was less than that of plant height. The stem diameter in CWT1 was 9.16% and 20.91% higher than those in FD and OD, respectively, and the differences were significant (p < 0.05). There was no significant difference in stem diameter between CWT1 and CWT2. CD increased the plant height and stem diameter and had a greater effect on plant height than on stem diameter.
Compared with CWT2, FD, and OD, CWT1 significantly increased the oilseed sunflower yield by 4.52%, 7.69%, and 11.14%, respectively (p < 0.05). The yield reduction in CWT2 and FD was caused by the loss of a large amount of water and nutrients after irrigation at the budding stage, and the deficit of water and nutrients stressed the plants at later growth stages. Due to the fact that the leaching of salts in OD was insufficient after spring irrigation, the yield reduction in OD was caused by salt stress, which was detrimental to seedling emergence and plant growth. The order of water-use efficiency of the plants in different drainage systems was CWT1 > CWT2 > FD > OD. Compared with CWT2, FD, and OD, CWT1 significantly increased the water-use efficiency by 1.16%, 4.57%, and 10.8%, respectively. In summary, maintaining the 40 cm drainage depth (CWT1) during the plant growth stages not only improved the survival rate and yield of the plants, but also increased the water-use efficiency.

4. Discussion

4.1. Effect of Controlled Drainage on the Water Content and Salinity of Farmland Soil

Suitable soil water content and salinity are conducive to plant growth and the efficient use of water [29]. In arid and semi-arid areas, subsurface drainage is mainly used to reduce soil salinity and minimize soil salinization [30,31]. In our study in the Hetao Irrigation District, we irrigated the field before sowing and allowed free drainage to reduce the soil salinity so as to improve the conditions for the emergence and growth of seedlings. During the plant growth stages, we controlled the drainage to provide suitable water and nutrient conditions for plant growth and to improve water- and fertilize—use efficiency. A larger amount of water was used during spring irrigation, which achieved a good desalination effect through leaching, following which the soil salinity was suitable for seedling emergence.
During the growth stages, plants rely on groundwater, and thus, efficient irrigation is crucial for reducing leakages in deep soil and minimizing water wastage [29]. Studies have shown that CD has a great effect on groundwater level. CD extended the detention of shallow water in the farmlands after irrigation and fertilization at the budding stage, and as a result, more water was stored in the soil [32,33]. Additionally, CD has a positive effect on the temporary increase in groundwater level in farmlands. CD reduced the fluctuations in groundwater level, increased water storage in the soil, and promoted the absorption of water by plants during the growth stages [34,35], which is consistent with the results of our study. By controlling drainage, the groundwater level could be brought to a controlled level. The groundwater moved upward through capillary action to maintain soil water content, and as a result of this, the shallow groundwater could be used by plants. In addition, when there was insufficient water for irrigation, CD could be used to prevent excessive drainage so as to delay the water stress, which is detrimental to the growth and yield of plants [36,37].

4.2. Effect of Controlled Drainage on Soil Nitrogen and Nitrogen Loss

Studies have shown that increasing the drainage limit for paddy fields strengthens the anaerobic environment in the paddy soil and inhibits the nitrification of soil microorganisms, thereby increasing the N H 4 + -N content in the soil [38], which, to some extent, differs from the results of our study. Our study was conducted in an arid area. For early crop growth, the aerobic condition in the soil was conducive to the nitrification of N H 4 + -N, and N O 3 -N gradually accumulated in the soil [39]. After irrigation, the water quickly moved down and joined the groundwater, and so the irrigation water did not provide suitable conditions for denitrification. Meanwhile, the rising groundwater level brought sufficient water and nutrients for nitrification, resulting in an increase in N O 3 -N content in the soil.
CD can be used to reduce the loss of nitrogen in the soil [22,40] such that there is sufficient nitrogen in the soil for plants, thereby reducing environmental pollution [41]. Nash et al. [42] reported that in all sorghum production seasons (2010–2013), the N O 3 -N concentration of the drainage in CD was 6.03–9.63 mg·L−1 less than that in FD, and the average cumulative loss of N O 3 -N in the soil in CD was 0.68–6.16 kg·hm−2 less than that in FD. Negm et al. [43] predicted the loss of nitrogen in soil using the DRAINMOD-DSSAT model and found that the soil nitrogen content in FD was 69.7–100.8 kg N hm−2, while the soil nitrogen content in CD was 66.8–94.7 kg N hm−2. Similarly, in our study, the average concentrations of N O 3 -N and N H 4 + -N in the drainage in CD were lower than that in FD. The regularity of the loss of N O 3 -N was similar to that of N H 4 + -N. The loss of soil nitrogen was inevitable in the drainage system using subsurface pipes, as N O 3 -N can easily migrate with water, the draining of which to the outside of the soil body would result in environmental pollution. Raising the drainage outlet could effectively alleviate this problem [44].
The effect of CD on nitrogen loss depended on the nitrogen concentration and drainage amount, and thus, the effect of CD on nitrogen loss might vary. Our results showed that setting the drainage depth to 40 cm (CWT1) during the plant growth stages retained more nitrogen in the soil after irrigation at the budding stage. Furthermore, the soil was somewhat sticky and the downward movement of water was slower, which caused less nitrogen loss and extended the retention of the nitrogen in the plow layer soil (0–40 cm), allowing the plants to utilize it. Raising the drainage outlet during the growth stages also had a positive effect on environmental protection.
The root growth of crops is different in different growth stages, and their requirements for water and nutrients are also very different. Only in the most sensitive period of root growth can the reasonable supply of water and fertilizer be guaranteed to form more economic yield and achieve the purpose of increasing yield and efficiency [45,46,47]. Studies have shown [48,49] that the nitrogen content in the soil has a great influence on the growth and yield of crops at the jointing stage and the middle and late growth stages of crops. In this study, fertilization during sowing had a positive impact on the growth and development of oilseed sunflower at the jointing stage. In the middle and late growth stages, the controlled drainage maintained good water and nutrients, providing favorable conditions for crop growth. Therefore, the growth and development of oilseed sunflower was good, leading to an increase in yield.

4.3. Effect of Controlled Drainage on Crop Yield

The effect of controlled drainage on crop yield might vary [50]. Most studies have shown that controlled drainage technology has a positive effect on crop yield [21,51,52]. There were also findings that the drainage method had little effect on crop yield or was not an important contributory factor to crop yield [53,54]. Fang et al. [41] reported that from 1996 to 2008, the average maize yield in CD was 3% higher than that in FD. Tolomio and Borin [55] showed that maize had the most active response to CD. CD technology increased maize yield by 26.3%. In dry years, when plants were under drought stress, the effect of CD was more evident. Our study showed that CD had a positive effect on the yield of oilseed sunflower. As the drainage was controlled after irrigation at the budding stage, the soil had sufficient water and nutrients for plants, which promoted the growth of the roots and facilitated the accumulation of dry matter in the oilseed sunflower plants, thus increasing grain yield. As shown in Figure 8, when the controlled drainage depth was 40 cm, the yield of oilseed sunflower was higher (3836.11 kg/hm2). As the roots of oilseed sunflower plants were mainly distributed in the 0–40 cm soil layer, after irrigation, an amount of salts in the plow layer soil was leached and drained away. Increasing the drainage depth caused much greater loss of irrigation water and soil nutrients, decreased water- and nutrient-use efficiency, and reduced yield. Overall, CD is an important technology for balancing water, salinity, and nutrients in the soil, and is also an important measure for achieving the efficient use of water and fertilizer. In view of concerns around water shortage, groundwater overexploitation in well-irrigated areas, and the unreasonable use of chemical fertilizers, the application of controlled drainage has broad application prospects.
Of course, in salinization irrigation areas, irrigation management and nutrients are also the main factors affecting crop yields. In salinization irrigation areas, improving the soil and water environment of crops in salinized soil through rational water and fertilizer management can provide powerful conditions for the high yield of crops [56,57]. Studies have shown that [58], under the same nitrogen application rate, the leaching effect of a higher irrigation water volume will cause more nitrogen to be lost compared with medium and low irrigation water volumes. Excessive irrigation under the conditions of medium and low rates of nitrogen application will cause nitrogen deficiency and reduce the yield of maize, while higher rates of nitrogen application could alleviate the promotion of excessive irrigation in nitrogen leaching, ensuring the crop nutrient supply while gaining more water resources so as to promote the increase in yield to a certain extent. It can be seen that a moderate reduction of the irrigation amount in salinized irrigated areas is not conducive to salt leaching, but it can reduce nutrient leaching and promote deeper root embedment, which is more conducive to the utilization of water and nitrogen resources in the deep rhizosphere by crops in shallow groundwater areas. Chen et al. [59] showed that nitrogen uptake in medium- and low-level saline soils increased with the increase in nitrogen application rate, while excessive application of nitrogen did not significantly promote nitrogen uptake. Pessarakli believes [60] that in a low-salt environment, nitrogen deficiency has a greater impact on crops than salinity, and the application of nutrients has a positive effect on crop yield. Under moderate salinity, the two may be independent of each other, and both are factors that restrict crop growth. In a high-salt environment, salinity may be the main limiting factor for crop growth, and nitrogen has little effect on crops. Therefore, under the premise of ensuring the water and nitrogen resources needed for suitable crop growth, the main way to increase the yield in heavily saline soil is to relatively reduce the soil salinity through reasonable irrigation and application of nitrogen.

5. Conclusions

The effects of controlled drainage on the soil water–crop–environment system were examined through field experiments in oilseed sunflower farmland, and the changes in water, nutrients, and salts in the soil were quantified. The results showed that CD was able to increase the quantity of water and decrease the nutrient concentrations in the soil, thereby increasing the yield. Compared with FD, CD reduced the concentration of nitrate in the drainage and the loss of it, and the N O 3 -N loss in the CD system was reduced by 14.71–29.41%. There was a higher degree of salinization at the later stages of plant growth, but at such stages, the plants had enhanced tolerance to salts and had an increased need for water; thus, the soil salinity had a smaller effect on plant growth at later growth stages. CD also increased the height, stem thickness, water-use efficiency, and yield of oilseed sunflower. Therefore, there is great potential in the development of CD technology for increasing crop yields and improving water quality.

Author Contributions

The contributions of X.D., H.S., R.L., and Q.M. were involved in designing the manuscript; X.D., F.T., D.Y., L.Z., and B.W. carried out this experiment; X.D. and H.S. analyzed the data and wrote the manuscript. All authors have read and agreed to the published version of the manuscript.

Funding

This research was funded by the National Natural Science Foundation of China (51879132 and 51769024), the Major Science and Technology Projects of Inner Mongolia (zdzx2018059), and the Major Water Conservancy Science and Technology Projects of Inner Mongolia (nsk2018-M5).

Institutional Review Board Statement

Not applicable.

Informed Consent Statement

No applicable.

Data Availability Statement

Not applicable.

Conflicts of Interest

The authors declare no conflict of interest.

References

  1. Skaggs, R.W.; Breve, M.A.; Gilliam, J.W. Hydrologic and water quality impacts of agricultural drainage. Crit. Rev. Environ. Sci. Technol. 1994, 24, 1–32. [Google Scholar] [CrossRef]
  2. Skaggs, R.W.; Breve, M.A.; Gilliam, J.W. Predicting effects of water table management on loss of nitrogen from poorly drained soils. Eur. J. Agron. 1995, 4, 441–451. [Google Scholar] [CrossRef]
  3. Evans, R.O.; Skaggs, R.W.; Gilliam, J.W. Controlled versus Conventional Drainage Effects on Water Quality. J. Irrig. Drainage. Eng. 1995, 121, 271–276. [Google Scholar] [CrossRef]
  4. Fisher, M.J.; Fausey, N.R.; Subler, S.E.; Brown, L.C.; Bierman, P.M. Water Table Management, Nitrogen Dynamics, and Yields of Corn and Soybean. Soil Sci. Soc. Am. J. 1999, 63, 1786–1795. [Google Scholar] [CrossRef]
  5. Ritzema, H.P. Drain for Gain: Managing salinity in irrigated lands A-review. Agric. Water Manag. 2016, 176, 18–28. [Google Scholar] [CrossRef] [Green Version]
  6. Sloan, B.P.; Basu, N.B.; Mantilla, R. Hydrologic impacts of subsurface drainage at the field scale: Climate, landscape and anthropogenic controls. Agric. Water Manag. 2016, 165, 1–10. [Google Scholar] [CrossRef]
  7. Williams, M.R.; King, K.W.; Fausey, N.R. Drainage water management effects on tile discharge and water quality. Agric. Water Manag. 2015, 148, 43–51. [Google Scholar] [CrossRef]
  8. Moriasi, D.N.; Rossi, C.G.; Arnold, J.G.; Tomer, M.D. Evaluating hydrology of the Soil and Water Assessment Tool (SWAT) with new tile drain equations. J. Soil Water Conserv. 2012, 67, 513–524. [Google Scholar] [CrossRef]
  9. Golmohammadi, G.; Rudra, R.P.; Prasher, S.O.; Madani, A.; Goel, P.K.; Mohammadi, K. Modeling the impacts of tillage practices on water table depth, drain outflow and nitrogen losses using DRAINMOD. Comput. Electron. Agric. 2016, 124, 73–83. [Google Scholar] [CrossRef]
  10. Luo, W.; Sands, G.R.; Youssef, M.; Strock, J.S.; Song, I.; Canelon, D. Modeling the impact of alternative drainage practices in the northern Corn-belt with DRAINMOD-NII. Agric. Water Manag. 2010, 97, 389–398. [Google Scholar] [CrossRef]
  11. Singh, R.; Helmers, M.; Crumpton, W.G.; Lemke, D.W. Predicting effects of drainage water management in Iowa’s subsurface drained landscapes. Agric. Water Manag. 2007, 92, 162–170. [Google Scholar] [CrossRef]
  12. Dou, X.; Shi, H.B.; Li, R.P.; Miao, Q.F.; Tian, F.; Yu, D.D. Effects of Spring Irrigation Quotas on Soil Water and Salt Transport under Condition of Subsurface Drainage. Trans. Chin. Soc. Agric. Mach. 2020, 51, 318–328. [Google Scholar] [CrossRef]
  13. Wei, C.C.; Ren, S.M.; Yang, P.L.; Wang, Y.; He, X.; Xu, Z.; Wei, R.; Wang, S.J.; Chi, Y.B.; Zhang, M.T. Effects of irrigation methods and salinity on CO2 emissions from farmland soil during growth and fallow periods. Sci. Total Environ. 2021, 752, 141639. [Google Scholar] [CrossRef]
  14. Wei, C.C.; Li, F.H.; Yang, P.L.; Ren, S.M.; Wang, S.J.; Wang, Y.; Xu, Z.; Xu, Y.; Wei, R.; Zhang, Y.X. Effects of Irrigation Water Salinity on Soil Properties, N2O Emission and Yield of Spring Maize under Mulched Drip Irrigation. Water 2019, 11, 1548. [Google Scholar] [CrossRef] [Green Version]
  15. Qadir, M.; Ghafoor, A.; Murtaza, G. Amelioration strategies for sodic soils: A review. Land Degrad. Dev. 2001, 11, 501–521. [Google Scholar] [CrossRef]
  16. Ritzema, H.P.; Nijland, H.J.; Croon, F.W. Subsurface drainage practices: From manual installation to large-scale implementation. Agric. Water Manag. 2006, 86, 60–71. [Google Scholar] [CrossRef]
  17. Ghumman, A.R.; Ghazaw, Y.M.; Hashmi, H.N.; Kamal, M.A.; Niazi, M.F. Environmental and socio-economic impacts of pipe drainage in Pakistan. Environ. Monit. Assess. 2012, 184, 1671–1681. [Google Scholar] [CrossRef]
  18. Ali, A.M.; Van Leeuwen, H.M.; Koopmans, R.K. Benefits of Draining Agricultural Land in Egypt: Results of Five Years’ Monitoring of Drainage Effects and Impacts. Int. J. Water Resour. Dev. 2001, 17, 633–646. [Google Scholar] [CrossRef]
  19. Li, S.; Luo, W.; Jia, Z.; Tang, S.; Chen, C. The effect of natural rainfall on salt leaching under watertable management. Land Degrad. Dev. 2018, 29, 1953–1961. [Google Scholar] [CrossRef]
  20. Ayars, J.E.; Christen, E.W.; Hornbuckle, J.W. Controlled drainage for improved water management in and regions irrigated agriculture. Agric. Water Manag. 2006, 86, 128–139. [Google Scholar] [CrossRef]
  21. Wang, Z.; Shao, G.; Lu, J.; Zhang, K.; Gao, Y.; Ding, J. Effects of controlled drainage on crop yield, drainage water quantity and quality: A meta-analysis. Agric. Water Manag. 2020, 239, 106253. [Google Scholar] [CrossRef]
  22. Youssef, M.A.; Abdelbaki, A.M.; Negm, L.M.; Skaggs, R.W.; Thorp, K.R.; Jaynes, D.B. DRAINMOD-simulated performance of controlled drainage across the US Midwest. Agric. Water Manag. 2018, 197, 54–66. [Google Scholar] [CrossRef]
  23. Chi, B.X.; Shi, H.B.; Xu, D.; Jiao, P.J. Distribution and variation of water and salt in soil profile under controlling subsurface drainage. Trans. Chin. Soc. Agric. Eng. 2021, 37, 148–158. [Google Scholar] [CrossRef]
  24. Huang, Q.Z.; Xu, X.; Lü, L.J.; Ren, D.Y.; Ke, J.D.; Xiong, Y.W.; Huo, Z.L.; Huang, G.H. Soil salinity distribution based on remote sensing and its effect on crop growth in Hetao Irrigation District. Trans. Chin. Soc. Agric. Eng. 2018, 34, 102–109. [Google Scholar] [CrossRef]
  25. Tong, W.J.; Chen, X.L.; Wen, X.Y.; Chen, F.; Zhang, H.L.; Chu, Q.Q.; Dikgwatlhe, S.B. Applying a salinity response function and zoning saline land for three field crops: A case study in the Hetao Irrigation District, Inner Mongolia, China. J. Integr. Agric. 2015, 14, 178–189. [Google Scholar] [CrossRef] [Green Version]
  26. Zhao, Y.J.; Mao, F.; Yang, X.H. Soil Salinization and Its Improvement in Arid Hetao Plain, Inner Mongolia: Irrigation Roles. Chin. For. Sci. Technol. 2010, 184, 31–39. [Google Scholar]
  27. Houba, V.J.G.; Novozamsky, I.; Huybregts, A.W.M.; Van der lee, J.J. Comparison of soil extractions by 0.01M CaCl2, by EUF and by some conventional extraction procedures. Plant Soil 1986, 96, 433–437. [Google Scholar] [CrossRef]
  28. Scanlon, B.R.; Healy, R.W.; Cook, P.G. Choosing appropriate techniques for quantifying groundwater recharge. Hydrogeol. J. 2002, 10, 347. [Google Scholar] [CrossRef]
  29. Ayars, J.E.; Christen, E.W.; Soppe, R.W.; Meyer, W.S. The resource potential of in-situ shallow ground water use in irrigated agriculture: A review. Irrig. Sci. 2006, 24, 147–160. [Google Scholar] [CrossRef]
  30. Christen, E.; Skehan, D. Design and Management of Subsurface Horizontal Drainage to Reduce Salt Loads. J. Irrig. Drain. Eng. 2001, 127, 148–155. [Google Scholar] [CrossRef]
  31. Christen, E.W.; Ayars, J.E.; Hornbuckle, J.W. Subsurface drainage design and management in irrigated areas of Australia. Irrig. Sci. 2001, 21, 35–43. [Google Scholar] [CrossRef]
  32. He, Y.; Zhang, J.; Yang, S.; Hong, D.; Xu, J. Effect of controlled drainage on nitrogen losses from controlled irrigation paddy fields through subsurface drainage and ammonia volatilization after fertilization. Agric. Water Manag. 2019, 221, 231–237. [Google Scholar] [CrossRef]
  33. Ng, H.Y.F.; Tan, C.S.; Drury, C.F.; Gaynor, J.D. Controlled drainage and subirrigation influences tile nitrate loss and corn yields in a sandy loam soil in Southwestern Ontario. Agric. Ecosyst. Environ. 2002, 90, 81–88. [Google Scholar] [CrossRef]
  34. Wesström, I.; Messing, I. Effects of controlled drainage on N and P losses and N dynamics in a loamy sand with spring crops. Agric. Water Manag. 2007, 87, 229–240. [Google Scholar] [CrossRef]
  35. Wesström, I.; Messing, I.; Linnér, H.; Lindström, J. Controlled drainage—Effects on drain outflow and water quality. Agric. Water Manag. 2001, 47, 85–100. [Google Scholar] [CrossRef]
  36. Li, S.; Luo, W.; Jia, Z.; Tang, S.; Chen, C. The Pros and Cons of Encouraging Shallow Groundwater Use through Controlled Drainage in a Salt-Impacted Irrigation Area. Water Resour. Manag. 2018, 32, 2475–2487. [Google Scholar] [CrossRef]
  37. Skaggs, R.W.; Fausey, N.R.; Nolte, B.H. Water Management Model Evaluation for North Central Ohio. Agric. Eng. 1981, 24, 922–928. [Google Scholar] [CrossRef]
  38. He, Y.P.; Zhang, Z.Y.; Xu, J.Z.; Yang, S.H.; Hong, D.L. Reducing nitrogen leaching losses from paddy field under water-saving irrigation by water table control. Trans. Chin. Soc. Agric. Eng. 2014, 30, 121–127. [Google Scholar] [CrossRef]
  39. Yuan, N.N.; Huang, J.S.; Xie, H.; Huang, Z.Q. Experimental study of nitrogen leaching pattern in controlled pipe-drainage cotton field. Trans. Chin. Soc. Agric. Eng. 2010, 26, 8–13. [Google Scholar] [CrossRef]
  40. Sunohara, M.D.; Gottschall, N.; Craiovan, E.; Wilkes, G.; Topp, E.; Frey, S.K.; Lapen, D.R. Controlling tile drainage during the growing season in Eastern Canada to reduce nitrogen, phosphorus, and bacteria loading to surface water. Agric. Water Manag. 2016, 178, 159–170. [Google Scholar] [CrossRef]
  41. Husk, B.R.; Anderson, B.C.; Whalen, J.K.; Sanchez, J.S. Reducing nitrogen contamination from agricultural subsurface drainage with denitrification bioreactors and controlled drainage. Biosyst. Eng. 2017, 153, 52–62. [Google Scholar] [CrossRef]
  42. Nash, P.R.; Singh, G.; Nelson, K.A. Nutrient loss from floodplain soil with controlled subsurface drainage under forage production. J. Environ. Qual. 2020, 49, 1000–1010. [Google Scholar] [CrossRef]
  43. Negm, L.M.; Youssef, M.A.; Jaynes, D.B. Evaluation of DRAINMOD-DSSAT simulated effects of controlled drainage on crop yield, water balance, and water quality for a corn-soybean cropping system in central Iowa. Agric. Water Manag. 2017, 187, 57–68. [Google Scholar] [CrossRef] [Green Version]
  44. Qiao, X.; Shao, D.G.; Liu, H.H.; Yuan, J.G. Study on the moving and transforming law of N and P under water-saving irrigation and controlled drainage. J. Hydraul. Eng. 2011, 42, 862–868. [Google Scholar] [CrossRef]
  45. Chilundo, M.; Joel, A.; Wesström, I.; Brito, R.; Messing, I. Response of maize root growth to irrigation and nitrogen management strategies in semi-arid loamy sandy soil. Field Crops Res. 2017, 200, 143–162. [Google Scholar] [CrossRef]
  46. Jing, J.; Zhang, F.; Rengel, Z.; Shen, J. Localized fertilization with P plus N elicits an ammonium-dependent enhancement of maize root growth and nutrient uptake—ScienceDirect. Field Crops Res. 2012, 133, 176–185. [Google Scholar] [CrossRef]
  47. Guan, D.H.; Al-Kaisi, M.M.; Zhang, Y.S.; Duan, L.S.; Tan, W.M. Tillage practices affect biomass and grain yield through regulating root growth, root-bleeding sap and nutrients uptake in summer maize. Field Crops Res. 2014, 157, 89–97. [Google Scholar] [CrossRef]
  48. Mu, X.H.; Chen, F.J.; Wu, Q.P.; Chen, Q.W.; Wang, J.F.; Yuan, L.X.; Mi, G.H. Genetic improvement of root growth increases maize yield via enhanced post-silking nitrogen uptake. Eur. J. Agron. 2015, 63, 55–61. [Google Scholar] [CrossRef]
  49. Liu, Y.; Li, Y.F.; Liu, J.S. Effects of nitrogen management on the growth and yield of mulched and drip-irrigated maize in Northeast Black Soil Regions. J. Hydraul. Eng. 2014, 45, 529–536. [Google Scholar] [CrossRef]
  50. Ale, S.; Bowling, L.C.; Brouder, S.M.; Frankenberger, J.R.; Youssef, M.A. Simulated effect of drainage water management operational strategy on hydrology and crop yield for Drummer soil in the Midwestern United States. Agric. Water Manag. 2009, 96, 653–665. [Google Scholar] [CrossRef]
  51. Wesstrom, I.; Joel, A.; Messing, I. Controlled drainage and subirrigation—A water management option to reduce non-point source pollution from agricultural land. Agric. Ecosyst. Environ. 2014, 198, 74–82. [Google Scholar] [CrossRef]
  52. Fang, Q.X.; Malone, R.W.; Ma, L.; Jaynes, D.B.; Thorp, K.R.; Green, T.R.; Ahuja, L.R. Modeling the effects of controlled drainage, N rate and weather on nitrate loss to subsurface drainage. Agric. Water Manag. 2012, 103, 150–161. [Google Scholar] [CrossRef]
  53. Zhou, X.M.; Madramootoo, C.A.; Mackenzie, A.F.; Kaluli, J.W.; Smith, D.L. Corn yield and fertilizer N recovery in water-table-controlled corn-rye-grass systems. Eur. J. Agron. 2000, 12, 83–92. [Google Scholar] [CrossRef]
  54. Grigg, B.C.; Southwick, L.M.; Fouss, J.L.; Kornecki, T.S. Drainage system impacts on surface runoff, nitrate loss, and crop yield on a southern alluvial soil. Trans. ASAE 2003, 46, 1531–1537. [Google Scholar] [CrossRef]
  55. Tolomio, M.; Borin, M. Controlled drainage and crop production in a long-term experiment in North-Eastern Italy. Agric. Water Manag. 2019, 222, 21–29. [Google Scholar] [CrossRef]
  56. Gheysari, M.; Sadeghi, S.H.; Loescher, H.W.; Amiri, S.; Zareian, M.J.; Majidi, M.M.; Asgarinia, P.; Payero, J.O. Comparison of deficit irrigation management strategies on root, plant growth and biomass productivity of silage maize. Agric. Water Manag. 2017, 182, 126–138. [Google Scholar] [CrossRef] [Green Version]
  57. Wang, Y.Z.; Zhang, X.Y.; Liu, X.W.; Zhang, X.Y.; Shao, L.W.; Sun, H.Y.; Chen, S.Y. The effects of nitrogen supply and water regime on instantaneous WUE, time-integrated WUE and carbon isotope discrimination in winter wheat. Field Crop. Res. 2013, 144, 236–244. [Google Scholar] [CrossRef]
  58. Xu, Z.; Shi, H.B.; Li, X.Y.; Zhou, H.; Fu, X.J.; Li, Z.Z. Response of maize yield to irrigation and nitrogen rate in different salinization farmlands. Trans. Chin. Soc. Agric. Mach. 2019, 50, 334–343. [Google Scholar] [CrossRef]
  59. Chen, W.; Hou, Z.N.; Wu, L.S.; Liang, Y.C.; Wei, C.Z. Effects of salinity and nitrogen on cotton growth in arid environment. Plant Soil 2010, 326, 61–73. [Google Scholar] [CrossRef] [Green Version]
  60. Pessarakli, M. Handbook of Plant and Crop Stress, 2nd ed.; CRC Press: Boca Raton, FL, USA, 1999. [Google Scholar] [CrossRef]
Figure 1. The location of the experimental area.
Sustainability 13 09835 g001
Figure 2. Rainfall and temperature during the growth stages of oilseed sunflower.
Sustainability 13 09835 g002
Figure 3. Field layout diagram for the layout of the field plots (a) and the device for controlling drainage (b).
Sustainability 13 09835 g003
Figure 4. Dynamic changes in soil moisture content in different treatments for 0–20 (a), 20–40 (b), 40–60 (c), 60–80 (d), 80–100 (e), and 0–100 cm (f) under a drainage depth of 40 cm during the plant growth stages (CWT1), a drainage depth of 70 cm during the plant growth stages (CWT2), free drainage (FD), and open-ditch drainage(OD).
Sustainability 13 09835 g004
Figure 5. Changes in soil salt (EC) content in different treatments for 0–20 (a), 20–40 (b), 40–60 (c), 60–80 (d), 80–100 (e), and 0–100 cm (f) under a drainage depth of 40 cm during the plant growth stages (CWT1), a drainage depth of 70 cm during the plant growth stages (CWT2), free drainage (FD), and open-ditch drainage (OD).
Sustainability 13 09835 g005
Figure 6. Changes in soil mineral nitrogen content in different treatments for the plow layer (0–40 cm) under a drainage depth of 40 cm during the plant growth stages (CWT1), a drainage depth of 70 cm during the plant growth stages (CWT2), free drainage (FD), and open-ditch drainage (OD).
Sustainability 13 09835 g006
Figure 7. Variation in groundwater depth in different treatments (drainage depth of 40 cm (CWT1), drainage depth of 70 cm during the plant growth stages (CWT2), free drainage (FD), and open-ditch drainage (OD)) during the plant growth stages of oilseed sunflowers and rainfall and irrigation.
Sustainability 13 09835 g007
Figure 8. The relationship between controlled drainage depth and the yield of oilseed sunflowers.
Sustainability 13 09835 g008
Table 1. Soil physical properties in the experimental area.
Soils Layer/cmSoil Bulk Density (g/cm3)Soils TypeSaturated Water Capacity/%Field Moisture Capacity/%Saturated Hydraulic Conductivity (cm/s)
0–201.426~1.464Silt0.352~0.3540.219~0.2303.939 × 10−5
20–401.468~1.472Silty loam0.360~0.3650.238~0.2423.798 × 10−5
40–601.470~1.476Silt0.346~0.3510.240~0.2461.238 × 10−5
60–801.483~1.488Silt0.340~0.3470.229~0.2342.073 × 10−5
80–1001.485~1.490Silt0.348~0.3530.239~0.2415.176 × 10−5
Table 2. Nutrient content of the plow layer.
Soils Layer Organic Matter (g·kg−1)Total N (g·kg−1)Available N (mg·kg−1)Available P (mg·kg−1)Available K/(mg·kg−1)
Plowed layer13.540.85869.432218
Table 3. Growth stages of oilseed sunflower in 2019.
Growth StagesSeedling StageBudding StageFlowering StageMaturity StageHarvest
Date6/10~7/127/13~8/48/5~8/268/27~9/289/29
Table 4. Drainage and N H 4 + -N and O N 3 -N content in drainage after irrigation in different treatments.
TreatmentCWT1CWT2FDOD
Drain outflow (mm)4.235.025.891.89
NO3--N concentration (mg·L−1)5.675.785.989.34
NH4--N concentration (mg·L−1)3.553.594.575.88
Table 5. Loss of N H 4 + -N and N O 3 -N after irrigation in different treatments.
TreatmentCWT1CWT2FDOD
NO3--N losses (kg·hm2) 0.24 ± 0.01 c0.29 ± 0.01 b0.34 ± 0.02 a0.27 ±0.02 bc
NH4--N losses (kg·hm2) 0.15 ± 0.01 b0.18 ± 0.02 ab0.26 ± 0.01 a0.17 ± 0.01 ab
Different letters after the same column of data indicate that the difference between treatments is 5% significant.
Table 6. Effects of different treatments on the seedling emergence, growth, and yield of oilseed sunflower.
TreatmentGermination Rate (%)Survival Rate (%)Height (cm)Stem Diameter (mm)Yield (kg·hm−2)ET (mm)Water-Use Efficiency (kg·hm−2·mm−1)
CWT190.24 a96.62 a185.00 a27.29 a3836.11 a258.01 a14.87 a
CWT290.14 a94.00 b177.00 b26.00 ab3670.33 b253.46 b14.70 b
FD90.28 a93.71 b173.29 c25.00 b3562.10 c250.56 c14.22 c
OD87.60 b93.70 b162.29 d22.57 c3451.50 d257.19 a13.42 d
Different letters after the same column of data indicate that the difference between treatments is 5% significant.
Publisher’s Note: MDPI stays neutral with regard to jurisdictional claims in published maps and institutional affiliations.

