Article

Spatial Distribution and Source Apportionment of Soil Heavy Metals in Pearl River Delta, China

1
Guangdong Industrial Contaminated Site Remediation Technology and Equipment, Engineering Research Center, School of Environmental Science and Engineering, Guangdong University of Technology, Guangzhou 510006, China
2
Research Center for Eco-Environment Restoration Technology, South China Institute of Environmental Science, Ministry of Ecology and Environment of the People’s Republic of China, Guangzhou 510006, China
3
College of Science, Shantou University, Shantou 515063, China
*
Author to whom correspondence should be addressed.
Sustainability 2021, 13(17), 9651; https://doi.org/10.3390/su13179651
Submission received: 1 August 2021 / Revised: 22 August 2021 / Accepted: 25 August 2021 / Published: 27 August 2021
(This article belongs to the Special Issue Monitoring and Control of Environmental Hazards)

Abstract

:
The contents of ten heavy metals (HMs) (Cu, Pb, Zn, Cd, Ni, Cr, Hg, As, Co, and Mn) in 80 surface soil samples (0–20 cm) were investigated in the Pearl River Delta (PRD), Guangdong Province, China. The average contents of Cu, Pb, Zn, Cd, Ni, Cr, Hg, As, Co, and Mn were 16.45, 40.20, 45.10, 0.09, 12.93, 47.93, 0.13, 14.44, 5.68, and 199.66 mg/kg, respectively. The soil quality was generally good, though slightly higher levels (1.17, 1.61, 1.67, and 1.62 times) of soil Pb, Cd, Hg, and As contents were observed compared with the soil background values. The spatial distribution of soil HM pollution in the PRD showed that 36% of sample sites were evaluated as sites without soil pollution, 32% as sites with slight pollution, 20% as sites with nearly moderate pollution, 9% as sites with moderate pollution, and 3% as site with serious pollution. Source apportionment analysis showed that the source of 64.33% of soil HMs in the PRD could be explained by natural and industrial sources, 24.80% by transportation, and 10.87% by agricultural activities.

1. Introduction

To achieve sustainable development, it is necessary to collect basic environmental information for resources such as soil and to investigate the contamination status of heavy metals (HMs) in rapidly developing economic regions. Soil HMs have received long-term attention due to the persistent threat they pose to regional ecosystems [1]. The excessive accumulation of HMs in the soil at high rates in the long-term is an irreversible process that reduces soil quality and ultimately damages agricultural lands [2]. Natural factors, such as type of geological formation, can lead to soil HM pollutions [3]. Agricultural and industrial activities have intensified the input of HMs to soil ecosystems [4]. HMs, such as Cu, Zn, Ni, Cd, Pb, Cr, Hg, and As, not only affect the quality of crops, but also accumulate in the human body through food-chain accumulation and harm public health, resulting in most countries listing them as priority pollutants to control [5,6,7]. The abovementioned eight HMs have been listed as priority pollutants by the United Environmental Protection agency, based on a series of hazards. However, previous studied have found that inadequate Co in the human body can lead to anemia and anorexia, and excessive Co intake can cause pancreatic failure, cardiomyopathy, different types of cancer, hypothyroidism, and bone marrow proliferation [8]. The excessive intake of Mn in childhood can cause a neurotoxic syndrome that impedes dopamine balance and behavior control [9]. It had also been reported that Ni, Cr, and Mn were important factors leading to endemic diseases in the Guangdong province due to their uneven spatial distribution [10]. Therefore, soil Co and Mn contents have also been considered priority HMs in the Pearl River Delta (PRD).
In order to effectively and comprehensively control soil HM pollution, the distribution pattern of soil HMs as well as their possible sources must be analyzed. However, the distribution pattern of soil HMs is significantly related to soil surface runoff, soil water penetration, atmospheric deposition, organic matter content, particle size, soil acidity and clay content, distance from main roads, and so on [11,12]. Soil HMs mainly originate from the lithology of the parent rock and the weathering of cornerstone, affected by geology, soil texture, soil type, and pH value. Meanwhile, anthropogenic factors, such as transportation, fossil fuel combustion, factory metal processing, agricultural activities, also have an effect on the amounts of HMs in soil [13].
In the PRD, the most rapidly developing economic region in the Guangdong province, South China, the serious burden of soil HMs has escalated due to increasing population density, dramatic industrialization, and rapid urbanization [14]. Dramatic development, emerging industrial activities, and intensive contaminant emissions may cause soil quality to deteriorate. This process undoubtedly causes a certain degree of impact on the environment of the soils in the PRD, including through HM pollution. However, it is still the case that very few published literatures have systematically delineated the pollution levels, spatial distribution, and potential sources of soil HMs in the PRD. The source apportionment of soil HMs is significant not only for the effective treatment of contaminated soil, but also for the prevention of potential environmental risks in the PRD [15]. As a result, there is an urgent need to assess the main sources of soil HMs in the PRD.
Based on the advanced retrieval function of the Web of Science (WoS) database, a total of 1964 articles regarding the source apportionment of soil pollutants in the last 10 years were collected using VOSviewer software. The most common keywords appeared as follows (Figure 1): soils (549 times, total correlation strength 3558), where soil HMs such as Cd and Pb were those most frequently referred to (Cluster 1); HMs (390 times, total correlation strength 2589), where the spatial distribution of soil HMs was the mail focus (Cluster 2); persistent organic pollutants (206 times, total correlation strength 1526), related to health risks and polycyclic aromatic hydrocarbons (PAHs) (Cluster 3); source apportionment (525 times, total correlation strength 3723), where much attention was given to the source apportionment of particulate matter and soil HMs (Cluster 4).
Previously, various receptor models including principal component analysis/multiple linear regression (PCA-MLR) [16], chemical mass balance (CMB) [17], positive matrix factorization (PMF) [18], and edge analysis (UNMIX) [19] have been used to apportion the contribution of different sources. Specifically, receptor models such as PCA and PMF appear frequently as the preferred options for source apportionment studies, as these models do not require pre-measured source profiles (i.e., the backward-tracking approach) in contrast to CMB, and the PMF receptor modeling approach has been found to be more robust with different land-use types. The source contributions estimated by the PCA-MLR model seem to be more accurate than those estimated by the PMF model [20].
The source apportionment and identification of the spatial variability of sources of HMs in the PRD have not been clearly understood yet. In order to better understand the potential risk created by soil HMs in the PRD, the PCA-MLR model was applied to estimate the possible sources of soil HMs quantitively in a relatively wide region (PRD) with multiple land-use types in this study, aiming to: (1) clarify the soil pollution situation and spatial distribution characteristics, and (2) provide possible sources of soil HMs and calculate the contribution level of different sources. This model will allow us to give some insights into the prevention and control of the environmental risks posed by soil HMs through understanding the current pollution status and potential sources of soil HMs, especially for regions which have been heavily disrupted by human activities.

2. Materials and Methods

2.1. Study Area

The studied sites included municipal and rural districts in the PRD with a total area of 5.5 × 10⁴ km2. It consisted of nine cities, including Guangzhou, Shenzhen, Dongguan, Foshan, Zhuhai, Zhaoqing, Huizhou, Zhongshan, and Jiangmen (Figure 2). Previous studies have pointed out that the PRD has gradually become the region experience the most rapid change of the ecological environment and the most serious resource depletion and environmental pollution in China, especially as regards soil HMs pollution [21], which could increase the risk of HM contamination in food chains [22]. The climate is a typical subtropical monsoon climate, with an average annual temperature of 21.9 °C and an average annual rainfall of 2200 mm. According to the statistics of the soil census office of Guangdong province, the dominant soil types can be divided into seven categorizations: paddy soil, red soil, accumulated soil, lateritic soil, yellow soil, lime soil, and salinized soil. The main types of parent rocks are granite, quaternary soil, sand shale, and metamorphic rock. The climate is hot and humid, with leaching and sedimentation ongoing features within the soil of the PRD. As a result, the soil profile is continuously depleted of alkali metals, alkali earth metals, and soluble salts, enriched with hydrogen ions and iron-aluminum oxides. Under such conditions, the soil is acidic in the PRD [23].

2.2. Soil Sample Treatment and Analysis

According to the topographic and hydrogeological conditions in the PRD, a total of 80 sampling sites (0–20 cm) were collected, with a sampling density of about 1 site per 30 km2 and an area of about 20 m2 for each randomly selected sampling site. GPS was used to locate the geographic locations of the sampling sites (Figure 2). Two surface soil samples were collected at each sampling site for geochemical analysis (Cu, Pb, Zn, Cd, Ni, Cr, Hg, As, Co, and Mn). Mixed soil samples after collection were naturally air-dried in a lab, rocks, plant branches and leaves, grass roots and other sundries were then removed, and the samples were properly mashed with wooden sticks. Then, an appropriate amount of the soil samples was taken by the quartering method and grounded with a ceramic mortar. Finally, soil samples were placed into a sealed bottle after being passed through a 100-mesh sieve.
The soil pH values were measured using a pH meter (ST3100, OHAUS Instruments Co., Changzhou, China) in 1:2.5 (w/v) deionized water. Soil Cu, Pb, Zn, Cd, Ni, Cr, Co, and Mn was detected using an Inductively Coupled Plasma-Atomic Emission Spectrometer (ICP-AES, ICPE-9800 Shimadzu Co., Kyoto, Japan) after digesting with HNO3-HF-HClO4. The elements Hg and As were determined by atomic fluorescence spectrometry (AFS230E Haiguang Analytical Instrument Co., Beijing, China). Each sample was analyzed in duplicate and all the reagents were of analytical grade. Standard quality assurance and quality control measures were followed during the analysis of the HMs. The recovery rates of the heavy metals ranged from 84 to 120%, and the results of the experiments are consistent with quality control standards (Table S1).

2.3. Evaluation of Soil HM Pollution

The geo-accumulation index ( I g e o ) is a widely used evaluation index for soil HM pollution, which can reflect not only the influence of a single HM in a specific environment, but also the composite influence of multiple HMs. According to the I g e o , the pollution degree rating is divided into seven levels (Table S2) [24]. The specific calculation equation used, Equation (1), is shown below:
I g e o = l o g 2 [ C n / ( k × B n ) ]
where, C n is the actual concentration of an element n ; B n represents the geochemical background value of an element n , taking the geochemical background values of element n in the Guangdong province as the fiducial values [25].   k is the coefficient set for changes in background values that may be caused by diagenesis (generally 1.5).

2.4. PCA-MLR Model

The PCA-MLR model is based on feature analysis and is used to extract the factor load matrix F and factor score matrix G of the receptor samples. The factor load is used to identify pollution sources, and the factor score is used to calculate source contribution rates [26,27]. The basic principle of PCA analysis is based on the least square method, that is, to seek F and G satisfying the minimum variance, which is described by the matrix as Equations (2) and (3):
Q = i = 1 n j = 1 m E i j 2
X = G × F + E
The multiple linear regression equation is described as Equation (4):
Y = h = 1 P a h X h + b  
where, Y is the total concentration of the pollutants, P is the number of factors extracted by the PCA, a h is the standardized regression coefficient of the h factor, X h is the score of the h factor extracted by PCA, and b is the regression constant term.
The independent and dependent variables were standardized and regression analysis was performed by the standardized Equation (5).
Z = 1 P B i X i  
where, B i is the multiple linear regression coefficient.
The average contribution rate of source i   ( % ) was calculated by Equation (6):
i = ( B i B i ) × 100 %

2.5. Data Processing

The descriptive statistics and principal component analysis-multiple linear regression (PCA-MLR) of the soil HMs concentrations were conducted by IBM SPSS Statistics 25 software (IBM, Chicago, IL, USA). Spatial distribution maps were accomplished by ArcGIS 10.2, and the statistical analysis by Origin 2021 software (OriginLab, Northampton, MA, USA).

3. Results and Discussion

3.1. Descriptive Statistics of HMs in PRD

The average contents of Cu, Pb, Zn, Cd, Ni, Cr, Hg, As, Co, and Mn were 16.45, 40.20, 45.10, 0.09, 12.93, 47.93, 0.13, 14.44, 5.68, and 199.66 mg/kg, respectively (Table 1). Compared with the background soil HM values of the Guangdong province, soil Pb, Cd, Hg, and As contents were 1.17, 1.61, 1.67, and 1.62 times higher, and the other soil HM contents were slightly lower in the PRD. Additionally, ten HMs were present in content values that were less than the control values stipulated by soil environmental quality standards for agricultural land in China [28]. This is due to that fact that this region has experienced the development process of pollution, reclamation, and improvement, with the environmental degradation index showing a downward trend within the PRD region during 2011–2015, which is a positive outcome of the efforts taken by the government to manage pollution to ensure that the environmental situation has been continuously improved [29]. The variation coefficients of soil Cd, Hg, and As exceeded 100%, indicating an obvious spatial heterogeneity which may be as a result of human activities [30]. Soil Pb, Cd, Hg, and As showed positive skewness, reaching values of 3.23, 4.87, 2.98 and 3.86, respectively, which may have been caused by the input of external sources [31]. The mean value of soil pH value was 5.10, indicating that the soil is acidic, as is consistent with previous studies [23].

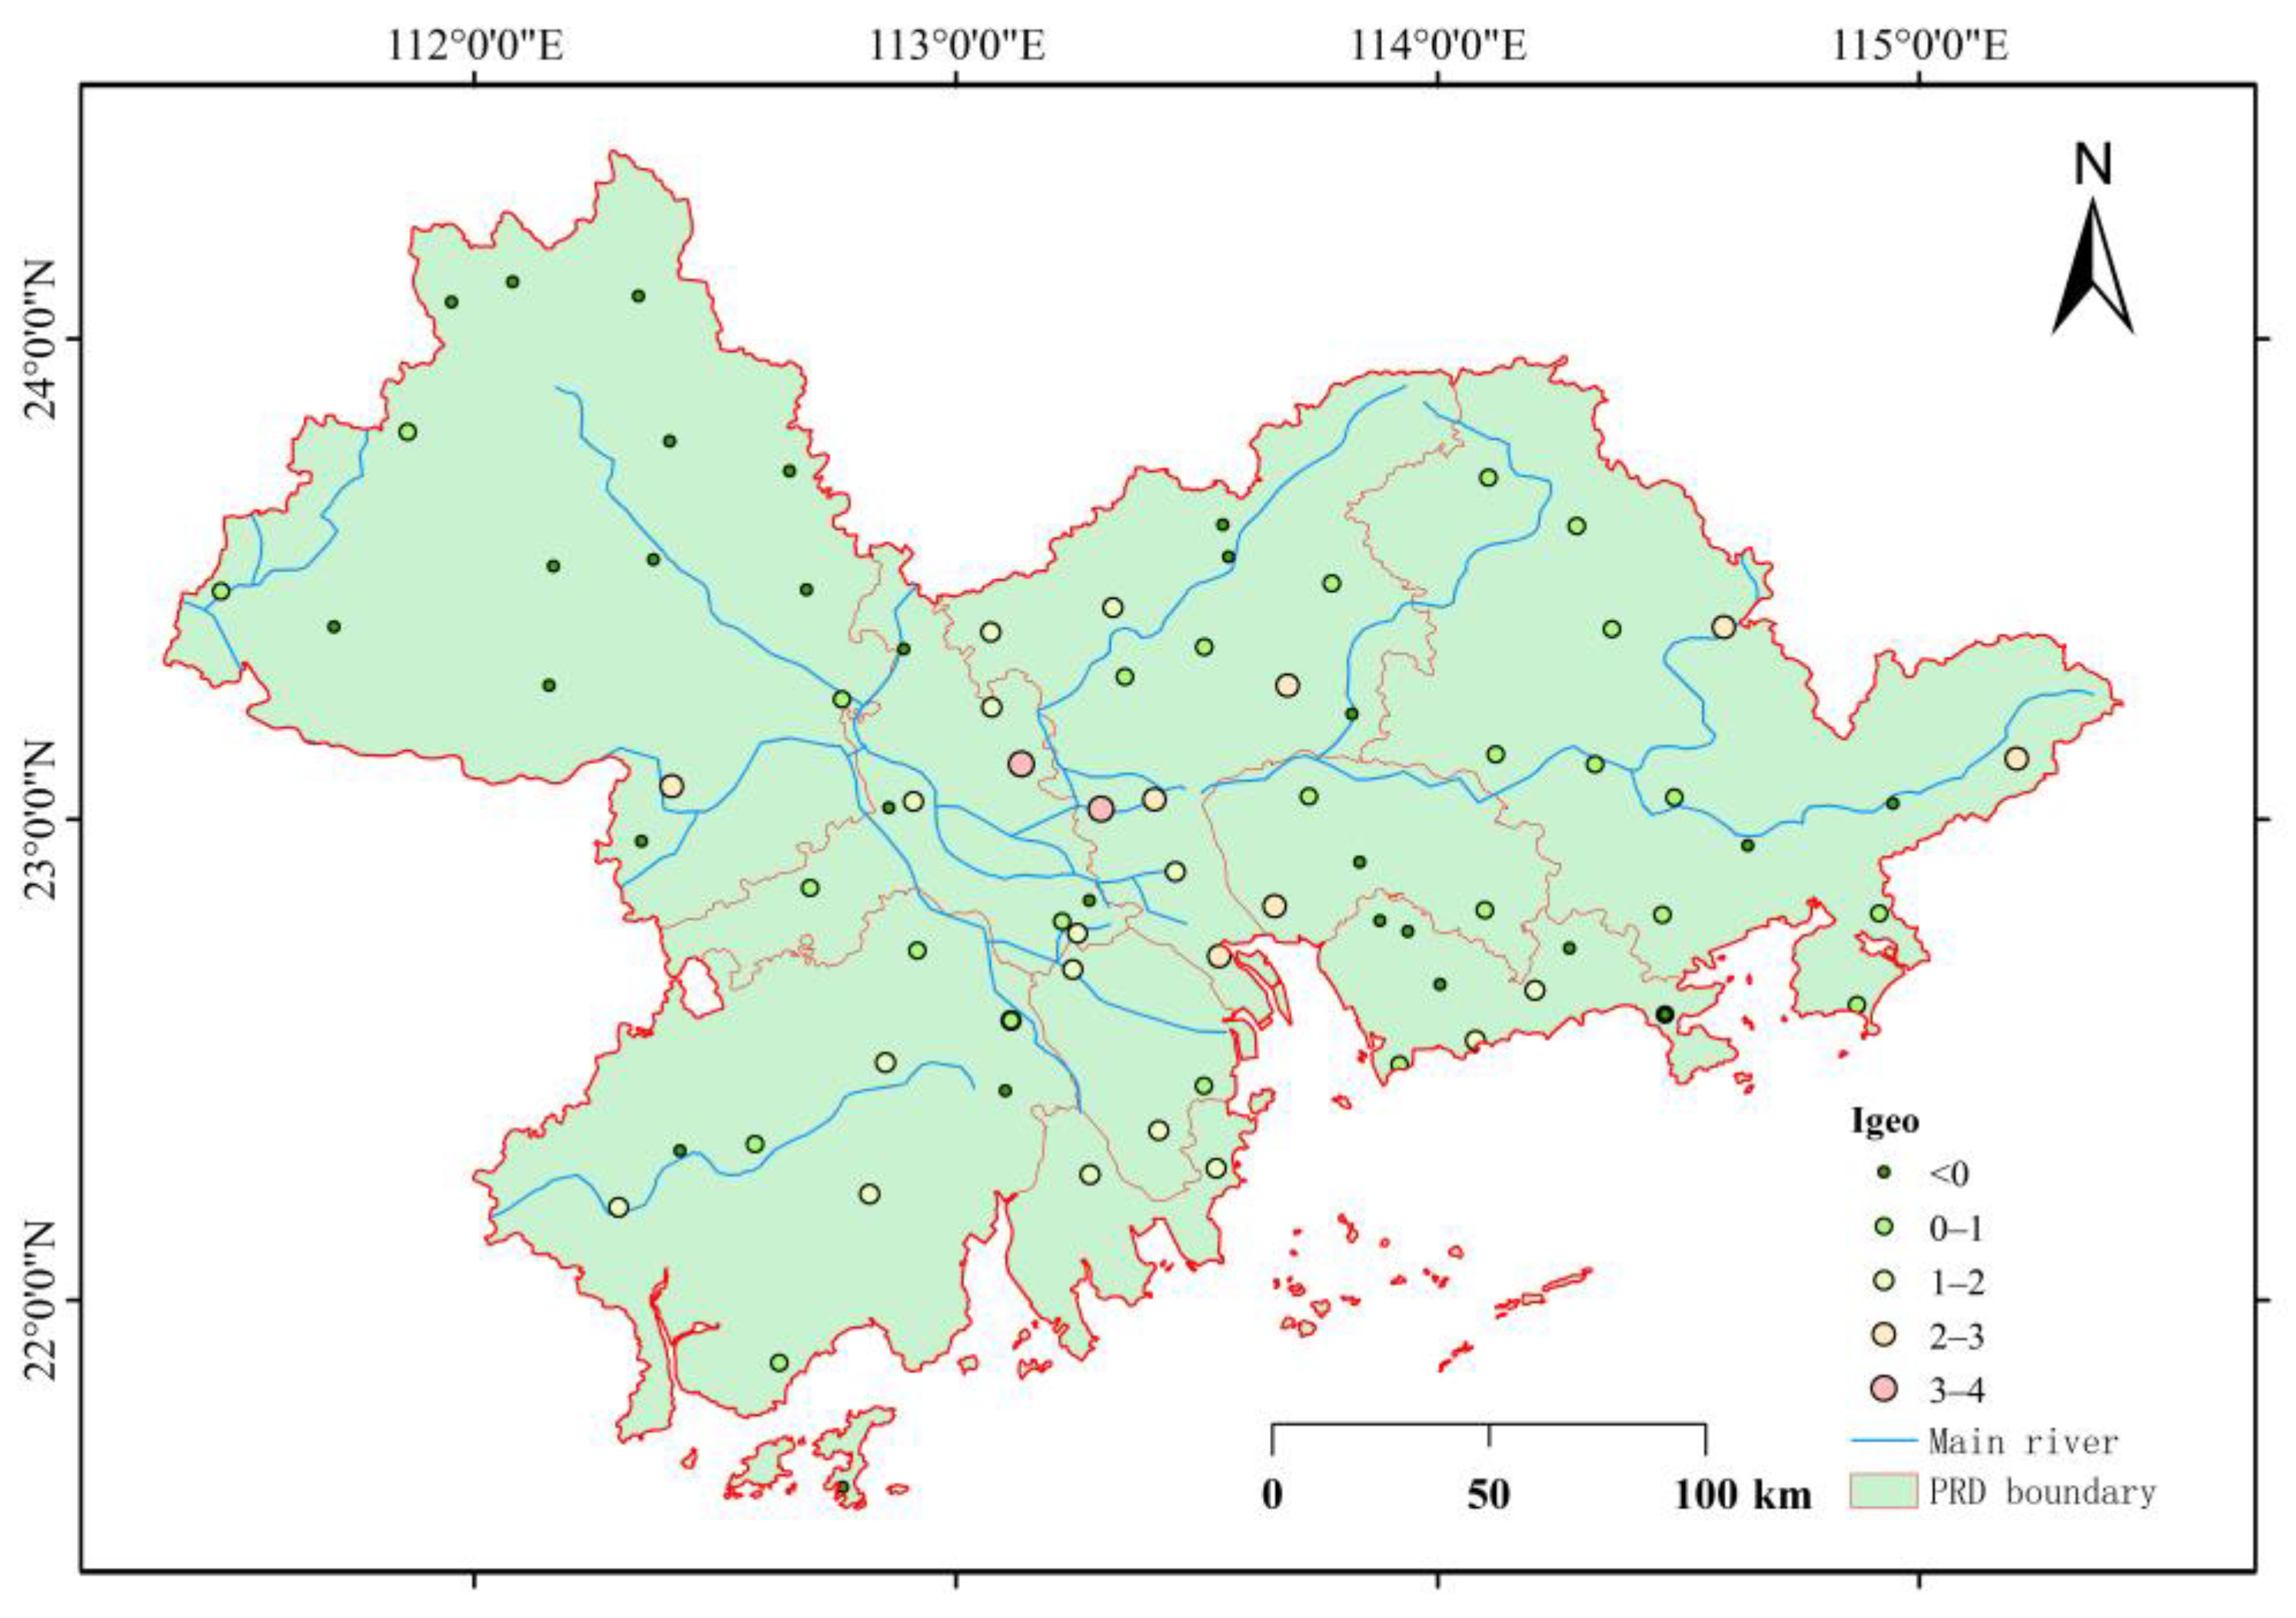
3.2. Evaluation of Soil HM Pollution

Taking the soil background values of the study area as reference values, the geo-accumulation index ( I g e o ) was used to evaluate the soil HM pollution situation in the PRD. The spatial distribution of soil HMs showed that 36% sample sites were evaluated as sites without soil pollution, 32% as sites with slight pollution, 20% as sites with nearly moderate pollution, 9% as sites with moderate pollution, and 3% as site with serious pollution (Figure 3). Serious HM pollution was found in Foshan and south of Guangzhou city, with Cd and Hg being the main contributors, which was consistent with previous studies [32]. As a result, we evaluated the soil HM pollution in the PRD to be slight or non-polluted, with low environmental risk.

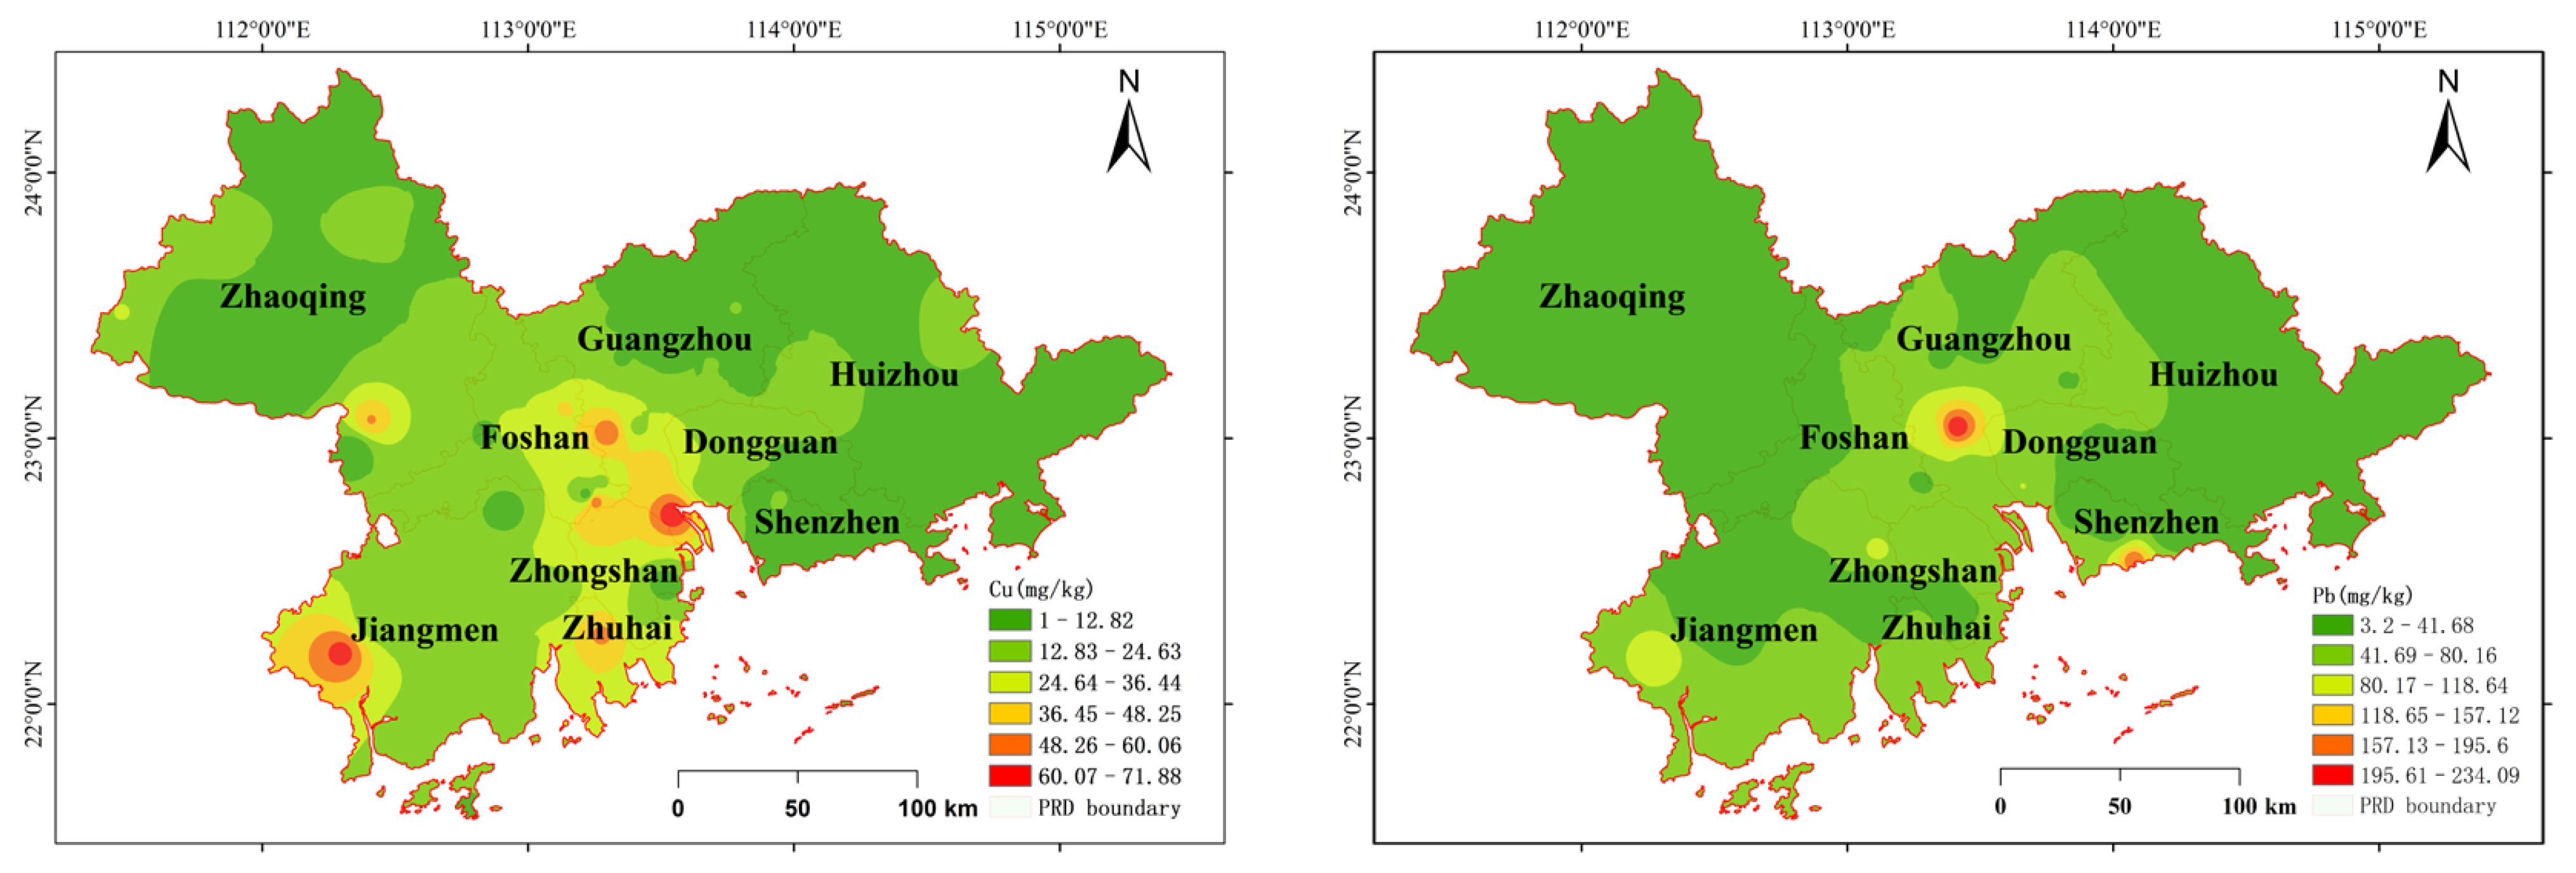
3.3. Spatial Distribution Characteristics of Soil HMs

The spatial distribution of soil HMs in the PRD are shown in Figure 4. It is shown that soil Cu, Pb, Zn, and Ni contents were much higher in Guangzhou and southern Foshan city compared with other regions, while soil Cd, Cr, Hg, and As contents were distributed evenly in the whole of the PRD except for the relatively higher values that appeared in Guangzhou, Dongguan, Foshan, Zhaoqing, and Huizhou city, which may have resulted from intensive industrial activities in these regions. Another reason may be the influence of natural geological factors, including the low mountains and hills that dominate in the PRD, causing HMs to be easily deposited in the valleys and basins of these areas.

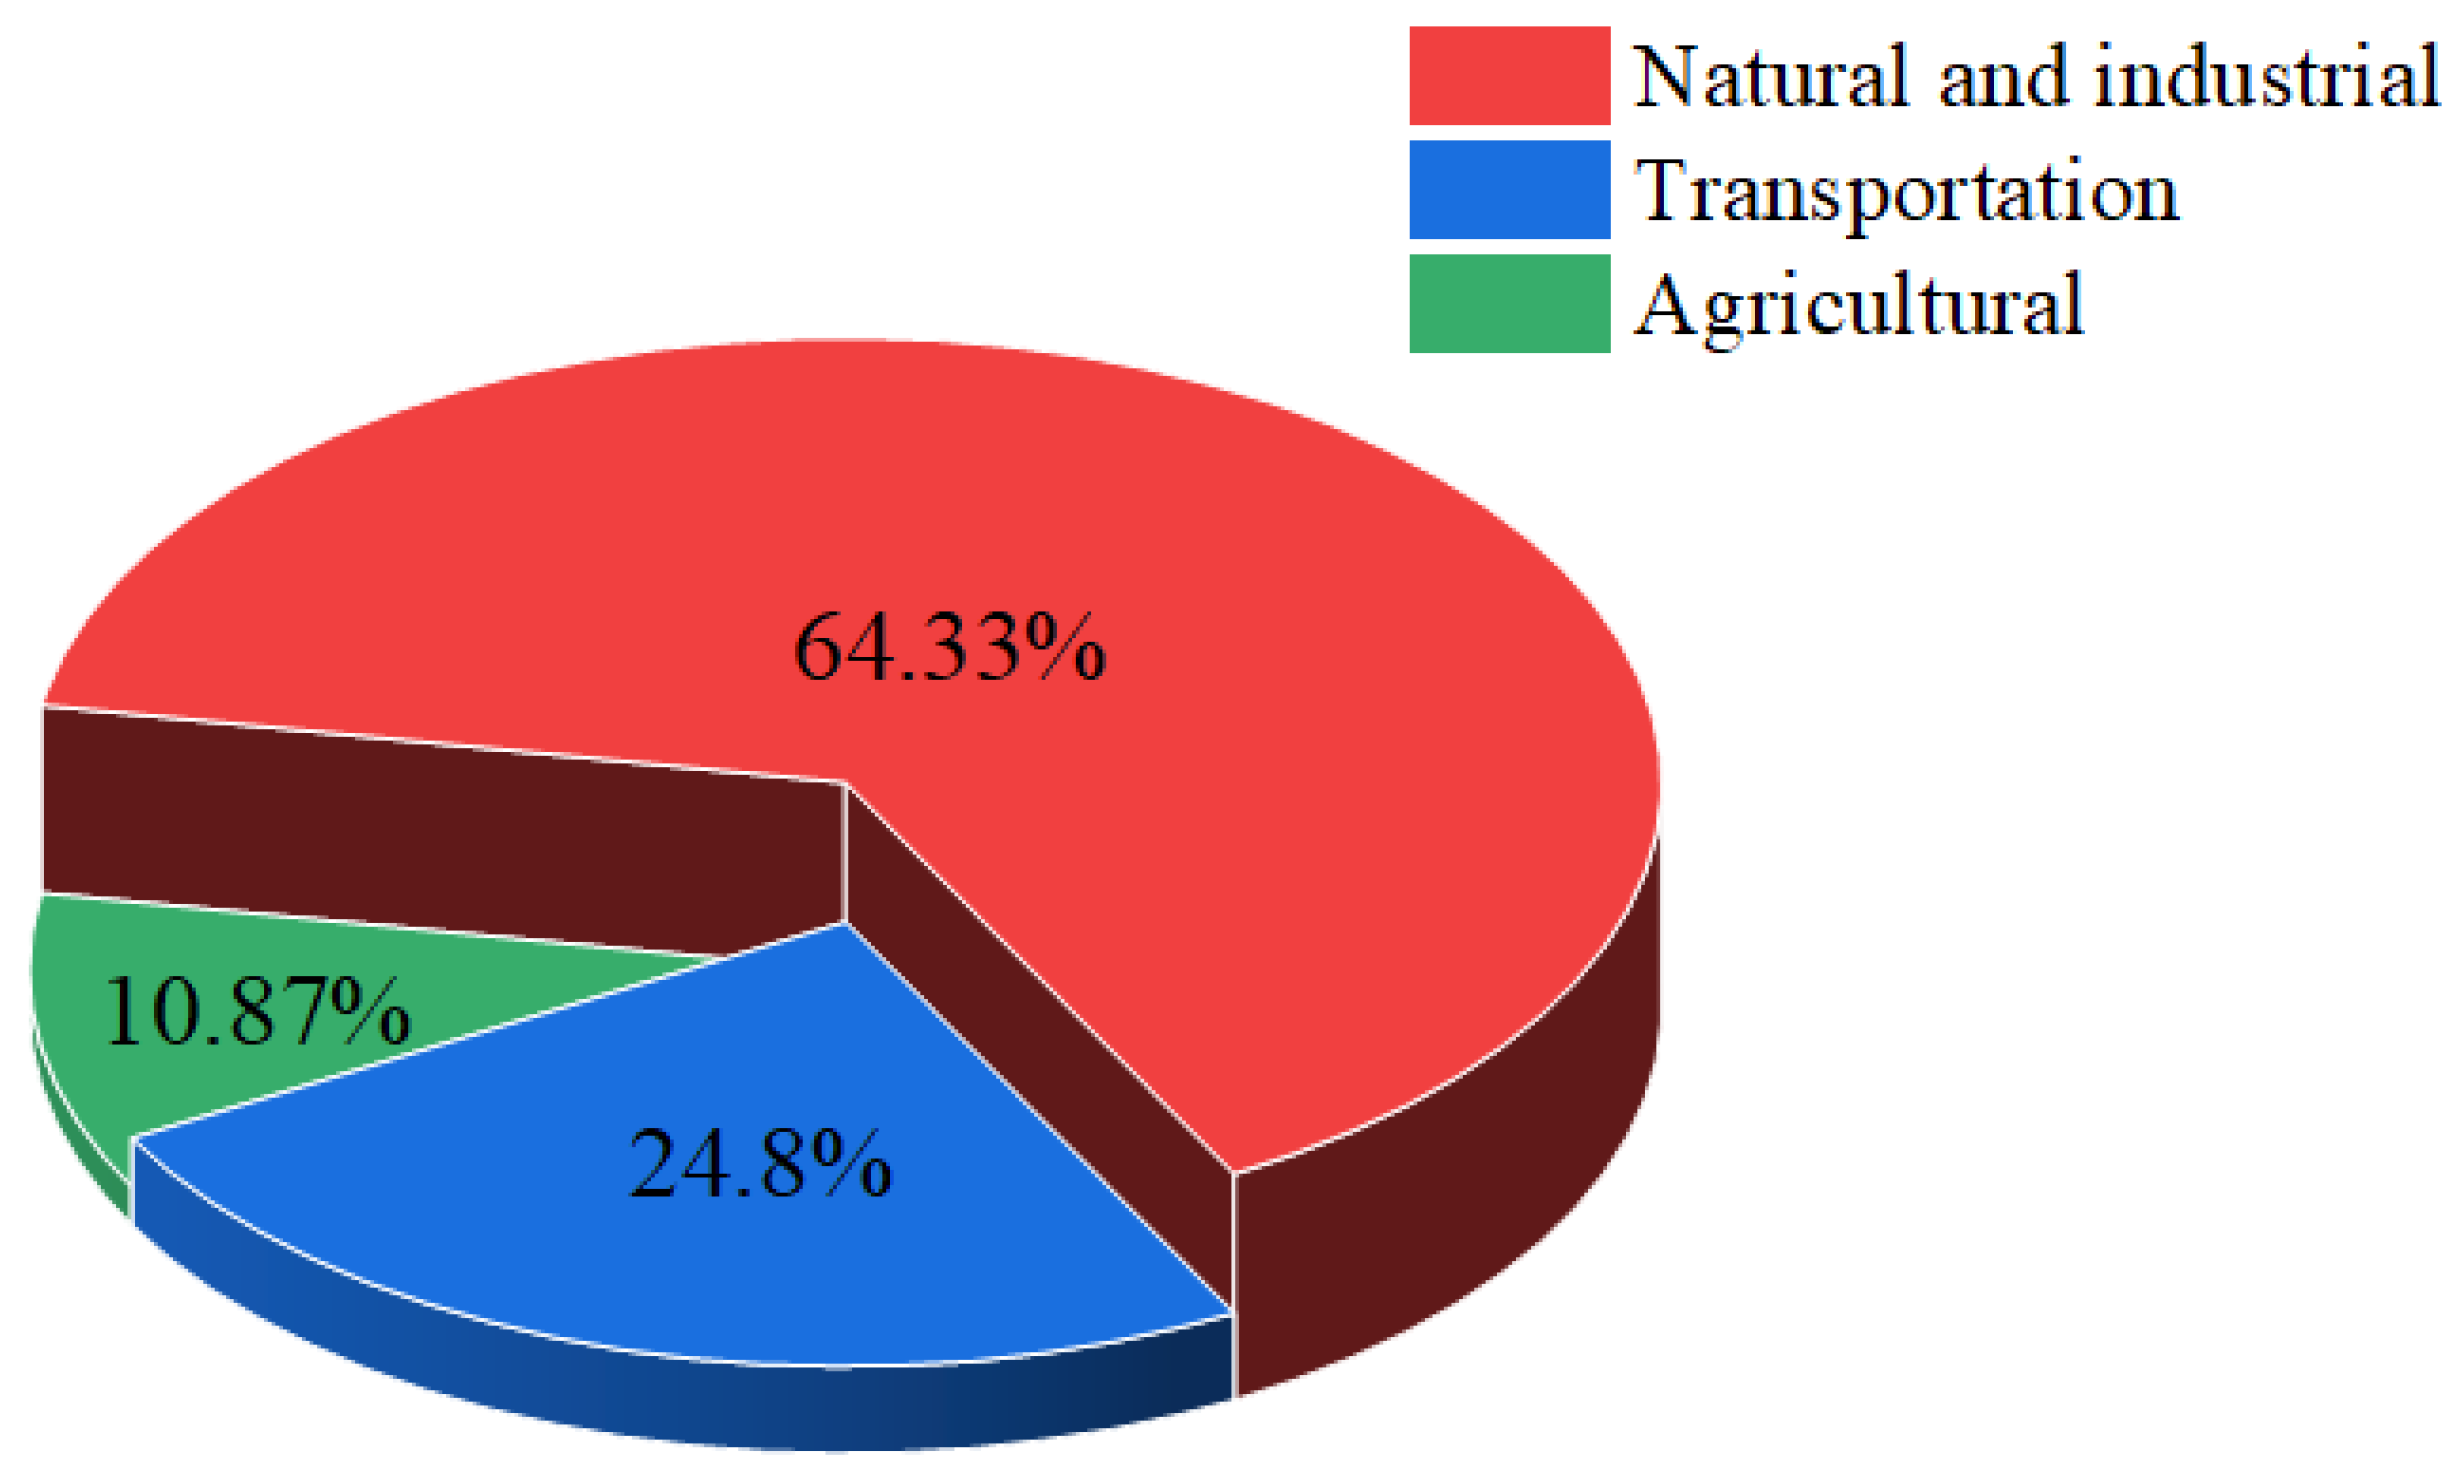
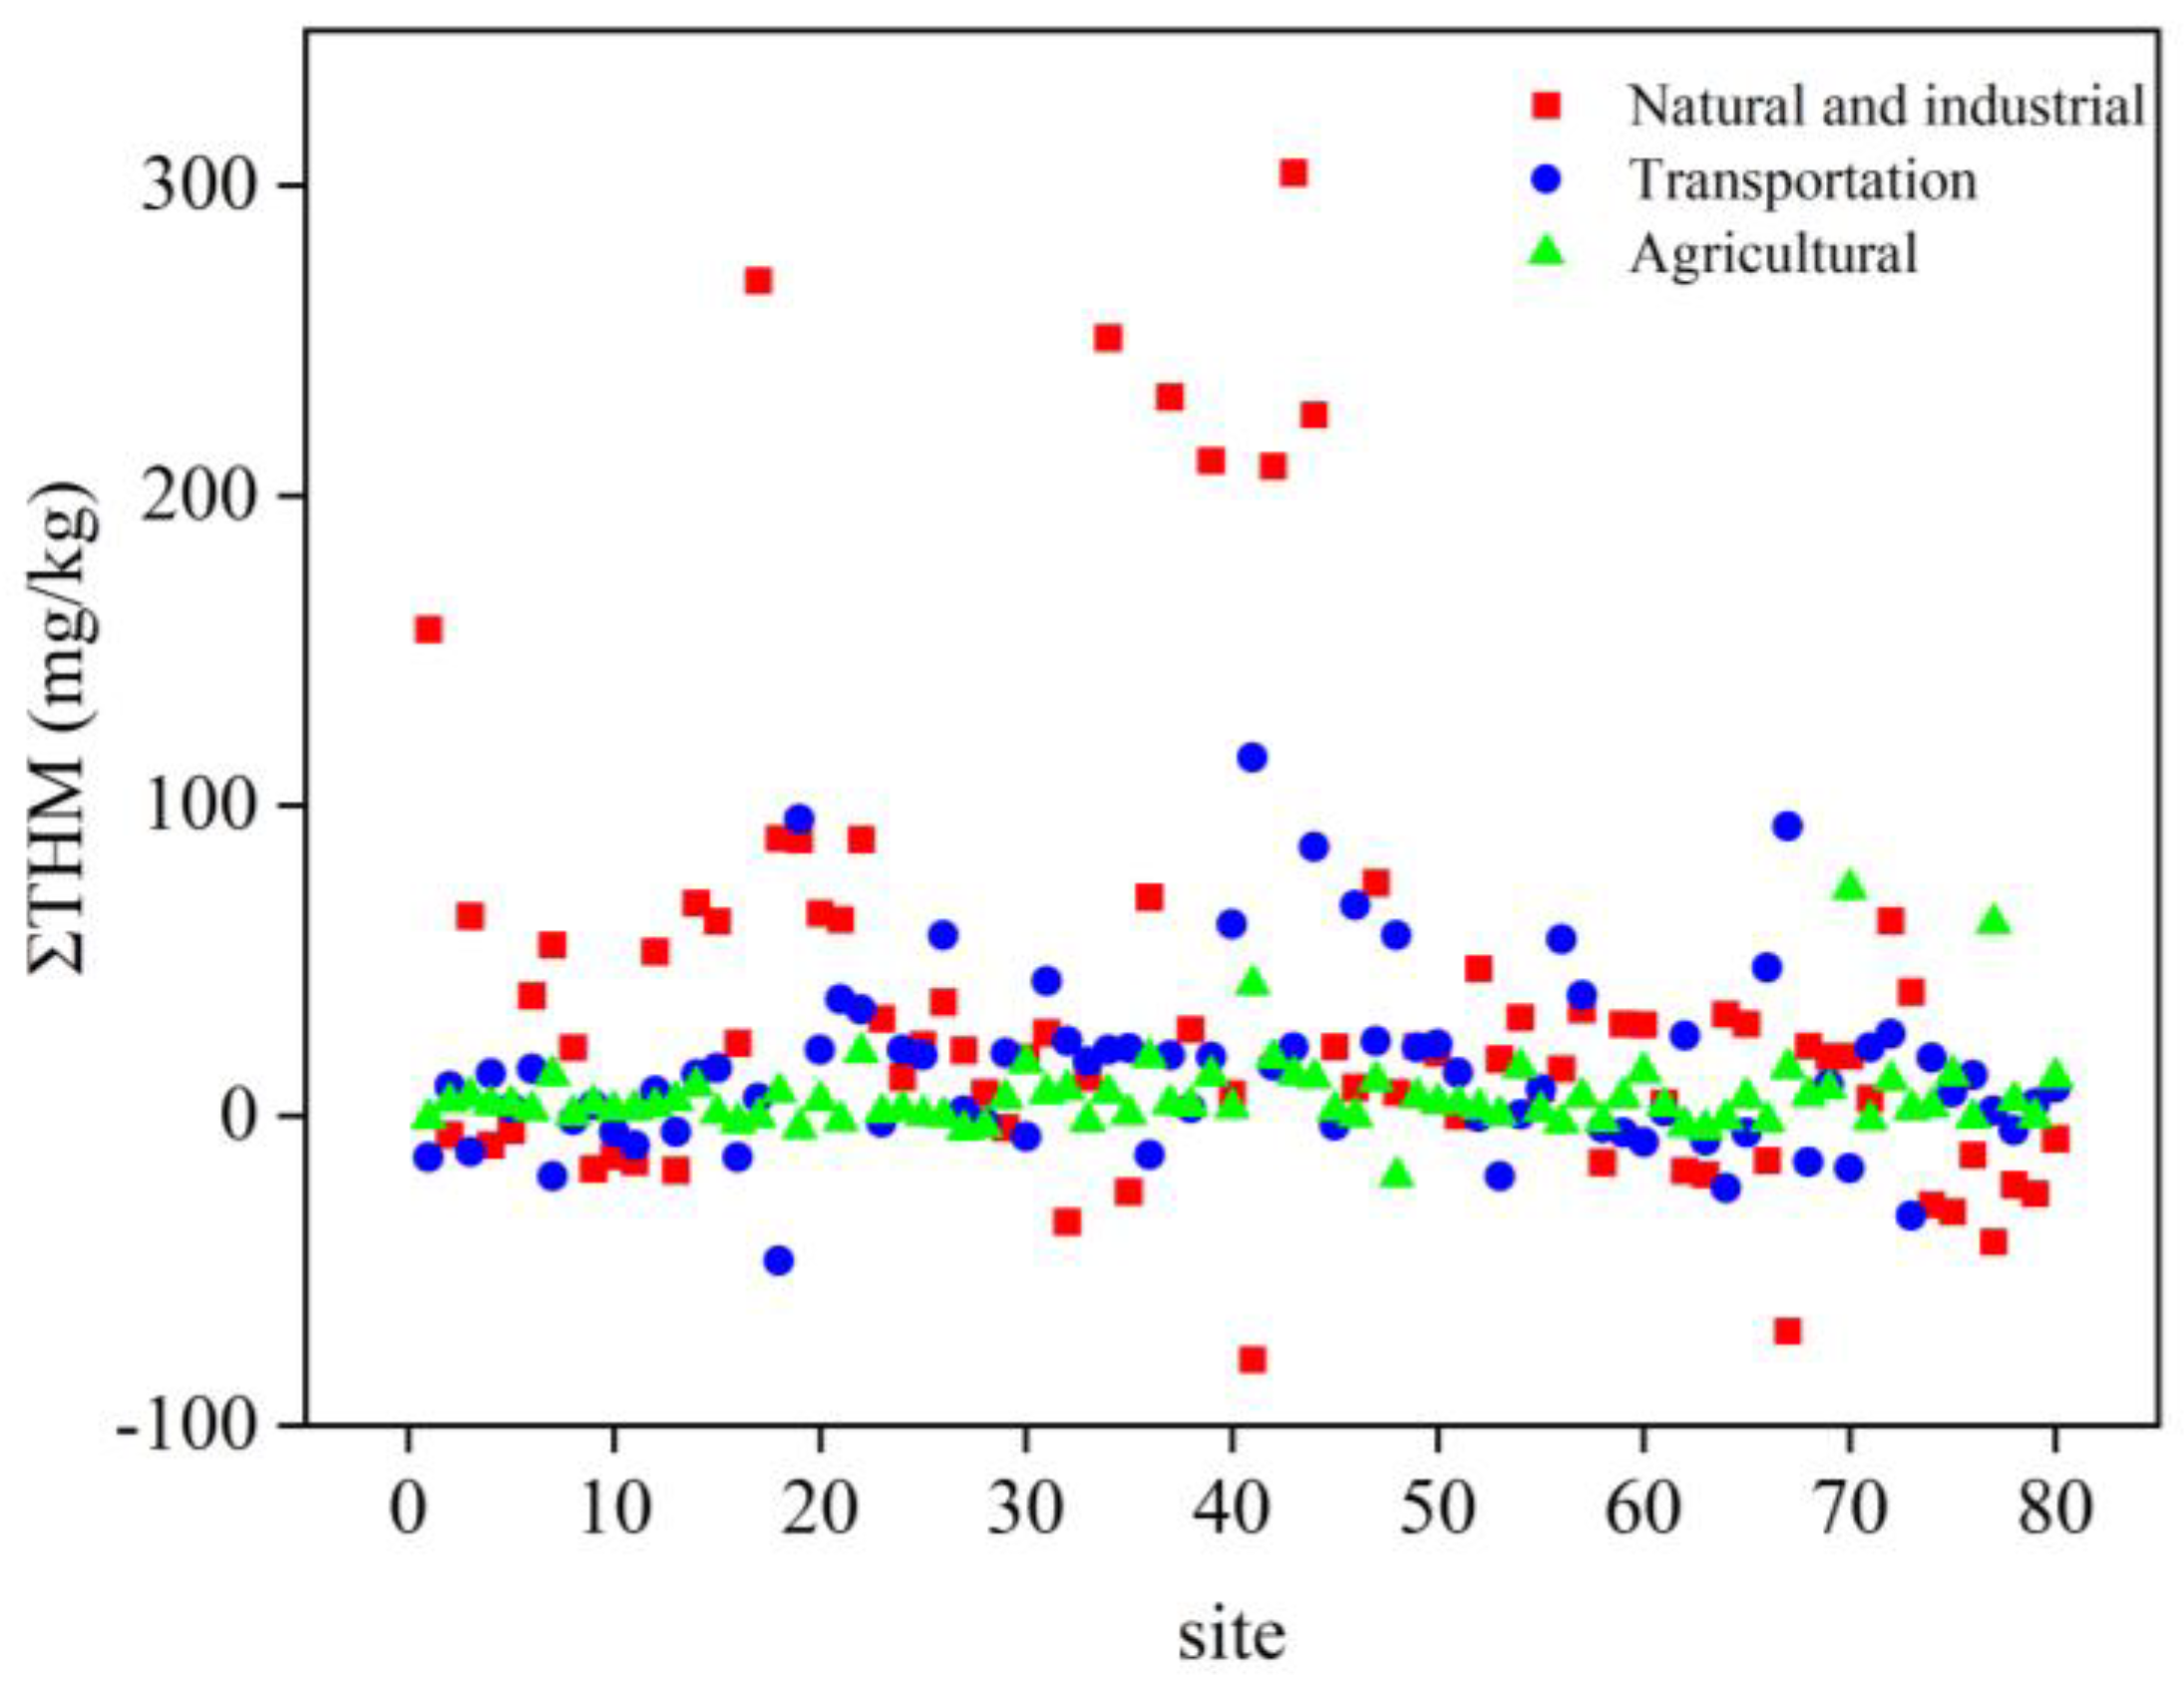
3.4. Source Apportionment of Soil HMs

3.4.1. Pearson Correlation Analysis

Pearson correlation analysis showed that the soil element contents of the ten HMs could be explained by natural and anthropogenic factors [33,34]. We could see that the correlation between different HMs in the soil were strong, but some were not obvious, indicating that the ten HMs are partly caused by natural conditions, and partly, as a preliminary speculation, by long-term human activities (Figure S1). The soil Cu content was found to be significantly positively correlated with Zn, Ni, and Cr (p < 0.01); Pb significantly positively correlated with Zn (p < 0.01); and Zn significantly positively correlated with Cu and Ni (p < 0.01). The soil As content had little relevance to the other nine types of HMs, indicating that it may have come from a different source.

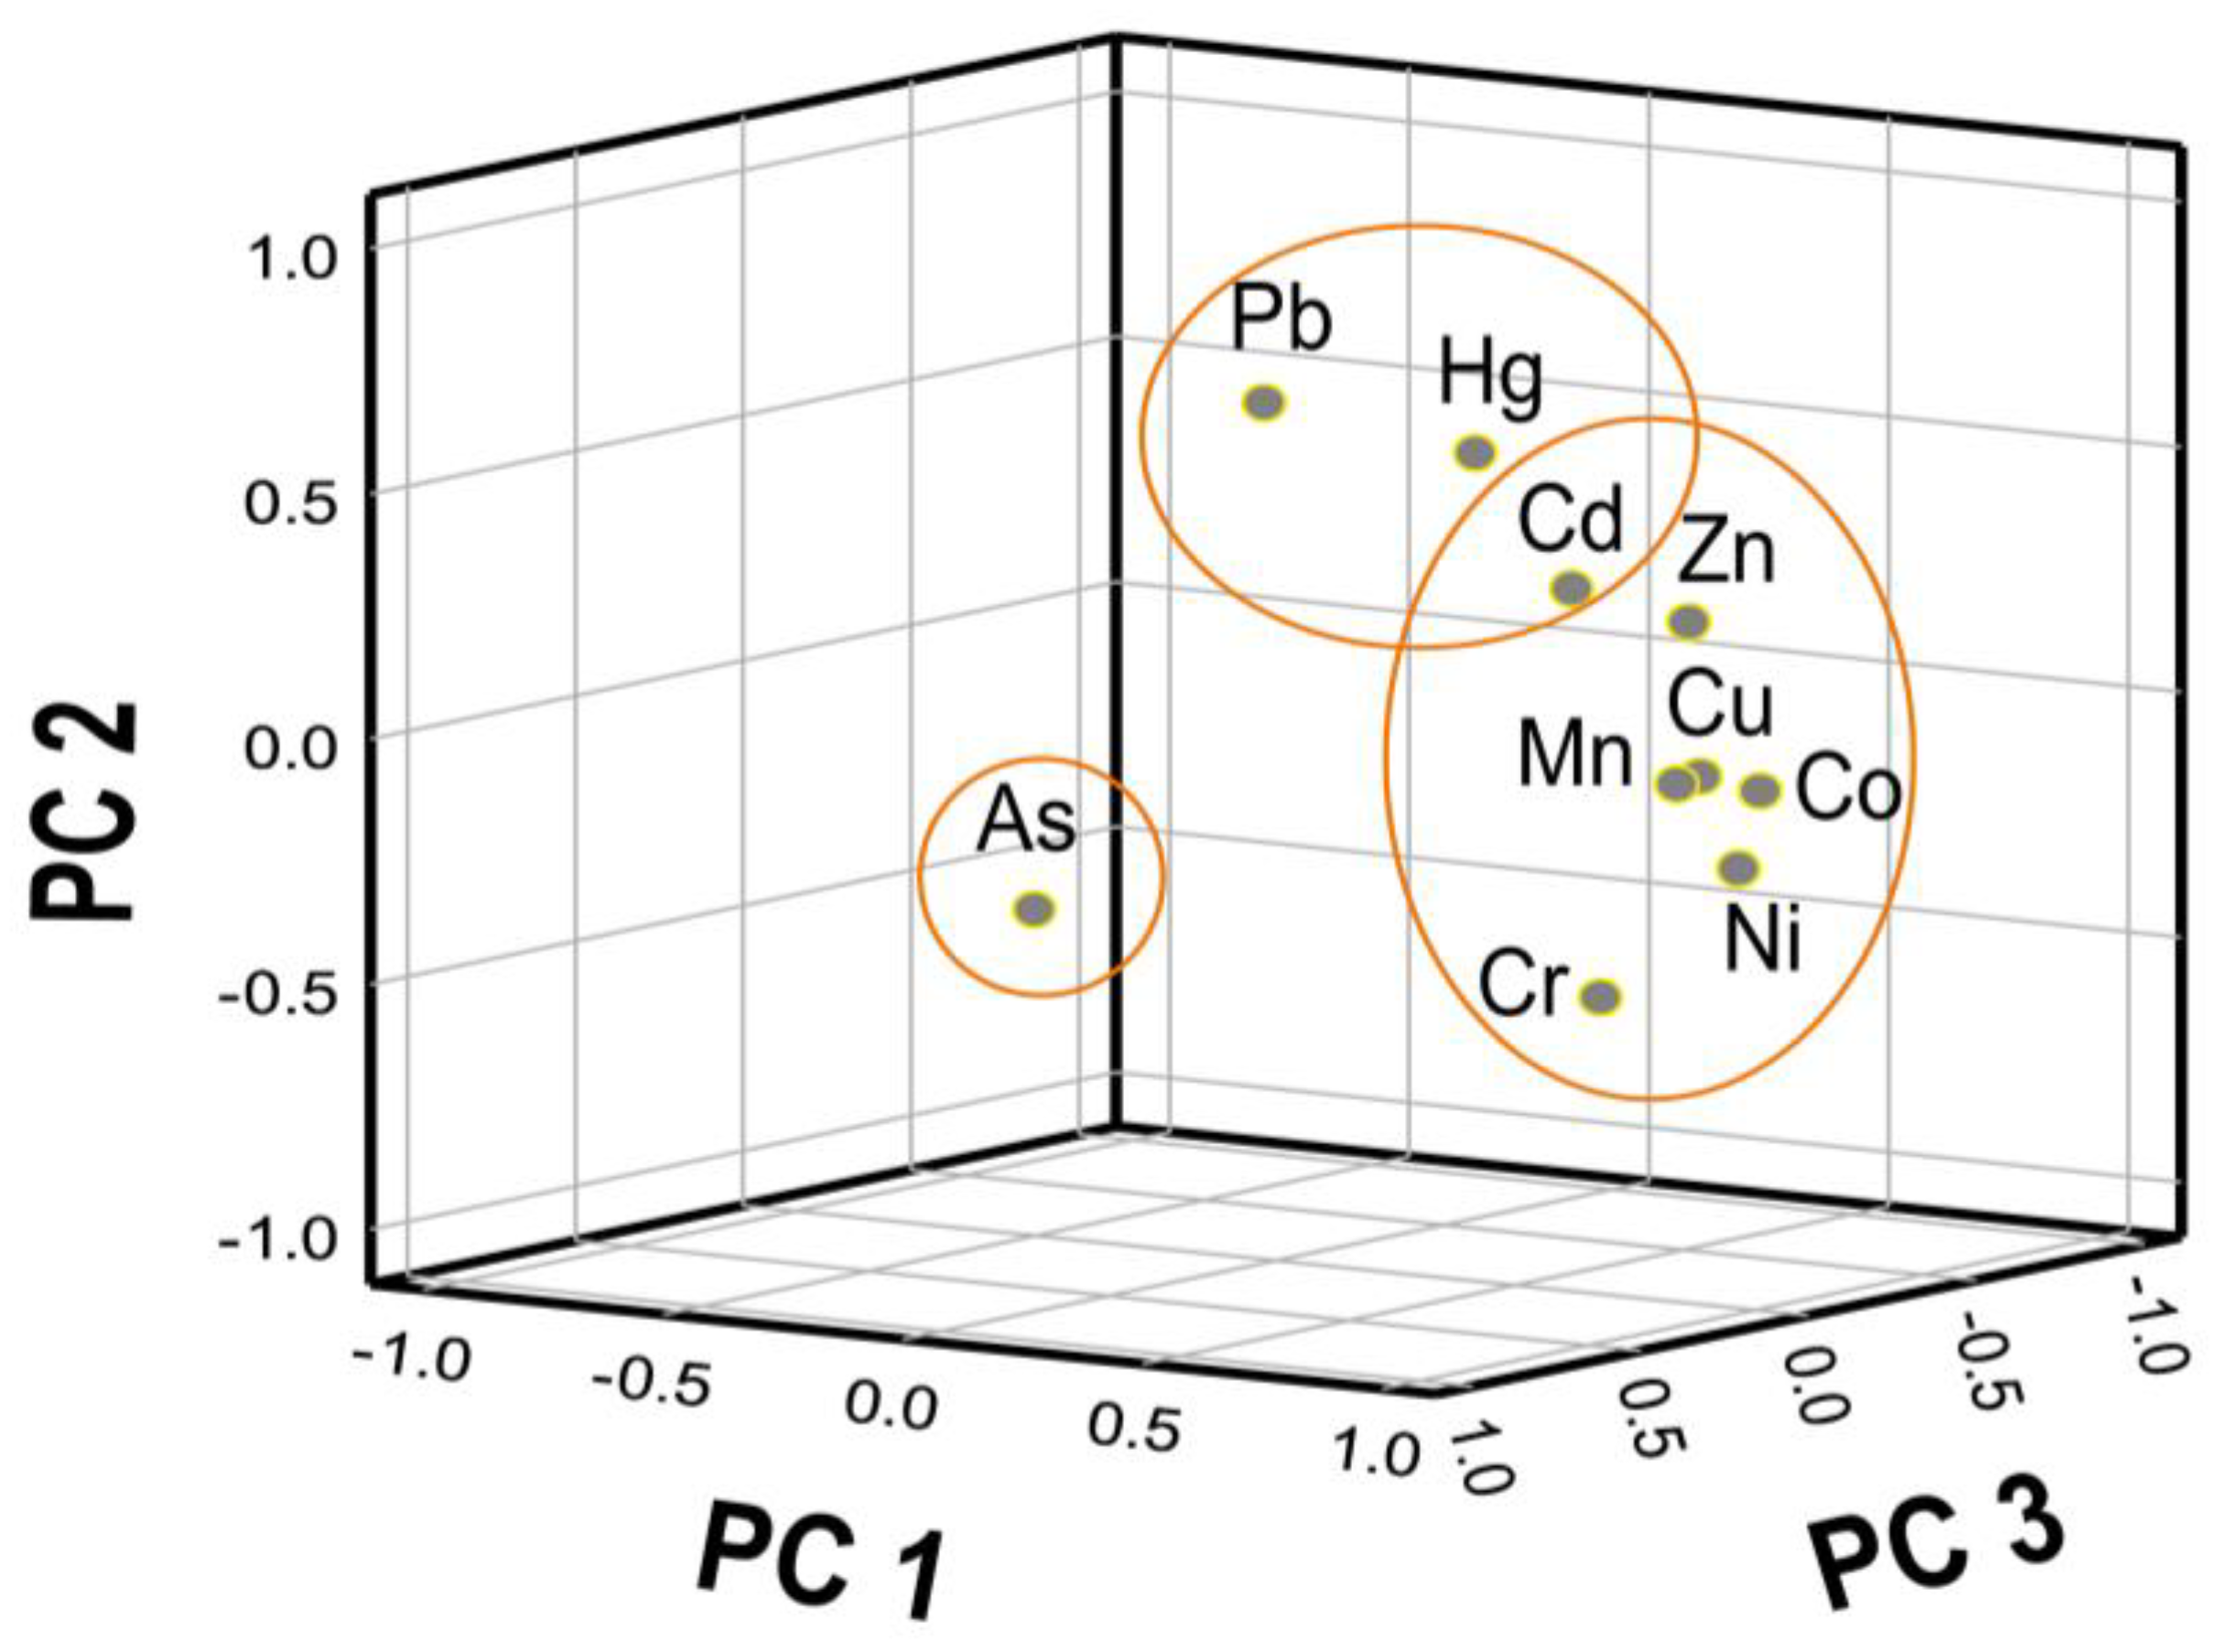
3.4.2. Source Apportionment by PCA-MLR Model

In order to further explore the sources of soil HMs in the PRD, principal component analysis (PCA) was used to reveal the potential relationships among different soil element contents. The Kaiser normalized orthogonal rotation method was used during the PCA analysis process, with Kaiser–Meyer–Olkin (KMO) (0.811 > 0.5) and Bartlett spherical tests (0.000 < 0.05) used. Three principal components whose eigenvalues were greater than 1 after rotation were obtained (Figure 5, Table S3). The results indicated that the PCA led to a reduction of the initial dimension of the dataset to three components, explaining 72.32% of the variation in the data, the largest apportion of these components. It could be seen from the factor load after rotation (Table S4) that the first principal component (PC1) was mainly composed of Cu, Zn, Ni, Cr, Co, Mn, and a small amount of Cd, which had a highly positive load on the first principal component, reaching values of 0.851, 0.704, 0.946, 0.782, 0.895, 0.824, and 0.405, respectively. As a result, we deduced that the first principal component could reflect the enrichment degree of soil Cu, Zn, Ni, Cr, Co, Mn, and Cd. The second principal component (PC2) was mainly composed of Pb, Hg, and a small amount of Zn, Cd, where the factor loads of Pb, Hg, Zn, Cd, reached 0.821, 0.623, 0.518, and 0.400, respectively. The third principal component (PC3) was composed of As, and the factor load was 0.929. The results obtained by the PCA analysis had confirmed the results from the Pearson correlation analysis in Section 3.4.1.
The source apportionment of HMs could be inferred by combining PCA analysis with the spatial distribution characteristics. PC1 reflected an enrichment of Cu, Zn, Ni, Cr, Co, Mn, and a small amount of Cd. Compared with the soil background values of the Guangdong province, the soil Cu, Zn, Ni, Cr, Co, and Mn contents were all slightly lower except for the soil Cd, indicating that these HMs mainly from natural sources, potentially through the slow mineral soil formation processes of the parent rock [35,36]. Granite was widely distributed in the PRD, leading to quaternary soil with loose accumulation [23]. Previous studies have shown that limestone and sand shale are Mn-rich parent rocks [37,38]. The specific humid climate conditions present in the PRD accelerate the weathering process of parent rocks, and thus HMs are easily released from this natural source. On the other hand, as industrial sources may also account for the presence of soil HMs, we collected the spatial distribution information of 1904 enterprises associated with the surface treatment of metals and manufacturing in the PRD (Figure S2), based on which the kernel density of these enterprises was expressed (Figure 6). This showed that the spatial distribution of enterprises associated with the surface treatment of metals and manufacturing, as well as their kernel density, was close to the Pearl River, leading to a potential accumulation site of soil HMs. Further, the spatial distribution patterns of soil Cu, Zn, Ni, Co, and Mn contents were highly correlated to the enterprises associated with the surface treatment of metals and manufacturing. It us suggested that these enterprises might be another important source apportionment of soil Cu, Zn, Ni, and Cr contents caused by atmospheric deposition [39,40]. Consequently, it is reasonable to conclude that PC1 was mainly a mixture of natural and industrial sources.
PC2 was predominated by Pb, Hg, Cd, and Zn. The soil Pb and Hg may be correlated to the developed transportation industry in the PRD, which is an important automobile exhaust and production center [41,42,43]. A certain amount of soil Pb and Cd may be the result of waste gas emissions from vehicles, as well as the combustion of Pb-containing gasoline [4]. However, Cd occupied a large load proportion in both PC1 and PC2, reaching values of 0.405 and 0.400, respectively, indicating that there exists other Cd sources aside from natural and industrial sources. The geo-accumulation index results showed that Cd, Hg, and Pb were the main contributors to soil pollution in the PRD. As mentioned above, soil Cd and Pb might mainly come from vehicle emissions, oil leakages, cement pavement wear, rubber tires, and brake pad wear [44,45]. The larger contribution of PC2 to Pb occurred in Guangzhou city, which has the most intensive population and traffic [46]. As a result, we deduced that PC2 was traffic sources.
PC3 was occupied primarily by As. The average soil As content was significantly higher than that of the background value. Previous studies have considered livestock manure and some phosphate fertilizers as potential soil As sources [47,48]. Inorganic As may originated from agricultural activities, such as fertilizers and pesticides [49,50]. Phosphorus fertilizer is a commonly used fertilizer for agricultural activity due to soil P deficiency under acidic conditions in the PRD, which leads to the enrichment of As in the soil [51]. As-containing pesticides and feed additives had been added to the farmland historically in the PRD [52,53,54,55], which has potentially created excess As accumulation [56]. Therefore, we deduced that PC3 was significantly correlated to agricultural activities (fertilizers, pesticides, and livestock).
Overall, the results of this study showed that soil Cu, Zn, Ni, Cr, Co, Mn, and some amounts of Cd could be derived from natural and industrial sources, while soil Pb, Hg, Cd, and Zn originated from traffic sources, with As primarily originating from agricultural sources. This is in agreement with the previous literature carried out at the county-level of the Guangdong province, where source appointment results showed that Pb, Zn, and Cu mainly originated from vehicle emissions and atmosphere deposition; Hg and Cd originated from industrial activities; Cr and Ni mainly came from soil parent materials; and As mainly originated from agricultural inputs [13]. Similarly, Soffianian et al. (2015) applied geostatistical methods and also determined the effect of agricultural activities on HM concentrations and the spatial distribution using the Geographical Information System (GIS). The results showed that As, Cd, Zn, and Pb had a geological or agricultural origin and that Cr, Co, Ni, and V originated from bedrocks [57].
In order to quantify the contributions of the various sources obtained by PCA in the PRD, mixed logistic regression (MLR) of the sources (natural, industrial, transportation, and agricultural activities) was performed using Equation (6) [58]. The calculation results are showed (Figure 7, Table S5). These indicated that the contribution ratios of four sources occurred in the following order: natural and industrial sources (64.33%) > transportation sources (24.80%) > agricultural sources (10.87%).
After, with the factor score variable as an independent variable and the standardized total HM contents as the dependent variable, Equation (7) was used (Table S6):
Z = 0.864 F S 1 + 0.333 F S 2 + 0.146 F S 3   ( R 2 = 0.88 )
where, Z is the total soil HM contents after data standardization and F S i is the factor score variables by source apportionment   i .
To further obtain the contribution of each sampling site to the soil HM contents, Equation (8) was used to quantitively evaluate the source apportionment contribution from sampling site i [59].
i = M e a n T H M ( B i B i ) + B i σ T H M F S i
where,   M e a n T H M is the total mean HM contents and σ T H M is standard deviation.
The contributions of 80 sampling sites from the four sources are shown (Figure 8, Table S7). The results suggest that the contributions of the different sampling sites to PC1 varied greatly, consequently suggesting that PC1 was attributed to by more than one source. This had again proved that PC1 has two different sources. However, no obvious fluctuations among different sampling sites occurred, suggesting that the sampling sites had contributed little to PC2 and PC3, indicating that just one source exists for both PC2 and PC3. This was consistent with the results of the source apportionment by the PCA-MLR model. It can be seen that the contribution of some individual sampling site appears to have a negative value, which is caused by nonnegativity restrictions in the solution process of the PCA-MLR model.

4. Conclusions

In this study, 80 surface soil samples were collected in the PRD to analyze HM contents as well as to trace possible HM sources through the use of the PCA-MLR model. The soil environmental quality in the PRD was found to be generally good, though slightly higher Pb, Cd, Hg, and As contents were found in the surface soil compared with the background values in the Guangdong province. For the spatial distribution of soil HMs in the PRD, soil Cu, Pb, Zn, and Ni contents were much higher in Guangzhou and southern Foshan city, while soil Cd, Cr, Hg, and As contents were distributed evenly in the whole of the PRD except for the relatively higher values that appeared in Guangzhou, Dongguan, Foshan, Zhaoqing, and Huizhou city. The PCA-MLR model indicated that the soil HMs in the PRD mainly come from four sources in the following order: natural and industrial sources (64.33%) > transportation sources (24.80%) > agricultural sources (10.87%). Soil contents of Cu, Zn, Ni, Cr, Co, Mn, and some Cd could be mainly explained by natural and industrial sources, whereas Pb, Hg, Cd, and Zn may originate from vehicles emissions, and As mainly originates from agricultural activities. This study provides basic information to environmental managers and policy-makers on how to control regional soil HM pollution risks. Further investigation is still needed to build an accurate relationship between soil HM pollution and the rapid economic development level in the PRD.

Supplementary Materials

The following are available online at https://www.mdpi.com/article/10.3390/su13179651/s1, Figure S1: Pearson correlation analysis of HMs in soil; Figure S2: Spatial distribution of 1904 enterprises associated with surface treatment of metals and manufacturing in the PRD; Table S1: Statistic description information of the quality control of soil HMs; Table S2: Geo-accumulation index and pollution levels; Table S3: Total variance of HMs explained by PCA; Table S4: Matrix of principal component analysis; Table S5: Contribution composition of soil HMs in the PRD; Table S6: The factor score variables of source i at 80 sampling sites; Table S7: Contributions of four sources in 80 sampling site.

Author Contributions

G.Y.: Investigation, Methodology, Writing—original draft preparation. H.Z.: Investigation, Methodology, Writing—original draft preparation. Z.C.: Investigation, Methodology. C.S.: Source apportionment; Z.H.: Writing—review and editing. X.C.: Data interpretation; Writing—review and editing. J.Q.: Methodology. T.W.: Conceptualization, Supervision, Writing—review and editing. All authors have read and agreed to the published version of the manuscript.

Funding

This work was financially supported by the National Key Research and Development Program of China (2018YFC1800304, 2018YFC1802803), the Science and Technology Project of Guangzhou City, China (202103000018), the Natural Science and Technology Project of Guangdong Province, China (2016A030313697), and the STU scientific research foundation for talents (NTF20001).

Institutional Review Board Statement

Not applicable.

Informed Consent Statement

Not applicable.

Data Availability Statement

The data supporting the reported results in the present study will be available on request from the corresponding author or the first author.

Conflicts of Interest

The authors declare no conflict of interest.

References

  1. Jacob, J.M.; Karthik, C.; Saratale, R.G.; Kumar, S.S.; Prabakar, D.; Kadirvelu, K.; Arivalagan, P. Biological approaches to tackle heavy metal pollution: A survey of literature. J. Environ. Manag. 2018, 217, 56–70. [Google Scholar] [CrossRef]
  2. Liu, W.; Wang, J.; Zhang, C. Evaluation of soil chemical properties and actinomycete community structure following a temporal sequence of revegetation through Paulownia Fortunei in the heavy metal–contaminated soil. Water Air Soil Pollut. 2013, 224, 1730. [Google Scholar] [CrossRef]
  3. Negahban, S.; Mokarram, M.; Pourghasemi, H.R.; Zhang, H.C. Ecological risk potential assessment of heavy metal contaminated soils in Ophiolitic formations. Environ. Res. 2021, 192, 110305. [Google Scholar] [CrossRef]
  4. Yang, Q.; Li, Z.; Lu, X.; Duan, Q.; Huang, L.; Bi, J. A review of soil heavy metal pollution from industrial and agricultural regions in China: Pollution and risk assessment. Sci. Total Environ. 2018, 642, 690–700. [Google Scholar] [CrossRef]
  5. Buaisha, M.; Balku, S.; Ozalp-Yaman, S. Heavy metal removal investigation in conventional activated sludge systems. Civil Eng. J. 2020, 6, 470–477. [Google Scholar] [CrossRef] [Green Version]
  6. Vatanpour, N.; Feizy, J.; Talouki, H.H.; Es’haghi, Z.; Scesi, L.; Malvandi, A.M. The high levels of heavy metal accumulation in cultivated rice from the Tajan river basin: Health and ecological risk assessment. Chemosphere 2020, 245, 125639. [Google Scholar] [CrossRef] [PubMed]
  7. Wu, W.; Wu, P.; Yang, F.; Sun, D.L.; Zhang, D.X.; Zhou, Y.K. Assessment of heavy metal pollution and human health risks in urban soils around an electronics manufacturing facility. Sci. Total Environ. 2018, 630, 53–61. [Google Scholar] [CrossRef] [PubMed]
  8. Alexakis, D. Human health risk assessment associated with Co, Cr, Mn, Ni and V contents in agricultural soils from a Mediterranean site. Arch. Agron. Soil Sci. 2016, 62, 359–373. [Google Scholar] [CrossRef]
  9. Zoni, S.; Lucchini, R.G. Manganese exposure: Cognitive, motor and behavioral effects on children: A review of recent findings. Curr. Opin. Pediatr. 2013, 25, 255–260. [Google Scholar] [CrossRef] [Green Version]
  10. Jiang, J.; Lu, S.; Zhang, H.; Liu, G.; Lin, K.; Huang, W.; Luo, R.; Zhang, X.; Tang, C.; Yu, Y. Dietary intake of human essential elements from a Total Diet Study in Shenzhen, Guangdong Province, China. J. Food Compos. Anal. 2015, 39, 1–7. [Google Scholar] [CrossRef]
  11. Saeedi, M.; Hosseinzadeh, M.; Jamshidi, A.; Pajooheshfar, S.P. Assessment of heavy metals contamination and leaching characteristics in highway side soils, Iran. Environ. Monit. Assess. 2009, 151, 231–241. [Google Scholar] [CrossRef] [PubMed]
  12. Obeng-Gyasi, E.; Roostaei, J.; Gibson, J.M. Lead Distribution in urban soil in a medium-sized city: Household scale analysis. Environ. Sci. Technol. 2021, 55, 3696–3705. [Google Scholar] [CrossRef] [PubMed]
  13. Wang, S.; Cai, L.M.; Wen, H.H.; Luo, J.; Wang, Q.S.; Liu, X. Spatial distribution and source apportionment of heavy metals in soil from a typical county-level city of Guangdong Province, China. Sci. Total Environ. 2019, 655, 92–101. [Google Scholar] [CrossRef] [PubMed]
  14. Hu, Y.; Liu, X.; Bai, J.; Shih, K.; Zeng, E.Y.; Cheng, H. Assessing heavy metal pollution in the surface soils of a region that had undergone three decades of intense industrialization and urbanization. Environ. Sci. Pollut. Res. 2013, 20, 6150–6159. [Google Scholar] [CrossRef]
  15. Mazurek, R.; Kowalska, J.; Gasiorek, M.; Zadrozny, P.; Jozefowska, A.; Zaleski, T.; Kepka, W.; Tymczuk, M.; Orlowska, K. Assessment of heavy metals contamination in surface layers of Roztocze National Park forest soils (SE Poland) by indices of pollution. Chemosphere 2017, 168, 839–850. [Google Scholar] [CrossRef]
  16. Shi, G.L.; Zeng, F.; Li, X.; Feng, Y.C.; Wang, Y.Q.; Liu, G.X.; Zhu, T. Estimated contributions and uncertainties of PCA/MLR-CMB results: Source apportionment for synthetic and ambient datasets. Atmos. Environ. 2011, 45, 2811–2819. [Google Scholar] [CrossRef]
  17. Li, A.; Jang, J.K.; Scheff, P.A. Application of EPA CMB8.2 model for source apportionment of sediment PAHs in Lake Calumet, Chicago. Environ. Sci. Technol. 2003, 37, 2958–2965. [Google Scholar] [CrossRef]
  18. Paatero, P.; Tapper, U. Positive matrix factorization: A non-negative factor model with optimal utilization of error estimates of data values. Environmetrics 1994, 5, 111–126. [Google Scholar] [CrossRef]
  19. Sahu, M.; Hu, S.; Ryan, P.H.; Masters, G.L.; Grinshpun, S.A.; Chow, J.C.; Biswas, P. Chemical compositions and source identification of PM2.5 aerosols for estimation of a diesel source surrogate. Sci. Total Environ. 2011, 409, 2642–2651. [Google Scholar] [CrossRef]
  20. Salim, I.; Sajjad, R.U.; Paule-Mercado, M.C.; Memon, S.A.; Lee, B.Y.; Sukhbaatar, C.; Lee, C.H. Comparison of two receptor models PCA-MLR and PMF for source identification and apportionment of pollution carried by runoff from catchment and sub-watershed areas with mixed land cover in South Korea. Sci. Total Environ. 2019, 663, 764–775. [Google Scholar] [CrossRef]
  21. Huang, G.; Sun, J.; Zhang, Y.; Jing, J.; Zhang, Y.; Liu, J. Distribution of Arsenic in Sewage Irrigation Area of Pearl River Delta, China. J. Earth Sci. 2011, 22, 396–410. [Google Scholar] [CrossRef]
  22. Hou, Q.Y.; Yang, Z.F.; Yu, T.; You, Y.H.; Dou, L.; Li, K. Impacts of parent material on distributions of potentially toxic elements in soils from Pearl River Delta in South China. Sci. Rep. 2020, 10, 17394. [Google Scholar] [CrossRef]
  23. Lan, H.X.; Hu, R.L.; Yue, Z.Q.; Lee, C.F.; Wang, S.J. Engineering and Geological Characteristics of Granite Weathering Profiles in South China. J. Asian Earth Sci. 2003, 21, 353–364. [Google Scholar] [CrossRef]
  24. Xiao, Q.; Zong, Y.T.; Lu, S.G. Assessment of heavy metal pollution and human health risk in urban soils of steel industrial city (Anshan), Liaoning, Northeast China. Ecotoxicol. Environ. Saf. 2015, 120, 377–385. [Google Scholar]
  25. Zhang, S.; Yang, G.; Luo, G.; Guo, S. Changes of Background Values of Inorganic Elements in Soils of Guangdong Province. Soils 2012, 44, 1009–1014. [Google Scholar]
  26. Iakovides, M.; Iakovides, G.; Stephanou, E.G. Atmospheric particle-bound polycyclic aromatic hydrocarbons, n-alkanes, hopanes, steranes and trace metals: PM2.5 source identification, individual and cumulative multi-pathway lifetime cancer risk assessment in the urban environment. Sci. Total Environ. 2021, 752, 141834. [Google Scholar] [CrossRef]
  27. Wu, H.; Xu, C.; Wang, J.; Xiang, Y.; Ren, M.; Qie, H.; Zhang, Y.; Yao, R.; Li, L.; Lin, A. Health risk assessment based on source identification of heavy metals: A case study of Beiyun River, China. Ecotoxicol. Environ. Saf. 2021, 213, 112046. [Google Scholar] [CrossRef]
  28. Soil Environmental Quality-Risk Control Standard for Soil Contamination of Agricultural Land. Available online: http://www.mee.gov.cn/ywgz/fgbz/bz/bzwb/trhj/201807/t20180703_446029.shtml (accessed on 1 August 2018).
  29. Wang, M.X.; Liang, L.N.; Siu, W.S.; Fan, D.; Sun, H.R.; Zhao, H.H.; Zhou, G.J.; Wu, W.J. Loss accounting of environmental pollution within Pearl River Delta region, South China. Environ. Pollut. 2019, 249, 676–685. [Google Scholar] [CrossRef]
  30. Ma, L.; Wang, L.; Jia, Y.; Yang, Z. Arsenic speciation in locally grown rice grains from Hunan Province, China: Spatial distribution and potential health risk. Sci. Total Environ. 2016, 557, 438–444. [Google Scholar] [CrossRef]
  31. Lv, J.; Liu, Y.; Zhang, Z.; Dai, J. Factorial kriging and stepwise regression approach to identify environmental factors influencing spatial multi-scale variability of heavy metals in soils. J. Hazard. Mater. 2013, 261, 387–397. [Google Scholar] [CrossRef]
  32. Chen, T.Y.; Zhao, H.F.; Wu, K.N.; Zhang, Z.; Jin, Q.; Liu, S.; Li, L.H. Distributional Characteristics and Source Identification of Cadmium in Soils of the Pearl River Delta, China. Bull. Environ. Contam. Toxicol. 2021, 106, 75–85. [Google Scholar] [CrossRef] [PubMed]
  33. Oral, R.; Pagano, G.; Siciliano, A.; Toscanesi, M.; Gravina, M.; Di Nunzio, A.; Palumbo, A.; Thomas, P.J.; Tommasi, F.; Buric, P.; et al. Soil pollution and toxicity in an area affected by emissions from a bauxite processing plant and a power plant in Gardanne (southern France). Ecotoxicol. Environ. Saf. 2019, 170, 55–61. [Google Scholar] [CrossRef] [PubMed]
  34. Katsoyiannis, I.A.; Katsoyiannis, A.A. Arsenic and other metal contamination of groundwaters in the industrial area of Thessaloniki, Northern Greece. Environ. Monit. Assess. 2006, 123, 393–406. [Google Scholar] [CrossRef] [PubMed]
  35. Zhang, H.H.; Yuan, H.X.; Hu, Y.G.; Wu, Z.F.; Zhu, L.A.; Zhu, L.; Li, F.B.; Li, D.Q. Spatial distribution and vertical variation of arsenic in Guangdong soil profiles, China. Environ. Pollut. 2006, 144, 492–499. [Google Scholar] [CrossRef]
  36. Acosta, J.A.; Martinez-Martinez, S.; Faz, A.; Arocena, J. Accumulations of major and trace elements in particle size fractions of soils on eight different parent materials. Geoderma 2011, 161, 30–42. [Google Scholar] [CrossRef]
  37. Zhuo, X.Z.; Niu, B.X.; Ju, Y.W.; Zhang, L.Y.; Yan, Q.H.; Yang, J.L. Nanopore Formation and Structural Changes in Black Shale During the Initial Weathering Stage: A Longmaxi Formation Profile in Northwestern Hunan, China. J. Nanosci. Nanotechnol. 2021, 21, 195–211. [Google Scholar] [CrossRef]
  38. Scopelliti, G.; Russo, V. Petrographic and geochemical characterization of the Middle-Upper Jurassic Fe-Mn crusts and mineralizations from Monte Inici (north-western Sicily): Genetic implications. Int. J. Earth Sci. 2021, 110, 559–582. [Google Scholar] [CrossRef]
  39. Hernandez, L.; Probst, A.; Probst, J.L.; Ulrich, E. Heavy metal distribution in some French forest soils: Evidence for atmospheric contamination. Sci. Total Environ. 2003, 312, 195–219. [Google Scholar] [CrossRef] [Green Version]
  40. Avino, P.; Capannesi, G.; Rosada, A. Heavy metal determination in atmospheric particulate matter by instrumental neutron activation analysis. Microchem. J. 2008, 88, 97–106. [Google Scholar] [CrossRef]
  41. Guo, W.; Zhang, H.; Cui, S.; Xu, Q.; Tang, Z.; Gao, F. Assessment of the distribution and risks of organochlorine pesticides in core sediments from areas of different human activity on Lake Baiyangdian, China. Stoch. Environ. Res. Risk Assess. 2014, 28, 1035–1044. [Google Scholar] [CrossRef]
  42. Cui, Z.; Wang, Y.; Zhao, N.; Yu, R.; Xu, G.; Yu, Y. Spatial Distribution and Risk Assessment of Heavy Metals in Paddy Soils of Yongshuyu Irrigation Area from Songhua River Basin, Northeast China. Chin. Geogr. Sci. 2018, 28, 797–809. [Google Scholar] [CrossRef] [Green Version]
  43. Li, H.; Li, Y.; Lee, M.K.; Liu, Z.; Miao, C. Spatiotemporal Analysis of Heavy Metal Water Pollution in Transitional China. Sustainability 2015, 7, 9067–9087. [Google Scholar] [CrossRef] [Green Version]
  44. Zhang, X.Y.; Lin, F.F.; Wong, M.T.F.; Feng, X.L.; Wang, K. Identification of soil heavy metal sources from anthropogenic activities and pollution assessment of Fuyang County, China. Environ. Monit. Assess. 2009, 154, 439–449. [Google Scholar] [CrossRef] [PubMed]
  45. Dietrich, M.; Huling, J.; Krekeler, M.P.S. Metal pollution investigation of Goldman Park, Middletown Ohio: Evidence for steel and coal pollution in a high child use setting. Sci. Total Environ. 2018, 618, 1350–1362. [Google Scholar] [CrossRef]
  46. Sun, X.F.; Zhang, L.X.; Lv, J.S. Spatial assessment models to evaluate human health risk associated to soil potentially toxic elements. Environ. Pollut. 2021, 268, 10. [Google Scholar] [CrossRef] [PubMed]
  47. Mico, C.; Recatala, L.; Peris, A.; Sanchez, J. Assessing heavy metal sources in agricultural soils of an European Mediterranean area by multivariate analysis. Chemosphere 2006, 65, 863–872. [Google Scholar] [CrossRef]
  48. Cai, L.; Huang, L.; Zhou, Y.; Xu, Z.; Peng, X.; Yao, L.; Zhou, Y.; Peng, P. Heavy metal concentrations of agricultural soils and vegetables from Dongguan, Guangdong. J. Geog. Sci. 2010, 20, 121–134. [Google Scholar] [CrossRef]
  49. Hu, Y.; Cheng, H. Application of Stochastic Models in Identification and Apportionment of Heavy Metal Pollution Sources in the Surface Soils of a Large-Scale Region. Environ. Sci. Technol. 2013, 47, 3752–3760. [Google Scholar] [CrossRef] [PubMed]
  50. Smedley, P.L.; Kinniburgh, D.G. A review of the source, behaviour and distribution of arsenic in natural waters. Appl. Geochem. 2002, 17, 517–568. [Google Scholar] [CrossRef] [Green Version]
  51. Liang, J.; Hua, S.; Zeng, G.; Yuan, Y.; Lai, X.; Li, X.; Li, F.; Wu, H.; Huang, L.; Yu, X. Application of weight method based on canonical correspondence analysis for assessment of Anatidae habitat suitability: A case study in East Dongting Lake, Middle China. Ecol. Eng. 2015, 77, 119–126. [Google Scholar] [CrossRef]
  52. Hughes, M.F.; Beck, B.D.; Chen, Y.; Lewis, A.S.; Thomas, D.J. Arsenic Exposure and Toxicology: A Historical Perspective. Toxicol. Sci. 2011, 123, 305–332. [Google Scholar] [CrossRef] [Green Version]
  53. Hu, Y.; Cheng, H.; Tao, S.; Schnoor, J.L. China’s Ban on Phenylarsonic Feed Additives, A Major Step toward Reducing the Human and Ecosystem Health Risk from Arsenic. Environ. Sci. Technol. 2019, 53, 12177–12187. [Google Scholar] [CrossRef] [PubMed]
  54. Zhao, W.; Cheng, H.; Taos, S. Structure-Reactivity Relationships in the Adsorption and Degradation of Substituted Phenylarsonic Acids on Birnessite (delta-MnO2). Environ. Sci. Technol. 2020, 54, 1475–1483. [Google Scholar] [CrossRef]
  55. Hu, Y.; He, K.; Sun, Z.; Chen, G.; Cheng, H. Quantitative source apportionment of heavy metal(loid)s in the agricultural soils of an industrializing region and associated model uncertainty. J. Hazard. Mater. 2020, 391, 122244. [Google Scholar]
  56. Zhang, X.; Wei, S.; Sun, Q.; Wadood, S.A.; Guo, B. Source identification and spatial distribution of arsenic and heavy metals in agricultural soil around Hunan industrial estate by positive matrix factorization model, principle components analysis and geo statistical analysis. Ecotoxicol. Environ. Saf. 2018, 159, 354–362. [Google Scholar] [CrossRef] [PubMed]
  57. Soffianian, A.R.; Bakir, H.B.; Khodakarami, L. Evaluation of heavy metals concentration in soil using GIS, RS and Geostatistics. IOSR 2015, 9, 61–75. [Google Scholar]
  58. Yang, Y.; Christakos, G.; Guo, M.W.; Xiao, L.; Huang, W. Space-time quantitative source apportionment of soil heavy metal concentration increments. Environ. Pollut. 2017, 223, 560–566. [Google Scholar] [CrossRef] [PubMed]
  59. Larsen, R.K.; Baker, J.E. Source apportionment of polycyclic aromatic hydrocarbons in the urban atmosphere: A comparison of three methods. Environ. Sci. Technol. 2003, 37, 1873–1881. [Google Scholar] [CrossRef] [PubMed]
Figure 1. Knowledge map of hotspot clustering of soil pollutant research.
Sustainability 13 09651 g001
Figure 2. Spatial distribution of the soil sampling site in the PRD.
Sustainability 13 09651 g002
Figure 3. Evaluation of pollution and distribution of soil HMs in the PRD.
Sustainability 13 09651 g003
Figure 4. Spatial distribution of soil HMs in the PRD.
Sustainability 13 09651 g004aSustainability 13 09651 g004b
Figure 5. Principal component analysis of the spatial scatter of soil HMs in the PRD.
Sustainability 13 09651 g005
Figure 6. Kernel density of enterprises associated with the surface treatment of metals and manufacturing in the PRD.
Sustainability 13 09651 g006
Figure 7. Contribution composition of soil HMs in the PRD.
Sustainability 13 09651 g007
Figure 8. Contributions of the four sources in 80 sampling sites from the PRD.
Sustainability 13 09651 g008
Table 1. Descriptive statistics of HM contents (mg/kg) in soils from the PRD.
HMsMinMaxMeanSDSkewnessKurtosisCV (%)Background Value [25]
Cu1.0072.0016.4515.711.793.000.9617.0
Pb3.00235.0040.2035.723.2314.070.8936.0
Zn8.50169.0045.1032.281.472.160.7247.3
Cd0.00081.130.090.164.8728.131.720.056
Ni1.0050.0012.9310.561.782.920.8214.4
Cr6.70141.6047.9329.940.850.360.6250.5
Hg0.020.950.130.152.9811.811.100.078
As1.24102.7014.4415.783.8618.521.098.9
Co0.4226.005.685.241.813.440.927.0
Mn21.001010.00199.66197.692.104.380.99279
pH4.28.35.240.801.542.670.15-
Min: minimum; Max: maximum; SD: standard deviation; CV: coefficient of variation.
Publisher’s Note: MDPI stays neutral with regard to jurisdictional claims in published maps and institutional affiliations.

